СТРАТЕГИЈЕ ИНВЕСТИРАЊА НАцИоНАлНИх фоНдоВА …
TRANSCRIPT

ЕКОНОМИКА Vol. 64, october-december 2018, № 4ISSN 0350-137X, EISSN 2334-9190, UDK 338 (497,1)
121 ©Друштво економиста “Економика” Нишhttp://www.ekonomika.org.rs
Đorđe Ćuzović1
High School of Business, Novi Sad
SOVEREIGN WEALTH FUNDS INVESTMENT STRATEGIES
Abstract
Sovereign Wealth Fund (SWFs) is important participant in global financial market. Although they were arisen more than fifty years ago, in the theory they have not been explored. In the literature, there is no relevant theoretical and empirical material on the basis of which we can make reliable economic objectification of financial assets available to SWFs, and even more difficult to realize their investment objectives and strategy. There are relatively few comparable data on their assets, investment strategy and management, indicating a lack of transparency of SWFs. It has prompted us, referring to the available contemporary theory and practice of progressive developed countries, to study the structure of the investment portfolio, investment models, countries and companies invested by SWFs. In the paper, we are looking for an answer to the question: Can SWFs in the global economic and financial crisis significantly mitigate its consequences? The results of the research we will test on the most developed SWFs.
Key words: Sovereign Wealth Funds (SWF), investment strategy, investment portfolio, investment models
JEL classification: G23
СТРАТЕГИЈЕ ИНВЕСТИРАЊА НАцИоНАлНИх фоНдоВА боГАТСТВА
Апстракт
Национални фондови богатства (ФНБ), су важан учесник на глобалном финансијском тржишту. Иако су настали и почели да функцонишу, пре више од педесет година у теорији нису довољно истражени.У литератури не постоји релевантна теоријско-емпиријска грађа на основу које можемо из-вршити поуздану економску објективизацију финансијских средстава којима располажу ФНБ, а још је теже спознати њихову стратегију и циљеве инвес-тирања. Постоји релативно мало упоредивих података о њиховој активи, инвестиционој стратегији и управљању, што указује на недовољну транс-парентност пословања ФНБ. То нас је подстакло да с позивом на доступну савремену теорију и прогресивну праксу развијених земаља, сагледамо струк-туру инвестиционог портфолиа, моделе инвестирања, земље и компаније у које ФНБ инвестирају. У раду ћемо потражити и одговор на питање:да ли
SCIENTIFIC REVIEW ARTICLEdoi:10.5937/ekonomika1804119C
Received: May, 15, 2018Accepted: November, 05, 2018
P. 121-134

©Друштво економиста “Економика” Ниш http://www.ekonomika.org.rs
122 ЕКОНОМИКА
ФНБ у условима глобалне економске и финансијке кризе могу допринети уб-лажавањуњених последица. Добијене резултате истраживања тестираће-мо на примеру најразвијенијих ФНБ.
Кључне речи: Национални фондови богатства (ФНБ), стратегија инвес-тирања, инвестициони портфолио, модели инвестирања
Introduction
Although the Sovereign Wealth Funds (SWF), the National Wealth Funds Fund (SWF), originated and began to function more than fifty years ago, in theory they have not been sufficiently explored. There are relatively few comparable data on SWF, and not standardized practice of publishing information on their assets, investment strategy and management, which undermines the insufficient transparency of SWF’s business. In the literature, there is no relevant statistical-empirical material on the basis of which we can execute a reliable economic objectification of the financial assets (assets) held by SWF. SWF countries are economically rich, earning high prices for oil and other strategic raw materials and products. The increase of the SWF from the end of the 20th and the beginning of the 21st is related to the accumulation of excess foreign currency reserves of developing countries, new global financial players (Washington Post, 2007, p.A20). Although they are still a category with a number of unknowns, the literature agrees that SWF serves to stabilize government revenues and export revenues, and aim to accumulate savings, as resources obtained through the sale of natural resources are not recovering and may disappear after a certain amount of time Davis, Ossowski, Daniel, Barnett, 2001). Global financial market analysts believe that SWF through a reverse investment strategy can contribute to the stabilization of the global financial imbalance. Therefore, they propose a diversification of the portfolio outside government bonds in US dollars, which have largely invested a large amount of traditional reserves up to now. However, such a diversified portfolio raises the question: Can SWF deform the value of assets through non-commercial buying and selling of HoVs (Davis, Ossowski, Daniel, Barnett, 2001). According to the International Monetary Fund (IMF), 2008, FNB controlled $ 3 trillion in assets (Johnson, 2007), and is expected to grow to 15 trillion by 2015 (Jan, 2007b).
In 2009, The Institute of SWF published a list of 52 funds, and in 2012 there were 66. It is estimated that 12 out of 66 SWF have over $ 100 billion in assets. Thus, the largest Norway Government Pension Fund Global has assets of $ 664.3 billion (Sovereign Wealth Fund Institute, 2012). The second is Abu Dhabi Investment Authority (ADIA), which has $ 627 billion (Sovereign Wealth Fund Institute, 2012b). Of the ten largest ones, five are commodity funds (for oil) and five are non-profitable. The three non-core are based in China (including the Hong Kong Monetary Authority Investment Portfolio) and two in Singapore, which is the ninth largest SWF in the world with assets of $ 157.5 billion (Sovereign Wealth Fund Institute, 2012). Out of the aforementioned 66, six are from the USA, and the largest is the Alaska Permanent Fund, which is at the 21st largest (Sovereign Wealth Fund Institute, 2012). Based on these data, it can be concluded that SWF represents one of the most burdensome financial institutions in

123 ЕКОНОМИКА
©Друштво економиста “Економика” Ниш http://www.ekonomika.org.rs
ЕКОНОМИКА
the global financial market, whose market recognition is related to the accumulation of surplus foreign exchange reserves that are conditioned by two fundamental factors: a) growth in commodity prices, and b) the policy of a continuous surplus of the current balance of payments of developing countries.
In accordance with this object and goal of research, the question arises: academic-expert controversies about the establishment of SWF and their investment strategy. This has prompted us to, with reference to modern theory and modern practice of market-developed countries, look at the investment strategy of SWF in the global financial market. In the paper, we will also look at the answer to the question: can SWF, in the conditions of the global economic and financial crisis of 2008, contribute to alleviating its consequences by linking the surplus and deficit financial sector (Van Horne, Wachowicz, 2007).
Theoretical methodological approach to SWF research and investment strategy
In literature (Schubert, Barenbaum, 2010; Jen, 2007a; Johnson, 2007; Truman, 2007; Mishkin, 2006; Ainzenman, 2007; Allen, Caruana, 2008; Bartolotti, Fotak, Magginson, 2010; Bernstein, Lerner, Schoar, 2009 , Rozanov, 2005), SWF is most often defined as “... government investment funds that are funded by foreign reserves, but managed separately from official foreign exchange reserves.” In domestic literature (Soskic, Zivkovic, 2011; Kapor, 2008; Kvrgic, 2010) SWF is also defined as “financial institutions (investment companies) of individual countries - which invest in individual countries: Chile, Mexico, Brazil, Japan, Spain, etc. “As a rule, these are closed-type funds and their actions oscillate around the net asset value per fund fund (NAV-Net Asset Vallue), but, interestingly, they exhibit the highest price volatility at the time of the stock market in the US, not at the time of operation the stock exchanges of the countries in which they invested. This suggests that they are less likely to act as foreign portfolios of actions, and more like domestic actions of the United States. “(Soskic, Zivkovic, 2011, pp. 481).
Although there is no generally accepted SWF definition, three elements are recognizable, which distinguish them from other investment funds: a) they are owned by the state, b) SWF does not have a clearly defined and limited liability, and c) SWF is separate from official foreign exchange reserves. Given that SWF behaves as a (CAMP- Capital Asset Pricing Model) model for determining the price of invested capital, some theoreticians raise the issue of their effectiveness as a factor of portfolio diversification. This is particularly true for newly developed SWFemales in development. If it turns out that SWF is less important than the prediction of individual analysts, the reserves of Asia and the Middle East will likely cause major changes in the role of the US dollar and in the decision-making structure within the IMF. However, the available information suggests that SWF is mostly a conservative investor (IMF, 2008, p.4).
The investment strategy of the SWF can be explored through various theoretical and empirical approaches. Apart from several relevant sources (Bortolotti, Fotak, Megginson, 2010; Balding, 2008), there is no systematized empirical-statistical analysis of the SWF investment strategy that could serve as a platform for further economic

©Друштво економиста “Економика” Ниш http://www.ekonomika.org.rs
124 ЕКОНОМИКА
objectivization and more extensive academic and expert discussion on this topic. In the absence of a generally accepted SWF definition, there are also a number of open questions about the SWF investment strategy in the context of the globalization of financial markets. The establishment of SWF is still under a veil of secrets, the portfolio structure, portfolio diversification and investment strategies are only partially known for the lack of transparency in SWF’s work. Due to lack of transparency, the theoretical and empirical research of SWF investment strategies is confronted with a number of unknowns. The Linaburg Madeuell Transparency Index has been developed for SWF transparency. Conscious of these limitations, we will strive to pay particular attention to the SWF assets structure, investment portfolio, investment models, corporate investment distribution, territorial investment allocation and the stabilization role of SWF as an investor in accordance with the available empirical and statistic data.
In the literature it can be found that SWF is not without influence on the global economic and financial crisis that began in 2008. The crisis, conditioned by uncontrolled capital flows in the global financial market, is a warning to the financial oligarchy that it must take into account the transparency of SWF. Some countries, such as Russia and Qatar, have used their SWF to mitigate the effects of the crisis. (Jen, 2007a). Developing countries have used SWF to buy shares in companies from the West and invest in areas that will reduce the effect of volatility in commodity prices on government revenues and balance of payments. Managed by this account, Chinese SWF bought in 2007 the shares of American companies Morgan Stanlez and Blackstone Group, and FNB from Dubai bought shares from Sony and several other Asian companies.
Previous research on SWF investment strategy
In the introduction we pointed out that SWF is government investment funds, which are financed by surplus foreign exchange reserves, but managed separately from official foreign exchange reserves. The theory and practice agree that SWF’s main growth factor is the large surplus achieved by individual countries due to high oil prices, financial globalization, and imbalances in the global financial system. We will support this research with empirical statistics and point to the countries with the largest SWF. The previous research (Balding, 2008, p.26) indicates that a developed (European) country - Norway and developing countries: the United Arab Emirates, Saudi Arabia, China, Kuwait, Russia and Singapore, are the foremost developing SWF.
Academic and expert filings show that SWF is a heterogeneous group of investment companies that instrumentalize different investment strategies in order to achieve different goals. However, the available data show that SWF are passive long-term investors with no special intention to influence the operational decision-making of companies, using their own voice. Some of the SWF also apply socially responsible investment and ethical guidelines that exclude individual investments (eg in the military industry or the tobacco industry). Also, SWF’s investment strategy, with a significant share of investments in more risky financial assets such as shares, is far more complex and involves a much wider geographic allocation of investments.
In the paper we search for the answer of the question: why are some countries cautious about foreign investment? The answer of some politicians to this question

125 ЕКОНОМИКА
©Друштво економиста “Економика” Ниш http://www.ekonomika.org.rs
ЕКОНОМИКА
is: “The strengthening of state investment funds gives us a completely new, unknown element in the economic circulation,” she said in 2007. German Chancellor Angela Merkel, while French Foreign Minister Jean-Pierre Jujet has also said that “... at the level of Europe, we need to organize better in order to defend our interests.” For all of this, it is understandable that under the auspices of institutions, such as the IMF and the OECD, initiatives have been initiated to somehow regulate SWF activity, pointing to an increase in the role of the investor in the sphere of investment in the global financial market.
There is a lot of theoretical discussions about the possibility and consequences of the restructuring of financial markets through SWF that are present in the scientific-professional public. The results of the survey (Kapor, 2008, p. 7) indicate that the restructuring of financial markets through SWF can start diversification not only outside the US dollar but also outside the euro area. In support of this assertion, it is stated that the official reserves are currently excessive both in the eurozone and in US government bonds. However, these theoretical arguments also have their limit because they ignore the role of the reserve currency of the US dollar and the euro, (OECD, 2007), which may be important in the “restructuring” of SWF in the global financial market.
The papers dealing with investment strategies of SWF(Bortolotti, Fotak, Megginson, 2010, p. 29) pay attention to the socially responsible behavior of these funds and give priority to projects that promote environmental, economic and ethical principles (Peaucelle, 2010). This promotes the transparency of SWF’s investment strategy and achieves the satisfaction of all stakeholders: owners, managers, investment funders, employees and society as a whole. Although some SWF have acquired significant ownership in many companies, they generally act as a portfolio investor, investing on the basis of a market index and buying only less participation in companies. Some SWFs, especially those newly established, hire external portfolio managers, while others rely on their own strengths.
In the end of the paper, we will see SWF as a counterweight to global financial institutions. The results of the survey so far indicate that theory and practice agree that the influence of SWF on the structure and stability of the global financial market will be envied in the coming period from the motives behind the investment decisions of these funds. It is certain that “benevolent” and socially responsible investments will positively influence the financial stability of investment flows, while non-commercial (“risk”) motives can have a negative impact on financial stability (Jen, 2007a).
Analysis of the operation and structure of the SWF portfolio
Statistical empirical analysis for the purposes of this research was based on 1,216 SWF investments worth 357,1 billion dollars, using the FNB database (Bortolotti, Fotak, Megginson, 2010). This database is organized by Monitor Group and Fondazione Eni-Enrico Mattei (FEEM) and includes domestic and international investment 35 SWF in the period from January 1986 to September 2011. The database structure is based on three sources. The first source is the observation of 785 SWF investments in the value of $ 250.9 billion and were obtained from public sources and from the Monitor Group, which includes investment in equity from the listed equity, unallocated capital, which is not unlisted equity, commercial real estate, private equity funds and joint ventures (Table
©Друштво економиста “Економика” Ниш http://www.ekonomika.org.rs
126 ЕКОНОМИКА
1). Another source is a listing of 239 purchases of shares purchased by pre-determined SWF groups, worth $ 84.1 billion, contained in the Securities Data Corporation Global New Issues Database. This database includes companies that are on the list and those that are not on the list. The third source is a sample of 230 acquisitions from and outside the list, valued at $ 71.8 billion, made by the SWF’s previous SWFs, as shown in the Zephyr Mergers and Acquisitions database.
After combining three sets of data and a matrix of 71 common observations for two or more samples, the dates of investments are evaluated, amounted to SWF investors, and the purchased shares are monitored and recorded possible data (if possible). Although FEEM-Monitor SWF analysis is not comprehensive (because it does not monitor investing in corporate bonds), it is the most comprehensive database on the type and scope of SWF’s realized investments.
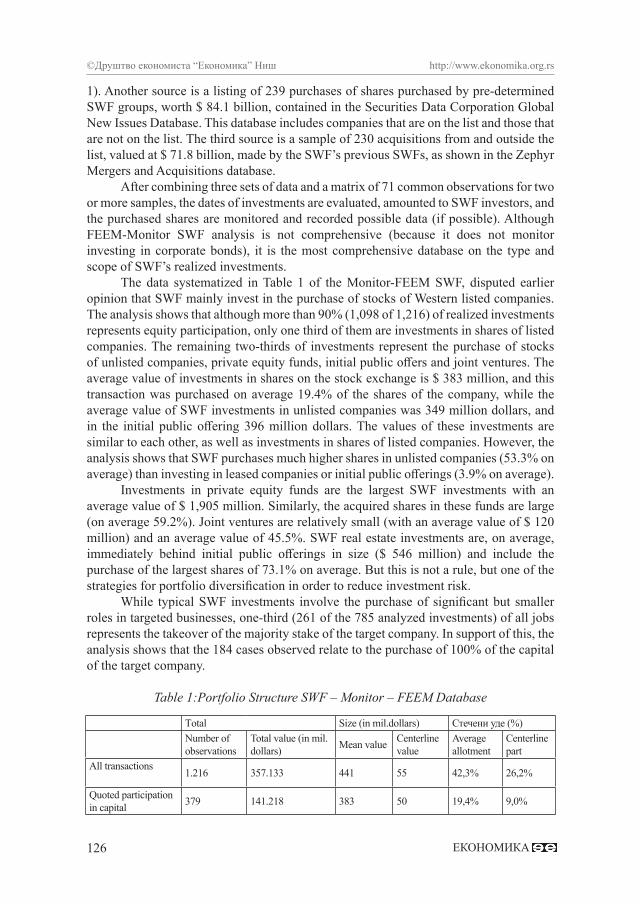
The data systematized in Table 1 of the Monitor-FEEM SWF, disputed earlier opinion that SWF mainly invest in the purchase of stocks of Western listed companies. The analysis shows that although more than 90% (1,098 of 1,216) of realized investments represents equity participation, only one third of them are investments in shares of listed companies. The remaining two-thirds of investments represent the purchase of stocks of unlisted companies, private equity funds, initial public offers and joint ventures. The average value of investments in shares on the stock exchange is $ 383 million, and this transaction was purchased on average 19.4% of the shares of the company, while the average value of SWF investments in unlisted companies was 349 million dollars, and in the initial public offering 396 million dollars. The values of these investments are similar to each other, as well as investments in shares of listed companies. However, the analysis shows that SWF purchases much higher shares in unlisted companies (53.3% on average) than investing in leased companies or initial public offerings (3.9% on average).
Investments in private equity funds are the largest SWF investments with an average value of $ 1,905 million. Similarly, the acquired shares in these funds are large (on average 59.2%). Joint ventures are relatively small (with an average value of $ 120 million) and an average value of 45.5%. SWF real estate investments are, on average, immediately behind initial public offerings in size ($ 546 million) and include the purchase of the largest shares of 73.1% on average. But this is not a rule, but one of the strategies for portfolio diversification in order to reduce investment risk.
While typical SWF investments involve the purchase of significant but smaller roles in targeted businesses, one-third (261 of the 785 analyzed investments) of all jobs represents the takeover of the majority stake of the target company. In support of this, the analysis shows that the 184 cases observed relate to the purchase of 100% of the capital of the target company.
Table 1:Portfolio Structure SWF – Monitor – FEEM Database
Тotal Size (in mil.dollars) Стечени уде (%)Number of observations
Total value (in mil.dollars) Mean value Centerline
valueAverage allotment
Centerline part
All transactions 1.216 357.133 441 55 42,3% 26,2%
Quoted participation in capital 379 141.218 383 50 19,4% 9,0%

127 ЕКОНОМИКА
©Друштво економиста “Економика” Ниш http://www.ekonomika.org.rs
ЕКОНОМИКА
Unquoted participation in capital
719 170.659 453 361 (36) 450 52,5% (49,0%)
Unquoted operational companies 691 154.202 442 349 (33) 440 53,3%
(49,0%)Private capital funds 10 9.526 5 1,905
(1,200) 5 59,2% (46,0%)
Initial public offers 7 2.773 7 396 (170) 7 3,9% (2,7%)
Mutual investments and the rest 8 145 1 120 (120) 2 45,5%
(45,5%)Investment in property 118 45.256 83 546 (245) 56 73,1%
(100%)
Source: Bortolotti, B., Fotak, V., Megginson, W., (2010). Sovereign Wealth Fund Investment Patterns andPerformance.Working Paper. University of Oklahoma.
The analysis of the empirical-statistical data given in Table 1 confirms the theoretical stances of previous research (Mikkelson, Partch, 1985; Hertzel, Lemmon, Linck, and Rees 2002) that most SWF investments make purchases of shares in companies by private arrangement and primary offer of shares. Only 23 deals, worth $ 667 million, can be considered as open market buying shares in these companies. The source cited points out that all documents published by the stock exchange on private equity deals have a positive result, while the mass of empirical evidence shows that market reactions to public offers are negative 2-3%.
Analysis of investment portfolio of SWF
In the previous section we emphasized that there is no relevant statistical-empirical material on the basis of which we can execute a reliable economic objectification of the financial performance of the SWF. There is relatively little comparable data on their assets, investment strategy and management. On the other hand, available information suggests that SWF is mostly a conservative investor (IMF, 2008, p. 7).
Although some SWF have acquired significant ownership in many companies, they generally behave as a portfolio investor, investing in a market index and buying only minor shares in companies. Some SWFs, especially those newly established, hire external portfolio managers, while others rely on their own strengths.
SWF can rightly be said to be a heterogeneous group of investment companies that instrumentalizes different investment strategies in order to achieve different goals (IMF, 2008, p.9). For example, some SWF only invests in publicly-listed financial assets (stocks and bonds) in strategic allocation of funds, while others invest in all major types of financial assets, including alternative investments (eg real estate). It is not uncommon for some SWF to manage stock market indices by establishing the maximum amount of investment in individual companies in order to ensure diversification of the portfolio. The other SWF is using a strategy to maximize absolute returns over a longer period of time, choosing to gain greater involvement in companies that they consider to be a profitable investment.

©Друштво економиста “Економика” Ниш http://www.ekonomika.org.rs
128 ЕКОНОМИКА
However, the available data show that SWF are passive long-term investors with no special intention to influence the operational decision-making of companies, using their own voice. Some of the SWF also apply socially responsible investment and ethical guidelines that exclude individual investments (e.g. in the military or tobacco industry).
SWF's external managers are mainly used to improve their profitability and achieve an active risk-adjusted yield, and at the same time to reduce the opportunity costs of holding large foreign exchange reserves. Although domestic experts, who manage foreign exchange reserves in many countries, generally have enough experience in investing in financial markets in fixed income instruments, their knowledge is limited when it comes to other types of financial assets (eg Actions). Therefore, more and more SWF rely on external managers in terms of strategic asset allocation, even for passive, index-based investments.
In any case, the SWF portfolio is much more diversified in asset allocation, than in the case of the traditional management of foreign currency reserves by the central bank. Also, SWF’s investment strategy with a significant share of investments in risky financial assets (such as shares) is far more complicated and involves a much wider geographic allocation of investments. Proof of this is, for example, Norwegian SWF, whose assets make up 40% of the portfolio in shares and a much wider geographical dispersion of investments. It is estimated that SWF has a relatively higher investment in developing economies, which, despite considerable instability, yield higher yields in the long run. Practice shows that SWF still invest relatively little in hedge funds, private risk projects and real estate, which we discussed in more detail when analyzing the SWF Monitor-FEEM database.
SWF investment model
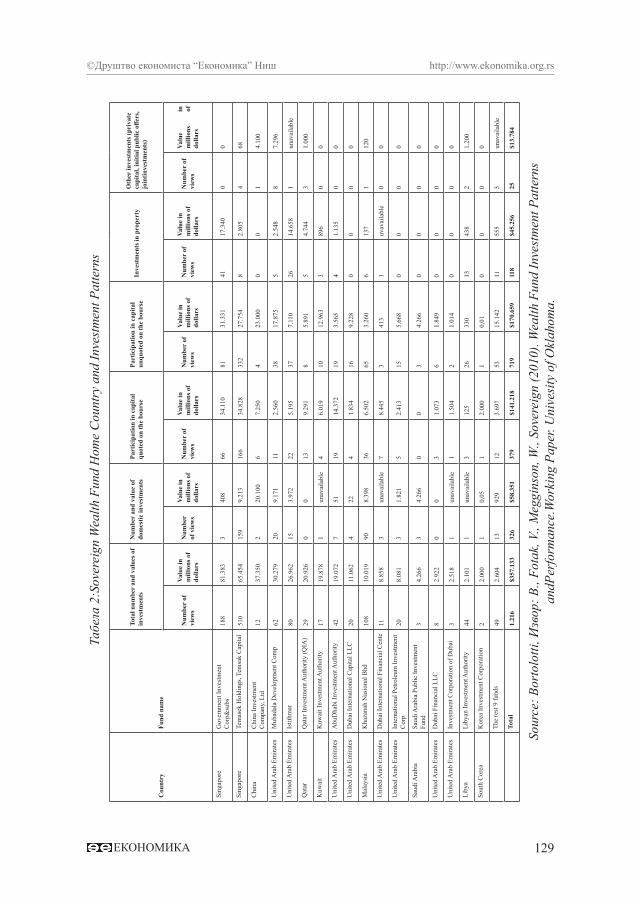
Table 2 shows the empirical-statistical data on the structure and investment models of SWF. This table also presents the number and value of domestic investments - the purchase of shares in companies in the country of origin of SWF.
Singapore’s SWF accounts for over 57% of the total FNB investment and 41% of total investment, while Temasek Holdings and its subsidiaries account for 42% of the total number of recorded investments and 18% of the value of all investments.2
Other SWF investors include China Investment Company (12 deals worth $ 37.4 billion), UAE’s Mubadala Development Company (62 deals worth $ 30.3 billion), Istithmar (80 deals in the value of 26.96 billion Qatar Investment Authority (29 deals worth $ 20.9 billion), the Kuwait Investment Authority (18 deals worth $ 19.9 billion) and the Abu Dhabi Investment Authority (42 jobs worth $ 19.1 billion). The data systematized in Table 2, draw attention to the fact that the number of FNB investments in the home country makes up only 21.6% of the total and 16.3% of the value of all SWF investments.
129 ЕКОНОМИКА
©Друштво економиста “Економика” Ниш http://www.ekonomika.org.rs
ЕКОНОМИКА
Cou
ntry
Fund
nam
e
Tota
l num
ber
and
valu
es o
f in
vest
men
tsN
umbe
r an
d va
lue
of
dom
estic
inve
stm
ents
Part
icip
atio
n in
cap
ital
quot
ed o
n th
e bo
urse
Part
icip
atio
n in
cap
ital
unqu
oted
on
the
bour
seIn
vest
men
ts in
pro
pert
yо
ther
inve
stm
ents
(pri
vate
ca
pita
l, in
itial
pub
lic o
ffers
, jo
intin
vest
men
ts)
Num
ber
of
view
s
Valu
e in
m
illio
ns o
f do
llars
Num
ber
of v
iew
s
Valu
e in
m
illio
ns o
f do
llars
Num
ber
of
view
s
Valu
e in
m
illio
ns o
f do
llars
Num
ber
of
view
s
Valu
e in
m
illio
ns o
f do
llars
Num
ber
of
view
s
Valu
e in
m
illio
ns o
f do
llars
Num
ber
of
view
s
Valu
e in
m
illio
ns
of
dolla
rs
Sing
apor
eG
over
nmen
t Inv
estm
ent
Cor
p&su
bs18
881
.383
340
866
34.1
1081
31.3
3141
17.3
400
0
Sing
apor
eTe
mas
ek H
oldi
ngs,
Tem
sak
Cap
ital
510
65.4
5415
99.
213
166
34.8
2833
227
.754
82.
805
468
Chi
naC
hina
Inve
stm
ent
Com
pany
, Ltd
1237
.350
220
.100
67.
250
423
.000
00
14.
100
Uni
ted
Ara
b Em
irate
sM
ubad
ala
Dev
elop
men
t Com
p62
30.2
7920
9.17
111
2.56
038
17.8
755
2.54
88
7.29
6
Uni
ted
Ara
b Em
irate
sIs
tithm
ar80
26.9
6215
3.97
222
5.19
537
7.11
026
14.6
581
unav
aila
ble
Qat
arQ
atar
Inve
stm
ent A
utho
rity
(QIA
)29
20.9
260
013
9.29
18
5.89
15
4.74
43
1.00
0
Kuw
ait
Kuw
ait I
nves
tmen
t Aut
horit
y17
19.8
781
unav
aila
ble
46.
019
1012
.963
389
60
0
Uni
ted
Ara
b Em
irate
sA
buD
habi
Inve
stm
ent A
utho
rity
4219
.072
751
1914
.372
193.
565
41.
135
00
Uni
ted
Ara
b Em
irate
sD
ubai
Inte
rnat
iona
l Cap
ital L
LC20
11.0
624
224
1.83
416
9.22
80
00
0
Mal
aysi
aK
haza
nah
Nas
iona
l Bhd
108
10.0
1990
8.39
836
6.50
265
3.26
06
137
112
0
Uni
ted
Ara
b Em
irate
sD
ubai
Inte
rnat
iona
l Fin
anci
al C
ente
118.
858
3un
avai
labl
e7
8.44
53
413
1uv
avai
labl
e0
0
Uni
ted
Ara
b Em
irate
sIn
tern
atio
nal P
etro
leum
Inve
stm
ent
Cor
p20
8.08
13
1.82
15
2.41
315
5.66
80
00
0
Saud
i Ara
bia
Saud
i Ara
bia
Publ
ic In
vest
men
t Fu
nd3
4.26
63
4.26
60
03
4.26
60
00
0
Uni
ted
Ara
b Em
irate
sD
ubai
Fin
anci
al L
LC8
2.92
20
03
1.07
36
1.84
90
00
0
Uni
ted
Ara
b Em
irate
sIn
vest
men
t Cor
pora
tion
of D
ubai
32.
518
1un
avai
labl
e1
1.50
42
1.01
40
00
0
Liby
aLi
byan
Inve
stm
ent A
utho
rity
442.
101
1un
avai
labl
e3
125
2633
013
438
21.
200
Sout
h C
orea
Kor
ea In
vest
men
t Cor
pora
tion
22.
000
10,
051
2.00
01
0,01
00
00
The
rest
9 fu
nds
492.
604
1392
912
3.69
753
15.1
4211
555
5un
avai
labl
e
Tota
l1.
216
$357
.133
326
$58.
351
379
$141
.218
719
$170
.659
118
$45.
256
25$1
3.78
4
Sour
ce: B
orto
lotti
, Изв
ор: B
., Fo
tak,
V.,
Meg
gins
on, W
., So
vere
ign
(201
0). W
ealth
Fun
d In
vest
men
t Pat
tern
s an
dPer
form
ance
.Wor
king
Pap
er. U
nive
sity
of O
klah
oma.
Табе
ла 2
:Sov
erei
gn W
ealth
Fun
d H
ome
Cou
ntry
and
Inve
stm
ent P
atte
rns

©Друштво економиста “Економика” Ниш http://www.ekonomika.org.rs
130 ЕКОНОМИКА
The obtained results of the analysis show that the Singapore FNB is investment-oriented globally, while the Chinese SWF is primarily focused on the domestic market, especially since 2007, which coincides with the onset of the global financial and economic crisis. Also, Singapore’s SWF is leading in the investments of listed companies, as well as real estate investments. However, the results are surprising for two significant SWFs - for Norwegian Government Pension Fund-Global and Abu Dhabi Investment Authority (ADIA). Although the Norwegian fund is the world’s second largest SWF and recognized as a leader in global investment, there are no statistical data on the models and structure of investments in the previous table. This is because the fund signs subcontractors for investment managers (asset managers) and therefore has never been listed (registered) as a buyer of shares or real estate in any database.
There are two main publicly available reasons for a modest number of SWF investments (ADIA), where only 42 investments were recorded, although the total amount was $ 19.1 billion. First, (ADIA) employs managers (asset managers) for a larger number of their investments, especially for smaller portfolio investments in these companies. Second, the (ADIA) has a more conservative investment philosophy than other SWFs, so that its investment strategy is dominated by capital investment, government and corporate bonds denominated in dollars, which are not visible to the search techniques shown in the previous table.
Corporate distribution of FNB investments
Table 3 shows the balance (elements) of the corporate distribution of FNB investments. Empirical-statistical data aim to familiarize users of this analysis with the diversification of the FNB portfolio and their investments in companies of different sectoral affiliations. We note that FNB favors investments in financial companies of other sectors, which is shown by the results of the research presented in Table 3.
Investments in financial companies include 376 investments, accounting for 30.9% of all jobs by number, and more than half (54.6%) of total investments. Other important sectors that attract investments FNB are real estate (11.9% of jobs, 15.3% of value), information and communication technologies ICT (7.5% of jobs, 7.7% of value), production (9.1% jobs, 5.3% of value) and infrastructure (11.9% of jobs, 15.3% of value). It should be noted that favoring investing in financial companies is a phenomenon of a newer date. As noted in the earlier analysis, FNB has directed less than one-fifth of its investments to financial companies in 2007, and in the earlier years even less.

131 ЕКОНОМИКА
©Друштво економиста “Економика” Ниш http://www.ekonomika.org.rs
ЕКОНОМИКА
Financies
Property
Informational Technologies
Enterpreneurs
Infrastructures
Services
Production
Тelecommunication
Consumer products/services
Transport
Healthcare
Тrade
Natural Resources
Еnergy and communal services
Materials
оthers
Number of views/ total in millions of dollars
USA
41 $
79.3
8513 $9
.855
15 $994
7 $514
0 017 $1
.944
6 $149
2 $22
5 $3.2
425 $8
013 $1
851 $9
421 Н
а2 $4
000 0
2 $14
132
$79.
385
Gre
at B
rita
in19
$18
.537
18 $10.
059
1 $413
2 $285
2 $5.2
0012 $6
.174
10 $1.5
472 $1
345 $9
41 $1
184 $3
.187
3 $1.7
050 0
2 $369
1 $17
0 083 $4
7.68
8C
hina
18 $
26.3
1821 $2
.070
6 $122
4 $42
1 $925
1 $16 $3
41 $5
8 $852
4 $406
1 $61 $2
01 $5
02 $2
02 $2
91 $5
079 $3
1.00
0Sw
itzer
land
3 $27.
160
0 00 0
0 00 0
0 01 $1
.290
0 00 0
4 $1.9
702 $4
30 0
0 01 $7
70 0
0 011 $3
0.54
0U
AE
14 $1.1
419 $3
.692
1 на5 $6
.000
0 04 Н
а7 $1
230 0
2 На
3 На
1 На
2 На
2 $1.8
218 $2
.100
0 00 0
55 $14.
877
Sing
apor
e21 $1
.126
10 $3.3
6735 $2
.142
32 $463
0 03 $6
1 $35
10 $428
20 $751
9 $1.5
760 0
2 $49
2 $878
10 $1.0
892 $6
1 $848
177
$13.
230
Aus
tral
ia10 $1
.119
6 $1.8
352 $2
85 $2
.007
0 07 $8
900 0
0 01 $3
291 Н
а2 $8
901 Н
а1 $1
34 $4
.985
0 01 $1
441 $1
2.11
0M
alay
sia29 $2
.786
12 $639
8 $36
23 $2.4
762 Н
а4 $1
.250
12 $158
13 $2.5
631 Н
а2 Н
а4 $3
212 $3
72 $5
51 $1
911 $3
61 $5
511
7$1
0.55
0H
ong
Kon
g5 $3
190 0
10 $652
4 $1.0
193 $5
.474
0 04 $1
823 $1
11 $207
0 00 0
0 00 0
2 $52
1 $90 0
43 $7.9
15Јa
pan
6 $238
8 $3.5
120 0
3 $50
0 03 $9
851 Н
а1 $1
733 Н
а1 $2
441 $9
52 $8
621 Н
а1 $7
800 0
0 031 $6
.939
Indo
nesia
22
$2.8
740 0
0 06 $1
362 $1
.000
2 $23 $3
42 $1
.270
1 На
0 00 0
0 00 0
3 $363
0 00 0
79 $5.6
80In
dia
17 $993
3 $226
2 $110
8 $25
2 $60
4 $158
2 На
8 $2.1
9110 $5
477 $3
7910 $1
520 0
0 04 $3
81 Н
а0 0
30 $4.8
84So
uth
Kor
ea8 $4
452 $9
590 0
0 00 0
0 03 $8
21 $1
0 00 0
7 $463
0 02 $7
301 $1
420 0
0 022 $3
.592
Тhai
land
16
$ 2.
465
3 $161
3 $110
0 00 0
0 00 0
2 $23
2 $10
2 На
0 00 0
0 02 $4
250 0
0 030 $3
.194
Ital
y2 на
1 $300
0 00 0
1 $1.5
796 $3
136 $2
621 $4
3 $111
1 На
0 00 0
1 $36
0 00 0
1 На
23 $2.6
06о
ther
s14
5$2
9.92
851 $1
7.89
68 $2
4512 $5
.677
3 $131
34 $10.
357
25 $6.0
698 $1
.432
7 $379
10 $1.2
598 $2
145 $1
653 $1
817 $1
8.94
36 $1
133 $4
8926
0$1
13.4
14To
tal
376
$194
.834
145
$54.
571
91 $4.8
5211
1$1
8.90
716 $1
4.36
992 $2
2.08
075 $9
.965
52 $8.2
4779 $6
.414
50 $6.0
3253 $5
.556
19 $3.7
8016 $3
.601
70 $29.
974
14 $210
10 $1.4
701.
216
$357
.133
Tabl
e 3:
Inte
rnat
iona
l and
Indu
stri
al D
istr
ibut
ion
of S
WF
Inve
stm
ents
Sour
ce: B
orto
lotti
, B.,
Fota
k, V
., M
eggi
nson
, W. (
2010
).Sov
erei
gn W
ealth
Fun
d In
vest
men
t Pat
tern
s and
Per
form
ance
.Wor
king
Pa
per.
Uni
vesi
ty o
f Okl
ahom
a.

©Друштво економиста “Економика” Ниш http://www.ekonomika.org.rs
132 ЕКОНОМИКА
Countries invested by SWF
For the economic objectification of the SWF investment strategy, it is not enough to look at the sectoral structure of investments, but it is also necessary to explore the territorial distribution of the countries invested by SWF. Therefore, Table 3 can serve us as the global distribution channel for SWF investments. As seen in Table 3. Singapore is the country that receives the “numerical” maximum investment (177) of the SWF (from its two funds), but the financial amount of these investments ($ 13.23 billion) is insignificant and places it only to the sixth place.
The United States is the most popular destination for SWF investments in terms of total investment value (22.2%) of the value of all SWF investments and 10.9% of the total number directed to the US market.
China is the second country in terms of SWF’s investment value. The largest number of 79 investments, whose total value is 31 billion dollars, make domestic investments. China Investment Corporation is $ 20 billion in December 2007 bought shares in the Chinese Development Bank (China Development Bank) and this represents the largest single investment in the observed database.
In addition to Singapore, the United States and China, other SWF-investing countries are the United Kingdom, the United Arab Emirates (mainly domestic investment), Australia (mainly foreign investment) and Malaysia (mostly domestic investment). In addition to investing in domestic companies, research shows that FNB buys real estate and shares in countries with English customary law: the United States, Great Britain and Australia.
Conclusion
National wealth funds are an important segment of the global financial market. These financial institutions have their past, present and future. Over time, they have built their physiognomy, replacing themselves and the financial environment. The SWF portfolio has changed chronologically. Initially, SWF’s portfolio structure was dominated by government securities denominated in foreign currencies. With the globalization of the financial market, especially in the last decade of the 20th century and the first decade of the 21st century, SWF is transforming itself into “managers of surplus foreign exchange reserves” and other securities denominated in foreign currencies.
Although it is thought that SWF, most commonly, buyers of stocks in Western companies listed on the stock market, research shows the opposite. Namely, in the total capital of SWF, only one third are investments in shares of listed companies. The remaining two-thirds include the purchase of stocks of companies not listed on stock exchanges, private equity, initial public offerings and joint ventures. This is understandable, bearing in mind that SWF’s investment strategy with more significant investment in risky financial assets (stocks) is far more complex and includes a much wider geographic allocation of investments. Investments in private capital are the largest SWF investments, followed by real estate investments, and joint ventures are relatively small. Singapore SWF is an investment oriented globally, while Chinese SWF primarily focuses on the domestic market, especially since 2007, which coincides with the onset of the global financial crisis.

133 ЕКОНОМИКА
©Друштво економиста “Економика” Ниш http://www.ekonomika.org.rs
ЕКОНОМИКА
The survey shows that in the structure of sectoral investment, SWF is the leading financial company (54.6% of total investments), followed by real estate (11.9% of jobs, 15.3% of value), infrastructure (11.9% jobs, 15.3% of value). (7.5% of jobs, 7.7% of value) and industry (9.1% of jobs, 5.3% of the value). The USA are the most attractive country for FNB investments in terms of total investment value (22.2% of the total value of FNB investment goes to the US market.) China is the second country in terms of SWF’s investment value, with domestic FNB dominating in the structure of overall investments, Singapore is the country that receives the most investment (117), however, the investment places it only in the sixth place. United Arab Emirates has attracted nor for FNB investments, mainly dominated by the domestic FNB, the same is the case with Malaysia, while Great Britain and Australia are more attracted to foreign FNB investments, Analyzes also indicate that the number of FNB investments in the country of origin is only 21, 6% of the total number and 16.3% of the value, all, of the FNB investment.
The investment strategy of FNB can contribute to the expansion of the long-term investment basis for risky assets, such as stocks, corporate bonds, private equity and real estate. Although in theory and practice there is a concern that a particular FNB may be prone to a sudden sale of funds, which may lead to financial market instability, the survey shows that there is no firm evidence of investment strategies that would adversely affect the market integrity. True, FNB can lead to excessive risk and deformation of property values, if they are guided by investment motives of FNB acquisition, which is most often politically motivated.
With the reference to the methodology of scientific research in the end of this paper, we point out: however much the obtained research results are relevant, they can not serve as a “credible” statistical-empirical basis for a reliable economic objectification of the financial performance of FNB and their investment strategies. Theory and practice agree that during the next period, the influence of FNB on the structure and stability of the global financial market will be envied by the motives behind the investment decisions of these funds. It is certain that the “well-meaning” and socially responsible investments of the FNB will positively influence the globe’s financial stability, and that non-commercial motives (“risk”) may have a negative impact.
References
Aizenman, J. (2007). Sovereign Wealth Funds: Stumbling Blocks or Stepping Stones to Financial Globalization.Economic Letters No. 38. FRBSF.
Allen, M., Caruana, J. (2008). Sovereign Wealth Funds-A Work Agenda. Prepared by the Monetary and Capital Markets and Policy Development and Review Department, IMF.
Balding, C. (2008). A Portfolio Analysis of Sovereign Wealth Funds. Working Paper. University of California-Irvine.
Bernstein, S., Lerner, J.,& Schoar, A. (2009). The Investment Strategies of Sovereign Wealth Funds. Harvard Business School. Boston.
Bortolotti, B., Fotak, V., &Megginson, W. (2010). Sovereign Wealth Fund Investment Patterns andPerformance.Working Paper. Univesity of Oklahoma

©Друштво економиста “Економика” Ниш http://www.ekonomika.org.rs
134 ЕКОНОМИКА
Davis, J., Ossowski, R., Daniel, J. & Barnett, S. (2001). Stabilization and Savings Funds for Non-Renewable Resources: Experience and Fiscal Policy Implications, in Davis, J., Ossowski, R., and Fedelino, A., (eds), Fiscal policy formulation and implementation in oil-producing countries. IMF. Washington, pp 273-315.
IMF, (2008). Sovereign Wealth Funds- A Work Agenda. February. Washington DC.Jen, S. (2007). Sovereign Wealth Funds: What They Are, and What’s Happening.
World Economics 8, no.4, IMF Survey online.Jen, S. (2007). How Big Could Sovereign Wealth Funds Be by 2015?. Global
Economic Forum. Morgan Stanley.Johnson, S. (2007). The Rise of Sovereign Wealth Funds.Finance and Development,
44, No. 3. International Monetary Fund.Капор, П. (2008). Државни инвестициони фондови. Пословна политика, бр. 10-
11, Београд.Квргић, Г. (2010). Управљање инвестиционим фондовима. Висока школа за
послвну економију и предузетништво. Београд.Mikkelson, W. H., Partch М. М. (1985). Stock price effects and costs of secondary
distributions.Journal of Financial Economics 14.Rochester NY, p. 165-194.Mishkin, F. (2006). Монетарна економија, банкарство и финасијска тржишта.
ДатаСтатус, Београд.OECD Investment Newsletter, (2007). International Investment of Sovereign Wealth
Funds: are new rules needed? Issue 5, p.4-5.Peaucelle, I. (2010). Sovereign Wealth Funds, BRIC and Sustainable Development.
W.P. for IV Forum.Environment, Innovation and Sustainable development. Marseille.
Rozanov, A. (2005). Who Holds the Wealth of Nations?.Central Banking Journal, Volume XV,Number 4.
Schubert, W., Barenbaum, L. (2010). The Sovereign Wealth Fund Controversy: The Issues and Suggestions. Journal of Applied Business and Economics, Vol. 11, No. 2.
Truman, E. M.(2007). Sovereign Wealth Fund Acquisitions and Other Foreign Government Investmentsin the United States: Assessing the Economic and National Security Implications, Testimonybefore the Committee on Banking, Housing, and Urban Affairs, United States Senate. November14.
Hertzel, M., Lemmon М., Linck Ј., &ReesL. (2002). Long-run performance followingprivate placements of equity.Journal of Finance, Volume 57, Issue 6, p.2595-2617.
Шошкић, Д., Живковић, Б. (2011). Финансијска тржишта и институције. Економски факултет, Београд.
Washington Post, (2007). Crisis Comes to the IMF. October 19. Sovereign Wealth Fund Institute, http://www.swfinstitute.org/fund-rankings/