strategic significance of america’s oil shale...
TRANSCRIPT

Strategic Significance of America’s Oil Shale Resource
Volume II Oil Shale Resources
Technology and Economics
Office of Deputy Assistant Secretary for Petroleum Reserves
Office of Naval Petroleum
and Oil Shale Reserves U.S. Department of Energy
Washington, D.C.
March 2004


Strategic Significance of America’s Oil Shale Resource
Volume II
Oil Shale Resources, Technology and Economics
March 2004 Final Report
Prepared for:
Office of Deputy Assistant Secretary for Petroleum Reserves
The Office of Strategic Petroleum Reserves
U.S. Department of Energy
Work Performed Under: Contract DE-AC01-03FE67758
Task Order 6
Prepared by: AOC Petroleum Support Services, LLC
Washington, D.C.
Principal Authors: Harry R. Johnson, INTEK, Inc.
Peter M. Crawford, INTEK, Inc. James W. Bunger, JWBA, Inc.

Disclaimer
This report was prepared as an account of work sponsored by an agency of the United States Government. Neither the United States Government nor any agency thereof, nor any or their employees or contractors, makes any warranty, express or implied, or assumes any legal liability or responsibility for the accuracy, completeness, or usefulness of any information, apparatus, product, or process disclosed, or represents that its use would not infringe privately owned rights. Reference herein to any specific commercial product, process or service by trade name, trade-mark, manufacture, or otherwise, does not necessarily constitute or imply its endorsement, rec-ommendation, or favoring by the United States Government or any agency thereof. The views and opinions of authors expressed herein do not necessarily state or reflect those of the United States Government or any agency thereof.
Volume II – Oil Shale Resources Technology and Economics
Table of Contents Foreword .........................................................................................................................iv Acknowledgments .......................................................................................................... v 1.0 U.S. Western Oil Shale Resources and Infrastructure ............................................. 1
1.1 Characteristics of U.S. Western Oil Shale Resources...................................... 1 1.2 Infrastructure .................................................................................................... 6
2.0 Oil Shale Technology Assessment........................................................................... 7 2.1 Updating World Oil Shale Technology Activity ................................................. 9 2.2 Advances in Oil Shale Technology................................................................. 14 2.3 Conclusions about Oil Shale Technology, Potential and Timing .................... 21
3.0 Environmental and Regulatory Issues.................................................................... 22 3.1 Oil Shale Processes that Impact the Environment ......................................... 23 3.2 Impacts and Issues ........................................................................................ 24 3.3 Human Health and Safety Impacts and Issues .............................................. 27 3.4 Permitting Issues............................................................................................ 27
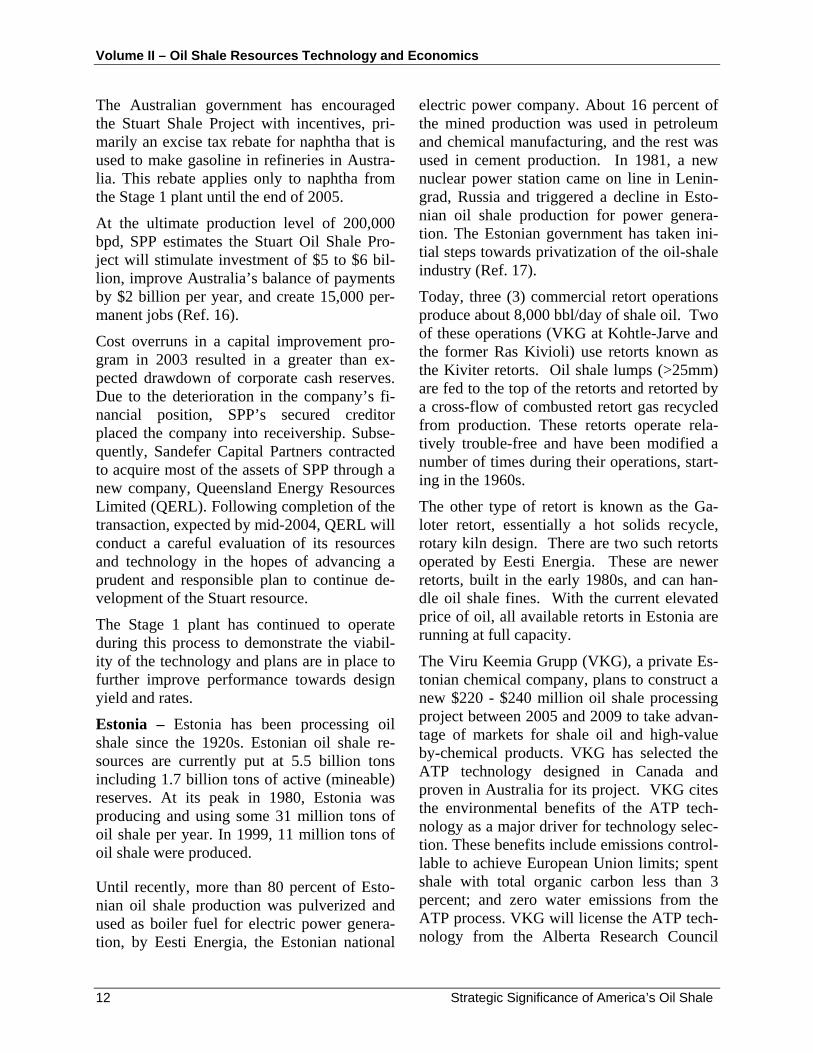
4.0 Analogy to Alberta's Tar Sand Commercialization ................................................. 28 4.1 Resource Characteristics ............................................................................... 30 4.2 Technology Performance ............................................................................... 30 4.3 Environmental Impacts and Controls.............................................................. 32 4.4 Mass Balances for Oil Shale and Tar Sand Production
by Mining and Surface Processing................................................................. 33 4.5 Production Goals and Economics .................................................................. 33
Conclusions................................................................................................................... 35 Reference.................................................................................................................... R-1 Appendix A A Brief History of Oil Shale......................................................................A-1 Appendix B Oil Shale Technologies to 1991 ..............................................................B-1
Strategic Significance of America’s Oil Shale i

Volume II – Oil Shale Resources Technology and Economics
List of Figures
Figure 1 Principal Reported Oil Shale Deposits of the Unites States ............................. 2 Figure 2 Oil Shale Areas in Colorado, Wyoming and Utah............................................. 2 Figure 3 Cumulative Resource Greater Than Indicated Richness. ................................ 3 Figure 4 25 gallon/ton Isopach, Piceance Creek Basin. ................................................. 3 Figure 5 25 Gallon/ton Isopach, Uinta Basin .................................................................. 4 Figure 6 Areas Amenable to Surface Mining, Utah ........................................................ 4 Figure 7 Histogram from Utah ........................................................................................ 5 Figure 8 Upper Colorado River Basin Water Resources. ............................................... 6 Figure 9 Conversion of Oil Shale to Products (Surface Process)................................... 7 Figure 10 Conversion of Oil Shale to Products (True In-Situ Process) .......................... 8 Figure 11 Stuart Shale Phased Development Strategy................................................ 10 Figure 12 Stuart Shale Stage 3 Projected Profitability at $25/Bbl WTI ......................... 11 Figure 13 Generalized Processes for Conversion of Shale to Fuels and Byproducts. . 14 Figure 14 ATP Schematic ............................................................................................ 16 Figure 15 Overview of In-Situ Conversion Process. ..................................................... 16 Figure 16 In-Situ Process Detail................................................................................... 17 Figure 17 Thermal Solution Process ............................................................................ 18 Figure 18 Value Enhancement..................................................................................... 19 Figure 19 Surface Area Impact of 1 MMBbl/d Industry................................................. 24 Figure 20 Alberta Oil Sand Production ......................................................................... 28 Figure 21 Analogous Steps in Production for Tar Sand and Oil Shale ......................... 30 Figure 22 Tar Sand Economics and Production Continue to Improve.......................... 34 Figure B-1 Tosco Retort ..............................................................................................B-3 Figure B-2 Gas Combustion Retort .............................................................................B-3 Figure B-3 Lurgi Ruhrgs Retort ...................................................................................B-4 Figure B-4 Geokinetics Horizontal Modified In-Situ Retort ..........................................B-5
ii Strategic Significance of America’s Oil Shale

Volume II – Oil Shale Resources Technology and Economics
List of Tables
Table 1 Advances in Oil Shale Technology.................................................................. 15 Table 2 Composition and Properties of Selected U.S. Shale Oils ................................ 20 Table 3 Properties and Composition of Hydrotreated Refinery Feedstock................... 21 Table 4 Composition of Principal Factors Influencing the Economics Of Unconventional Crude Oil Production ....................................................... 29 Table 5 Mass Balance Comparison (Daily Metrics) ..................................................... 33 Table A-1 Oil Shale Timeline.......................................................................................A-2 Table A-2 Status of Major U.S. Oil Shale Projects ......................................................A-4
Strategic Significance of America’s Oil Shale iii

Volume II – Oil Shale Resources Technology and Economics
Foreword
It is generally agreed that worldwide petroleum supply will eventually reach its productive limit, peak, and begin a long-term decline. What should the United States do to prepare for this event? An objective look at the alternatives points to the Nation’s untapped oil shale as a strategically located, long-term source of reliable, affordable, and secure oil.
The vast extent of U.S. oil shale resources, amounting to more than 2 trillion barrels, has been known for a century. In 1912, The President, by Executive Order, established the Naval Petro-leum and Oil Shale Reserves (NPOSR). This office has overseen the U.S. strategic interests in oil shale since that time. The huge resource base has stimulated several prior commercial at-tempts to produce oil from oil shale, but these attempts have failed primarily because of the his-torically modest cost of petroleum with which it competed. With the expected future decline in petroleum production historic market forces are poised to change and this change will improve the economic viability of oil shale.
It has been nearly two decades since meaningful federal oil shale policy initiatives were taken. In that time technology has advanced, global economic, political, and market conditions have changed, and the regulatory landscape has matured. As America considers its homeland security posture, including its desired access to diverse, secure and abundant sources of liquid fuels, it is both necessary and prudent to reconsider the potential of oil shale in the nation’s energy and natural resource portfolio.
Commercializing the vast oil shale resources would complement the mission of the Strategic Pe-troleum Reserve (SPR), by measurably adding to the country’s energy resource base. Addition of shale oil to the country’s proved oil reserves could occur in a manner similar to the addition of 175 billion barrels of oil from Alberta tar sand to Canada’s proved oil reserves. With its com-mercial success, production of oil from tar sand now exceeds 1 million barrels/day. U.S. oil shale, which is as rich as tar sand, could similarly be developed and become a vital component in America’s future energy security.
This report was chartered to review the potential of shale oil as a strategic liquid fuels resource. Volume I reviews the strategic value of oil shale development, public benefits from its develop-ment, possible ramifications of failure to develop these resources and related public policy issues and options. Volume II characterizes the oil shale resource, assesses oil shale technology, sum-marizes environmental and regulatory issues, and reviews tar sand commercialization in Canada as an analog for oil shale development in the United States.
A Peer Review meeting of selected experts from government, industry, business and academia was held February 19-20, 2004. Comments and suggestions were received and incorporated into the two volumes; comment excerpts are provided in Volume I, Appendix B. The reviewers agreed, based on the current and anticipated energy climate and the issues addressed in the re-port, that preparation of a Program Plan for oil shale is now warranted.
Anton Dammer, Director Naval Petroleum and Oil Shale Reserves U.S. Department of Energy Washington, D.C.
Strategic Significance of America’s Oil Shale iv

Volume II – Oil Shale Resources Technology and Economics
Acknowledgements “Strategic Significance of America’s Oil Shale – Volume II,” is a report sponsored by the U.S. Department of Energy, Office of the Naval Petroleum and Oil Shale Reserves (DOE/NPOSR), and prepared under Contract Number DE-AC01-03FE67758 (Task 6) by AOC Petroleum Sup-port Services, LLC (AOC-PSS). Mr. Anton Dammer of DOE/NPOSR served as the Project Di-rector and Mr. Frank Field of AOC served as the Program Manager for this task. The DOE/NPOSR acknowledges the significant and invaluable contributions of the Steering Committee for providing overall guidance and direction for this report. The Committee mem-bers include: Mr. Anton Dammer (DOE/NPOSR), Mr. F.J. Gangle (DOE/NPOSR), Mr. Hugh Guthrie (DOE/NETL), Mr. Terry O’Connor (Shell Petroleum), Mr. Frank Field (AOC), Mr. Harry Johnson (INTEK), Mr. Peter M. Crawford (INTEK), Dr. James W. Bunger (JWBA), and Dr. Don Repici (Consultants). Special recognition is due to those who directly performed the work on this project. The princi-pal authors included, Mr. Harry Johnson (INTEK), Mr. Peter M. Crawford (INTEK), and Dr. James W. Bunger (JWBA). Mr. F.J. (Butch) Gangle of DOE/NPOSR is acknowledged for his immense effort in the review and critique of this report. Ms. Cortney Allen of INTEK served as the Administrator responsible for the day-to-day management of the project. Mr. Fred Hartsock of AOC is recognized for his effort in the production of the report. The authors and sponsors also wish to recognize and thank the numerous experts from industry, government, and academia who reviewed the drafts of this document and who provided invalu-able insights and comments in writing and through their participation in a peer review meeting. While acknowledging the significant contributions of participating individuals and organizations, any error of facts, omission, or inconsistency remains the responsibility of the Project Director and Program Manager.
Strategic Significance of America’s Oil Shale v


Volume II – Oil Shale Resources Technology and Economics
Oil Shale Resources, Technology and EconomicsAmerica’s oil shale resources are extensive and concentrated. With long-term crude oil prices firming, oil shale appears to be nearing economic recoverability under a variety of resource-technology scenarios. While the Na-tion’s resource base includes both eastern and western shales, the primary focus of this re-port is on the western oil shale resources of the Green River Formation. Western oil shale represents the greatest potential for near-term development to help meet the Nation’s needs for liquid fuels. A broad range of technology exists to convert the kerogen in oil shale to fuels and high-value chemicals, while respect-ing and protecting the environment.
The purpose of this volume is to:
present an updated overview of the known oil shale resource, on-going oil shale activities, and advances in oil shale technology and unconventional resource development, and to
summarize environmental and regula-tory issues that will influence public and private decisions when developing a domestic oil shale industry.
The information and conclusions presented in this volume are drawn from an extensive body of scientific and technical research and analy-sis conducted by industry, government, aca-demia, policy analysts, and technical experts, as well as recent analyses conducted by the authors that compare the resource, technical, and economic characteristics of domestic oil shale with the analogous Athabasca tar sand, now being commercially produced in the Province of Alberta, Canada.
1.0 U.S. Western Oil Shale Re-sources and Infrastructure The extent and characteristics of U.S. western oil shale resources, and particularly those in
the Green River Formation, are well known and documented.
1.1 Characteristics of U.S. Western Oil Shale Resources “Oil shale” is a hydrocarbon bearing rock that occurs in nearly 100 major deposits in 27 countries worldwide. It is generally shallower (<3000 feet) than the deeper and warmer geo-logic zones required to form oil. According to Dyni (Ref. 1), the origins of oil shale can be categorized into three basic groups; terrestrial (organic origins similar to coal-forming swamps), lacustrine (organic origins from fresh or brackish water algae), and marine (organic origins from salt water algae, acri-tarchs, and dinoflagellates).
Worldwide, the oil shale resource base is be-lieved to contain about 2.6 trillion barrels, of which the vast majority, or about 2 trillion barrels, (including eastern and western shales), is located within the United States. (Dyni, ibid.) The most economically attractive depos-its, containing an estimated 1.5 trillion barrels (richness of >10 gal/ton) are found in the Green River Formation of Colorado (Piceance Creek Basin), Utah (Uinta Basin) and Wyo-ming (Green River and Washakie Basins).
U.S. oil shale resources have been extensively characterized. Figures 1 and 2 show the areal extent of these resources.
Eastern oil shale underlies 850,000 acres of land in Kentucky, Ohio and Indiana. 16 billion barrels, at a minimum grade of 25 gal/ton, are located in the Kentucky Knobs region in the Sunbury shale and the New Albany/Ohio shale. Due to differences in kerogen type (compared to western shale) eastern oil shale requires different processing. Potential oil yields from eastern shales could someday ap-proach yields from western shales, with proc-essing technology advances.
Strategic Significance of America’s Oil Shale 1

Volume II – Oil Shale Resources Technology and Economics
Figure 1. Principal Reported Oil Shale Deposits of the United States (Ref. 2)
Figure 2 illustrates the most concentrated ar-eas of western resources. More than a quarter million assays have been conducted on core and outcrop samples for the Green River oil shale. Results have shown that the richest zone, known as the Mahogany zone, is located in the Parachute Creek member of the Green River Formation. This zone can be found throughout the formation.
Figure 2. Oil Shale Areas in Colorado, Wyoming and Utah (Ref. 2)
A layer of volcanic ash several inches thick, known as the Mahogany marker, lies on top of the Mahogany zone and serves as a convenient stratigraphic event that allows oil shale beds to be correlated over extensive areas. Because of it’s relatively shallow nature and consistent bedding, the resource richness is well known, giving a high degree of certainty as to re-source quality.
By assay techniques (Fischer assay being the commonly accepted method) oil yields vary from about 10 gal/ton to 50 gal/ton and, for a few feet in the Mahogany zone, up to about 65 gal/ton. Oil shale yields more than 25 U.S. gal/ton are generally viewed as the most eco-nomically attractive, and hence, the most fa-vorable for initial development.
When discussing oil shale resources, it is important to qualify the resource estimates by richness as well. According to Culbertson and Pittman (1973), of the 1.5 trillion barrels of western resource, an estimated 418 billion bar-rels are in deposits that will yield at least 30
2 Strategic Significance of America’s Oil Shale

Volume II – Oil Shale Resources Technology and Economics
gal/ton in zones at least 100 feet thick (Ref. 3). Donnell (Ref. 4) estimates resources of 750 billion at 25 gal/ton in zones at least 10 feet thick. These data correlate well with a loga-rithmic curve form illustrated in Figure 3.
Oil shale resources lie within the basin with
Figure 4. 25 Gallon/ton Isopach, Pi
gal
/to
nlow dip in the general direction of prevailing regional drainages. Oil shale generally out-crops along the eroded margins of the basin, yielding multiple access points. The thickest, richest zones are found in the north-central portions of the Piceance Creek and north-eastern Uinta Basins. Isopachous maps of the Piceance Creek and Uinta Basins are shown in Figures 4 and 5.
Strategic Significance of America’s Oil Shale
Figure 3. Cumulative Resource Greater Than Indicated Richness
ceance Creek Basin (Ref. 5)
Richness vs Cumulative Resource
0
10
20
30
40
50
60
70
0 400 800 1200 1600cum ulative b bls in-p lace gre ate r t han in dic at e d r ichn e s s (in billions )
3

Volume II – Oil Shale Resources Technology and Economics
4 Strategic Significance of America’s Oil Shale
Figure 5. 25 Gallon/ton Isopach, Uinta Basin (Ref. 6)
Figure 6. Areas Amenable to Surface Mining, Utah (Ref. 8)

Volume II – Oil Shale Resources Technology and Economics
In general, surface mining is likely to be used for those zones that are near the surface or that are situated with an overburden-to-pay ratio of less than about 1:1. Economic optimization methods can be used to select stripping ratios, optimum intercept, and cutoff grades.
Oil shale exhibits distinct bedding planes. These bedding planes can be used to an ad-vantage during mining and crushing opera-tions. According to Cameron Engineers (1975), shear strengths along the bedding planes are considerably less than across the planes (Ref. 7), thereby, reducing operational demands.
Thin overburden, attractive for surface min-ing, tends to be found along part of the mar-gins of the southern Uinta Basin and the northern Piceance Creek Basin. Figure 6 de-picts the locations accessible to surface min-ing in Utah, showing the surface outcrop along the southern margins of the formation (Ref. 8). Figure 7 provides an example of a corehole histogram in which oil shale lies
The choice of how deep or se
right on the surface (Ref 9).
lective to mine is
and pillar mining is likely to
re found at
and thicker ores will require vertical
th a
in excess
an economic optimization issue. Numerous opportunities exist for the surface mining of ore averaging better than 25 gallon/ton, with overburden-to-pay ratios of less than 1, espe-cially in Utah.
In general, roombe used for resources that outcrop along steep erosions. Horizontal adit, room and pillar min-ing was used successfully by Unocal. (Tech-nology difficulties in the Unocal operation pertained primarily to the retort.)
Attractive locations in Colorado athe north end and along the southern flank of the Piceance Creek basin. Zones 25 feet thick or more, with yields of 35 gallon/ton can be found throughout this area. In Utah, opportu-nities for 35 gallon/ton ore exist along Hell’s Hole canyon, the White River, and Evacuation Creek.
Deeper shaft mining, modified in-situ, or true in-situ recovery approaches. Because the pay zone is more than 1,500 feet thick in some places, it is conceivable that open pit mining could be ap-plied even with 1,000 feet of overburden.
In recent years, Shell has experimented wi
Figure 7. Histogram from Utah Sec. 29, T 12 S, R 25 E (Ref. 9)
novel in-situ process, (discussed below) that shows promise for recovering oil from rich, thick resources lying beneath several hundred to one-thousand feet of overburden.
There are locations that could yield of 1 million barrels per acre and require, with minimum surface disturbance, fewer than 23 square miles to produce as much as 15 billion barrels of oil over a 40 year project lifetime.
It also deserves mention that in the northernPiceance Creek basin, zones of high grade oil shale also contain rich concentrations of nahcolite and dawsonite; high-value minerals that could be recovered through solution min-ing.
Strategic Significance of America’s Oil Shale 5

Volume II – Oil Shale Resources Technology and Economics
1.2 Infrastructure 1.2.1 LOCATION AND COMMUNITY INFRASTRUCTURE The Green River Formation underlies parts of Colorado, Utah and Wyoming. This forma-tion is located in the Upper Colorado River Basin. Its semi-arid climate is typical of the high plains region. The largest, closest towns to the oil shale deposits are Grand Junction, Meeker, Rangely, Rifle, Rock Springs and Vernal (see also Figure 2.).
1.2.2 ROADS AND PIPELINES Past and current oil and gas developments, as well as mining operations (trona, potash, etc.) have created a network of roads and pipelines that could be upgraded to serve oil shale de-velopments. The southern Piceance Creek Basin is near Interstate 70 (I-70). A pipeline corridor runs from the Uinta Basin over Bax-ter Pass to the I-70 region in Colorado.
1.2.3 NATURAL GAS Natural gas is indigenous to the area. There is currently major development of natural gas in the area. The ready availability of natural gas could help meet the requirements for hydro-gen production needed to upgrade kerogen oil to refined products.
1.2.4 PETROLEUM Oil production also occurs in and near this re-gion. Oil is currently transported by either truck or pipeline. To the extent that regional petroleum reservoirs are candidates for im-proved recovery by carbon dioxide flooding, these resources may provide economic uses for carbon dioxide produced in the retorting processes. Similarly, previously depleted res-ervoirs (and coal seams) in the region may provide venues for carbon dioxide sequestra-tion.
1.2.5 ELECTRIC POWER The region is a significant producer of electric power with the Bridger Power plant, (3000
MW); Moon Lake (Bonanza) Plant (420 MW), Hayden Power plant, Craig Station, Flaming Gorge, and several plants in the Four Corners area. These power generation facili-ties are adequate to meet process needs, at least in the early stages of development, that may not be supplied by co-generation facili-ties included in the shale project designs.
1.2.6 WATER AVAILABILITY The development of western oil shale re-sources will require water for plant operations, supporting infrastructure, and the associated economic growth in the region. While some new oil shale technologies significantly reduce process water requirements, stable and secure sources of significant volumes of water may still be required for large-scale oil shale de-velopment. The largest demands for water are expected to be for land reclamation and to support the population and economic growth associated with oil shale activity.
Water in the oil shale regions derives from the Colorado River Basin System (Figure 8). This drainage system begins on the Pacific side of
Figure 8. Upper Colorado River Basin Water Resources (Ref. 10)
6 Strategic Significance of America’s Oil Shale

Volume II – Oil Shale Resources Technology and Economics
the Continental Divide in Wyoming and Colo-rado and extends through Utah, and along the borders of Arizona, Nevada and California.
Water availability is a growing concern in the western states as population shifts to the re-gion have placed greater demands on the lim-ited resources. The long-term trends are for transfer of agricultural water to urban and in-dustrial use. The overall allocation of water today is governed by the Colorado River Compact, originally agreed to on November 24, 1922.
Currently there is a mix of both absolute and conditional water rights. Absolute rights are those that have been decreed by the state Wa-ter Court and are available for use. Condi-tional rights are rights that have not been through the Court process and therefore have not been decreed. Therefore, they cannot be used until a decree has been granted and the rights have been determined to be absolute. Conditional rights only preserve a holder’s seniority in accordance with the doctrine of first in time, first in right. In addition condi-tional rights must undergo a diligence test every six years in order to preserve the condi-tional right.
An absolute right is still subject to being cur-tailed (a call) in the event the water balance is insufficient for all rights, and a senior right holder is being injured. To help assure supply it is customary to file an Augmentation Plan which may consist of a plan for reservoir stor-age and release or the purchase of senior rights that can be provided to a senior right holder.
A recent (October, 2003) agreement between the State of California and the Upper Basin States returns about 0.8 million-acre feet per
year to the Upper Basin States that was being over-used by the State of California (Ref. 11). This 0.8 million acre-feet/year increment re-solves some regional issues and is more than enough to support a 2 million barrel/day oil shale industry, should the water be allocated to this use. (See also section 3.2.5 Water Availability). 2.0 Oil Shale Technology Assessment Energy companies and petroleum researchers have, over the past 60 years, developed, tested, enhanced, and in many cases, demon-strated a variety of technologies for recovering shale oil from oil shale and processing it to produce fuels and byproducts. Both surface processing and in-situ technologies have been examined. Generally, surface processing con-sists of three major steps: (1) oil shale mining and ore preparation (2) pyrolysis of oil shale to produce kerogen oil, and (3) processing kerogen oil to produce refinery feedstock and high-value chemicals. This sequence is illus-trated in Figure 9.
For deeper, thicker deposits, not as amenable to surface- or deep-mining methods, the kero-gen oil can be produced by in-situ technology. In-situ processes minimize, or in the case of true in-situ, eliminate the need for mining and surface pyrolysis, by heating the resource in its natural depositional setting. This sequence is illustrated in Figure 10. Both process se-quences are described in greater detail below and in Appendix II – B. – Oil Shale Tech-nologies.
By as early as 1978, the U.S. Department of Energy had concluded that the development of a domestic oil shale industry was technically
RetortingOil
UpgradingOre
MiningResourceFuel and Chemical Markets
Figure 9. Conversion of Oil Shale to Products (Surface Process)
Strategic Significance of America’s Oil Shale 7

Volume II – Oil Shale Resources Technology and Economics
OilUpgradingIn-Situ PyrolysisResource
Fuel and Chemical Markets
Figure 10. Conversion of Oil Shale to Products (True In-Situ Process)
feasible and was ready for the next steps to-ward aggressive commercialization (Ref. 12).
Surface and sub-surface mining technolo-gies were deemed commercially proven and economic.
Numerous surface retorting technologies were largely demonstrated, although addi-tional process design improvements were deemed desirable to improve reliability and to reduce costs.
In-situ technologies, although less costly than surface retorts, had been demon-strated to a more limited degree, but war-ranted additional public and private R&D investment and testing.
Environmental impacts, though significant at the time, appeared to be controllable to meet existing and anticipated regulatory standards with available technological controls in place.
Upgrading and processing technologies to convert kerogen oil to quality fuels and chemical byproducts were considered proven, although on-site processing and new commercial refineries could be re-quired to support a full-scale industry.
The processes were expected to be economically competitive, based on oil price forecasts that followed the Arab Oil Embargo of 1973 and the supply disruptions and price shocks associated with the 1979 Iranian Revolution.
By 1984, reduced tensions in the Middle East and the availability of new petroleum supplies from non-OPEC sources, including production in the North Sea, coupled with decreases in world petroleum demand, caused prices to fall from $31/ Bbl to as low as $10 / Bbl. Numer-ous pilot- and demonstration-scale oil shale
projects that were then under construction or in operation in the United States became un-economic and were subsequently terminated.
Perceptions that projects in the 1980s and 1990s were terminated due to the quality of the resource are incorrect. In fact, it was the abundance, concentration, and high quality of the oil shale resources of the Green River Formation that attracted the billion+ dollars of investment in the first place.
Public and private sector decisions to termi-nate investments in R&D and large-scale demonstration projects were made largely based on evolving economic uncertainties as-sociated with the supply and price of conven-tional petroleum, as well as oil shale plant de-sign issues. For example, design issues in the UNOCAL retort created production bottle-necks that played a major role in Unocal’s decision to shut down rather than retrofit its oil shale retort pilot plant.
Investment uncertainty was further com-pounded by regulatory and policy uncertainty. These uncertainties are now being resolved as petroleum prices firm, the regulatory envi-ronment matures, and the need for additional, diverse energy supplies brings renewed focus to government policy.
In many cases, the technologies developed to produce and process kerogen oil from shale have not been abandoned, but rather “mothballed” for adaptation and application at a future date when market demand for kerogen oil would increase, oil price risk would at-tenuate, and major capital investments for oil shale projects could be justified. Many of the companies involved in earlier oil shale pro-jects still hold their oil shale technology and resource assets. The body of knowledge and
8 Strategic Significance of America’s Oil Shale

Volume II – Oil Shale Resources Technology and Economics
understanding established by these past efforts provides the foundation for ongoing advances in shale oil production, mining, retorting, and processing technology and supports the grow-ing worldwide interest and activity in oil shale development.
2.1 Updating World Oil Shale Technology Activity Although most U.S. oil shale efforts have been largely curtailed for more than a decade, pub-lic and private interest and activity in oil shale resources and technology continues, both in the United States and elsewhere in the world. This continuing interest and effort has enabled the art and science of oil shale mining and conversion, and shale oil processing to ad-vance, albeit slowly.
Public and private entities in several nations are gaining insight from prior oil shale re-search, development and demonstration pro-jects and applying this insight to improve technology efficiency and performance, pro-duce better-quality fuels and byproducts, drive down technology capital and operating cost, increase product value, and to improve envi-ronmental controls and reduce environmental impacts.
At least five nations with significant oil shale resources currently have ongoing oil shale re-search, demonstration or commercial scale processing projects:
United States – In the United States, the re-pository of the world’s largest and most con-centrated known oil shale resources, efforts to commercialize oil shale, last attempted by Unocal, were terminated in 1991. Pockets of research and development interest and activity remain, however, and renewed commercial interest in oil shale is evident.
Among the most promising efforts is a new “true in-situ” approach being developed by Shell. Much of America’s high-quality oil shale resource lies in thick deposits with sig-nificant vertical overburden. These deposits
may be more technically amenable to efficient and less costly in-situ processing than mining and surface retorting. Shell has continued re-search in the Mahogany deposit in Colorado, which could demonstrate the economic and technical feasibility of in-situ development of oil shale and lead to commercial scale opera-tions. Various technological challenges remain – including development of a more reliable heat delivery system. This in-situ process, referred to as the In-situ Conversion Process (ICP), described in more detail below, is quite novel and has the poten-tial to make much deeper, thicker, and richer resources available for development, without the complications of surface or subsurface mining. The product quality of the produced shale oil could also be much better than shale oil produced from surface retorts. The next step, proposed for later in the decade, will be to integrate the various field trials into one, unified demonstration test. The results will influence a commercial project decision based on process technical performance, economic viability, oil-price risk, and permitting and regulatory issues (Ref. 12). Other efforts also seek to advance oil shale technology. The New Paraho Corporation (now Synthetic Technology, Inc.) has devel-oped a very successful and economic process for converting oil shale to a more durable, eas-ier to use, and less costly road asphalt binder while simultaneously producing a by product that can be used as a naphtha feedstock. (Ref. 53). Other organizations and individuals are ex-ploring novel processes for extracting kerogen from oil shale and for converting the kerogen oil to fuels and chemicals. Interest is also growing in small-scale commercial “value en-hancement” oil shale projects that could be made economic at a modest commercial-scale and at oil prices in the mid $20s. The value-enhancement process aims to produce hetero-atom containing specialty high-value chemical
Strategic Significance of America’s Oil Shale 9
Volume II – Oil Shale Resources Technology and Economics
products, and premium asphalt additives, in addition to a slate of high-quality fuels. Canada – Two major activities in Canada are directly relevant to U.S. oil shale industry de-velopment: 1. Canada’s program for tar sand develop-
ment and commercialization can serve as a model for effectively re-stimulating U.S. oil shale industry development.
2. A new surface retort technology, the Al-berta Taciuk Process (ATP) technology, is being commercialized in Australia and is viewed by many as the current state-of-the-art for conventional surface oil shale retorting.
Continuing research, jointly funded by private industry and the Alberta Science and Research Authority) since 1970, has advanced ATP technology to the point of readiness for com-mercial scale demonstration and export. Commercial-scale tar sand technology has steadily grown and is now producing oil at approximately 1 million barrels per day. A new “steam assisted gravity drainage” (SAG-D) in-situ technology, and incentives provided to stimulate commercialization efforts, has enabled Canada to build an industry that can
technically recover as much as 174 billion bar-rels, about 10 percent, of its massive tar sand resource of 1.7 trillion barrels. Recent revisions to proved reserves, based on proven tar sand technology, have caused Can-ada to be ranked second in the world (trailing only Saudi Arabia) in proved petroleum re-serves by Oil & Gas Journal (Ref. 14).
Australia – Southern Pacific Petroleum NL (SPP) is developing Australia’s largest known oil resource, some 17.3 billion barrels of oil held in ten oil shale deposits along the coast of Central Queensland.
Australia’s oil shale resources are silica-based. They are less complex, have fewer impurities, and may be easier to process than carbonate-based U.S. western shales. These Queensland deposits could support production of more than one million barrels of oil per day.
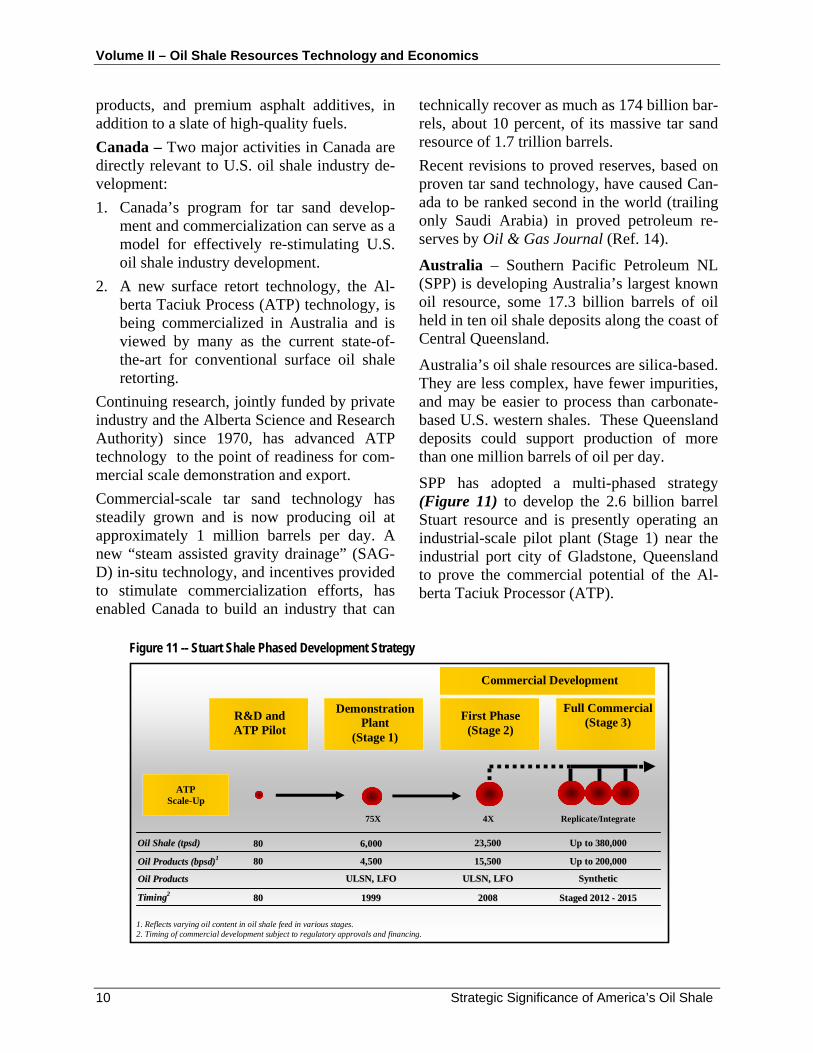
SPP has adopted a multi-phased strategy (Figure 11) to develop the 2.6 billion barrel Stuart resource and is presently operating an industrial-scale pilot plant (Stage 1) near the industrial port city of Gladstone, Queensland to prove the commercial potential of the Al-berta Taciuk Processor (ATP).
10
Figure 11 -- Stuart Shale Phased Development Strategy
8800 66,,000000OOiill SShhaallee ((ttppssdd))
OOiill PPrroodduuccttss ((bbppssdd))11
TTiimmiinngg22
R&D and ATP Pilot
First Phase(Stage 2)
Full Commercial (Stage 3)
DemonstrationPlant
(Stage 1)
Commercial Development
75X 4X Replicate/Integrate
1. Reflects varying oil content in oil shale feed in various stages.2. Timing of commercial development subject to regulatory approvals and financing.
ATP Scale-Up
OOiill PPrroodduuccttss
8800
8800
44,,550000
UULLSSNN,, LLFFOO
11999999
2233,,550000
1155,,550000
UULLSSNN,, LLFFOO
22000088
UUpp ttoo 338800,,000000
UUpp ttoo 220000,,000000
SSyynntthheettiicc
SSttaaggeedd 22001122 -- 22001155
Strategic Significance of America’s Oil Shale

Volume II – Oil Shale Resources Technology and Economics
SPP initially reviewed ten retorting technolo-gies and six were further evaluated at pilot scale. The ATP technology was selected for its simple, robust design; energy self-sufficient process; minimal process water re-quirements; ability to handle fines; and its high kerogen oil yields. The process allows the mechanical transfer of solids through the machine with no moving parts and achieves improved process efficiencies through solid-to-solid heat transfer (Ref.15).
Stuart Stage 1 is a $260 million, 4,500 barrel per stream day (bpsd) demonstration plant that is a 75:1 scale-up of a small pilot plant in Canada that was originally developed to proc-ess oil sand. The Stage 1 plant has operated for more than 500 days and produced more than 1.3 million barrels of oil since 1999, in-cluding 629,000 barrels in 2003. The plant has run in excess of 96 days continuously at peak oil production rates up to 82 percent of nameplate capacity and has achieved sustained oil yield at up to 94 percent of design.
The Stage 1 plant produces a raw shale oil product that is fractionated into two streams of approximately equal proportions. The first stream, Light Fuel Oil (LFO) (24 API, 0.4% S) is sold as-is at a premium into the Singa-pore fuel market as a cutter stock. The second stream, raw naphtha, is hydrotreated to reduce nitrogen and sulphur levels to meet refinery specifications. This product, Ultra Low Sul-phur Naphtha (ULSN) (57 API, S < 1 ppm, N < 1 ppm) is sold to Mobil Oil Australia under a long term contract for the production of gasoline, diesel, and jet fuel.
According to SPP, the successful performance of the ATP at the Stuart Stage 1 plant has demonstrated its technical viability, economic potential, and environmental sustainability.
The next phase of development is the $375 million (2002$) Stuart Stage 2 plant, a 4:1 commercial-sized scale up of Stage 1. It will
process up to 23,500 t/d of shale to produce 15,500 bpsd of LFO and ULSN at operating costs of about $9 to $11 per bbl.
The full commercial plant, Stage 3, will utilize multiple Stage 2 ATP modules to achieve pro-duction of up to 200,000 bpd. This plant will produce a light, sweet, “bottomless” synthetic crude (48 API, 0.01% S). Several different plant sizes have been studied. However, a baseline design incorporating 13 ATP mod-ules and producing 157,000 bpsd of synthetic crude is projected to cost $3.5 to $4.0 billion (2002$), and have operating costs of $7.50 to $8.50 per bbl, after full project implementa-tion is complete.
At this scale, costs for producing oil from shale are very competitive, even when com-pared to comparable-sized conventional off-shore projects in other parts of the world (Fig-ure 12). Although cash operating costs are somewhat higher for oil shale, capital costs (including initial capital amortized over the long project life) are much lower due to negli-gible exploration costs. Once established, a commercial plant at Stuart could produce 200,000 bpd for more than 30 years with no production decline.
Figure 12 – Stuart Shale Stage 3 ~ Projected Profitability at $25/bbl WTI
0.00
5.00
10.00
15.00
20.00
25.00
30.00
Offshore Oil Oil Shale 1.
2.Actual cost structure of GOM, W est Africa, North Sea, Brazil ERA Report July, 1999. . C
elant greenhouse gas mitigation Projected oil shale costs for 157,000 bpsd commercial developm nt (based on Stuart Stage 3 in nal estimates ter
steps (ener efficiency; bio - January 2004), including in -p
mOil shale: average operating costs over 30 year projected life. gy
Oil shale 1.8% (Queensland State); Conventional 12.5% (assu ed average). ethanol co -production).
Long term exchange rate A$/US$ = 0.65.3.
4. 5. cted life) and average annual sustaining capital. Offshore oil:
Oil shale: initial capital (amortised over 30 year projefinding and development costs.
11.78 1 3 .7 0
3.12 0.50 3.60 7.40 6.50 3.40
Offshore Oi l1 Oil Shale
2
Pre-tax Profit
Royalty 3 Operating Cost s
4 Capital Cost s5
$/bbl
Strategic Significance of America’s Oil Shale 11
Volume II – Oil Shale Resources Technology and Economics
The Australian government has encouraged the Stuart Shale Project with incentives, pri-marily an excise tax rebate for naphtha that is used to make gasoline in refineries in Austra-lia. This rebate applies only to naphtha from the Stage 1 plant until the end of 2005.
At the ultimate production level of 200,000 bpd, SPP estimates the Stuart Oil Shale Pro-ject will stimulate investment of $5 to $6 bil-lion, improve Australia’s balance of payments by $2 billion per year, and create 15,000 per-manent jobs (Ref. 16).
Cost overruns in a capital improvement pro-gram in 2003 resulted in a greater than ex-pected drawdown of corporate cash reserves. Due to the deterioration in the company’s fi-nancial position, SPP’s secured creditor placed the company into receivership. Subse-quently, Sandefer Capital Partners contracted to acquire most of the assets of SPP through a new company, Queensland Energy Resources Limited (QERL). Following completion of the transaction, expected by mid-2004, QERL will conduct a careful evaluation of its resources and technology in the hopes of advancing a prudent and responsible plan to continue de-velopment of the Stuart resource.
The Stage 1 plant has continued to operate during this process to demonstrate the viabil-ity of the technology and plans are in place to further improve performance towards design yield and rates.
Estonia – Estonia has been processing oil shale since the 1920s. Estonian oil shale re-sources are currently put at 5.5 billion tons including 1.7 billion tons of active (mineable) reserves. At its peak in 1980, Estonia was producing and using some 31 million tons of oil shale per year. In 1999, 11 million tons of oil shale were produced.
Until recently, more than 80 percent of Esto-nian oil shale production was pulverized and used as boiler fuel for electric power genera-tion, by Eesti Energia, the Estonian national
electric power company. About 16 percent of the mined production was used in petroleum and chemical manufacturing, and the rest was used in cement production. In 1981, a new nuclear power station came on line in Lenin-grad, Russia and triggered a decline in Esto-nian oil shale production for power genera-tion. The Estonian government has taken ini-tial steps towards privatization of the oil-shale industry (Ref. 17).
Today, three (3) commercial retort operations produce about 8,000 bbl/day of shale oil. Two of these operations (VKG at Kohtle-Jarve and the former Ras Kivioli) use retorts known as the Kiviter retorts. Oil shale lumps (>25mm) are fed to the top of the retorts and retorted by a cross-flow of combusted retort gas recycled from production. These retorts operate rela-tively trouble-free and have been modified a number of times during their operations, start-ing in the 1960s.
The other type of retort is known as the Ga-loter retort, essentially a hot solids recycle, rotary kiln design. There are two such retorts operated by Eesti Energia. These are newer retorts, built in the early 1980s, and can han-dle oil shale fines. With the current elevated price of oil, all available retorts in Estonia are running at full capacity.
The Viru Keemia Grupp (VKG), a private Es-tonian chemical company, plans to construct a new $220 - $240 million oil shale processing project between 2005 and 2009 to take advan-tage of markets for shale oil and high-value by-chemical products. VKG has selected the ATP technology designed in Canada and proven in Australia for its project. VKG cites the environmental benefits of the ATP tech-nology as a major driver for technology selec-tion. These benefits include emissions control-lable to achieve European Union limits; spent shale with total organic carbon less than 3 percent; and zero water emissions from the ATP process. VKG will license the ATP tech-nology from the Alberta Research Council
12 Strategic Significance of America’s Oil Shale

Volume II – Oil Shale Resources Technology and Economics
with rights to sublicense the technology in Es-tonia and Russia.
The proposed plant will have annual produc-tion of 4 million barrels of liquid fuels (naph-tha and distillate), 120 million cubic meters of fuel gas, and 12,000 tons of high value chemi-cal compounds including phenols, cresols, and xylenols and alkylresorcinols. The value of these chemicals, estimated at $1,500 per ton, significantly improves the project’s economics (Ref.18). The project is estimated to achieve break-even financial feasibility operating at as low as 30 percent of faceplate capacity, as-suming a Brent crude oil price of $21/bbl or higher. At 50 percent utilization, the project is economic at a Brent crude price of $18/bbl. At full capacity, it could be economic at Brent crude prices as low as $13/Bbbl.
Although the cost of such inputs as mined shale and labor, are likely less in Estonia than they would be in U.S. western shales, VKG’s estimates suggest that small scale commercial plants with a value-enhanced product slate can be economic at relatively low world oil prices using the ATP technology. (Ref. 18).
Brazil – The oil shale resource base in Brazil is ranked among the largest in the world. It was first exploited in the late Nineteenth cen-tury. The Ministry of Mines and Energy quotes end-1999 shale oil reserves as 445.1 million m3 oil (inventoried) and an additional 9,402 million m3 (estimated) with shale gas reserves as 111 billion m3 (inventoried) and an additional 2,353 billion m3 (estimated) (Ref. 19). (One (1) m3 oil is 6.29 barrels and approximately .92 metric tons. Gas reserves are assumed to be standard cubic meters.)
The world’s largest surface oil shale pyrolysis reactor is the Petrosix 11-m vertical shaft Gas Combustion Retort (GCR) used in Brazil’s oil shale development program. It was designed by Cameron Engineers, which also designed and built the U.S. Bureau of Mines GCR and, later, the Paraho GCR. Focusing on the oil shale deposits at São Mateus do Sul, the com-
pany brought a pilot plant (8 inch internal di-ameter retort) into operation in 1982 to use for oil shale characterization, retorting test, and evaluation of new commercial plants. A 6-foot (internal diameter) retort demonstration plant followed in 1984 and is used for the optimiza-tion of the Petrosix technology.
A 2,400 (nominal) tons per day, 18-foot (in-ternal diameter) semi-works retort (the Irati Profile Plant), was originally brought on line in 1972, and began operating on a limited commercial scale in 1980. A larger commer-cial plant – the 36-foot (internal diameter) In-dustrial Module retort was brought into ser-vice in December 1991. Together the two commercial plants process some 8,500 tons of bituminous shale daily (Ref 19).
The 11-meter (36 foot) Petrosix retort yields a nominal daily output of 3,870 barrels of shale oil, 132 tons of fuel gas, 50 tons of liquefied shale gas and 82 tons of sulfur. Total output of shale oil in 1999 was 195.2 thousand tonnes. (Refs. 19 - 21) The Petrosix process, which is similar to the Paraho technology, is considered a highly reliable technology for use with U.S. oil shale.
China – The People’s Republic of China is the fastest growing importer of crude oil and petroleum products in the world. China has produced oil from shale since the 1920s. Shale oil production decreased by more than 50 per-cent from its 1959 peak of 780,000 tons to about 300,000 tons by the 1980s, following discovery of significant conventional petro-leum resources in the Daqing field in 1962. More than 200 old-style retorts were shut down in Fushun and Maoming. Sixty new retorts were put in place in the 1990’s by the Fushun Bureau of Mines and 20 additional retorts were added in 1998, restoring about 90,000 tons of oil per year of shale oil produc-tion at Fushun by 2002.
Today, rapid increases in petroleum demand and increasing world oil prices are sparking additional interest in expanding China’s oil
Strategic Significance of America’s Oil Shale 13

Volume II – Oil Shale Resources Technology and Economics
shale industry, including the addition of larger scale retorts and advanced retorting technolo-gies to increase output and reduce environ-mental impacts. Additional projects in other regions plan to retort an additional 10,000 tons per day of oil shale to produce about 1000 tons per day of shale oil, quadrupling shale oil production. (Refs. 22 – 24).
2.2 Advances in Oil Shale Technology The various processes for producing fuels and chemicals from oil shale are shown in Figure 13. These include progressive improvements that have extended and advanced the state-of-the-art .
The processes involve heating (retorting) oil shale to convert the organic kerogen to a raw oil. There are two basic oil shale retorting ap-proaches. Conventional surface retorts involve mining the oil shale by surface or underground mining, transporting the shale to the retort fa-cility, retorting and recovering the raw kero-gen oil, upgrading the raw oil to marketable products and disposing of the “spent” shale.
In-situ processes introduce heat to the kerogen while it is still embedded in its natural geo-
logical formation. There are two general in-situ approaches; true in-situ in which there is minimal or no disturbance of the ore bed, and modified in-situ, in which the bed is rubblized, either through direct blasting with surface up-lift or after partial mining to create void space. Recent technology advances are expected to improve the viability of oil shale technology, leading to commercialization. These advances are summarized in Table 1.
2.2.1 OIL SHALE MINING Advances in mining technology continue in other mineral exploitation industries, includ-ing the coal industry. Open-pit mining is a well-established technology in coal, tar sand and hard rock mining. At a large scale, direct mining costs are often less than $1/ton.
Room and pillar and underground mining have previously been proven at commercial scale for U.S. western oil shales. Costs for room and pillar mining will be higher than for surface mining, but these costs may be par-tially offset by having access to richer ore. Size reduction (crushing) costs may add as much as $1/bbl.
Figure 13. Generalized Processes for Conversion of Shale to Fuels and Byproducts
Oil Shale Deposit
Fracturing
Retorting
Product Recovery
Refining
Retorting
Crushing
Mining
Spent Shale
Liquid Fuels By-Products
In-Situ Conventional
CombustionHot GasesSteamGradual Heating*
NaturalHydraulicExplosiveDrilling & Dewatering*
In-Formation
Gas DriveArtificial Lift
Thermal & Chemical Treating
HydrogenationMild-Cat. Crack.Hydrocraking
GasolineDiesel FuelJet FuelDistillate Fuel OilResidual Fuel OilLiquefied Petroleum Gas
AmmoniaSulfurAromaticsCokePitchAsphaltWax
Utilize
DisposeMine FillRevegetateDump
Underground
Open Pit
Room & PillarCut and FillBlock Caving
ATPGas CombustionUnionToscoHydrogen AtmosphereKiviter Galoter
BureauPetrosixKerogen Oil
Hydrocarbon Gases*
* Recent advances contributedby Shell ICP
14 Strategic Significance of America’s Oil Shale

Volume II – Oil Shale Resources Technology and Economics
Table 1. Advances in Oil Shale Technology
Stage Process Type Advances Status Project Open-Pit Minor advances continue to reduce costs Demonstrated at
commercial scale Stuart ; Alberta Mining
Underground Room and pillar approaches Demonstrated commercial scale
Unocal; Others
Conventional Shale pre-heating increases gas and oil yields; extracts intermediate products before high temperature pyrolysis Combusting carbon residue on pyrolized shale generates process heat; reduces emissions and spent shale carbon content Recirculation of gases and capture of connate water from shale minimizes proc-ess water requirements. Lower heat rates reduce plasticization of kerogen-rich shales
Demonstrated at pilot scale in ATP
Stuart Shale
In-Situ Slower heating increases oil and hydro-carbon gas yield and quality. Recovery of deeper resources enabled by heating technology Improved ability to control heat front by controlling heaters and back pressure
Proven at field scale Indicated Proven
Shell ICP Shell ICP Shell ICP
Retorting
Novel Processes Supercritical extraction processes Higher heating rates Shorter “residence” durations “Scavengers” (hydrogen or hydrogen transfer/donor agents) Solvent extraction of kerogen from ore Thermal solution processes
Concept Research Proven Research Research Research
ATP
Processing Value Enhance-ment
Separates nitrogen element for chemicals while generating fuels feedstocks
Proof of concept – 1 yr from demo
Bunger, et al.
Current mining advances continue to reduce mining costs, lowering the cost of shale deliv-ered to conventional retort facilities. Restora-tion approaches for depleted open-pit mines are demonstrated, both in oil shale operations and other mining industries.
2.2.2 SURFACE RETORTS Numerous approaches to oil shale pyrolysis were tested at pilot and semi-commercial scales during the 1980s (Ref 55). The princi-pal objectives of any retorting process are high yields, high energy efficiency, low residence time and reliability.
Larger-than-pilot-scale tests were made by TOSCO, Paraho, and Exxon. UNOCAL oper-ated a full-scale commercial module. Occiden-tal ran a large-scale modified in-situ (MIS)
project. These are discussed in greater detail in the appendices.
The surface retorting technology that is gar-nering the most attention today is the Alberta Taciuk Processor (ATP). The ATP process, initially designed for extracting bitumen from tar sand, combines use of gas recirculation and direct and indirect heat transfer from circu-lated hot solids in a rotating kiln environment (Figure 14). The process allows the energy self-sufficient transfer, retorting and combust-ing of shale ore. Some of the hot processed shale that is recirculated into the retort section, mixing with the fresh feed, and providing the heat for pyrolysis by direct, solid-to-solid heat transfer.
ATP promises to improve on previous surface retort technologies, including the TOSCO II gas combustion retort, in a variety of ways.
Strategic Significance of America’s Oil Shale 15

Volume II – Oil Shale Resources Technology and Economics Figure 14. ATP Schematic (Ref. 25)
ATP increases kerogen oil and combustible gas yields, improves thermal efficiency, re-duce process water requirements, and mini-mizes residual coke remaining on spent shale, thus improving its qualities for environmen-tally-safe disposal.
Environmental controls minimize SO2, NOx, CO2 and particulate emissions. Importantly, the ATP process has been identified by private interests in both Australia and Estonia as the leading technology for continuing develop-ment of their respective oil shale resources, as described below. In Australia, the ATP tech-nology was selected by Southern Pacific Pe-troleum for its simple, robust design; energy self-sufficient process; minimal process water requirements, ability to handle fines, and for
cited by VKG in Estonia for making its tech-nology selection (Ref. 25).
The ability to handle fines
its kerogen oil yields. A similar rationale was
is important for
2.2.3 IN-SITU PROCESSES – ajor ad-
U.S. shales, which are high in friable carbon-ate minerals and tend to disintegrate into small particles when agitated. These particles can find their way into the pyrolized shale oil and be very difficult and costly to remove. How-ever, ATP has not yet been tested and demon-strated for U.S. western oil shales.
The mvances in in-situ processing are found in a new true in-situ process. Shell has developed and patented a new technology, known as the in-situ conversion process (ICP) (Figures 15 and 16). ICP could potentially produce high quality transportation fuels from oil shale, oil
HEATED RICH ZONE
OVERBURDENOR LEANER
GRADESHEATERPRODUCER
INLETFACILITIES
GAS TREATMENT &Oil STABILIZATION
OIL STORAGE
Figure 15. Overview of In-Situ Conversion Process
16 Strategic Significance of America’s Oil Shale

Volume II – Oil Shale Resources Technology and Economics
Figure 16. In-Situ Process Detail
FEB 02Increasingly SURE
Tight Overburden
Low Perm Shale Lower Seal
Lean Shale / Fracture porosity
Rich Shale
Rich Shale
Rich Shale
High quality product to facilities
HeatersProducerwell
Freeze wallbarrier
Lean Shale / Fracture porosity
Lean Shale / Fracture porosity
Lean Shale / Fracture porosity
sand, and coal in a technically, economically and environmentally sound manner.
The ICP process, when applied to oil shale,
ing opera-
of scale are important, and are driven by the
peline shipments also fall, on a
ses eliminates)
produces a range of gases including propane, hydrogen, methane, and ethane, as well as high quality liquid products – jet fuel, kero-sene, and naphtha – after the initial liquid product is hydro-treated. The ICP process in-volves placing either electric or gas heaters in vertically drilled wells and gradually heating the oil shale interval over a period of several years until kerogen is converted to hydrocar-bon gases and kerogen oil which is then pro-duced through conventional recovery means.
The ICP process appears to improve heat dis-tribution in the target deposit, overcoming heat-front control problems traditionally asso-ciated with other in-situ combustion proc-esses. Due to the slow heating and pyrolysis process, the product quality is improved and subsequent product treating is less complex, as compared to oil produced by surface retorting or conventional in-situ approaches.
In the ICP process, traditional mintions are replaced with well drilling, heat de-livery systems, containment/freeze wall chill-ers, and product gathering piping. Economies
need for energy efficiency, cost effective up-grading, and reasonable logistics / infrastruc-ture costs. It is important to maximize the vol-ume of the heated oil shale compared with the surface area of the overburden so that heat loss is minimized. This helps minimize pro-duction costs.
Capital and operating costs for product up-grading and pi$/bbl basis, as the total throughput increases. When targeting transportation fuel production, economies of scale favor shale oil projects larger than100,000 bbl/day. The company be-lieves that the technology should be profitable at or about $25/bbl. However, as it will take many years before the product stream (and therefore revenue) reaches steady state pro-duction (well after hoped-for first generation commercial start up early in the next decade) and because the process is so capital intensive, the economic risk is very high, even if the technology start up flawlessly.
According to Shell, the ICP process signifi-cantly reduces (and in some cathe environmental impacts resulting from pre-vious shale oil recovery techniques. The ICP method involves no open-pit or sub-surface mining, creates no leftover piles of surface
Strategic Significance of America’s Oil Shale 17

Volume II – Oil Shale Resources Technology and Economics
tailings, and minimizes unwanted byproducts and water use. Much more oil and gas may be recovered from a given area utilizing the ICP process, since the early indications show that hydrocarbon products can be produced at greater depths than would be accessible by other technologies.
Shell is currently operating a modest field re-search effort in northwestern Colorado’s
ciencies that reduce the
processing
Piceance Basin to test ICP’s viability on the basin’s world-class oil shale reserves. Al-though initial results are very promising, deci-sions to expand and advance the research ef-fort, leading to a decision to proceed with in-vestment in commercial–scale operations, will depend on overcoming certain technical hur-dles and perceptions of future market condi-tions and investment risks. (Ref 26.)
2.2.4 NOVEL AND ADVANCED CONVERSION PROCESS CONCEPT Both conventional and in-situ retorting proc-esses result in ineffivolume and quality of the produced shale oil. Depending on the efficiency of the process, a portion of the kerogen that does not yield liq-uid is either deposited as “coke” on the host mineral matter, or is converted to hydrocarbon gases. For the purpose of producing shale oil, the optimal process is one that minimizes the regressive thermal and chemical reactions that form coke and hydrocarbon gases and maxi-mizes the production of shale oil.
Novel and advanced retorting and upgrading processes seek to modify the chemistry to improve recovery and/or create high-value by-products. Novel processes are being researched and tested in lab-scale envi-ronments. Some of these approaches include: Lower heating temperatures; higher heating rates; shorter residence time durations; intro-ducing “scavengers” such as hydrogen (or hy-drogen transfer/donor agents); and introducing solvents (Ref. 27).
A thermal solution process, still in lab-scale development, represents a radical departure from conventional oil shale retorts and in-situ retorts (Figure 17). The process incorporates thermal solution in a recycle solvent for re-covery of shale oil, followed by leaching of the spent shale with hot water to recover valu-able mineral by-products, including soda ash, alumina, and a stream suitable for processing to Portland cement.
According to the researcher, the process achieves enhanced oil yields (up to 150 per-cent of the Fischer Assay versus about 90 per-cent for conventional retorts); low olefin oil that is more stable for storage or shipping than conventional kerogen oil which must be hy-droprocessed immediately; improved recovery of by-products (40 pounds of alumina, 160 pounds of soda ash, and 800 pounds of Port-land cement base per ton of oil shale); and re-duced environmental impacts due to lower volumes of spent shale for disposal (Ref. 27).
Many elements of this process still need to be proven at demonstration-scale outside of the lab, before feasibility at commercial-scale can be determined.
Figure 17. Thermal Solution Process
18 Strategic Significance of America’s Oil Shale

Volume II – Oil Shale Resources Technology and Economics
2.2.5 SHALE (KEROGEN) OIL UPGRADING AND PROCESSING Kerogen oil is the pyrolysis product of the or-ganic matter (kerogen) contained in oil shale rock. The raw kerogen oil produced from re-torting oil shale can vary in properties and composition. Table 2 illustrates some of these variations. The two most significant character-istics of U.S. western oil shales are the high hydrogen content, derived primarily from high concentrations of paraffins (waxes), and the high concentration of nitrogen, derived from high concentrations of pyridines and pyrroles.
The waxes give value to the fuel products for use as diesel and jet fuels, but can require spe-cial processing to improve the freeze point properties. The nitrogen compounds give the kerogen oil value for manufacturing specialty chemicals.
2.2.6 VALUE ENHANCEMENT PROCESSES Research sponsored by the U.S. Department of Energy and the Republic of Estonia, shows attractive potential for profitable, near-term
development of value enhancement processes at a small scale (e.g. 10,000 to 20,000 bbl/day).
In prior attempts to substitute shale oil for pe-troleum as a source for fuels, a costly catalytic hydro-processing step has been used to re-move the heteroatoms. In such cases, the value of the final product, governed by the price of crude oil, has been insufficient to offset the costs of production and upgrading.
If, instead of removing heteroatoms by cata-lytic hydroprocessing, the heteroatom-containing compounds are extracted for their chemical values, the economics are dramati-cally improved. Not only do the chemicals improve the revenue stream but the remaining oil, representing the majority of the barrel, is now readily upgraded to a premium petroleum substitute. (Ref. 28).
In the value-enhancement approach, heteroa-tom-containing compounds are extracted and refined to marketable chemicals. A schematic of the approach is shown in Figure 18.
Figure 18. Value Enhancement
raffinate extract
Value-Enhancement Processing
Raw Kerogen Oil
Extraction
Petroleum Refining
Chemical Processing
Petroleum productsFuels, Lube Oil,
Specialty ChemicalsPharmaceuticals, Agrochemicals ...
Strategic Significance of America’s Oil Shale 19

Volume II – Oil Shale Resources Technology and Economics
Gravity, API Pour Point, °F Nitrogen (Dohrmann% Sulfur (X-ray F), wt. %Oxygen (neutron act% Carbon, wt. % Hydrogen, wt. % Conradson carbon, wBromine No. SBA wax, wt. % Viscosity, SSU.: 100° F 212° F Sediment, wt. % Ni, p.p.m V,p.p.m. Fe, p.p.m. Flash (O.C.)°F Molecular weight Distillation 450° at Vol. % 650° at Vol. %
5 Vol% at °F 10 20 30 40 50 60 70 80 90 95
Kerogen oil may bGreen River Formhigh in oxygen, as (Estonia). The mocontaining compoually higher than 30percent. Nitrogen cdines) that are vchemicals are selekerogen oil. The eproduce pure comwith special propeconcentrates may b
20
Table 2. Composition and Properties of Selected U.S. Shale Oils (Cameron Engineers, 1975, Shell 2003)
Gas Combustion Retorting Process
Tosco Retorting Process
Union Oil Retorting Process
Shell ICP Process
19.8 21.2 18.6 38 83.5 80 80
), wt. 2.14 ±0.15 1.9 2(KJELDAHL) 1
0.6999 ±0.025 0.9 0.9 (P BOMB) 0.5 .), wt. 1.6 0.8 0.9 0.5
83.92 85.1 84. 85 11.36 11.6 12.0 13
t.% 4.71 4.6 4.6 0.2 33.2 49.5 Not available 8.1 Not available 6.9 (MEK)
270 476
106 39
210 47
0.042 Not available 0.043 6.4 6 4 1 6.0 3 1.5 1
108.0 100 55 9 240 192 (COC) 328 306 (Calculated)
11.1 36.1
23 44
5
30
TBP/GC 45 84
378 200 390 226 438 275 465 271 529 410 565 329 607 500 640 385 678 620 710 428 743 700 775 471 805 775 830 516 865 850 980 570 935 920 624
1030 696 1099 756
e high in nitrogen, as from ation oil shale (U.S.A.), or from the Kukersite oil shale le-percent of heteroatom-nds in these liquids is usu- percent and may exceed 50 ompounds (primarily pyri-
aluable for manufacturing ctively extracted from the xtract would be refined to pounds and concentrates
rties. These chemicals and e used to manufacture ag-
rochemicals, detergents/ surfactants, anti-bacterials, polymers for tire cords, photo-voltaic receptors for solar panels, anti-strip asphalt additives, solvents, and other industrial and consumer products. These products, with values ranging from $60 to $600/Bbl, could serve domestic and export markets (Ref. 28.)
2.2.7 UPGRADING OF OIL FOR REFINERY FEEDSTOCK One of the most significant characteristics of Green River kerogen oil is its high hydrogen content, which is due to the high concentra-tions of paraffins (waxes). Waxes give value
Strategic Significance of America’s Oil Shale

Volume II – Oil Shale Resources Technology and Economics
Table 3. Properties and Composition of Hydrotreated Refinery Feedstock (Ref. 7, 26, 28)
Properties Unocal hydrocracked
JWBA raffinate
Hydrotreated ICP Oil
Gravity, degrees API 40 36.8 49 Specific gravity 15/15 .825 0.841 0.784 Sulfur, ppm 5 200 50 Nitrogen, ppm 20 1200 <1 UOP K Factor 12.0 Pour Point C < -4 4 NA Viscosity at 37 C cSt 3.3 Distillation yields, weight percent Estimated from Reeg (33)
<200 oC 24 29.8 32
200-275 oC 23 16.2 38
275-325 oC 17 12.3 20
325-400 oC 22 23.2 9
400-538 oC 14 18.5 1
Composition, weight percent NA-Not available n-paraffins 34.8 41 i-paraffins 35.7 19 naphthenes 14.7 29 aromatics 12.1 11 olefins 2.7
to the oil for use as diesel and jet fuels and result in high yields of valuable products in fluid catalytic cracking units when manufac-turing gasoline.
Specifications for various refinery feedstocks are given in Table 3. In conventional process-ing, Unocal catalytically hydrocracked raw kerogen oil. The process was both severe and costly, but resulted in a premium refinery feedstock. In the value-enhancement process, the raffinate, which has had its most problem-atic nitrogen removed, is hydrotreated under mild (~300°C), and low-cost conditions. This yields a refinery feedstock nearly as good as the Unocal feedstock. A comparison with the ICP oil shows the premium quality of this in-situ oil, which is almost entirely atmospheric distillate. Each of these oils would have a higher value than the market price of crude (NYMEX-West Texas intermediate). In gen-eral, oil from Green River oil shale is high in
hydrogen and exhibits excellent properties for manufacturing aviation turbine fuel and diesel fuel. These products also produce less carbon dioxide per unit of energy.
2.3 Conclusions about Oil Shale Technology, Potential, and Timing The current state of shale oil production, min-ing, retorting, and upgrading technologies are sufficiently advanced to support the imple-mentation of a new generation of oil shale projects by 2011 along with the development and commercialization of a domestic oil shale industry of 2 MM Bbl/day by 2020.
Existing open-pit, and room and pillar mining techniques have been commer-cially proven in the mineral process indus-tries and are adaptable to mining oil shale. Additional techniques will likely be required for deeper resources.
Strategic Significance of America’s Oil Shale 21

Volume II – Oil Shale Resources Technology and Economics
At least five alternative conventional surface retorting processes and approaches are also available, and have been tested in the United States using U.S. western oil shales, but not at commercial scale.
Although no commercial-scale retort has been demonstrated in the United States, worldwide experience with commercial-scale technologies has been met with suc-cess in Estonia, Brazil and China using modified versions of 1970s-era retort tech-nology.
The Alberta Taciuk Process may represent the current state-of-the-art for surface retort-ing operations. The design benefits of the ATP process are its one-step, thermody-namically efficient, direct-heating features. The success of ATP in Australia, suggests that it may be successful in the United States with significant reductions in cost over ear-lier technologies. However, ATP has not yet been demonstrated in the United States, or using U.S. western shales.
In-situ processes requiring minimal mining and restoration can be significantly less costly than conventional oil shale processes in several known deposits where it is appli-cable. A variation of the “pure in-situ” ap-proach, embodied in Shell’s In-Situ Conver-sion Process, may represent the most effec-tive in-situ process to date. This process has the potential to access much deeper oil shales, opening resources that were previ-ously deemed inaccessible.
Chemical processes have high potential for extracting high-value by-products that im-prove the economics of the overall process. Small-scale value enhancement projects may be initiated more quickly than larger scale conventional or in-situ projects, due to im-proved economics, once the technology is proven. The potential of this approach is limited, however, by the size of the market for nitrogen-based chemicals.
Determining the best technology application for any oil shale project depends on the loca-tion, the setting, and the composition of the target oil shale deposit(s) and requires indi-vidual design considerations to maximize its economics.
Other novel processes for chemical and/or thermal extraction of kerogen from shale may yet be proved, but are open to addi-tional industry research opportunity.
Environmental control technologies devel-oped for other mining, petrochemical indus-tries, and electric power generation appear to be applicable for controlling impacts of scaled up oil shale development.
As discussed later in this volume, the experi-ence of the tar sand development in Alberta, Canada may prove to be a direct analog by which the U.S. government can assess the po-tential, pace of development, and issues asso-ciated with commercialization of the U.S. oil shale resource.
The scope and immediacy of potential public actions to remove development constraints and to encourage private investment will likely be a greater determinant of the pace and timing of oil shale industry development than will be the readiness of the technology.
3.0 Environmental and Regulatory Issues Production of U.S. western oil shales will be focused in a relatively concentrated land area in parts of the states of Colorado, Utah, and Wyoming. As described in the Resource Characterization section of this report, the na-tion’s richest oil shale deposits are located in the Uinta Basin and Piceance Creek Basin. Developing and operating industry-scale oil shale mining, production, and processing fa-cilities could unfavorably impact the environ-ment and some current uses.
22 Strategic Significance of America’s Oil Shale

Volume II – Oil Shale Resources Technology and Economics
This region is largely rural and semi-arid. These areas are remote from major population centers, but do contain small towns and cities that make their livelihoods primarily from economic activity focused on oil and gas pro-duction, mineral processing and agriculture. Other current uses include ranching, outdoor recreation, and vacation and retirement homes. With the possible exception of natural gas and nahcolite leases discussed elsewhere, no major conflicts with other developments are ex-pected. Oil shale development, therefore, could be viewed as consistent with historic economies and as a technological extension of current activities.
The identified resource sites are proximate to current oil and gas production where roads and utilities are partially developed. Products could be pipelined through current installa-tions where declining petroleum production is providing spare capacity, or through new pipe-lines that could parallel established pipeline corridors if new lines are required.
The potential environmental impacts of oil shale development pertain to air and water quality, land use and reclamation, socioeco-nomic, resource allocation and other consid-erations. Stringent discharge standards will mandate maximum recycle of process water, providing the added benefit of low water con-sumption.
Standards are now established in State and Federal laws and regulations, unlike 25 years ago, when regulations and permitting proc-esses protecting the environment and control-ling development were in their infancy. It should be noted, however, that the Department of the Interior conducted a comprehensive Programmatic Environmental Impact State-ment for the Prototype Oil Shale Leasing Pro-gram that was determined to be exhaustive and objective by virtually all of the hundreds of State, Local, and Federal government enti-ties, NGOs, and other stakeholder organiza-tions that participated in the planning and
permitting process. This body of technical, environmental, and socio-economic data pro-vides a valuable baseline resource that can be updated for future decision-and should be used whenever possible.
Technology advances now enable industrial projects to control and limit emissions and dis-charges and other impacts to predetermined levels that would be established in the permit-ting process. The integration of advanced technologies could be used to control and mitigate environmental impacts and if analo-gous natural resource developments are a guide, could achieve these objectives at rea-sonable costs.
3.1 Oil Shale Processes that Impact the Environment There are two basic retorting approaches. Conventional surface retorts involve mining the oil shale by surface or underground mining methods described above, moving the mined shale ore to a retort facility, retorting and re-covering shale oil and other gases, and cooling and disposing of the “spent” shale material.
In-situ retorts involve introducing heat to the kerogen while it is still embedded in its natu-ral geological setting beneath the earth’s sur-face. Pure in-situ processes drill access shafts to reach the shale layer(s), apply process heat to the shale by heaters or direct combustion, and move the resulting shale oil and gases to the surface through conventional oil and gas wells. Modified in-situ processes create a much larger shaft to transport personnel and equipment to the shale formation, fracture and rubblize a portion of the shale resource, and ignite the rubblized shale to generate heat for pyrolysis.
Under most conventional and in-situ proc-esses, the kerogen oil produced must be re-fined or upgraded to stabilize it and render it suitable for transportation and use as feed-stock in conventional petroleum refineries or chemical plants. These processes are de-
Strategic Significance of America’s Oil Shale 23

Volume II – Oil Shale Resources Technology and Economics
scribed in greater detail in the technology as-sessment sections of this report and the oil shale technology appendix.
The broad range of potential environmental impacts and the issues they raise relative to the feasibility of commercializing specific processes and a domestic oil shale industry are discussed below.
3.2 Impacts and Issues 3.2.1 OIL SHALE MINING IMPACTS Because oil shale deposits may be near-surface or deeper, and in thin or thick beds, a matrix of recovery techniques will be required to access the resource base. The deeper and thicker beds may be more accessible through in-situ recovery (see below), whereas the near-surface and outcropping beds are more ame-nable to mining and surface processing.
A 2 million bbl/day surface retorting oil shale industry would require 1 billion tons of raw shale ore material per year. Based on U.S. De-partment of Interior estimates, the cumulative surface area impacted by a domestic oil shale industry implemented in the most optimal set-tings, over its lifetime of 40 years, would be about 31 square miles per million barrels of daily shale oil production capacity. By this unit of measure, a 2 million Bbl/D oil shale industry would impact 62 square miles over its lifetime. As shown in Figure 19, this repre-sents only a fraction of one percent of the total land area of the oil shale region.
Typical production from near-surface deposits could conservatively yield about 100,000 bbls/acre, a very large production for a rela-tively small area of disturbance. Under some scenarios, the yield could be as high as 300,000 bbls/acre. This also means that the cost of reclamation will be small in relation-ship to the extracted value of oil.
Open-pit mining involves significant surface disturbance and can impact surface water run-off patterns, subsurface water quality, fugitive
duspasandthalanmineryres
Unfacactvaruseminwil
Enof of itedemThundloc
24
Figure 19. Surface Area Impact of 1 MMBbI/DIndustry
t controls, and flora and fauna. Extensive t experience with open pit mining of coal oil shale in this region has demonstrated t the impacts can be minimized and that the d can be beneficially restored following eral extraction. Among the various recov-
approaches, open pit mining is likely to ult in the highest recovery of resource.
derground mining involves much less sur-e disturbance, but does entail subsurface ivity and involves tailings disposal. While ious underground mining processes may be d, depending on subsurface geologic and eral conditions, room and pillar mining
l likely prevail.
vironmental issues will include protection aquifers, and the controlling and disposing mine water. Surface impacts can be lim-, but will include run-off and fugitive dust
issions from surface-level shale storage. e use of heavy equipment for open-pit or erground mining potentially could degrade
al ambient air quality.
Strategic Significance of America’s Oil Shale

Volume II – Oil Shale Resources Technology and Economics
3.2.2 RETORTING AND PROCESSING IMPACTS Air Quality: Most U.S. western oil shale source rock is a carbonate-based kerogen-bearing marlstone. Retorting involves heating the source rock, embedded with kerogen, to temperatures between 450 and 550 degrees centigrade. Heating carbonate rock to these temperatures generates not only kerogen oil, but also a slate of gases, some of which can be beneficially captured and re-used in plant op-erations or sold for conventional energy use.
The off-gases and stack gases of oil shale processes contain principally: oxides of sulfur and nitrogen, carbon dioxide, particulate mat-ter, water vapor and hydrocarbons. Also a po-tential exists for the release of other hazardous trace materials to the atmosphere, such as polynuclear aromatic organic matter – a com-plex array of condensed, aromatic organic compounds, and trace metals. (Ref. 29) Com-mercially available stack gas cleanup technol-ogy could be used to limit emissions to within permitted quantities.
Gases such as CO2, are generated in large quantities and may need to be captured and processed, or sequestered. The design re-quirements will need to be responsive to the prevailing regulatory environment. With sig-nificant oil production in close proximity to the oil shale regions of Utah, Colorado, and Wyoming, potential beneficial use for signifi-cant quantities of CO2 for improved oil recov-ery may exist. Opportunities may also exist to sequester CO2 from oil shale operations in de-pleted oil and gas reservoirs. NOx and SO2 can most likely be controlled using commer-cially proven technologies developed for pe-troleum refining and coal-fired power genera-tion.
Prospective oil shale developers will need to deploy best available control technologies to reduce potential air emissions which otherwise could result from construction and operation of surface facilities. Furthermore, because of
the existence of federally-designated sensitive lands – such as wilderness areas, national parks, national monuments and national for-ests that are located throughout the Rocky Mountain West, oil shale development may be more stringently regulated, depending on the site-specific locations and technologies pro-posed. These constraints could tend to limit the size of the industry in any one area and will affect the industry’s rate of development.
Water Quality: Controls are required to pro-tect surface and ground waters from contami-nation by runoff from mining and retorting operations, from treatment facilities for prod-ucts, other waste waters, and, particularly from retorted shale waste piles with respect to heavy metals in the leachate (Ref. 29). The controls that could be used and the costs of those controls need to be assessed.
Safe drinking water regulations could impact oil shale in-situ processes if it is found that reinjected water or contaminants from under-ground burning enters an aquifer, resulting in downstream contamination. New technologies being developed in association with the new In-Situ Conversion Process would avoid is-sues of runoff and show promise to protect underground aquifers (See 3.2.4 below).
3.2.3 SPENT SHALE DISPOSAL Surface retorts generate significant quantities of spent shale. Many major retort processes of the 1980s era were constrained by inefficien-cies that restricted the ability to convert all of the kerogen to oil and gases. As a result, sig-nificant coke was deposited on the spent shale, making solid waste from these earlier designs unsuitable for direct landfilling. Numerous technology advances have improved the effi-ciency, reducing residual carbon content. Sat-isfactory disposal and reclamation has been achieved with the later generation technolo-gies.
Use of spent shale in cement manufacture has been practiced in Estonia and Germany and
Strategic Significance of America’s Oil Shale 25

Volume II – Oil Shale Resources Technology and Economics
demonstrated in the U.S. Other uses in road beds or construction materials also offer po-tential for reducing or eliminating costs for disposal.
Processing shales in surface facilities causes spent shale to increase in volume by as much as thirty percent, primarily because of the void space created by crushing and size reduction. As such, the disposal area needed for the spent shale exceeds the original capacity of the geo-logical formations from which it is extracted, whether from deep underground mines or open pit surface mines. The U.S. Department of the Interior conducted extensive analysis of this phenomenon and the options for disposing of the increased volumes of shale in its 1973 Final Environmental Statement for the Proto-type Oil Shale Leasing Program (Ref. 2).
3.2.4 IN-SITU RECOVERY IMPACTS In-situ recovery technologies are one of two approaches, modified or true in-situ. Modi-fied in-situ first creates a void space, either through mining and blasting, or direct blast-ing, as in the Geokinetics approach, followed by ignition of a direct combustion retort in the rubblized shale. True in-situ recovers oil without first disturbing the beds to create void spaces. As such, the issues associated with surface mining, deep mining, and spent shale disposal discussed above relative to surface retorts do not apply to true in-situ processes. However, other subsurface impacts, including ground water contamination, are possible and must be controlled.
A true in-situ process, such as Shell's current research, has the potential to dramatically re-duce the surface footprint, waste disposal problems, runoff and other problems associ-ated with mining, spent shale disposal and sur-face reclamation. Since the vertical wells of a true in-situ process are able to access very thick sections of oil shale, the surface distur-bance for a given production rate may be smaller by a factor of as much as 10. There are locations of thick resources that could yield in
excess of 1 million barrels per acre and re-quire, with minimal surface disturbance, fewer than 23 square miles to produce 15 billion bar-rels of oil over a 40 year project lifetime.
In addition, since the hydrocarbon products are expected to be much higher API gravity than those produced by surface retorting tech-nologies, further upgrading will be less costly. Upgrading could be done on-site, at local area refineries, or more distant refineries accessible by pipeline.
In conjunction with its development of ICP, Shell has developed an environmental barrier system called a freeze wall to isolate the in-situ process from local groundwater. The freeze wall is created by freezing ground wa-ter occurring in natural fractures in the rock into a ring wall surrounding the area to be py-rolyzed. This barrier protects the groundwater from contamination with products liberated from the kerogen while at the same time keep-ing water out of the area being heated.
Once pyrolysis is completed, the remaining rock within the freeze wall is flushed with wa-ter and steam to remove any remaining hydro-carbons and to recover heat from the spent reservoir. Heat from the steam can be used to generate additional electric power. Once the area has been sufficiently cleaned, the freeze wall can be allowed to melt and groundwater can flow through this area once more.
3.2.5 WATER AVAILABILITY ISSUES Fundamentally, water rights are real property that can be bought and sold. The older or more senior rights generally have greater value. Most of the early water rights were filed for agricultural irrigation or domestic use. Understanding western water law is com-plex and difficult for those unfamiliar with each State’s system and the historical inter-state compacts that now dictate how the States cooperate.
As private individuals and corporations recog-nized the value of oil shale in the western
26 Strategic Significance of America’s Oil Shale

Volume II – Oil Shale Resources Technology and Economics
states and began staking mining claims in the early 1900s, water was not perceived to be much of an issue. However, during the 1950s and 1960s, as interest in oil shale increased and larger plants were being planned, the companies and government agencies recog-nized the need for secure water supplies for the plants and associated communities.
Participating companies aggressively filed for water rights on the major streams and began planning water storage reservoirs to hold wa-ter. Some companies also began purchasing senior water rights from ranchers. Interest in groundwater increased, and some water wells were drilled to secure subsurface water rights. Most companies with private oil shale hold-ings have, at a minimum, now secured condi-tional water rights and have plans in place to develop and store sufficient water for their future operations. Nearby communities, in most cases, have water supplies to support some growth but will likely look to the com-panies to augment those supplies as part of the project approval process to minimize socio-economic impact.
The real issue then becomes whether adequate water is available if the federal government, which controls over 80 percent of the western oil shale lands, begins to lease large blocks for additional shale oil plants. It is unlikely the government can provide any water rights with an oil shale lease. The lessee will need to file for new junior water rights or purchase or lease existing water rights from others. This can be done, and in some cases there are water storage projects that still have excess water for sale.
During the 1970s and 1980s, the heightened interest in western oil shale drew much atten-tion to this water issue. There were numerous studies completed and the federal government took a hard look at water supplies to support the leases offered under the prototype oil shale leasing program and those that might follow. At the time it was determined that water was
available to support a sizeable industry in the region. However, water may still be a con-straining factor. Water requirements for the infrastructure and socioeconomic demands, could place a burden on the neighboring communities, which would see tremendous growth as a result of a new oil shale industry in the region.
Many of the historical planning documents and previous studies are still valid and should be reviewed in any new oil shale development scenario. Part of that review will need to re-examine the entire water needs and availabil-ity issue.
3.3 Human Health and Safety Impacts and Issues The hazards and risks to human health and worker safety associated with oil shale pro-duction are similar to those that exist and are controlled in other mining, oil production, chemical processing, and refining industries.
Since oil shale was first seriously considered in the United States in the 1970s, most of these environments have been characterized in terms of required industrial hygiene and safety analyses. Still, it is possible that workers may be subjected to exposure to toxic materials for which proven health protective measures do not yet exist. Modern industrial hygiene prac-tices will need to be employed to prevent workers from direct exposure to oils and va-pors.
3.4 Permitting Issues Oil shale plants will be required to obtain doz-ens of permits and approvals, involving all levels of government. The number of permits required for oil shale development can range upward of 75. In 1977, an oil shale developer reported that it took two and a half years just to identify all of the requirements and that others may yet surface. Today, however, envi-ronmental laws have matured and may permit-ting processes have been streamlined.
Strategic Significance of America’s Oil Shale 27

Volume II – Oil Shale Resources Technology and Economics
The regulatory environment is now capable of addressing all of the significant issues, includ-ing, but not limited to endangered species, air emissions, water discharges, fugitive dust, noise, odor, occupational health and safety, hazard communications, land reclamation, scenic vistas, water use, socioeconomic and others.
Without attempting to describe the procedures or substance, the following laws and regula-tions and permitting requirements will likely apply to oil shale projects:
Mineral Leasing Act of 1920
National Environmental Policy Act
Clean Air Act and Amendments (includ-ing: Prevention of Significant Degradation of Air Quality Permit.; Non-Attainment Permit; New Source Performance Stan-dards (requires best available technology); and Visibility Impairment limits.
Clean Water Act
Safe Drinking Water Act
Toxic Substances Control Act
Resource Conservation and Recovery Act & Amendments
Occupational Safety and Health Act (OSHA) if mining process; MSHA may supercede.
Endangered Species Act of 1973
Antiquities Act of 1906
Federal Mine Safety and Health Act (if resource to be mined MSHA)
National Historic Preservation Act of 1966
Forest Rangeland Renewable Resources Act
Federal Land Policy and Management Act of 1976
National Pipeline Safety Act
Emergency Planning and Community Right to Know Act
The Pollution Prevention Act
State and Local Permits
Permitting delays can delay entire projects, and programs, impacting achievement of pub-lic policy goals and targeted production levels. Through a cooperative effort, the concerned federal and state agencies can greatly reduce the number and complexity of the required applications. This can then significantly re-duce the permitting barrier.
4.0 Analogy to Alberta’s Tar Sand Commercialization The commercially successful production of oil from Alberta tar sand serves as a model for the potential development of US oil shale. Many parallels exist between the respective re-sources, technology, markets and economics.
Oil was first produced at a commercial scale from Alberta tar sand more than 35 years ago. Today, tar sand production is nearly 1 million bbls/day, including both mining-based and thermal production. With planned and ap-proved expansions output is expected to ex-ceed 2 million bbls/day within the next 8 years (Figure 20).
Recent incentives, including forgiveness of tar sand royalties until project payback is
0
500
1000
1500
2000
2500
10^3
bbl
/day
1967 1984 1999 2003 2008 2012
Alberta Oil Sand Production historic and planned
Planned
Figure 20 - Alberta Oil Sand Production
28 Strategic Significance of America’s Oil Shale

Volume II – Oil Shale Resources Technology and Economics
achieved, have stimulated more than $65 bil-lion in private investments to accelerate de-velopment and achieve industry-scale opera-tions during this decade (Ref. 30). Ultimate production may reach 10 million bbls/day. Operating costs are reported to have been brought down to $8.50/bbl (Ref. 31). As such, these operations may now be as profitable and as investment-worthy as conventional petro-leum production.
According to Suncor’s Rick George, “A large part of the rest of this industry is chasing the world for reserves…We have reserves…We have no exploration risk and also have no de-cline curve, so we have a completely different business model from the conventional crude oil producer” (Ref 56).
As the Alberta tar sand industry has matured, technology performance and product quality have improved, higher efficiencies have been achieved, and the per-barrel energy and oper-ating costs have steadily declined. First Law Efficiency has improved from an initial 70 percent to its present day value of about 82 percent. While this is lower than the efficiency for conventional petroleum, at about 93 per-cent, the lower efficiency is offset by assured production (no production decline) and uni-form, high quality product. As discussed be-low, efficiencies similar to tar sand can be ex-pected for oil shale.
The advances resulting from phased-commercialization of tar sand technology in Canada provide a defensible analog for effec-tive and economic oil shale development in
the United States. An assessment of major economic and technical criteria shows that U.S. oil shale compares quite favorably in most evaluation criteria. These are summa-rized in Table 4 and discussed below.
Like Canada’s tar sand, America’s oil shale is rich, accessible, geographically concentrated, and well-defined. The magnitude of both re-sources warrant long-term development initia-tives. This preliminary comparison suggests that U.S. oil shale could generate productivity and profitability similar to Alberta tar sand. This analog includes five major areas of direct comparability:
Resource characteristics Technology performance and product
quality Environmental impact and controls Mass balances and energy requirements Production economics
A 100,000 Bbl/D sweet refinery feedstock fa-cility is taken as the base case. Round num-bers are used, as the precision of the data does not warrant a higher number of significant figures. All units are expressed as U.S. gal-lons, barrels and short tons (2,000 lbs.) unless specified. All energy calculations are ex-pressed in Btu/bbl and are based on the final product yield. All economics are presented in U.S. dollars. One U.S. dollar equals CAN 1.43 dollars.
Table 4. Comparison of Principal Factors Influencing the Economics of Unconventional Crude Oil Production
Characteristic Athabasca Tar Sand Green River Oil Shale Resources More than 1 trillion bbl More than 1 trillion bbl Grade (Richness) 25 gallon bitumen/ton 25 gallon kerogen oil/ton Hydrogen Content (bitumen | raw oil) 10.5 Wt% 11.8 Wt% N and S requiring removal 6.2 Wt% (mostly S) 4.0 Wt% (mostly N) Loss of liquids to Coke and Gas 40 lb/ton-ore 11.6 lb/ton-ore Net yield of oil 0.53 bbl/ton processed 0.60 bbl/ton processed Quality of oil 34°API 38°API
Strategic Significance of America’s Oil Shale 29

Volume II – Oil Shale Resources Technology and Economics
4.1 Resource Characteristics Alberta - The average bitumen content of Athabasca tar sand is about 10 weight percent. For a bitumen specific gravity of 1.0, this equates to about 25 gallons/ton. For purposes of this analogy 100 percent recovery of bitu-men is assumed. (The Alberta Energy and Utilities Board (EUB) has set a target of 95 percent recovery). ( Ref. 32).
United States - For a first-generation oil shale facility an average retort yield of 30 gal-lons/ton can be achieved. This assumption is supported by the previous discussion on re-source characterization (section 1). In fact, Unocal reported averaging 38 gallon/ton, at least in the early stages (Ref. 33), and are be-lieved to have averaged about 34 gallon/ton over the life of the project.
4.2 Technology Performance A comparison between the established tech-nology used for the Alberta tar sand project and an analogous mining, surface retort and upgrading operation for oil shale show that oil shale retorting serves the same purpose as ex-traction and coking of tar sand bitumen (Fig-ure 21.)
4.2.1 MINING AND ORE PREPARATION Alberta – The ratio of overburden to pay is estimated to be about 1:1. Cost of overburden removal is $1.00/bbl and for ore mining, $1.25/bbl. (Ref. 34). Shovels and trucks are used as the main equipment. The energy cost of mining (overburden and pay) is estimated to be about 550,000 BTU/bbl (Ref. 35). By using reported costs for recent expansions as a guide, an estimate of $7,210/ daily barrel of-
syncrude capacity can be made. This translates to $1,725/daily-tonne-capacity when 1:1 over-burden and overall yields are taken into ac-count.
United States – Surface mining will be con-ducted by shovel and truck operation as in Canada. Surface mines would use equipment about the same size as used in Alberta and per ton costs are expected to be similar, or $1,600/daily-ton-capacity (note different weight units from above). A more benevolent climate in the United States should result in some advantages to mining costs. Ore prepara-tion capital costs will add an estimated $275/ daily-ton-capacity.
Underground room and pillar mining, with horizontal access, will utilize mechanical min-ers and trucks. With any mining technology maximum economy of scale is approached at the point of one full-sized set of equipment. A minimum headspace of about 25 feet is re-quired for maximum efficiency. For room and pillar mining we assume miners and trucks are 0.5 the size of the Alberta case. A scaling fac-tor of 0.8, typical of mining and materials handling equipment, suggests equipment costs of $1,850/daily-ton capacity. Add to this $275/daily-ton-oreprep equipment.
4.2.2 EXTRACTION, COKING AND RETORTING TECHNOLOGY Alberta – The Alberta technology involves removing oversized material, and contacting the ore with warm water with caustic added. The bitumen is disengaged from the minerals, and the mixture is sent to a series of settlers and froth flotation devices that recover the bi-tumen overhead and the minerals as under-
Figure 21- Analogous steps in production for tar sand and oil shale
tar sand premium refinery feed
oil shale premium refinery feed
miningbitumen extraction
bitumen coking hydrodesulfurization
mining and ore preparation
retorting hydrodenitrogenation
30 Strategic Significance of America’s Oil Shale

Volume II – Oil Shale Resources Technology and Economics
flow. The bitumen is dried and cleaned of remaining solids by first diluting with naphtha and passing the lower viscosity solution through fines and water removal units; in-clined plate settlers, cyclones, centrifuges, etc. There is effectively no loss of bitumen in this stage.
The energy costs are estimated to be about 140,000 BTU/Bbl (12 percent of 1.2 MM BTU for the entire process (Ref. 36). The original capital costs were 15 percent of the total plant costs, implying $3,500/daily-barrel-bitumen capacity for bitumen extraction, froth treatment and diluent recovery.
The clean bitumen is either coked directly, sent to hydrocrackers or first distilled by vac-uum distillation. If the latter process is used, the overhead is sent directly to the hydrodesul-furization units and the bottoms are sent to coking or hydrocracking. If the bitumen is coked directly the mass yield distribution is approximately 5 percent gas, 79 percent liq-uids (29 API) and 16 percent coke. Energy costs for the coker are estimated at 210,000 BTU/Bbl (estimated from Ref. 40). Capital costs are estimated at $5000/daily-bbl-capacity.
United States – For surface retorting, ore is sized and fed to a retort where kerogen is con-verted to raw kerogen oil in yields of 30 gal-lon/ton (the base case).
If the Alberta Taciuk Processor (ATP) tech-nology is used, all of the retort energy used is generated in the combustor by burning the coked ore. Dryer heat requirements are fully satisfied by the fuel obtained from the retort gases (Ref. 52).
Electrical requirements to drive the rotating kiln (Stage 2 scale) are estimated at 12 -15 kW-hr/tonne. Capital costs for the ATP, ex-clusive of ore preparation and product upgrad-ing, are about $7,500 to 10,000/daily-barrel-capacity for 30 gal/ton ore (Refs. 37, 52).
4.2.3 UPGRADING TECHNOLOGY Alberta –All coker or distillate product is ul-timately hydrotreated to remove sulfur and to partially hydrogenate aromatics. The end re-sult is an 80 percent volumetric yield of sweet synthetic blend, based on bitumen feed (Ref. 38). Energy costs for coker distillate upgrad-ing are estimated at 100,000 BTU/bbl (HDS only). (Ref. 39). Additional energy costs for distillation and sulfur processing are estimated at about 100,000 BTU/bbl. Capital costs for the hydrotreater, hydrogen plant, distillation units and sulfur plant are estimated at $7780/daily-bbl-capacity (Ref. 40).
United States – For oil shale, the analogous step to coking is completed in the retort and so the upgrading of raw kerogen oil is compara-ble to upgrading of coker distillate. There are two potential approaches to upgrading raw kerogen oil. In the first upgrading approach, applicable at a small scale, kerogen oil is ex-tracted and separated into a polar concentrate and a non-polar raffinate. The polar concen-trate is converted and refined into chemicals, while the raffinate is hydrotreated directly to a 38° API sweet refinery feed. Total product yield on a feed barrel, by weight, is 84 percent sweet refinery feed, 10.5 percent specialty and commodity chemicals and 14 percent chemi-cal grade CO2. (Totals exceed 100 percent be-cause of water input in steam reforming).
In the second upgrading approach, raw kero-gen oil is hydrocracked to remove nitrogen heteroatoms in a process similar to Unocal’s upgrader. Unlike coking of Athabasca bitu-men, there is effectively no loss to coke with kerogen oil processing. The volumetric yield loss is negligible because hydrogen addition reduces the density, offsetting the loss to het-eroatom removal. Upgrading of raw kerogen oil yields 30.6 bbls/ton of ore retorted based on a 93 percent weight recovery and a gravity improvement from 21° API to 38° API. En-ergy costs for hydrocracking are estimated at
Strategic Significance of America’s Oil Shale 31

Volume II – Oil Shale Resources Technology and Economics
120,000 Btu/bbl. Capital costs are estimated at $3000/daily-bbl-capacity (Ref. 40).
4.2.4 PRODUCT QUALITY Athabasca Tar Sand – Synthetic crude oil from tar sand exhibits an API gravity of 34°. The syncrude has no bottoms, but like any py-rolysis product, it has high proportions of vac-uum gas oil. This difference in yield profile and certain quality issues place limits on how much synthetic crude oil can be blended with petroleum in a typical refinery (ref 51). Be-cause of transportation costs and quality dif-ferentials, Suncor values its product at West Texas Intermediate (WTI) – $2.75 (Ref. 41).
United States Green River Shale – For com-parison, U.S. syncrude will be 38° API or higher (see also Table 3 in Section 2). Be-tween the higher hydrogen content of the product and closer proximity to markets, a market value at a premium to West Texas In-termediate (WTI) grade conventional crude oil can be justified. Anecdotal evidence indicates that Unocal product was valued at a premium to WTI.
Military JP-4 jet fuel derived from the Unocal refinery feedstock exhibits a freeze point of -76° F compared to -72° F, normally a tough standard to meet with conventional crude oil (Ref. 42). As with Athabasca synthetic crude oil, both products convert in high yields to liquid transportation fuels.
4.2.5 TECHNOLOGY SUMMARY In summary, all of the processes used in Al-berta today are proven at a large, commercial scale. Total energy costs are approximately 1.1 million Btu/bbl-syncrude for an overall thermal efficiency of about 82%. Every effort should be made to achieve this efficiency level, or higher, with U.S. oil shale.
In the United States, mining technology will be adapted from other rock mining experience. The Unocal mine showed that room and pillar mining could be conducted efficiently. Up-
grading of raw oil products to premium refin-ery feedstocks will utilize conventional tech-nology. The Unocal experience proved this technology could produce a highly marketable product. Thus, there is low technical risk in the mining and oil upgrading portions. The immature technology for the U.S. case is the retort. The experiences around the world should be closely analyzed to determine which is the most efficient and operable. High oper-ability, i.e., a high on-stream factor, is criti-cally important to meeting production targets.
4.3 Environmental Impacts and Controls The primary environmental issue with Atha-basca tar sand processing is the tailings ponds. Other issues relate to mine reclamation and sulfur generation. The emissions and dis-charges are being controlled to regulatory standards with proven technologies.
By comparison, U.S. oil shale is dry and may not require tailings ponds. Reclamation costs for oil shale will be about the same whether for open pit mining or underground mining. The Unocal operation proved this can be man-aged to environmental standards. For in-situ recovery, neither tailings nor reclamation is-sues are significant.
The U.S. shale oil contains about 0.5-0.75 percent sulfur, compared to more than 5 per-cent for Athabasca bitumen. Sulfur disposal or sale will be a much smaller problem in the United States than in Canada.
The shale oil contains higher amounts of ni-trogen, which if not extracted for its chemical value is converted to ammonia and can be re-covered and sold as a byproduct. (Ammonia is worth about $0.30-0.40/lb). Hydrotreating produces about 6 lb of ammonia per barrel of oil.)
Production of CO2 will be higher for oil shale than for conventional petroleum and must be addressed in the design and permitting phases.
32 Strategic Significance of America’s Oil Shale
Volume II – Oil Shale Resources Technology and Economics
Table 5. Mass Balance Comparison (Daily Metrics)
Over-bur-
den/barren
Tons Ore Tons Extraction Input Tons
Extraction Output Bbl-
Bitumen
Retorting Input Tons
Retorting Output Bbl-Raw Crude
Up-grading
*Loss-Swell
Sweet Re-finery Feed
Athabasca Oil Sand 210,000 210,000 210,000 125,000 125,000 25,000 100,000 U.S. Oil Shale 24,173 136,978 136,978 97,841 (2,159) 100,000
*Loss is to coke, gas and N, S, removal; Swell is due to cracking and hydrogenation effects.
4.4 Mass Balances for Oil Shale and Tar Sand Production by Mining and Surface Processing Initial analysis by Bunger and Associates, Inc. (Ref. 43) shows a dramatic difference between mass balances of the oil shale process in com-parison to tar sand (Table 5).
For an equivalent output of sweet refinery feedstock, U.S. oil shale could require less than 50 percent of the mine capacity required for tar sand. The retort is more than 30 percent smaller than the bitumen extraction unit (al-though the retort is also more expensive).
These differences result from two key charac-teristics:
The Green River kerogen ore is inherently richer and the mine approach (room and pillar) recovers this rich ore with little need to mine barren or low grade material.
With oil shale, the yield of oil is measured after the retort, after primary coke and gas losses have already been deducted. In the Alberta case, loss of liquid yield to coke and gas in the coker are significant. This is shown in the column -‘loss’ minus ‘swell’. There is a net volumetric gain for shale oil during upgrading, not unlike what transpires in a conventional petroleum re-finery.
4.5 Production Goals and Economics Production output of Alberta’s tar sand depos-its have been increasing and the costs of pro-duction have been decreasing over the past two decades (Figure 22). The trend toward increasing profitability is the characteristic of any new industry as lessons learned are ap-plied to future generations of the technology.
Improving profitability has helped to create the economic climate needed to encourage industry to commit massive capital invest-ments for oil sand development. The Alberta Energy and Utilities Board (EUB) “estimates that $23 billion (Canadian) has been invested in oil sand expansion since 1996, $7 billion for new projects under construction, and a fur-ther $30 billion in planned projects has been announced for the next 10 years” (Ref. 44).
These expansions incorporate advances in mining and materials handling. For example, materials are now moved by slurry instead of conveyor. Processing is now employing low-energy extraction methods that cuts by 40 per-cent the energy required to produce a barrel of bitumen (Ref. 45). Other significant technical advances include: steam-assisted gravity drainage, vapor extraction of bitumen, and a new cyclic steaming technique. These im-provements have resulted in the high energy efficiency (82 percent) and low operating costs ($8.50/bbl) cited earlier.
Strategic Significance of America’s Oil Shale 33

Volume II – Oil Shale Resources Technology and Economics
Figure 22. Tar Sand Economics and Production Continue to Improve
0
5
10
15
20
25
30
35
40
1981 1984 1994 1998 1999 2001 2003 2007
Prod
uctio
n C
ost,
2002
US
$
0
0.1
0.2
0.3
0.4
0.5
0.6
0.7
0.8
0.9
1
Alb
erta
Oil
Sand
s Pr
oduc
tion,
MM
Bbl
/Day
Production Costs
Oil Sands Production
Source: Oil & Gas Journal, July 14, 2003, V. 101.27 Estimate
Through the early 1990’s, the petroleum in-dustry invested in the preliminary steps needed for oil shale development in the United States. The industry can build on that existing technology base by adopting new tar sand and oil shale technology developed during the past ten years.
Development of the U.S. oil shale resources will start high on the learning curve. While production costs are likely to be higher in the first-generation plants, costs are expected to fall as industry matures. Comparison of the capital costs for the main units suggests an improvement in the investment economics of oil shale similar to that the improvements ex-perienced in Canada with tar sand. Higher capital costs for the retort (compared to ex-traction and coking of tar sand bitumen) may be offset by the substantially lower mining costs for oil shale. Upgrading costs are com-parable.
At present it is not possible to tell if oil shale economics will parallel Alberta tar sand, but
production assurance, process steps and prod-uct quality strongly suggest that, at maturity, oil shale will afford a profitable opportunity. The resource is large enough to support a goal of 2 million bbl/day, achievable in a time frame that will be driven by a consensus of need. It is likely that production at this level will require several technology approaches.
Getting started, however, is the key. The ini
comparisons of richness, resource magnitude,
-
tial investment thresholds and project risks are huge. The importance of getting over the first hurdle can be understood by realizing that in-vestment decisions are typically made with 10-year internal rate-of-return calculations, while the resource base supports a physical life of 40 years or more.
After the initial depreciation and amortizationperiod has been completed, second and future generation investment can be made by amor-tizing the capital over a larger production base. This is what is transpiring in Alberta today and is one reason why government in-centives are not likely to be needed after a
34 Strategic Significance of America’s Oil Shale

Volume II – Oil Shale Resources Technology and Economics
first-generation facility (for each technol-ogy/resource type) is in production.
Government can, and should, play a role by serving as the catalyst for jump-starting the domestic oil shale industry.
Once started, industry will optimize the proc-esses as required to make the oil shale indus-try both profitable and self-sustaining, with governmental assistance declining to the point of ultimate elimination -- just as the Alberta tar sand industry did.
Conclusions
The oil shale resources of Colorado, Utah and Wyoming exceed 1 trillion barrels, in-place. Rich, high quality zones yielding greater than 30 gallon per ton are found throughout the region. Past failures to commercialize this vast resource can be attributed to price uncertainty and immature technology, not an inherent deficiency in the resource.
Worldwide, there have been significant advances in technology in the past two decades. Mining and retorting technologies are being practiced in Estonia, Brazil, China and Australia. In the past several years a new, more environmentally sensitive, in-situ technology has been studied that promises production of high quality oil and gas from thick, deep beds where the majority of the resource lies.
Environmental technologies and regulations have matured to a point where regulatory uncer-tainty is diminished. Oil shale is highly concentrated, and contrary to popular perception pro-vides the greatest yields of oil per acre disturbed of any of the Nation’s energy resources.
The rapidly expanding and highly profitable development of Athabasca tar sand resources of Al-berta, Canada serves as a model for the initiation and growth of an oil shale industry in the United States. As the tar sand industry has matured production efficiency has improved to over 80 percent and costs have declined, reflecting the learning process.
There are direct parallels between tar sand and oil shale with respect to resource size, resource quality, mining, recovery and upgrading technologies, and production certainty. In nearly all re-spects oil shale compares favorably to tar sand.
Getting the industry started is the hardest step. This is because of the high capital costs, invest-ment risk, and customary uncertainties surrounding a first-generation facility. Once started, a maturing of an oil shale industry, similar to the tar sand industry, can be expected.
If the United States is to supply more of its own energy needs and reduce its dependence on for-eign sources of oil, it has little choice other than to develop its oil shale resources. The current economic climate and evidence for the emerging viability of oil shale warrant development of a Program Plan to advance this objective.
Strategic Significance of America’s Oil Shale 35

Volume II – Oil Shale Resources Technology and Economics
References
1. Dyni, John R., “Oil Shale”, U.S. Geological Survey, Rev 02/27/03, (cf www.emdaapg.org/oilshale.htm, September 12, 2003.) p. 1-9
2. Final Environmental Statement for the Prototype Oil Shale Leasing Program, U.S. De-partment of the Interior, Bureau of Land Management, Volume I, 1973.
3. Culbertson, W. J. and Pitman, J. K. “Oil Shale” in United States Mineral Resources, USGS Professional Paper 820, Probst and Pratt, eds. P 497-503, 1973.
4. Donnell, J. R. Geology and Oil-Shale Resources of the Green River Formation, Proceed-ings, First Symposium on Oil Shale, Colorado School of Mines, pp. 153-163, 1964
5. Stanfield et al, Department of the Interior, U.S. Bureau of Mines RI 7051, 1967.
6. Stanfield et al, Department of the Interior, U.S. Bureau of Mines RI 6420, 1964.
7. Cameron Engineers, Synthetic Fuels Data Handbook, 1975
8. Cashion, W. B. Geology and Fuel Resources of the Green River Formation, USGS Pro-fesional Paper 548, 1967
9. Stanfield, et. al., Department of Interior, U. S. Bureau of Mines RI 5081, 1954. Core Hole Histogram
10. www.engineering.usu.edu /uwrl/atlas/ch7/ch7upcolcom.html
11. cf Salt Lake Tribune, October 17, 2003, Page A-1
12. Draft Commercialization Strategy Report for Oil Shale: Parts I, II, & III; U.S. Depart-ment of Energy, Washington, DC., 1978.
13. “Shell’s In-Situ Conversion Process”, a Briefing by Mr. Terry O’Connor to Oil Shale Report Steering Committee. Washington, D.C., October 2003, and related materials.
14. Oil and Gas Journal, Dec 23, 2002.
15. “SPP Information Pack for Estonia Symposium, 18 –1 22 November 2002”. Southern Pacific Petroleum, Inc.
16. Anderson, Campbell: “Greenpeace vs. The Future of Australian Oil Shale” Presentation to the 53rd Sydney Mining Club. Southern Pacific Petroleum, May 2, 2002.
17. World Energy Council, Estonia Oil Shale Extract from the Survey of Energy Resources 2001, www.worldenergy.org/wec-geis/publications/reports/ser/shale/shale.asp , October 24, 2003.
18. “Shale Oil Production – ATP Plant” Presentation. Viru Keemia Grupp, July 2003.
19. World Energy Council, Brazil Oil Shale Extract from the Survey of Energy Resources 2001, www.worldenergy.org/wec-geis/publications/reports/ser/shale/shale.asp , October 24, 2003.
20. Petzrick, Paul A., 1995, Oil Shale and Tar Sand: Encyclopedia of Applied Physics, v.12, p.77-99: VCH Publishers, Inc.
Strategic Significance of America’s Oil Shale R-1

Volume II – Oil Shale Resources Technology and Economics
21. An Assessment of Oil Shale Technology, Congress of the United States, Office of Tech-nology Assessment, Washington, D.C., 1980. p.
22. World Energy Congress, China Oil Shale Extract from the Survey of Energy Resources 2001, www.worldenergy.org/wec-geis/publications/reports/ser/shale/shale.asp , October 24, 2003.
23. Qian, Jialin. and Janqui Wang, and S. Li,, “Oil Shale Development in China”: Oil Shale, v. 20, no.3, p. 356-359: Estonian Academy Publishers, 2003. p. 356-359.
24. Qian, Jialin , Jianqui Wang, and S. Lian, “World Oil Shale 2002”, Petroleum University, Beijing, China, February, 2003.
25. SPP Ibid
26. “Shell’s In-Situ Conversion Process” brief description provided by Mr. Terry O’Connor, Shell Oil Company, October 2003.
27. Baldwin Robert M., “Oil Shale: A Brief Technical Overview”: Colorado School of Mines, July, 2002.
28. Bunger, J. W., Cogswell, D. E., and Russell, C. P., “Value Enhancement Extraction of Heteroatom Containing Compounds from Kerogen Oil” PREPRINTS, Div. of Fuel Chem. ACS 2001, 46 (2) p 573.
29. Draft Commercialization Strategy Report for Oil Shale: Parts I, U.S. Department of En-ergy, Washington, DC., 1978, p. 7-8.
30. Haines, Leslie, “Alberta’s Heavy Oils”: www.oilandgasinvestigator.com, October 2001. p. 32-40.
31. Suncor, CAPP Oil and Gas Investment Symposium, Calgary, June 2003.
32. Province of Alberta, Energy Resource Conservation Board, Informational Letter, I1, pg. 84-6.
33. Reeg, et al. Proceedings, 23rd Oil Shale Symposium, Colorado School of Mines, 1990.
34. Suncor 2003 http://www.suncor.com/SiteAdmin/data/1/rec_docs/533_Booklet.pdf)., slide 20.
35. Derived from chart named Suncor Cost Distribution and related data, ref. 31, ibid.
36. http://www.syncrude.com/syn_library/action_plan00/summary.html
37. Odut, S. personal communication, UMATAC Industrial Processes, Calgary Nov, 2003.
38. Suncor, CAPP Presentation, Ibid.
39. Data from www.suncor.com/SiteAdmin/data/1/rec_docs/533_Booklet.pdf
40. Hydrocarbon Processing Refining Processes Handbook, 1998.
41. SUNCOR, CAPP Presentation, Ibid.
43. Bunger, J. W., Estimates made for report “Strategic Significance of America’s Oil Shale Resources”, US DOE, Dec. 2003
42. Reeg, Ibid.
R-2 Strategic Significance of America’s Oil Shale

Volume II – Oil Shale Resources Technology and Economics
44. Alberta Energy and Utilities Board (EUB) estimates as reported in Williams, Bob, OGJ V101.29, July 28, 2003 p 24.
45. Oil and Gas Journal, Williams, July 28, 2003.
46. Petzrick, Ibid.
47. An Assessment of Oil Shale Technologies, Congress of the United States, Office of Technology Assessment, Washington, D.C. 1980.
48. Commercialization Strategy Report for Oil Shale, Parts I – III, U.S. Department of En-ergy, Oil Shale Task Force, 1978.
49. Shell Mahogany Research Project, Briefing Document, Shell Oil Company, 2003.
50. Fuels to Drive Our Future, National Academy of Sciences, National Research Council, Washington, D.C., 1990.
51. Oil Sands Technology Roadmap, Alberta Chamber of Resources, January 30, 2004.
52. Corbet, Bruce, The Stuart Oil Shale Project, Southern Pacific Petroleum, Proceedings-Oil Shale Peer Review meeting, February, 2004.
53. Lukens, L. Personal communication, Feb 18, 2004.
54. Projections estimated from Utley, J., Flying J. Refinery, Salt Lake City, Feb 24, 2004, and data contained in ref 51. Historic data obtained from open literature sources.
55. National Research Council “Fuels to Drive our Future”, pp 76-88, 1990.
56. Moritis, Guntis, Suncor’s George: “Oil Sands a long-life, low-risk resource”, OGJ 102.11, March 15, 2004, pp. 37-38.
Strategic Significance of America’s Oil Shale R-3

Volume II – Oil Shale Resources Technology and Economics
Appendix A
A Brief History of Oil Shale Oil shale is sedimentary marlstone rock that is embedded with rich concentrations of organic ma-terial known as kerogen. U.S. western oil shales contain approximately 15 percent organic mate-rial, by weight. By heating oil shale to high temperatures, kerogen can be released and converted to a liquid that, once upgraded, can be refined into a variety of liquid fuels, gases, and high value chemical and mineral byproducts. The United States has vast known oil shale resources that could translate into as much as 2.2 trillion barrels of known kerogen “oil-in-place.” Oil shale de-posits concentrated in the Green River Formation in the states of Colorado, Wyoming and Utah, account for nearly three-quarters of this potential.
Because of the abundance and geographic concentration of the known resource, oil shale has been recognized as a potentially valuable U.S. energy resource since as early as 1859, the same year Colonel Drake completed his first oil well in Titusville, Pennsylvania. Early products de-rived from shale oil included kerosene and lamp oil, paraffin, fuel oil, lubricating oil and grease, naphtha, illuminating gas, and ammonium sulfate fertilizer.
Since the beginning of the 20th century, when the U.S. Navy converted its ships from coal to fuel oil, and the nation’s economy was transformed by gasoline-fueled automobiles and diesel fueled trucks and trains, concerns have been raised about assuring adequate supplies of liquid fuels at affordable prices to meet the growing needs of the nation and its consumers.
America’s abundant resources of oil shale were initially eyed as a major source for these fuels. Numerous commercial entities sought to develop oil shale resources. The Mineral Leasing Act of 1920 made petroleum and oil shale resources on Federal lands available for development under the terms of federal mineral leases. Soon, however, discoveries of more economically producible and refinable liquid crude oil in commercial quantities caused interest in oil shales to decline.
Interest resumed after World War II, when military fuel demand and domestic fuel rationing and rising fuel prices made the economic and strategic importance of the oil shale resource more ap-parent. After the war, the booming post-war economy drove demand for fuels ever higher. Public and private research and development efforts were commenced, including the 1946 U.S. Bureau of Mines Anvil Point, Colorado oil shale demonstration project. Significant investments were made to define and develop the resource and to develop commercially viable technologies and processes to mine, produce, retort, and upgrade oil shale into viable refinery feedstocks and by-products. Once again, however, major crude oil discoveries in the lower-48 United States, off-shore, and in Alaska, as well as other parts of the world reduced the foreseeable need for shale oil and interest and associated activities again diminished. Lower-48 U.S. crude oil reserves peaked in 1959 and lower-48 production peaked in 1970.
By 1970, oil discoveries were slowing, demand was rising, and crude oil imports, largely from Middle Eastern states, were rising to meet demand. Global oil prices, while still relatively low, were also rising reflecting the changing market conditions. On-going oil shale research and test-ing projects were re-energized and new projects were envisioned by numerous energy companies seeking alternative fuel feedstocks (Table A-1). These efforts were significantly amplified by the impacts of the 1973 Arab Oil Embargo which demonstrated the nation’s vulnerability to oil import supply disruptions, and were underscored by a new supply disruption associated with the 1979 Iranian Revolution.
Strategic Significance of America’s Oil Shale A-1
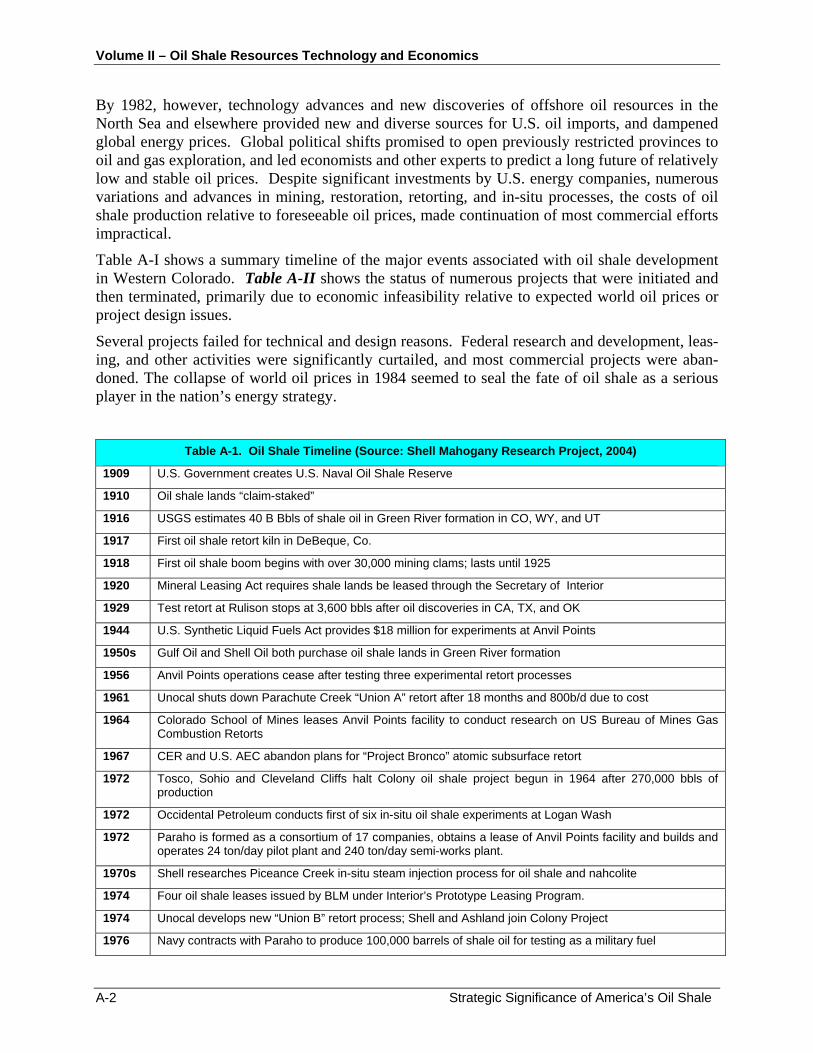
Volume II – Oil Shale Resources Technology and Economics
By 1982, however, technology advances and new discoveries of offshore oil resources in the North Sea and elsewhere provided new and diverse sources for U.S. oil imports, and dampened global energy prices. Global political shifts promised to open previously restricted provinces to oil and gas exploration, and led economists and other experts to predict a long future of relatively low and stable oil prices. Despite significant investments by U.S. energy companies, numerous variations and advances in mining, restoration, retorting, and in-situ processes, the costs of oil shale production relative to foreseeable oil prices, made continuation of most commercial efforts impractical.
Table A-I shows a summary timeline of the major events associated with oil shale development in Western Colorado. Table A-II shows the status of numerous projects that were initiated and then terminated, primarily due to economic infeasibility relative to expected world oil prices or project design issues.
Several projects failed for technical and design reasons. Federal research and development, leas-ing, and other activities were significantly curtailed, and most commercial projects were aban-doned. The collapse of world oil prices in 1984 seemed to seal the fate of oil shale as a serious player in the nation’s energy strategy.
Table A-1. Oil Shale Timeline (Source: Shell Mahogany Research Project, 2004)
1909 U.S. Government creates U.S. Naval Oil Shale Reserve
1910 Oil shale lands “claim-staked”
1916 USGS estimates 40 B Bbls of shale oil in Green River formation in CO, WY, and UT
1917 First oil shale retort kiln in DeBeque, Co.
1918 First oil shale boom begins with over 30,000 mining clams; lasts until 1925
1920 Mineral Leasing Act requires shale lands be leased through the Secretary of Interior
1929 Test retort at Rulison stops at 3,600 bbls after oil discoveries in CA, TX, and OK
1944 U.S. Synthetic Liquid Fuels Act provides $18 million for experiments at Anvil Points
1950s Gulf Oil and Shell Oil both purchase oil shale lands in Green River formation
1956 Anvil Points operations cease after testing three experimental retort processes
1961 Unocal shuts down Parachute Creek “Union A” retort after 18 months and 800b/d due to cost
1964 Colorado School of Mines leases Anvil Points facility to conduct research on US Bureau of Mines Gas Combustion Retorts
1967 CER and U.S. AEC abandon plans for “Project Bronco” atomic subsurface retort
1972 Tosco, Sohio and Cleveland Cliffs halt Colony oil shale project begun in 1964 after 270,000 bbls of production
1972 Occidental Petroleum conducts first of six in-situ oil shale experiments at Logan Wash
1972 Paraho is formed as a consortium of 17 companies, obtains a lease of Anvil Points facility and builds and operates 24 ton/day pilot plant and 240 ton/day semi-works plant.
1970s Shell researches Piceance Creek in-situ steam injection process for oil shale and nahcolite
1974 Four oil shale leases issued by BLM under Interior’s Prototype Leasing Program.
1974 Unocal develops new “Union B” retort process; Shell and Ashland join Colony Project
1976 Navy contracts with Paraho to produce 100,000 barrels of shale oil for testing as a military fuel
A-2 Strategic Significance of America’s Oil Shale

Volume II – Oil Shale Resources Technology and Economics
Table A-1. Oil Shale Timeline (Source: Shell Mahogany Research Project, 2004)
1977 Superior Oil abandons plan for Meeker oil shale plant planned since 1972
1976 Unocal begins planning commercial scale plant at Parachute Creek to be built when investment is eco-nomic; imported oil prices reach $41/bbl
1979 Shell, Ashland, Cleveland Cliffs and Sohio sell interests in Colony to ARCO and Tosco; Shell sells leases to Occidental and Tenneco
1979 Congress passes Energy Security Act, establishing U.S. Synthetic Fuels Corporation; authorizes up to $88 Billion for synthetic fuels projects, including oil shale.
1980 Exxon buys Arco’s Colony interest and in 1981 begins Colony II construction, designed for 47,000 b/d using Tosco II retort process
1980 Congress approves $14 billion for synthetic fuels development
1980 Unocal plans Long Ridge 50,000 b/d plant applying “Union B” retort; begins construction in 1981
1980 Amoco Rio Blanco produces 1,900 bbls of in-situ oil at C-a tract
1981 Exxon begins to build Battlement Mesa company town for oil shale workers
1981 Second Rio Blanco in-situ retort demonstration produces 24,400 bbls of shale oil
1982 Oil demand falls and crude oil prices collapse
1982 Exxon Black Sunday: announces closure of Colony II due to cost and lower demand
1982 Shell continues in-situ experiments at Red Pinnacle and labs through 1983
1985 Congress abolishes Synthetic Liquid Fuels Program after 40 years and $8 billion
1987 Shell purchases Ertl-Mahogany and Pacific tracts in Colorado
1987 Paraho reorganizes as New Paraho and begins production of SOMAT asphalt additive used in test strips in 5 States.
1990 Exxon sells Battlement Mesa for retirement community
1991 Occidental closes C-b tract project before first retort begins operation
1991 Unocal closes Long Ridge after 5 MM bbls and 10 years for operational issues and losses
1991 LLNL plans $20 million experiment plant at Parachute; Congress halts test funds in 1993
1991 New PARAHO reports successful tests of SOMAT shale oil asphalt additive
1997 DOE cedes oil shale lands to DOI/BLM
1997 Shell tests in-situ heating on Mahogany property; defers further work on economic basis
2000 BLM seeks public comment on management of oil shale lands
2000 Shell returns to Mahogany with expanded in-situ heating technology research plan (on-going)
2004 DOE Office of Naval Petroleum and Oil Shale Reserves initiates study of the strategic significance of America’s oil shale resources.
Strategic Significance of America’s Oil Shale A-3

Volume II – Oil Shale Resources Technology and Economics
Table A-2. Status of Major U.S. Oil Shale Projects
Project Location Proposed Technology
Production Target (bar-rels per day)
Status Summary
Rio Blanco Oil Shale Co: Gulf, Standard of Indiana
Federal lease tract C-a, Colo-rado
MIS and Lurgi-Ruhrgas aboveground retorts
76,000 (1987) Shaft sinking for MIS module development. Designing Lurgi-Ruhrgas module, PSD permit obtained for 1,000 Bbl/day.
Cathedral Bluffs oil Shale project: Occi-dental Oil Shale: Ten-neco
Federal lease tract C-b; Colo-rado
Occidental MIS
57,000 (1986) Shaft sinking for MIS module development. Process development work being done at Logan Wash, PSD permit obtained for 5,000 Bbl/Day.
White River Shale project: Sundeco; Phillips; SOHIO
Federal lease tracts U-a and U-b; Utah
Paraho above-ground retorts
100,000 Inactive because of litigation between Utah, the Federal Government, and private claim-ants over land ownership.
Colony Development Operation: ARCO; Tosco
Colony Dow West property; Colorado
TOSCO II aboveground retorts
46,000 Inactive pending improved economic condi-tions. PSD permit obtained for 46,000 Bbl/Day.
Long Ridge project: Union 011 of Califor-nia
Union property; Colorado
Union "b" aboveground retort
9,000 Inactive pending improved economic condi-tions. PSD permit obtained for 9,000 Bbl/Day.
Superior Oil Co. Superior prop-erty: Colorado
Superior aboveground retort
11,500 Plus nahcolite, soda ash, and alu-mina
Inactive pending BLM approval land ex-change proposal. PSD permit obtained for 11,500 Bbl/day.
Sand Wash project: Tosco
State-leased land; Utah
TOSCO II aboveground retorts
50,000 Site evaluation and feasibility studies under-way. Lease terms require $8 million invest-ment by 1985.
Paraho Development Corp.
Anvil Points: Colorado
Paraho above-ground retorts
7,000 Inactive following completion of pilot plant and semiworks testing. Seeking Federal and pri-vate funding for modular demonstration pro-gram.
Logan Wash project. Occidental Oil Shale: DOE
D.A. Shale prop-erty; Colorado
Occidental MIS
500 Two commercial-size MIS retorts planned for 1980 in support of the tract C-b project. PSD permit obtained for 1,000 Bbl/Day.
Geokinetics, Inc., DOE
State-leased land; Utah
Horizontal-burn true in-situ
2,000 (1982) Continuation of field experiments, About 5,000 bbl have been produced to date.
BX Oil Shale project Equity Oil Co.; DOE
Equity property; Colorado
True in-situ retorting with superheated steam (Equity process)
Unknown Steam injection begun and will continue for about 2 years. Oil production expected in 1980. Production rate has not been predicted.
Shell In-Situ Conver-sion Research Project
Shell Property. Colorado
In-Situ Con-version using underground heaters
Unknown Research initiated in 1993 has continued leading to technology advancement and proof of concept. Additional R&D could lead to pilot demonstration by 2006
Source: OTA 1990, An Assessment of 0il Shale Technologies p.114; Shell Oil 2003
A-4 Strategic Significance of America’s Oil Shale

Volume II – Oil Shale Resources Technology and Economics
Appendix B
Oil Shale Technologies (to 1991) This appendix reviews the major technologies that were developed for oil shale mining, retort-ing, and upgrading between 1960 and 1991. Much of the information in this appendix is ex-cerpted from external sources (Refs. 46 – 50.) More recent technology advances that can con-tribute to improved performance and cost-efficiencies and yield value-enhancing byproducts are discussed in Volume II, Section II of this report)
There are two basic retorting approaches. With conventional surface processes, the shale is brought to the heat source, namely the retort. With in-situ processes, the heat source is placed within the oil shale itself. Conventional surface retorts require the mining of the oil shale by sur-face or deep mining methods: the transporting of the shale to the retort facility, the retorting and recovering of the shale oil, and finally the disposing of the “spent” shale. In-situ retorting in-volves the application of heat to the kerogen while it is still embedded in its natural geological formation, and then the recovery of the fluid kerogen by conventional means. Examples of in-situ approaches include modified and true in-situ processes, as described below.
I. Mining With the exception of the “true in-situ” process to be described below, oil shale must be mined before it can be converted to shale oil. Depending on the depth and other characteristics of the target oil shale deposits, either surface mining or underground mining methods may be used.
Surface Mining – Due to less complexity, fewer safety issues, and lower costs, open-pit surface mining is the preferred method whenever the depth of the target resource is favorable to access through overburden removal. In general, open-pit mining is viable for resources where the over burden is less than 150 feet in thickness and where the ratio of overburden thickness to deposit thickness is less than one – to- one. Removing the ore may require blasting if the resource rock is consolidated. In other cases, exposed shale seams can be bulldozed. The physical properties of the ore, the volume of operations, and project economics determine the choice of method and operation.
Underground Mining – When overburden is too great, underground mining processes are re-quired. Underground mining necessitates a vertical, horizontal or directional access to the kero-gen-bearing formation. Consequently, a strong “roof” formation must exist to prevent collapse or cave-ins, ventilation must be provided, and emergency egress must also be planned.
Room and pillar mining has been the preferred underground mining option in the Green River formations. Advanced technologies have already been developed, tested, and demonstrated, safely and successfully, by Cleveland-Cliffs, Mobil, Exxon, Chevron, Phillips and Unocal. Technology currently allows for cuts up to 27 meters in height to be made in the Green River formation, where ore-bearing zones can be hundreds of meters thick. Mechanical “continuous miners” have been selectively tested in this environment, as well.
Depending on the ore size limitations of various retorting processes, mined oil shale may need to be crushed using gyratory, jaw, cone or roller crushers, all of which have been successfully used in oil shale mining operations.
Strategic Significance of America’s Oil Shale B-1

Volume II – Oil Shale Resources Technology and Economics
For limited uses, including electric power generation, oil shale can be burned directly, without further processing to liquid form. This has been the norm in Estonia where raw oil shale is burned as power plant boiler fuel. The high calcium carbonate content of some oil shale ores provides an effective matrix for oil shale use in fluidized bed combustion technologies. Atmos-pheric- and pressurized-fluidized bed technologies have been developed and used in the United States since the 1970s to burn medium and high-sulfur coals in power plant applications and minimize sulfur dioxide and other atmospheric emissions. Another direct use of oil shale is for road paving. Road paving applications range from simple compaction on the roadbed to mix-tures with water or hydrocarbon solvents and asphalt pitch.
II. Converting Ore to Shale Oil Unlike the bitumen derived from tar sand, the kerogen in oil shale is a solid that does not melt and is insoluble. (Ref. 22) To create other fuels, the kerogen must be converted from a solid to a liquid state. In general, releasing organic material from oil shale and converting it into a liquid form requires heating the shale to some 500 degrees C – in the absence of oxygen - to achieve a pyrolysis which converts the kerogen to a condensable vapor which, when cooled, becomes liq-uid shale oil. This process is called “retorting.” (Ref. 29)
Depending on the efficiency of the process, a portion of the kerogen may not be vaporized but deposited as “coke” on the remaining shale, or converted to other hydrocarbon gases. In some processes, residual carbon and hydrocarbon gases may be captured and combusted to provide process heat. For the purposes of producing shale oil, the optimal process is one that minimizes the thermodynamic reactions that form coke and hydrocarbon gases and maximizes the produc-tion of shale oil. (Ref. 29)
Maximum oil production requires pyrolysis at the lowest possible temperature (about 480 de-grees centigrade) to avoid unnecessary cracking of hydrocarbon molecules, which reduces oil yields. (Ref. 22)
Conventional Oil Shale Retorts Examples of conventional retorts include “TOSCO II” and “Union B”, Petrosix gas combustion, Paraho, Lurgi-Ruhrgas and Kiviter, as well as the new Alberta Taciuk Process (“ATP”) now be-ing demonstrated in Australia.
Of the projects and processes used in the U.S., Union B was the longest lived, produced the most shale oil (4.5 million barrels between 1980 and 1991), and received the most significant techno-logical evaluation. Worldwide, the Petrosix retorts in Brazil and Kiviter Retorts in Estonia have produced tens of millions of barrels over their lifetimes.
Union B – “The retort developed by Union Oil Company of California (Unocal) was tested at a demonstration scale between 1956 and 1958. This retort consists of a vertical refractory-lined vessel. It operates on a downward gas flow principle, and the shale is moved upward by a unique charging mechanism usually referred to as a “rock pump.” Heat is supplied by combus-tion of the organic matter remaining on the retorted oil shale and is transferred to the [raw] oil shale by direct gas-to-solids exchange. The oil is condensed on the cool incoming shale and flows over it to an outlet at the bottom of the retort. The process does not require cooling water. The company announced that its operation of the plant had yielded enough information to justify the design of a larger scale operation and to satisfy whatever energy demand that economic con-ditions warranted. (Ref. 21)
B-2 Strategic Significance of America’s Oil Shale

Volume II – Oil Shale Resources Technology and Economics
TOSCO II – Colony Development Operation, comprised of Arco, Sohio, the Oil Shale Com-pany (TOSCO), and the Cleveland Cliffs Iron Company operated projects from the mid 1960s to 1972 using the TOSCO II retort (Figure B-1). This process employed a rotary type kiln utilizing ceramic balls heated in external equipment to accomplish retorting. Shale reduced to one-half inch size or smaller is preheated and pneumatically conveyed through a vertical pipe by flue gases from the ball-heating furnace. The preheated shale then enters the rotary retorting kiln with the heated pellets where it is brought to retorting temperature of 900 degrees F (500 degrees C) by conductive and radiant heat exchange with the balls. Passage of the kiln discharge over a trommel screen permits recovery of the balls from the spent shale for reheating and recycling. The spent materials are then routed to disposal. Excellent oil recoveries and shale volumes were
Gas Combustion Retort – Vertical-shaft retorts can be traced back to Scottish oil shale retorts that evolved from coal gasification technologies. “When U.S. Bu-reau of Mines engineers set out to develop a high-efficiency, high throughput oil shale retort specifically for the Green River Formation shale, they elected to develop a vertical shaft Gas Combustion Retort (GCR) that would burn the incondensable gases of the retorting process as fuel.” (Ref. 20) Of the numerous technolo-gies studied in the Bureau of Mines program, the gas combustion retort [then] gave the most promising re-sults (Figure B-2). This retort is a vertical, refractory-lined vessel through which crushed shale moves down-ward by gravity. Recycled gases enter the bottom of the retort and are heated by the hot retorted shale as they pass upward through the vessel. Air is injected into the retort at a point approximately one-third of the way up from the bottom and is mixed with the rising hot re-cycle gases. Combustion of the gases and some resid-
Figure B-1. TOSCO Retort (Fig. I-4 from EIS pg. I-13)
Figure B-2. Gas Combustion Retort
Strategic Significance of America’s Oil Shale B-3

Volume II – Oil Shale Resources Technology and Economics
ual carbon from the spent shale heats the raw shale immediately above the combustion zone to retorting temperature. Oil vapors and gases are cooled by the incoming shale and leave the top of the retort as a mist. The novel manner in which retorting, combustion, heat exchange and product recovery are carried out gives high retorting and thermal efficiencies. The process does not re-quire cooling water, an important feature because of the semi-arid regions in which the oil shale targets occur. This project was terminated before operability of the largest of the three pilot plants had been demonstrated. (Ref. 20 and 21).
Paraho – The Paraho retorting process is typical of vertical-shaft retorts in which crushed shale with the fines removed descends through the retort under the influence of gravity. Zones for each step in processing the shale are maintained by managing gas flow in the retort. The retort can be operated in a direct or indirect combustion mode. The indirect combustion mode burns process gas in a separate furnace and hot gases carry heat to the retort. (Ref. 20).
Lurgi-Ruhrgas – The Lurgi-Ruhrgas technology devel-oped in Germany (Figure B-3), features a lift pipe in which residual carbon is burned off spent hot solid feedstock to provide process heat. Burned feedstock is carried to the retort for solid-to-solid heat transfer to the raw feedstock. It has been successfully tested for processing Green River Oil Shale. (Ref. 20)
Petrosix Vertical-Shaft Retort – The largest surface oil shale pyrolysis reactor currently operating is the Petrosix 11-m vertical shaft Gas Combustion Retort (GCR) used in Brazil’s Oil shale development program. It was designed by the engineers who designed and built the Bureau of Mines GCR and the Paraho GCR. The Petrosix technology is discussed in Section 2. (Ref. 20)
In-Situ Retorting Processes – In-situ processes can be technically feasible where permeability of the rock exists or can be created through fracturing. “True in-situ” processes do not involve mining the shale. The target deposit is fractured, air is injected, the deposit is ignited to heat the formation, and resulting shale oil is moved through the natural or man-made fractures to production wells that transport it to the surface.
In true in-situ processes, difficulties in controlling the flame front and the flow of pyrolized oil can limit the ultimate oil recovery, leaving portions of the deposit unheated and portions of the pyrolized oil unrecovered. An example is shown in Figure B-4. (Ref. 20).
Figure B-3. Lurgi-Ruhrgas Retort
B-4 Strategic Significance of America’s Oil Shale

Volume II – Oil Shale Resources Technology and Economics
Modified in-situ processes attempt to improve performance by exposing more of the target deposit to the heat source and by improving the flow of gases and liquid fluids through the rock formation, and increasing the volumes and quality of the oil produced. Modified in-situ involves mining beneath the target oil shale deposit prior to heating. It also requires drilling and fracturing the target deposit above the mined area to create void space of 20 to 25 percent. This void space is needed to allow heated air, produced gases, and pyrolized shale oil to flow toward production wells. The shale is heated by igniting the top of the target deposit. Condensed shale oil that is pyrolized ahead of the flame is recovered from beneath the heated zone and pumped to the surface.
The Occidental vertical modified in-situ process was developed specifically for the deep, thick shale beds of the Green River Formation. About 20 percent of the shale in the retort area is mined; the balance is then carefully blasted using the mined out volume to permit expansion and uniform distribution of void space throughout the retort. A combustion zone is started at the top of the retort and moved down through the shale rubble by management of combustion air and recycled gases. Full-scale retorts would contain 350,000 cubic meters of shale rubble. (Ref. 20)
Note: Discussions of the features of many of the major technology advances achieved since 1991 are provided in the prior sections of this volume.
Figure B-4 Geokinetics Horizontal Modified In-Situ Retort
Strategic Significance of America’s Oil Shale B-5