strategic schemas and corporate environmental performance ... · strategic schemas and corporate...
TRANSCRIPT

Strategic Schemas and Corporate Environmental Performance: Theorizing, Testing, and
Enriching an Interpretive Framework
Guillaume Pain
A Thesis
In the Department
of
Management
Presented in Partial Fulfillment of the Requirements
For the Degree of
Doctor of Philosophy (Business Administration) at
Concordia University
Montreal, Quebec, Canada
April 2017
© Guillaume Pain, 2017

iii
ABSTRACT
Strategic Schemas and Corporate Environmental Performance: Theorizing, Testing, and
Enriching an Interpretive Framework
Guillaume Pain, Ph.D.
Concordia University, 2017
Environmental science draws public and scholarly attention to the disquieting deterioration
of the global ecosystem and its impacts on human activities. Environment and management
researchers have been looking at the role of business organizations in this phenomenon, both as
contributors to degradation and as leaders in restoration, thus bringing forth the issue of corporate
environmental performance (CEP). Research on the antecedents of CEP has examined a variety of
internal and external predictors, but has surprisingly overlooked strategic schemas, which are often
implied in this research and recognized as prompters for social and environmental actions.
Management research needs further exploration of strategic schemas and lacks a framework that
relates schemas to corporate environmental performance. The three papers in this doctoral thesis
attempt to fill these gaps. The first paper proposes an interpretive framework on CEP that integrates
literatures on schemas and sustainability. This framework offers an original view of schema
interaction and evolution, where schema interaction models traditionally understood as discrete
are shown to be interrelated. The framework also provides an explanation for business
organizations’ limited success in addressing global environmental issues. The second paper
validates part of the framework by testing a set of relationships between schemas, organizational
actions, and CEP. Combining content analysis with quantification techniques, this paper finds that
although firms gather information and learn about natural environmental issues, they fail to
translate their knowledge into appropriate actions. Perhaps as a result, corporate environmental
initiatives correlate with a deterioration of CEP. The third paper employs cognitive mapping to
examine the discourse on sustainability produced by an international trade association and four
member companies over a period of eleven years. This study reveals that disclosed schemas change
through two fundamental mechanisms of growth and reduction which can be used to explain all
schema evolution. It also unveils the existence of two distinct types of schema content: core and
peripheral content. Although schemas tend to grow incrementally, peripheral content undergoes

iv
frequent growth and reduction, while core content grows and shapes the meaning attributed to
newer content. Larger companies use the trade association as a vector to disseminate their schemas
on sustainability and influence the schemas of smaller firms -and possibly of the industry as
whole- by adopting and promoting new sustainability practices early. Together, these three papers
provide an original and testable framework to understand CEP from a cognitive perspective,
qualify the relationship between strategic schemas and CEP, and reveal underlying mechanisms
of schema evolution.
v
ACKNOWLEDGEMENTS
I would like to thank my co-supervisors, Drs. Paul Shrivastava and Raymond Paquin, for
their continuous support all along my PhD adventure. Paul, thank you for letting me explore the
topics of my choice, for giving me empathetic guidance when I was in doubt, and for offering
profound advice on the various aspects of the academic career. Ray, thank you for organizing your
magic brainstorming sessions, for providing moral help when I faced adversity, and for showing
me academic life behind the curtain. I would also like to thank my other committee member,
Dr. Ann Langley, for her careful guidance. Your teaching and mentoring have inspired me with
the deepest respect. You have summarized many of my fastidious reflections into concise and
accurate insights. You have always emphasized the potential contribution of my research efforts.
Above all, you have systematically pushed me beyond my limits and made my work more
thorough.
In addition to my thesis committee, several persons have provided valuable help with
individual thesis papers. Drs. Michael Russo, Jorge Rivera, Alfred Marcus, Joel Marcus, and Peter
Jaskiewicz constructively commented on the first paper. In the development of the second article,
Dr. Donna Wood helped with nomological articulation, Drs. Suzanne Tilleman, Kaspar Schattke,
and Robert Platt advised on statistical methods; Drs. Mike Russo and Judith Walls kindly refereed
dictionary validation; Drs. Vadake Narayanan and Pawan Budhwar contributed friendly reviews;
and, Ms. Olivia Oudinot provided extraordinary research assistance. Finally, in the preparation of
the third paper, Dr. Linda Dyer helped me face a difficult data gathering situation, and Ms. Zhanna
Osipyan supplied outstanding research assistance. You all have my sincere gratitude for your kind
help.
I would also like to thank the Management Department staff at the John Molson School of
Business for their support. Mses. Manuela Dohmen and Catherine Sarrazin have patiently
responded to my countless requests for advice and services over the years. Your work has made it
easy and fun for me to identify academic resources, teach courses, reserve rooms, and gain insights
about the inner workings of Concordia University. I am also grateful to the faculty members in the
Management Department who have been mentors and/or friends. My thanks go to Drs. Rajshree
Prakash, Kai Lamertz, Rick Molz, Mick Carney, Joel Bothello, Young-Chul Jeong, Tasha Wallace,
Alexandra Dawson, Kathleen Boies, Robert Nason, Stéphane Brutus, Shannon Lloyd, Georgios

vi
Farfaras, Messrs. Tim Field and Guy Barbeau, and Mses. Melanie Briand and Danielle Ker. Thank
you all warmly.
My fellow students and friends in the PhD program have helped me keep a healthy balance
between work and leisure, and they accompanied me through many academic hurdles. For the
moments spent together, the parties, the meals, the advice, the discussions, the jokes, the craziness,
I would like to thank Arash Amirkhani, John Vongas, Tony Bongiorno, Ehsan Derayati, Heather
Cluley Bar-Or, Gillian Leithman, Brad Aeon, Megan Pepe, Yasaman Gorji, Raghid Al Hajj,
Mostafa Ayoobzadeh, Zheni Wang, Chun Zhang, Andrea Kim, and Morteza Sardari. You guys
rock!
Writing this thesis would not have been possible without my family’s support. To my wife,
Paula, I am unsure that I fully realize all the efforts you have made to facilitate my work. Thank
you for your love and support. You are my “half orange”. To my daughters, Célia and Amanda,
thank you for your understanding when daddy was too tired. You are my little marvels. To my
parents, Jacques and Martine Pain, thank you for never looking bored when I presented simplistic
research ideas in convoluted ways. Nothing gets in the way of the Black Knight and Lady. You
are great parents and grand-parents. To my mother-in-law, Margarita, who tirelessly took care of
my family, please do not send the bill. Thank you for your loving help. To my sister, Séverine,
you are the best, but “The Queen is a bighead”. With Raphael, Chloé, Emily, Leonor, and Denis,
you are a wonderful family. My loving thanks to you all.
In conclusion, I would like to acknowledge financial support to my doctoral studies and
thesis research. In addition to my wife and parents, the following institutions have provided
generous funding: Concordia University, the David O’Brien Centre for Sustainable Enterprise, and
the Québec Fund for Research on Society and Culture. I am grateful for their support.

vii
CONTRIBUTION OF AUTHORS
Although I employ the author’s “we” in all three papers, I am the sole author of this thesis.
My use of “we” equally reflects my discomfort with the pronoun “I” in my written productions,
the theoretical and technical guidance of my thesis committee and other mentors, and my intention
to enlist co-authors on the way to publication.

viii
TABLE OF CONTENTS
List of tables ................................................................................................................................... xi
List of figures ................................................................................................................................ xii
List of graphs ............................................................................................................................... xiii
List of exhibits ............................................................................................................................. xiv
Thesis overview ............................................................................................................................. 1
General focus: Corporate schemas, environmentalism, and environmental performance ........................ 1
Theoretical background and research questions ....................................................................................... 1
Research overview .................................................................................................................................... 7
Article 1 - Why change toward corporate sustainability is so challenging and how firms
may achieve it: A strategic schema framework ....................................................................... 10
Change toward corporate sustainability ........................................................................................ 10
First-order schema change and the strategic interpretation of sustainability ................................ 12
Strategic schemas and models of first-order schema change .................................................................. 12
First-order schema change and the strategic interpretation of sustainability .......................................... 15
Second-order schema change and the strategic interpretation of sustainability ........................... 17
Strategic schemas and models of second-order schema change ............................................................. 17
Second-order schema change and the strategic interpretation of sustainability ...................................... 20
Schema sponsors’ power and schema change .............................................................................. 22
Power, actions and schema change ......................................................................................................... 22
Reward power ......................................................................................................................................... 24
Coercive power ....................................................................................................................................... 25
Expert power ........................................................................................................................................... 28
Legitimate power .................................................................................................................................... 29
Discussion ..................................................................................................................................... 31
Implications for research and practice .................................................................................................... 33
Conclusion .................................................................................................................................... 35

ix
Article 2 - Ecological interpretation and corporate environmental performance: Do
communicative firms pollute less? ............................................................................................. 37
Corporate interpretation and environmental performance ............................................................ 37
Ecological interpretation: Scanning, understanding, responding ................................................. 39
Ecological scanning ................................................................................................................................ 39
Ecological understanding ........................................................................................................................ 41
Ecological responding ............................................................................................................................. 43
Methods and analysis .................................................................................................................... 43
Sample .................................................................................................................................................... 43
Dependent variable ................................................................................................................................. 44
Independent variables ............................................................................................................................. 45
Control variables ..................................................................................................................................... 51
Statistical methods .................................................................................................................................. 52
Results ........................................................................................................................................... 53
Ecological scanning ................................................................................................................................ 57
Ecological understanding ........................................................................................................................ 58
Ecological responding ............................................................................................................................. 58
Complementary analysis ......................................................................................................................... 59
Discussion ..................................................................................................................................... 61
Contributions and future research ........................................................................................................... 61
Limitations .............................................................................................................................................. 63
Implications and conclusion ......................................................................................................... 65
Article 3 - Different yet the same: The evolution of disclosed strategic schemas on
sustainability ................................................................................................................................ 67
Strategic schemas and sustainability ............................................................................................. 67
Strategic schema evolution ........................................................................................................... 68
Data and methods .......................................................................................................................... 70
Research design ...................................................................................................................................... 70
Analyzing sustainability reports.............................................................................................................. 70
Using cognitive mapping to capture schema evolution .......................................................................... 72
Research setting ...................................................................................................................................... 74
Data sources and data analysis ................................................................................................................ 76
x
Results ........................................................................................................................................... 83
Observations on schemas, ICMM membership, and environmental performance ................................. 83
Schema content and articulation ............................................................................................................. 85
Cross-organizational comparison: The adoption of the GRI guidelines ................................................. 97
The evolution of organizational schemas .............................................................................................. 102
Discussion and conclusion .......................................................................................................... 105
General discussion ...................................................................................................................... 110
Contributions......................................................................................................................................... 110
Implications for managers and policy makers ...................................................................................... 116
Limitations ............................................................................................................................................ 119
Future research directions ..................................................................................................................... 120
Conclusion: All roads lead to Rome ..................................................................................................... 122
References ................................................................................................................................... 124

xi
LIST OF TABLES
Article 1 - Why change toward corporate sustainability is so challenging and how firms
may achieve it: A strategic schema framework
Table 1 - Known models of schema change ................................................................................. 14
Table 2 - Schema sponsors’ power base, discrepancy and the range of schema change .............. 31
Article 2 - Ecological interpretation and corporate environmental performance: Do
communicative firms pollute less?
Table 1 - Definitions accompanying instructions to panel members for dictionary validation .... 49
Table 2 - Interrater reliability coefficients (IRC) of the ecological interpretation dictionaries .... 50
Table 3 - Correlations of ecological interpretation dimensions .................................................... 51
Table 4 - Hausman tests for each hypothesis ................................................................................ 53
Table 5 - Descriptive statistics ...................................................................................................... 54
Table 6 - Pairwise correlations ..................................................................................................... 55
Table 7 - Ecological scanning, understanding, responding, and positive interpretation of
environmental issues: Results of fixed and random effects regressions ....................................... 55
Table 8 - Regression models of corporate environmental impact ................................................ 57
Table 9 - Independent group t-tests on mean ecological responding............................................ 60
Table 10 - Within-group panel regressions ................................................................................... 61
Article 3 - Different yet the same: The evolution of disclosed strategic schemas on
sustainability
Table 1 - Coding categories (adapted from axelrod, 1976 and barr et al., 1992) ......................... 73
Table 2 - Compiled organizational data ........................................................................................ 78
Table 3 - Categories describing sustainability strategies and their components .......................... 82
Table 4 - Strategic objectives ........................................................................................................ 88
Table 5 - Credibility ...................................................................................................................... 89
Table 6 - Stakeholder management............................................................................................... 90
Table 7 - Leadership ..................................................................................................................... 92
Table 8 - Commitment .................................................................................................................. 93
Table 9 - Sustainability performance ............................................................................................ 95
Table 10 - Sustainability practices ................................................................................................ 96
Table 11 - Chronology of GRI guidelines adoption ..................................................................... 98

xii
LIST OF FIGURES
Article 1 - Why change toward corporate sustainability is so challenging and how firms
may achieve it: A strategic schema framework
Figure 1 - Models of schema interaction and change, and linking factors ................................... 20
Article 3 - Different yet the same: The evolution of disclosed strategic schemas on
sustainability
Figure 1 - Graphic representation of ICMM’s disclosed schema on sustainable development in
2003............................................................................................................................................... 74
Figure 2 - Articulation of strategic components underpinning corporate sustainability .............. 86
Figure 3 - Core and peripheral schema content .......................................................................... 105

xiii
LIST OF GRAPHS
Article 2 - Ecological interpretation and corporate environmental performance: Do
communicative firms pollute less?
Graph 1 - Operational model of ecological interpretation and environmental performance ........ 39
Graph 2 - Frequency distribution of the interpretation of environmental issues .......................... 58
Article 3 - Different yet the same: The evolution of disclosed strategic schemas on
sustainability
Graph 1 - Evolution of schema complexity .................................................................................. 80

xiv
LIST OF EXHIBITS
Article 2 - Ecological interpretation and corporate environmental performance: Do
communicative firms pollute less?
Exhibit 1 - Instructions to panel members for construct validation .............................................. 48
1
THESIS OVERVIEW
General Focus: Corporate schemas, environmentalism, and environmental performance
The purpose of this thesis is to explore and explain how strategic thinking affects and
constrains corporate response to environmental issues. It started with the observation that firms
have been engaging in corporate environmentalism for over four decades with limited results
(Whiteman, Walker, & Perego, 2013). A question followed: How could firms address
environmental issues for such a long time and hardly curtail environmental degradation?
Environmental degradation manifests in global indicators such as climate change, ocean
acidification, ozone depletion, fresh water availability and use, biodiversity loss, and chemical
pollution (Rockström et al., 2009; Steffen et al., 2015). Disaggregated at the organizational level,
environmental degradation materializes in corporate environmental performance (CEP), which is
“the outcome of a firm’s strategic activities that manage its impact on the natural environment”
(Walls, Berrone, & Phan, 2012: 891). CEP thus consists in “these actual environmental outcomes,
with their tangible and material impacts on the earth, that ultimately matter.” (Delmas, Etzion, &
Nairn-Birch, 2013: 263).
Building on the assumption that firms both cause and can help mitigate environmental
issues, and following the cognitive perspectives in strategy (Mintzberg, Ahlstrand, & Lampel,
2005; Narayanan, Zane, & Kemmerer, 2011) and organization theory (Walsh, 1995), this thesis
investigates the links between strategic thinking, environmental initiatives, and environmental
performance. In theoretical terms, this thesis examines the relationship between strategic schemas,
the socially-shared cognitive maps that shape strategic actions; corporate environmentalism, the
integration of environmental practices in business operations; and, corporate environmental
performance.
The next section briefly reviews the theoretical background and research questions,
followed by a synopsis of the thesis, and the three articles.
Theoretical Background and Research Questions
Environmental sustainability. Environmental sustainability, the conditions in which the
natural environment can sustain itself indefinitely (Daly, 1990), is one of the most pressing issues
of the 21st century, in that it connects to the earth’s capacity to harbor life and to crucial social and
economic challenges. Environmental sustainability affects the whole planet, billions of lives, and
currently “The survival of many societies, and of the biological support systems of the planet, is

2
at risk.” (United Nations General Assembly, 2015: 5). Environmental sustainability matters in
business contexts, where the environment circumscribes the resources available to companies,
which in turn employ these resources and alter surrounding ecosystems more or less intensely,
affecting the environment’s capacity to renew resources. Environmental sustainability has thus
become a strategic concern for many businesses, especially those who rely heavily on natural
resources to create value. Environmental sustainability’s significance is critical to enterprise
strategists -typically top management- who ponder and define the role of business in society
(Schendel & Hofer, 1979), and to stakeholders whose ecological concerns affect corporate
environmentalism and corporate environmental performance (Kassinis & Vafeas, 2006; Sharma
& Henriques, 2005).
A number of factors in the organization and its environment shape CEP, although research
on CEP strictly speaking -actual environmental outcomes- focuses mainly on internal predictors
so far. Aspects of corporate governance like board size, board independence, board gender
diversity, outside CEO representation on board, stakeholder representation on board, legal
expertise on board, and shareholder activism have been linked to CEP (de Villiers, Naiker, & van
Staden, 2011; Kock, Santaló, & Diestre, 2012; Walls et al., 2012). Investigations of the link from
strategic planning to CEP produced uneven findings. While the level of integration of
environmental issues in strategic planning was found to correlate with CEP (Judge & Douglas,
1998), some authors suggested reversed causality: performance gaps lead to the strategic
integration of environmental issues (Russo & Harrison, 2005). Other studies examined resource
affluence and allocation through proxies such as size, resources, and environmental innovation,
and found evidence that firm size and resources predict CEP (Elsayed, 2006). In contrast, the
relationship between innovation and CEP may be negative overall despite case-based evidence to
the contrary (York, 2004), suggesting that most innovations do not comprise an environmental
component. Innovation is complex and many elements moderate its impact on CEP, like
innovation type (process or product), industry, firm size, regulatory constraints, and information
sources (Pavelin & Porter, 2008). Environmental innovation can also imply trade-offs among
different environmental improvements (Poesche, 1998). However, long-term patterns in the
composition of local environmental innovation portfolios predict CEP (Klassen & Whybark,
1999), suggesting an overarching role for strategic vision as embedded in firms’ prevailing
schemas.
3
Few studies investigate external predictors of CEP. They reveal that environmental
management programs and environmental certifications (e.g. ISO 14001) may lead to enhanced
CEP (Cordano, Marshall, & Silverman, 2010; Melo & Wolf, 2005). Nonetheless, companies
seeking social legitimacy or economic performance often decouple implementation from
environmental performance (Schaefer, 2007), and “decoupled” implementation is unlikely to lead
to superior CEP (Aravind & Christmann, 2011). Stakeholder pressures also affect CEP, especially
when they come from resourceful stakeholders and/or stakeholders with strong pro-environmental
preferences (Kassinis & Vafeas, 2006). Corporate social responsibility (CSR) research offers
similar insights on external predictors of social performance. It confirms that stakeholders, in
particular shareholders, consumers, the media, local communities, and interest groups conduct
various actions to induce firms to engage in CSR (Aguinis & Glavas, 2012). CSR research also
musters some evidence of the role of regulations, standards and certifications as predictors of CSR
initiatives. However, many CEP and CSR studies are not designed to explain what proportion of
CEP and CSR is explained by external predictors (e.g. Buehler & Shetty, 1974; Fineman & Clarke,
1996; Melo & Wolf, 2005), while those who address this question show limited external predictor
effect on CEP and CSR (e.g. Christmann & Taylor, 2006; Kassinis & Vafeas, 2006). Further, some
authors suggest that standards and certifications may diminish corporate focus on substantive CSR
and increase engagement in symbolic CSR, that is, minimal compliance with external requirements
(Aguinis & Glavas, 2012), consistent with the above-mentioned findings on decoupling (Aravind
& Christmann, 2011; Schaefer, 2007). These results suggest that internal factors exert significant
influence on CSR and CEP.
In sum, research on the internal organizational predictors of CEP has produced
inconclusive findings, perhaps with the exception of resource affluence, which appears to relate
with CEP. In parallel, research on the external antecedents of CEP has shown a positive although
limited influence from regulations and stakeholder pressure. Together, these findings call for
further investigation of internal predictors that have not been considered in the past, such as
corporate schemas. Although often implied in CEP studies in the form of organizational
interpretations (e.g. Aravind & Christmann, 2011; Cordano et al., 2010; Schaefer, 2007) and
widely recognized as predictors of CSR actions (Aguinis & Glavas, 2012; Angus-Leppan, Metcalf,
& Benn, 2010; Banerjee, 2001; Bansal, 2003; Basu & Palazzo, 2008; Eberhardt-Toth &
4
Wasieleski, 2013; Thomas, 2005), corporate schemas have not been addressed as antecedents of
CEP.
Schemas. Early discussions of schemas’ role in human cognition come out in the works of
18th century German philosopher Immanuel Kant who described them as rules by which people
associate abstract categories with sense perceptions (Kant, 1998). Swiss psychologist Jean Piaget
received credit for introducing the term to psychology in the 1920’s. Piaget (1952) theorized that
children build schemas from previous experience to understand and organize subsequent
experience. Closer in time, the construct of schema appears in Schutz (1962) who advances that
schemas, or schemes of reference, consist in a stock of previous experiences of the world that
forms the basis of all interpretation, especially in social interactions:
“When I encounter a man acting in the social world, I know that I must understand
him as a human being, and this means that his actions mean something to him as
well as to me, relate to his world as well as to mine, and are ultimately rooted in
the interpretive scheme he has created for living his life. But this knowledge is itself
taken for granted by me as well as by him; its being taken for granted by us is
precisely the typification which makes intersubjectivity possible.” (1962: XXXV)
Similarly, Garfinkel describes schemas as interpretation frameworks made of standardized
symbols and “a pre-established corpus of socially warranted knowledge” (Garfinkel, 1967: 56).
But perhaps the theoretical significance of schemas has become more widely accepted in
management, strategy, and organization research since Goffman’s (1974: 21) conceptualization of
cognitive frames as “schemata of interpretation”, which are loosely organized systems of “entities,
postulates, and rules” that allow users to “locate, perceive, identify, and label a seemingly infinite
number of concrete occurrences defined in its terms”. Since then, schemas have been used by
management scholars across disciplines such as organizational behavior (e.g. Brands, Menges, &
Kilduff, 2015), cognitive psychology (e.g. Dane, 2010; Fiske & Dyer, 1985), social psychology
(e.g. Bartunek, 1984, 1993), organization theory (e.g. Bingham & Kahl, 2013; Labianca, Gray, &
Brass, 2000), and strategy (Nadkarni & Narayanan, 2007a, 2007b). Today, strategy and
organization scholars give the concept of schema a central place (Bingham & Kahl, 2013) and use
it frequently to posit that interpretations shape organizational responses to a variety of issues.
In strategy, the cognitive perspective commonly assumes that corporate cognitions prompt
actions. For example, Mintzberg and colleagues propose that “Strategists are largely self-taught:
5
they develop their knowledge structures and thinking processes mainly through direct experience.
That experience shapes what they know, which in turn shapes what they do” (2005: 150).
Moreover, strategy researchers have reached consensus regarding the role of schemas:
“In spite of the diversity of views in the cognitive school, on one point there is
widespread agreement: an essential prerequisite for strategic cognition is the
existence of mental structures to organize knowledge. These are the “frames”
referred to above, although a host of other labels have been used over the years,
including schema, concept, script, plan, mental model, and map.” (Mintzberg et
al., 2005: 159)
Several authors draw attention to how schemas structure organizational cognitions
(Bartunek, 1984; Jarzabkowski, 2008), including as regards corporate environmental initiatives
(Basu & Palazzo, 2008; Hahn, Preuss, Pinkse, & Figge, 2014). These works indicate that various
organizational schemas compete and interact within firms, shaping corporate interpretation and
response. In particular, managers dealing with ecological issues need to reconcile intricate
economic, environmental, and social concerns (Hahn et al., 2014).
Despite these developments, questions remain concerning schemas and how schemas relate
to action and performance. First, most strategy research employing a cognitive perspective
assumes the relationship between schemas, actions, and performance; very few studies challenge
this assumption despite calls for empirical testing (e.g. Corner, Kinicki, & Keats, 1994; Daft &
Weick, 1984). Second, existing research underemphasizes schema evolution and processes of
mutual influence between schemas and experience. Emphasis on causality (i.e. schemas trigger
actions) engenders frozen conceptualizations of schemas (for exceptions, see Bingham & Kahl,
2013; Dane, 2010), while the growing number of studies that depict schema competition within
and around organizations (e.g. Kaplan, 2008; Maitlis, 2005) call for deeper knowledge on schema
interaction and evolution.
Schemas and environmental performance. By examining corporate schemas and
environmental performance together, this thesis contributes to filling the gaps and solving the
issues described above. Because schemas are indirectly related to, and affect several antecedents
of, environmental performance, they provide an alternative to oversimplified perspectives on
environmental performance predictors: schemas shape corporate actions, mould organizational
structure, buffer and distort outside influences (Bartunek, 1984). In other words, schemas are prone
6
to create a comprehensive view that accommodates internal and external CEP predictors. Further,
schemas’ connection to a variety of CEP predictors requires conceptual clarity, which in turn may
help solve key issues. In particular, conceptual clarity demands an accurate definition and
conceptualization of CEP which prevents the amalgamation between environmental actions and
CEP. This distinction is fundamentally relevant since it steers sustainability research away from
organization-centered accounts which often confound corporate environmental actions and
performance, towards ecologically-driven narratives which emphasize actual corporate
environmental performance (Bansal & Gao, 2006; Delmas et al., 2013). Schemas also provide a
useful theoretical lens to understand corporate environmentalism because they allow accounting
for multiple perspectives within and around corporate environmental actions and performance. As
mentioned, the literature on organizational interpretation has recently stressed the co-existence of
competing schemas within organizations, especially as regards ecological issues, cueing research
on schema interaction and evolution. A schema perspective highlights multiple organizational
ideas, reveals interaction dynamics, and sheds light on the cognitive precursors of corporate
environmentalism and corporate environmental performance. In parallel, a schema perspective
opens the door to questioning the assumption that schemas shape actions and performance.
Beyond providing a better understanding of schemas and the relationship between
schemas, actions and performance, this thesis offers dynamic explanations of schema interaction
and evolution, which shed a new light on corporate environmentalism. Indeed, this thesis
contributes to the development of theory on schemas and on CEP by revealing the mechanisms
that shape the outcomes of interactions between diverging schemas on CEP. The articles in this
thesis contribute an innovative explanation of schema interaction mechanisms, demonstrate the
explanatory power of the schema perspective as regards CEP, and illustrate the application of
useful research tools for schema studies. Collectively, the papers in this thesis move toward
specifying a more appropriate conceptualization of schemas as dynamic, and of corporate
environmentalism as plural, even within one organization. How schema interaction might impact
corporate environmentalism is the focus of the first article, leading to two research questions:
1) How do firm-level schemas interact with experience and other schemas? 2) What are the
mechanisms underlying schema interaction? Whether the assumed link between corporate
cognition and action can be empirically tested in the context of environmental issues sparked the
second article, which asks: Does ecological interpretation reflected in corporate schemas predict
7
CEP? Finally, schema competition and the evolution of schemas on the natural environment
inspired the third article, whose research questions are: 1) How do corporate schemas evolve over
time? 2) How do powerful schema sponsors influence others’ schemas?
Research Overview
The first paper is theoretical and synthesizes schema research from the cognitive
perspectives in strategy (for a review, see Narayanan et al., 2011), in organization theory, and
several references in social psychology (for a review, see Walsh, 1995). It also builds on research
that investigates corporate sustainability from a cognitive perspective (e.g. Basu & Palazzo, 2008;
Hahn et al., 2014) to describe an interpretive framework that relates strategic schemas to corporate
environmental sustainability and highlights the role of schema interaction. Whereas past research
has presented schema interaction patterns as separate, this article proposes that interaction patterns
systematically connect. Applied to the interaction of instrumental (traditional, profit-oriented) and
integrative (economically, socially, and environmentally balanced) sustainability schemas, this
framework suggests that firms labor with environmental issues because they withstand schematic
interaction dynamics that weaken newer strategic schemas and bolster extant ones. Schema
sponsors may however employ different types of power to alter firms’ schemas and/or
organizational arrangements, either maintaining or disrupting schematic dynamics, and in the latter
case, creating momentum for change toward corporate sustainability.
The second article empirically tests the relationship between ecological interpretation and
CEP, explicating ecological interpretation as a process made of three stages: scanning,
understanding, and responding to ecological issues. Independent variables come from counting
environmental terms representing these three stages in the sustainability reports of 108 randomly
selected firms in the Trucost environmental impact database, from 2006 to 2009. The sampled
companies come from a wide range of industries and services, and are headquartered in Europe,
North America, and Asia. The analysis first associates scanning, understanding, and responding
with three dictionaries of words and phrases following a rigorous procedure for computer-aided
text analysis (CATA) recommended by Short, Broberg, Cogliser, and Brigham (2010). The final
dictionaries hold 94 words and phrases for ecological scanning, 283 for ecological understanding,
and 110 for ecological responding. In parallel, a research assistant gathered sustainability reports
from corporate websites, the Global Reporting Initiative’s (GRI) database, and an independent
online repository of corporate responsibility reports. Fewer reports were available in the earlier
8
years of the study and this was the main constraint on sample size. I then fed the sustainability
reports into a text analysis software loaded with the three ecological interpretation dictionaries to
measure the importance of each stage within the selected firms’ disclosed schemas. Using
Trucost’s Total Environmental Damage Cost (TEDC) as my dependent variable, I then ran panel
regressions to test relationships between scanning, understanding, responding, and corporate
environmental performance. I used statistical controls for firm size, changes in production,
industry, industry-specific pollution, and environmental regulation stringency. I also applied time
lags: for example, to predict corporate environmental impact in 2009, I employed a measure of
ecological responding in 2008, and of ecological scanning and understanding in 2007. In line with
theory, scanning and understanding appear to be related. Contrary to expectations though, firms in
the sample do not translate understanding of ecological issues into corresponding environmental
actions. Perhaps more puzzling, corporate response to ecological issues seems to worsen firms’
CEP. I propose interpretations of these results.
The third paper explores strategic schema evolution from 2003 to 2013 in four companies
that are members of the International Council for Mining and Metals (ICMM), a trade association
whose mission is to enhance environmental performance in the mining industry. Sampling was
theoretical: two founding companies that continued membership over the studied period; one
founding company that left in 2007; and, a newcomer as of 2009. Cognitive mapping (Axelrod,
1976; Barr, Stimpert, & Huff, 1992; Huff, 1990; Huff & Jenkins, 2002) was then applied to
sustainability reports. Cognitive mapping is a content analysis technique that highlights concepts,
conceptual relationships and conceptual values in texts, thus usefully exposing the three
components of schemas. A research assistant and I learned the cognitive mapping procedure
developed by Huff, Narapareddy, & Fletcher (1990) and made our own adaptation. We coded the
sustainability reports of the five organizations over 11 years, producing 55 cognitive maps. I
analyzed individual maps, compared maps over time, and across companies to characterize map
content, capture the value ascribed to concepts, uncover patterns of convergence, make inferences
on mutual influence among ICMM member companies, and identify schema change patterns.
Through these analytical steps, I identify two fundamental mechanisms, growth and reduction,
which can describe all schema evolution. I also distinguish between two types of schema content:
core and peripheral. I find that schemas as a whole tend to grow incrementally, whereas peripheral
content undergoes frequent growth and reduction, and core content mostly grows. Core content

9
also shapes the meaning attributed to newer schema content. Finally, this paper unveils how larger
companies use the trade association as a vector to spread their schemas on sustainability. By
adopting and promoting new sustainability practices early, they influence the schemas of smaller
firms and possibly of the industry as whole.

10
ARTICLE 1
Why Change Toward Corporate Sustainability Is So Challenging and How Firms May
Achieve It: A Strategic Schema Framework
CHANGE TOWARD CORPORATE SUSTAINABILITY
Managing changes in firms’ environments is difficult (Bingham & Kahl, 2013) and
managing changes in the natural environment is one of the most arduous challenges facing firms
today. As reflected in the continued and accelerating deterioration of key global environmental
indicators (Rockström et al., 2009; United Nations Environment Programme, 2012), firms have
obtained only weak results in addressing natural environmental issues, despite over three decades
of efforts (Whiteman et al., 2013). Strategy and organization studies indicate that managerial and
firm-level interpretations play a crucial role in corporate response to contextual changes (Nadkarni
& Narayanan, 2007a). Within firms, different interpretations may compete (Kaplan, 2008) or co-
exist, possibly resulting in ambiguous responses. Managers dealing with ecological issues need to
reconcile intricate economic, environmental, and social concerns, which may lead to ambivalent
issue interpretation (Hahn et al., 2014). This might explain why change toward corporate
sustainability is so challenging.
Organizational interpretations have served as a framework to study the emergence of green
initiatives (Etzion, 2007; Howard-Grenville, 2007a; Muller & Kolk, 2010) and several authors
draw attention to the structuring role of firm-level schemas in organizational interpretations
(Bartunek, 1984; Jarzabkowski, 2008; Ranson, Hinings, & Greenwood, 1980). Basu and Palazzo
(2008) argue that schemas shape corporate interpretations and decision-making as regards
environmental concerns. They propose a view whereby managerial thinking, language, and
behavioral disposition shape firms’ interpretation and enactment of corporate social responsibility.
Hahn et al. (2014) distinguish between two archetypal schemas and suggest that they differently
impact the breadth and depth of interpretation, evaluation, and managerial responses to
sustainability issues. Together, these works suggest that firms respond to ecological issues only
when they interpret them as issues (Bansal, 2003; Howard-Grenville, 2007b) and that different
firm-level schemas compete and interact within firms, shaping corporate interpretation and
response.
11
Although extant research recognizes the diversity of economic, social and environmental
issues facing firms and the tensions among them (Bansal, 2003; Hahn et al., 2014), it
underemphasizes schema interaction and processes of mutual influence between schemas and
experience (for exceptions, see Bingham & Kahl, 2013; Dane, 2010). Following the notion that
schemas contribute to shaping a firms’ environment (Nadkarni & Narayanan, 2007a; Weick,
1995), extant perspectives tend to propose unidirectional relationships where schemas shape firm
interpretation and response to sustainability challenges, thus concealing processes of schema
interaction. A more interactional understanding of schema change is thus needed to clarify the link
between schemas and change toward corporate sustainability.
In this article, we review and examine the literature on schema interaction and evolution to
understand how different firm-level schemas interact, shaping corporate interpretation of and
response to ecological issues. We consider two research questions: 1) How do firm-level schemas
interact with experience and other schemas? 2) What are the mechanisms underlying schema
interaction? More precisely, we mesh research on schemas and sustainability to offer an
interpretive framework linking schema interaction to corporate sustainability. This framework
includes known schema interaction patterns such as bookkeeping, subtyping, replacement and
relocation (Balogun & Johnson, 2004; Labianca et al., 2000), identifies original links among them,
and proposes that combinations of two factors -schema discrepancy and schema support by
powerful sponsors- selectively trigger these patterns. Building on French and Raven (1959), we
then suggest that different power bases affect the degree and sustainment of discrepancy so as to
enable superficial (first-order) or marked (second-order) schema change. Applied as a conceptual
lens to the interaction of instrumental (traditional, profit-oriented) and integrative (economically,
ecologically, and socially balanced) schemas, this framework suggests that firms struggle with
change toward sustainability because they are subject to schema dynamics perpetuated by
pervasive organizational arrangements that restrain newer schemas –like the integrative
perspective– and perpetuate extant schemas like the instrumental, largely economic conception
prevalent in Western societies (Banerjee, 2001; Egri and Pinfield, 1996; Key, 1999; Stormer, 2003;
Stubbs and Cocklin, 2008). Remarkably, the same power-based mechanisms explain how to create
change toward corporate sustainability.
This paper contributes to the literature on schemas by proposing a framework for schema
evolution. This framework highlights schema interaction as central to organizational
12
interpretations and change. It describes previously undiscussed links between schema interaction
patterns and, following Weick (1995), affirms the centrality of discrepancy avoidance in processes
of organizational interpretation. Also, the description of power bases that alter the degree and
sustainment of schema discrepancy sheds a new light on the mechanisms that govern schema
interaction. Finally, this work contributes to the corporate sustainability literature as it explains
firms’ limited accomplishments in redressing natural environmental issues.
FIRST-ORDER SCHEMA CHANGE AND
THE STRATEGIC INTERPRETATION OF SUSTAINABILITY
Strategic schemas and models of first-order schema change
Firm constituents make sense of environmental changes through topic-specific cognitive
frames called schemas (Balogun & Johnson, 2004; Bartunek, 1984, 1993; Labianca et al., 2000).
Individuals routinely negotiate collective schemas that create shared meanings for organizational
constituents, for an organization as a whole (Bartunek & Moch, 1987; Kaplan, 2008), or even for
an industry (Bingham & Kahl, 2013). Firm-level schemas are also called strategic schemas
(Nadkarni & Narayanan, 2007b). Schemas map concepts, their perceived value, and relationships
among them (Bartunek, 1993). They function like socially-shared understandings of experience,
its relevance, meaning and processing. They filter and structure experience, and provide norms for
relevance, interpretation, and behavior (Bartunek, 1984), thus shaping how firms constituents
interpret their environment (Balogun & Johnson, 2004). Schemas give experience reality by
defining what is relevant and how to handle it. Reciprocally, meaning attributed to experience
supports the schema that generated it (Bartunek, 1993; Giddens, 1979; Schutz, 1962).
Usually tacit and taken for granted, schemas are made explicit when firm constituents
express them as values -desired goals and preferences- and interests as to the distribution and
allocation of organizational resources (Ranson et al., 1980). When they do so, firm constituents
deliberately or unknowingly act as schema sponsors who enact and thus support their own
schemas. However, schemas often remain unnoticed because they are conveyed through
inconspicuous organizational mechanisms like vocabularies, communication channels,
procedures, and personnel selection (Weick, 1995). Hardly detectable, schemas pervade
organizations and are difficult to change. Despite this tendency for self-preservation (Schutz, 1962:
230), schemas are dynamic and may change over time (Balogun & Johnson, 2004) as they are
13
constantly exposed to confirming and disconfirming schemas and experience. First, firms comprise
various schemas that are rarely shared throughout the whole organization (Balogun & Johnson,
2004; Maitlis, 2005; Maitlis & Sonenshein, 2010). Second, firms continuously interact with
stakeholders that carry different schemas. Third, organizations bracket information from the
constant flow of experience which may disconfirm existing schemas (Labianca et al., 2000).
Through these confirming and disconfirming interactions with other schemas and experience,
schemas may come out reinforced, or undergo two broad types of change: first-order change
consists in gradual alterations in how interpretation is made, whereas second-order change reflects
a radical shift whereby organizational norms and world views are transformed (Bartunek, 1984).
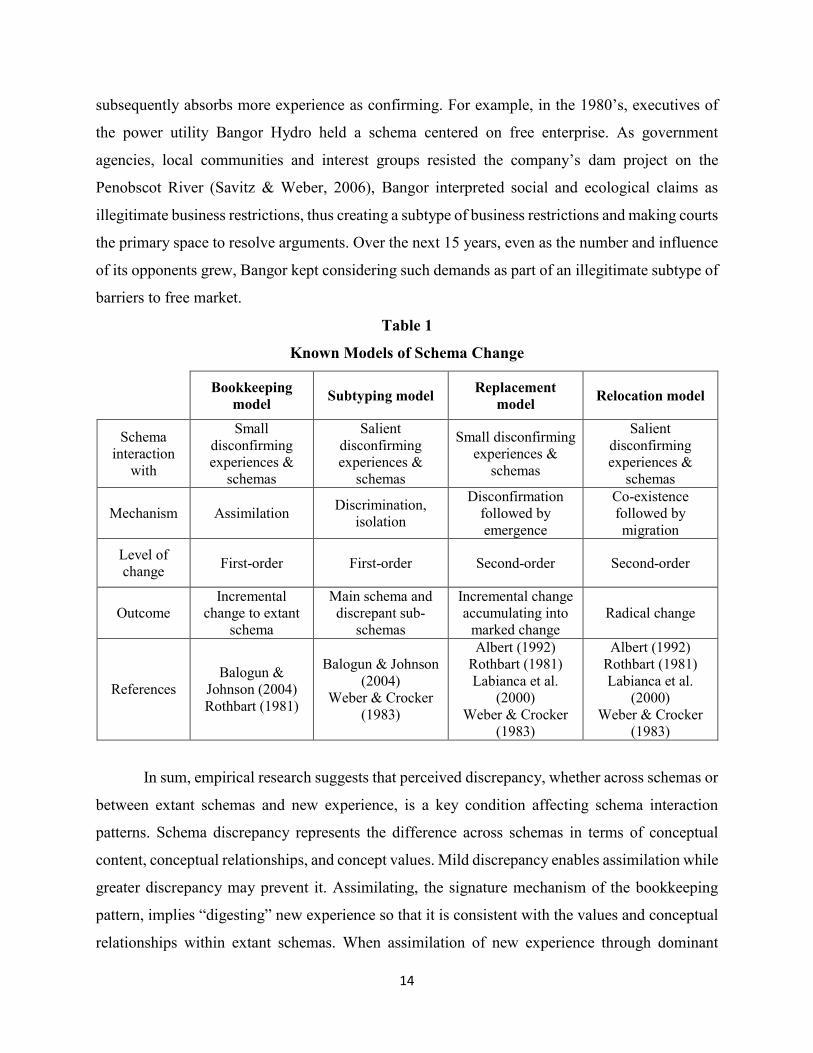
Research describes two models that lead to first-order schema change (see table 1 below).
The first, the bookkeeping model, describes the incremental modification of an extant schema by
disconfirming experience (Balogun & Johnson, 2004; Rothbart, 1981; Weber & Crocker, 1983).
New ideas that trigger incremental modification tend to bring refinements or extensions to existing
ideas (Dane, 2010). Incremental modification may entail a few new concepts and conceptual
relationships but does not disrupt existing causal chains, nor the order of collective values (Barr et
al., 1992). In firms, bookkeeping was found to explain the refinement of established schemas
(Balogun & Johnson, 2004), and accordingly, bookkeeping may manifest in mild operational
changes, like process adaptation to better serve firm strategy (Bartunek, 1984). For example, an
engineering department’s assimilation of new ecological measures along other technical
manufacturing procedures (Howard-Grenville, 2007b) illustrates the bookkeeping model.
The other model resulting in first-order change, subtyping, pictures schemas resisting
change because disconfirming experience is so discrepant that extant schemas cannot process it; a
sub-schema is created to account for discrepant information (Balogun & Johnson, 2004; Labianca
et al., 2000; Queller, 2002; Weber & Crocker, 1983). Highly discrepant new ideas tend to be
unconventional and to challenge accepted understandings (Dane, 2010). Highly discrepant
schemas may involve a large number of new concepts and conceptual relationships, may go against
established causal chains, and change the order of collective values (Barr et al., 1992). In
subtyping, the extant schema remains perceived as generally valid and subsumes the new one,
which is seen as singular. Subtypes appear because highly discrepant experience is not perceived
as representative of the whole (Weber & Crocker, 1983). The subdivision of a central schema into
subtypes ensures that it applies to a wider array of experience (Nicholson & Anderson, 2005) and
14
subsequently absorbs more experience as confirming. For example, in the 1980’s, executives of
the power utility Bangor Hydro held a schema centered on free enterprise. As government
agencies, local communities and interest groups resisted the company’s dam project on the
Penobscot River (Savitz & Weber, 2006), Bangor interpreted social and ecological claims as
illegitimate business restrictions, thus creating a subtype of business restrictions and making courts
the primary space to resolve arguments. Over the next 15 years, even as the number and influence
of its opponents grew, Bangor kept considering such demands as part of an illegitimate subtype of
barriers to free market.
Table 1
Known Models of Schema Change
Bookkeeping
model Subtyping model
Replacement model
Relocation model
Schema interaction
with
Small disconfirming experiences &
schemas
Salient disconfirming experiences &
schemas
Small disconfirming experiences &
schemas
Salient disconfirming experiences &
schemas
Mechanism Assimilation Discrimination,
isolation
Disconfirmation followed by emergence
Co-existence followed by migration
Level of change
First-order First-order Second-order Second-order
Outcome Incremental
change to extant schema
Main schema and discrepant sub-
schemas
Incremental change accumulating into
marked change Radical change
References Balogun &
Johnson (2004) Rothbart (1981)
Balogun & Johnson (2004)
Weber & Crocker (1983)
Albert (1992) Rothbart (1981) Labianca et al.
(2000) Weber & Crocker
(1983)
Albert (1992) Rothbart (1981) Labianca et al.
(2000) Weber & Crocker
(1983)
In sum, empirical research suggests that perceived discrepancy, whether across schemas or
between extant schemas and new experience, is a key condition affecting schema interaction
patterns. Schema discrepancy represents the difference across schemas in terms of conceptual
content, conceptual relationships, and concept values. Mild discrepancy enables assimilation while
greater discrepancy may prevent it. Assimilating, the signature mechanism of the bookkeeping
pattern, implies “digesting” new experience so that it is consistent with the values and conceptual
relationships within extant schemas. When assimilation of new experience through dominant
15
collective schemas is too difficult, firm members isolate it as unrepresentative. This isolation is
the signature mechanism of subtyping. Discrepancy thus acts as a track switch that directs schema
interaction towards bookkeeping (low discrepancy), subtyping (high discrepancy), or
reinforcement when schemas converge (discrepancy is null).
First-order schema change and the strategic interpretation of sustainability
Economics is the predominant conception of the world in Western countries and other parts
of the world (Banerjee, 2001; Egri & Pinfield, 1996). It pervades both society and organizations
(Ferraro, Pfeffer, & Sutton, 2005) and has inspired the dominant model of the firm (Key, 1999;
Stormer, 2003; Stubbs & Cocklin, 2008). Simultaneously, the natural environment has risen as a
key business concern (Banerjee, 2001; Whiteman et al., 2013). No firm-level schema harbors
purely economic or ecological values. Rather, different values may be seen as orientations between
which schemas continuously evolve following organizational experience (Greenwood & Hinings,
1988). In some cases, managers may see sustainability in equally ecological, economic, and social
terms. Because of these multiple foci, these perspectives have been called ecocentric, integrative,
or paradoxical (Gao & Bansal, 2013; Hahn et al., 2014; Shrivastava, 1995). We follow extant
research and define corporate sustainability as the integration of social, environmental, and
economic considerations in business (Hahn et al., 2014; van Marrewijk & Werre, 2003).
Empirical research however indicates that most Western managers interpret sustainability
issues through primarily economic or sociological lenses (Boiral, Cayer, & Baron, 2009). Past
studies have repeatedly found that firms implement resource efficiency and waste reduction
strategies to generate above-average financial returns (Flammer, 2013), and that firms engage in
greener actions in response to stakeholder pressure (e.g. Zietsma & Lawrence, 2010). These
approaches explain why some firms engage in symbolic structural adaptation rather than
substantive sustainability actions, that is, decoupling (Boiral, 2007; Wijen, 2014), or in
misleadingly positive environmental communication, also known as greenwash (Lyon &
Montgomery, 2015). More generally, economic and sociological perspectives adequately explain
a range of corporate green actions ultimately meant to achieve business survival and profitability.
These perspectives have been called instrumental (Aguilera, Rupp, Williams, & Ganapathi, 2007;
Gao & Bansal, 2013; Margolis & Walsh, 2003), and based on the above discussion, we expect that
most managers and firms interpret sustainability through instrumental schemas.
16
A wide range of sustainability-related experience can be interpreted through instrumental
schemas. As noted, resource efficiency serves cost reduction, stakeholder engagement may prevent
costly lawsuits or negative media coverage, and compliance with environmental regulations
ensures avoidance of financial sanctions (for a more exhaustive list, see Basu & Palazzo, 2008:
122). From a schema-based view, experience and schemas in this line of thought may offer a small
number of novel concepts and relationships, fit well in the extant chain of causality, and will not
challenge the order of values, that is, the priority given to economic and sociological goals. They
represent low discrepancy with instrumental schemas.
Proposition 1: In most firms, the more instrumental new sustainability-related
experience or strategic schemas, the lower their discrepancy, and the higher the
likelihood of first-order schema change following the bookkeeping model.
As noted however, many sustainability-related ideas draw on the integration of economic,
social, and environmental concerns. Sustainability concerns may require, for example, that firm
growth remains within the limits that allow for the preservation of ecological integrity (Gladwin,
Kennelly, & Krause, 1995). For any firm, this may mean rejecting opportunities to generate
additional revenues when ecological integrity is at risk, and such considerations have been
qualified as radical or utopian (Banerjee, 2001; Egri & Pinfield, 1996). From a schema-based view,
experience and schemas in this line of thought prompt the revision of numerous concepts and
relationships, create new constraints in the chain of causality, and challenge the order of values by
giving equal priority to economic, social, and environmental goals. They represent high
discrepancy with instrumental schemas.
Proposition 2: In most firms, the more integrative new sustainability-related
experience or strategic schemas, the higher their discrepancy, and the higher the
likelihood of first-order schema change following the subtyping model.
17
SECOND-ORDER SCHEMA CHANGE AND
THE STRATEGIC INTERPRETATION OF SUSTAINABILITY
Strategic schemas and models of second-order schema change
Research describes two models that lead to second-order schema change (see table 1).
Extant schemas interacting with mildly discrepant experience and schemas may incrementally
change over time so that collective values become altered and produce second-order change
(Balogun & Johnson, 2004; Labianca et al., 2000). As the extant schema is gradually disconfirmed,
a new schema gradually forms following a replacement pattern (Albert, 1992). Replacement
occurs when discrepant experience disconfirms an extant schema and no clear alternative is
immediately available, leading to the emergence of a new schema (Albert, 1992). In contrast,
relocation happens when two diverging schemas momentarily co-exist and there is a migration
from one to the other (Albert, 1992). Highly discrepant experience may at first be subtyped
(Balogun & Johnson, 2004; Labianca et al., 2000) then lead to a shift from the dominant schema
to the previously subtyped schema. When either replacement or relocation are completed,
conversion has taken place (Albert, 1992, see figure 1). An example from the MacMillan Bloedel
company studied by Zietsma & Lawrence (2010) illustrates both models. Up until the 1980’s, this
forestry company operating in British Columbia had never thought of involving stakeholders in
decisions on harvesting practices. Yet, intense pressures arose against clearcutting, a technique
that removes all the trees from a logging area. In the 1990’s, the company held consultations with
stakeholders and later tested alternative harvesting practices before adopting a technique called
selective harvesting. The company’s exclusive schema on harvesting methods co-existed for over
a decade with the more inclusive schema conveyed by civil society until the company adopted the
latter, following a relocation pattern. In contrast, faced with the forced abandonment of
clearcutting and no clear alternative, experimenting with different methods before choosing
selective harvesting exemplifies replacement. In general, second-order schema change deeply
affects actions across organizational functions and departments, and has high-level consequences
that may include shifts in resource allocation (Ranson et al., 1980), and organizational
restructuring (Bartunek, 1984). In view of these descriptions, schema discrepancy alone is
insufficient to predict the occurrence of first- and second-order change models. Mildly discrepant
schemas and experience may lead to bookkeeping or replacement, while highly discrepant schemas
and experience may result in subtyping or relocation. This raises the question of the conditions for

18
second-order schema change, to which the literature on schema evolution in organizations can
answer.
As described in the previous section, organizational members in most firms tend to use
extant schemas to assimilate new experience and schemas (bookkeeping), and isolate new schemas
if assimilation fails (subtyping). Both processes result in first-order change and the reinforcement
of extant schemas (Howard-Grenville, 2007b; Nicholson & Anderson, 2005). Documented
occurrences of second-order schema change in firms were associated with the involvement of
groups wielding power –the capacity to accomplish one’s will despite resistance (Weber, 1947)- in
support of change. Indeed, Bartunek (1984) proposed an opposition-based view of second-order
schema change in which groups challenge each other’s schemas. In this study and several others,
Bartunek and colleagues (Bartunek, 1984, 1993) found that schema sponsors use power to
influence the outcome of schema interaction and change (see also Kaplan, 2008; Kaplan &
Orlikowski, 2013). Influential groups take actions that support their own schemas, test the limits
of, and attempt to increase, their power. For example, in a food processing plant undergoing a
Quality of Work Life (QWL) intervention, line employees were found to make requests that fit
their own view of the QWL goals -better work life- as well as significantly increasing the number
of requests for change, possibly in an attempt to test and push the limits of the power granted by
the intervention. In parallel, corporate management took actions to ensure that the intervention
would meet its own goal -productivity increase- and remain under control (Bartunek & Moch,
1987). Power is necessary for groups within firms simply to enact their own schemas and
sometimes to overcome resistance to schema change. When power distribution is asymmetric, all-
at-once second-order change in favor of the most influential group (i.e. relocation) is possible.
When power is asymmetric but more distributed among schema sponsors, schemas interact like
theses and antitheses following a dialectical pattern and gradually produce an emergent synthesis
(i.e. replacement) over time (Bartunek, 1984, 1993).
Powerful sponsors need to intervene for second-order schema change to happen because it
is often very difficult for persons or groups used to a given schema to accept a new one (Bartunek,
1993). Most often, such powerful sponsors are management or corporate management (e.g.
Balogun & Johnson, 2004; Gioia & Chittipeddi, 1991; Labianca et al., 2000), but some studies
also report decisive influence from other stakeholders such as regulatory bodies (Poole, Gioia, &
Gray, 1989), or civil society (Zietsma & Lawrence, 2010). Powerful sponsors have more
19
opportunities to voice their schemas and participate in decision making (Bartunek & Keys, 1982),
and are thus more apt to state the new schema as strongly and clearly as needed to make an impact.
Further, as organizational members tend to assimilate ambiguous information through extant
schemas so as to preserve them (Labianca et al., 2000), it has been observed that powerful sponsors
need to hold both the old and new schemas and to serve as advocates of the new schema to
effectively assist in the transition from one to the other (Bartunek, 1993; Ury, 1988).
In sum, the literature on schemas suggests that power is an essential condition for second-
order schema change. Remarkably, bookkeeping was observed in experimental settings where
power was absent (Weber & Crocker, 1983), but not in organizational contexts where powerful
groups -like top management in a university health center (Labianca et al., 2000) and in a power
utility (Balogun & Johnson, 2004)- piloted schema and organizational change. Conversely, power-
devoid settings were not found to harbor second-order schema change models (Weber & Crocker,
1983). Evidence of replacement and relocation was observed only in contexts where influential
sponsors, especially top management, developed a new schema and shaped organizational
activities and structure (Balogun & Johnson, 2004; Labianca et al., 2000). In both cases, the end
of top management’s direct involvement coincided with transition from a relocation to a
bookkeeping pattern (Balogun & Johnson, 2004: 544). These works indicate that the relative power
of schema sponsors relates to the possibility and extent of schema change (i.e. first- or second-
order). Schema reinforcement or first-order change happens when power asymmetry benefits
groups supporting an extant schema. Second-order schema change occurs when power asymmetry
favors groups supporting a new schema. Combining our observations on discrepancy and power,
and in contrast with extant literature, we propose that schema change models are not discrete but
systematically linked by these two factors -schema discrepancy and schema sponsors’ power- as
represented in figure 1.

20
Figure 1
Models of Schema Interaction and Change, and Linking Factors
Spheres represent schemas. Small spheres represent sub-schemas.
Different colors represent different schema contents. Dashed lines represent emerging schemas and dotted lines fading schemas.
Pe
rc
eiv
ed
dis
cr
ep
an
cy
be
twe
en
old
an
d n
ew
sch
em
as
Hig
h
Power insufficient
to drive change
Subtyping
Relocation
Conversion (Relocation)
Lo
w-M
ed
Power insufficient
to drive change
Bookkeeping
Replacement
Conversion
(Replacement)
Nu
ll
Confirmation of extant schema
Confirmation of extant schema
Confirmation of extant schema
Confirmation of extant schema
Null
Low-Medium
High
Complete
Relative power of new schema’s sponsors
Second-order schema change and the strategic interpretation of sustainability
The strategic interpretation of sustainability follows the same schema change patterns
dependent on schema discrepancy and schema sponsor influence. Assuming as before the
predominance of the instrumental view in Western settings, powerful schema sponsors in most
firms try to assimilate sustainability information following extant instrumental schemas. It follows
that most firms handle sustainability information following the bookkeeping or the subtyping
model. As for bookkeeping, there is evidence that moderately powerful proponents of corporate
sustainability obtain better results (i.e. sustainability actions) when they use the values and
schemas of the more powerful groups whose behavior they are attempting to change, although
such tactics reinforce extant schemas (Bansal, 2003; Howard-Grenville, 2007a). Among
successful tactics used by the environmental team at the ChipCo computer chip company were,

21
for example, explaining sustainability challenges to engineering teams in technical terms, and
presenting them as limitations on manufacturing capacity rather than as ecological issues (Howard-
Grenville, 2007a: 570). This ensured minimal discrepancy with extant, technically-oriented
schemas, and resulted in marginal schema change (i.e. bookkeeping). As for subtyping, higher
schema discrepancy combined with the same power distribution lead to a different conclusion:
discussions on the recycling of a hazardous chemical framed in terms of environmental compliance
lead to the isolation of this issue. Some managers questioned the actual risk associated with the
use of that chemical. Most managers held the dominant, technically-oriented schema and subtyped
the issue, refusing to grant it the status of a problem in need of solving. The project was eventually
dropped (Howard-Grenville, 2007a: 570).
These studies suggest that the intervention of powerful groups is needed in most firms for
second-order schema change to happen in favor of integrative sustainability schemas. Powerful
integrative schema sponsors need to exert some form of influence so that sustainability experience
and information be collectively interpreted in integrative rather than instrumental terms. Empirical
evidence of the replacement model is scarce (for an example, see Balogun & Johnson, 2004) and
even more so in the sustainability literature. In their study of the Swedish firms Husqvarna and
Duni, Blomquist and Sandström (2004) found that several influential schema sponsors shaped the
firms’ thinking and handling of sustainability: regulators, non-governmental organizations, top
management, corporate environmental affairs. Perhaps because of the diversity (and likely
divergent schemas) of influential groups, schema change was gradual in both firms. Little-by-little,
environmental staff and managers were hired, products and production lines were adapted,
structures, rules and routines were amended to include “green reminders” (2004: 370). The authors
only observed evidence of first-order change but surmise that, given enough time, the two
companies may find themselves with new schemas (Blomquist & Sandström, 2004: 371), which
would suggest a replacement pattern.
Proposition 3: In most firms, integrative schema sponsors need to exert power so
that new sustainability-related experience or schemas may trigger strategic schema
change following the replacement model rather than the bookkeeping model.
Examples of relocation in empirical settings are more common. Like the MacMillan
Bloedel example above, they are characterized by the concentration of power in the hands of fewer
stakeholders. Typically, powerful sponsors with integrative schemas interpret sustainability-
22
related experience and schemas so that they radically differ from extant instrumental schemas.
They enact these interpretations, taking actions and causing changes in company structure that
promote second-order schema change. Taking radically innovative actions and transforming
corporate structure is easier for powerful sponsors, like the late Ray Anderson, founder and CEO
of Interface Inc., a US-based carpet manufacturer. After reading Paul Hawken’s (1993) The
Ecology of Commerce, Anderson decided to make sustainability his company’s priority strategy.
Anderson’s schemas on business and sustainability shifted from instrumental to integrative, or as
he put it himself, from “earth plundering” to “America’s greenest” (Anderson, 2009: 2:43). Despite
early managerial resistance, Anderson and his teams created working groups and elaborated
strategies, guidelines and supporting programs to ensure company-wide commitment. The initial
guidelines were later replaced with a more ambitious program intended to create the first large
industrial firm with zero environmental impact by 2020. This led to literally hundreds of product,
service and process innovations which dramatically increased environmental and economic
performance (Lampikoski, 2012). From a schema-based perspective, Interface’s deliberately
radical greening illustrates the relocation model.
Proposition 4: In most firms, integrative schema sponsors need to exert power so
that new sustainability-related experience or schemas may trigger strategic schema
change following the relocation model rather than the subtyping model.
In brief, the two models that result in first-order schema change are those where firms either
assimilate or isolate discrepancy, thus reducing, concealing or eliminating discrepancy. In contrast,
power gives schema sponsors a voice and allows them to support integrative schemas through a
variety of actions, which we examine next.
SCHEMA SPONSORS’ POWER AND SCHEMA CHANGE
Power, Actions and Schema Change
The above discussion indicates that power allows schema sponsors to affect schema
interactions. But how? Although powerful schema sponsors take a variety of actions that
differently affect schemas (see below), we offer that the overarching principle for how actions
affect schemas is discrepancy avoidance, a mechanism central to organizational interpretations
(Weick, 1995). Its basic expression is that people and groups try to avoid the experience of
discrepancy. We argue that firm constituents go to great lengths to avoid or reduce discrepancy,
23
and that they will revise the meaning of past events and actions to cope with discrepancy if needed
(Garfinkel, 1967). From a schema evolution perspective, we mean that firm constituents at first try
to interpret new experience through extant schemas (i.e. bookkeeping) but may disregard new
experience if discrepancy is strong (i.e. subtyping), thus avoiding or at least reducing discrepancy.
When discrepancy is sustained and extant schemas fail to explain ‘reality’, constituents will re-
interpret experience in order to avoid discrepancy (Weick, 1995), and change their own schemas
in the process, either incrementally (i.e. replacement) or drastically (i.e. relocation). In this sense,
actions are primary determinants of interpretations (Garfinkel, 1967), and of schemas. Therefore,
the actions of powerful schema sponsors shape firm constituents’ schemas in two ways. First, they
either reinforce extant schemas or generate first-order schema change. Second, to the extent that
schema sponsors can sustain firm constituents’ experience of discrepancy, they trigger the re-
interpretation of past actions, and second-order schema change.
Relatedly, the schema literature suggests that actions leading to second-order change need
to be consistent and sustained over time (Labianca et al., 2000; Poole et al., 1989) so that
constituents do not revert to previous schemas. We acknowledge that one way to ensure
consistency is to purposely design organizational arrangements – structure, reward systems,
measurement techniques, etc. – to convey specific schemas. “By changing material organizational
conditions and practices”, organizational arrangements bring schemas to reality (Ferraro et al.,
2005: 9). We therefore argue that the sustained experience of the schemas ingrained in
organizational arrangements is necessary to enable second-order change.
Using French and Raven’s (1959) notion of power bases -reward, coercion, reference,
expertise, and legitimacy- we offer that different power bases grant schema sponsors access to
different actions with distinct effects on firm-level schemas. Remarkably, French and Raven’s
(1959) typology of power bases distinguishes between perceived and realized power (Kim,
Pinkley, & Fragale, 2005): while power bases rest on others’ perception of the ability to reward,
coerce, etc. (i.e. perceived power), power is defined as influence on others’ behavior and
cognitions (i.e. realized power). This cause-effect conceptualization is conducive to the
theorization of schema change in that it explicitly addresses the effects of power on cognitive
change and specifies the influence-mechanisms underlying different power bases. We propose,
then, that different power bases allow for actions that distinctly affect the degree and sustainment
of discrepancy that firm constituents experience. In response, firm constituents use available

24
strategies to avoid discrepancy, preferably bookkeeping or subtyping, else replacement or
relocation, and their schemas evolve accordingly in a first- or second-order pattern. We now take
a closer look at power bases to assess whether they might allow schema sponsors (1) to modify
firm constituents’ perceived degree of discrepancy and (2) to sustain firm constituents’ experience
of discrepancy so as to generate second-order schema change toward sustainability. We propose
that all power bases can be used to alter perceived discrepancy, while only legitimate power can
alter organizational arrangements and sustain firm constituents’ experience of discrepancy. Table
2 summarizes our propositions.
Reward Power
Definition. French and Raven (1959) define reward power as based on the perceived ability
to reward prescribed ideas and behaviors. In organizational settings, typical groups with reward
power are management, executives, shareholders (e.g. through the board of directors and market
value), the media (e.g. through positive coverage), civil society (e.g. through endorsements,
awards), and regulators (e.g. through alleviated compliance requirements). For example, it is not
unusual for firms to implement compensation mechanisms based on environmental performance
(e.g. Russo & Harrison, 2005).
Degree of discrepancy. Reward power associates positive valence (attractiveness) to
prescribed ideas and behaviors (French & Raven, 1959) and can thereby affect the perceived
degree of discrepancy. Reward magnitude exceeding firm constituents’ expectations signals that
the prescribed behavior is more valuable (less discrepant from firm values) than perceived, while
rewards below expectations suggest that this behavior is less valuable than perceived. The
difference between expected and actual reward magnitude relates to change in perceived
discrepancy. Thus, influential schema sponsors with reward power can affect firm constituents’
perceived degree of discrepancy. In theoretical terms, they can induce switches among schema
change patterns between bookkeeping and subtyping, and between replacement and relocation,
along the y-axis of Figure 1. We have proposed that more integrative sustainability schemas have
higher discrepancy and a higher likelihood of first-order schema change following subtyping in
most firms. Accordingly, no or low rewards are expected for integrative sustainability ideas and
actions, but offering rewards for these ideas and actions can reduce their degree of discrepancy.
Proposition 5a: By offering rewards for integrative sustainability ideas and
actions, schema sponsors with reward power can reduce the perceived degree of
25
discrepancy of integrative sustainability schemas so that they trigger collective
schema change following the bookkeeping model instead of the subtyping model.
Sustainment of discrepancy. Reward power leads to “dependent” change (French &
Raven, 1959: 152) because the probability of reward for conformity depends on the influential
group that mediates the rewards and on the observability of the prescribed behavior. In turn,
whether the prescribed behavior can be observed depends on a number of factors (e.g. number of
employees, employees’ geographic dispersion) so that it can be difficult for schema sponsors to
monitor prescribed behaviors. Schema sponsors with reward power only cannot change
organizational arrangements to systematically monitor prescribed behaviors and dispense rewards,
and the probability of reward for conformity therefore varies. Consequently, the ability of schema
sponsors with reward power only to consistently sustain firm constituents’ experience of
discrepancy is limited. Indeed, research suggests that clear rewards are a necessary but insufficient
element of systems fostering the achievement of sustainability-oriented goals (Wijen, 2014).
Proposition 5b: Integrative schema sponsors with reward power only are unlikely
to sustain firm constituents’ experience of discrepancy with integrative schemas so
as to trigger collective schema change following a second-order change model.
Coercive Power
Definition. French and Raven (1959) define coercive power as based on the perceived
ability to punish undesired ideas and behaviors. In organizational settings, typical groups with
coercion power are management, executives, shareholders (e.g. through the board of directors and
market value), the media (e.g. through negative coverage), civil society (e.g. through negative
public campaigns, or legal action), and regulators (e.g. through non-compliance fines). For
example, research indicates that external pressure on firms for environmentally-friendly behavior
has drastically increased in the last three decades and has intensified financial market punishment
for eco-harmful behavior (Flammer, 2013).
Degree of discrepancy. Coercive power associates negative valence to prescribed ideas
and behaviors so that certain “regions” of behavior become laden with negative valence (French
& Raven, 1959: 152). Coercive power can thereby affect the perceived degree of discrepancy.
Punishment magnitude exceeding expectations signals that the prescribed behavior is more
undesirable than perceived (more discrepant from firm values), while punishment below
expectations suggests that this behavior is less undesirable than perceived. The difference between

26
expected and actual punishment magnitude relates to change in perceived discrepancy. Thus,
influential schema sponsors with coercive power can affect firm constituents’ perceived degree of
discrepancy. In theory, they can induce switches among schema change patterns between
bookkeeping and subtyping, and between replacement and relocation, along the y-axis of Figure
1. We have proposed that more instrumental sustainability schemas have lesser discrepancy and a
higher likelihood of first-order schema change following bookkeeping in most firms. Accordingly,
no punishment is expected for instrumental sustainability ideas and actions, but threatening
punishment can increase the perceived degree of discrepancy associated with them.
Proposition 6a: By threatening/administering punishment for instrumental
sustainability ideas and actions, schema sponsors with coercive power can
increase the degree of discrepancy of instrumental sustainability schemas so that
they trigger collective schema change following the subtyping model instead of the
bookkeeping model.
Sustainment of discrepancy. Like reward power, coercive power leads to “dependent”
change (French & Raven, 1959: 152) because the probability of punishment for non-conformity
depends on the influential group that mediates the punishment and on the observability of the
undesired behavior. Whether the undesired behavior can be observed depends on a number of
factors (see reward power) so that it can be difficult for schema sponsors to monitor undesired
behaviors. Schema sponsors with coercive power only cannot change organizational arrangements
to systematically monitor undesired behaviors and dispense punishments, and the probability of
punishment for non-conformity is therefore uncertain. As a result, the ability of schema sponsors
with coercive power only to consistently sustain firm constituents’ experience of discrepancy is
limited. This is in line with research suggesting that strict rule enforcement is insufficient to foster
the achievement of sustainability-oriented goals (Wijen, 2014).
Proposition 6b: Integrative schema sponsors with coercive power only are unlikely
to generate and sustain firm constituents’ experience of discrepancy with
instrumental schemas so as to trigger collective schema change following a second-
order change model.
Referent Power
Definition. French and Raven (1959) define referent power as based on identification with
a person or group, a feeling of oneness, or a desire for a similar identity. In organizational settings,

27
groups with referent power may be management (e.g. charismatic leaders), thought leaders (e.g.
gurus, bloggers, writers, journalists, public figures, etc.), trade associations (e.g. as they set
common rules for an industry), and civil society (e.g. civil organizations with popular ideas). For
example, Paul Hawken’s (1993) ideas on sustainability inspired Ray Anderson’s strategic re-
orientation of Interface Inc. towards corporate environmentalism (Anderson, 2009).
Degree of discrepancy. Referent power brings firm constituents discomfort for non-
conformity or satisfaction for conformity based on identification, in particular with actions and
ideas (French & Raven, 1959: 155). Referent power can thereby affect the perceived degree of
discrepancy. The referent’s actions and ideas conform to firm constituents’ expectations indicate
congruence, while non-conformity with expectations signals discrepancy. The difference between
expected and displayed actions and ideas relates to change in perceived discrepancy. Thus,
influential schema sponsors with referent power can affect firm constituents’ perceived degree of
discrepancy. From a schema perspective, they may induce switches among schema change patterns
between bookkeeping and subtyping, and between replacement and relocation, along the y-axis of
Figure 1. We have proposed that more integrative sustainability schemas have higher discrepancy
and a higher likelihood of first-order schema change following subtyping in most firms.
Accordingly, firm constituents expect referents to exhibit little integrative sustainability actions
and ideas, but referents displaying such actions and ideas can reduce their degree of discrepancy
in the eyes of firm constituents.
Proposition 7a: By exhibiting integrative sustainability ideas and actions, schema
sponsors with referent power can decrease the degree of discrepancy of integrative
sustainability schemas so that they trigger collective schema change following the
bookkeeping model instead of the subtyping model.
Sustainment of discrepancy. Referent power may lead to “dependent” or “independent”
change and the degree of dependence does not depend on the observability of desired actions and
ideas. In fact, people are often unaware that they are subject to referent power (French & Raven,
1959: 155). Reciprocally, referents may be unaware that they have referent power over particular
individuals or groups. Although schema sponsors with referent power may act as role models, they
do not know which firm constituents regard them as referents. Further, extant research
acknowledges the transitory nature of referent power. In the case of business gurus, for example,
observers have noted: “Guru today, gone tomorrow” (Nicholson & Anderson, 2005: 167). Schema
28
sponsors with referent power only cannot change organizational arrangements to systematically
expose firm constituents to their actions and ideas. Consequently, the ability of schema sponsors
with referent power only to consistently sustain firm constituents’ experience of discrepancy is
limited.
Proposition 7b: Integrative schema sponsors with referent power only are unlikely
to sustain firm constituents’ experience of discrepancy with integrative schemas so
as to trigger collective schema change following a second-order change model.
Expert Power
Definition. French and Raven (1959) define expert power as based on perceived
knowledge in a given area. They distinguish expert power, which depends on the expert’s
credibility and relationship with firm constituents, from informational influence. The latter is an
impersonal form of power which varies with informational content, and more precisely, the fit of
conveyed information with firm constituents’ cognitive structure (i.e. their schemas). In
organizational settings, typical groups with expert power are management and colleagues (e.g.
seasoned co-workers), academics (e.g. through teaching, research and outreach activities), the
media (e.g. through coverage of new or advanced topics), and subject matter specialists (e.g.
consultants, lawyers, professional trainers). For example, when Ray Anderson decided to
strategically re-orient his firm towards corporate environmentalism, he assembled a team of
sustainability specialists, the “Eco Dream Team”, who helped craft Interface’s new environmental
strategy and provided advice on environmental topics (Lampikoski, 2012: 6).
Degree of discrepancy. Expert power primarily results in social influence on firm
constituents’ cognitive structure, that is, acceptance of the validity of the information conveyed by
the expert (French & Raven, 1959). Expert power can thereby affect the perceived degree of
discrepancy. Expert advice aligned with expectations signals low discrepancy with firm
constituents’ existing cognitive structure. More or less discrepant expert advice challenges firm
constituents’ cognitive structure and signals a corresponding degree of discrepancy. The
(mis)alignment of expert advice and existing cognitive structure relates to change in perceived
discrepancy. Thus, influential schema sponsors with expert power can affect firm constituents’
perceived degree of discrepancy. In theoretical terms, they can induce switches among schema
change patterns between bookkeeping and subtyping, and between replacement and relocation,
along the y-axis of Figure 1. We have proposed that more integrative sustainability schemas have

29
higher discrepancy and a higher likelihood of first-order schema change following subtyping in
most firms. Accordingly, expert advice is expected to align with instrumental sustainability ideas
and actions, but expert advice supporting integrative ideas and actions can decrease their degree
of discrepancy.
Proposition 8a: By advising in favor of integrative sustainability ideas and actions,
schema sponsors with expert power can decrease the degree of discrepancy of
integrative sustainability schemas so that they trigger collective schema change
following the bookkeeping model instead of the subtyping model.
Sustainment of discrepancy. Expert power leads to “dependent” change in that the new
cognitive structure depends on the relationship with the expert, although it may become more
independent with time. The dependence of change following expert advice varies. Expert advice
combined with informational influence produces “more independent” structures (French & Raven,
1959: 156) so that advice aligned with existing cognitive structures is more likely to generate
independent change. Further, it has been shown that recipients’ beliefs may vary over time
depending on the amicable nature of the relationship with the expert (French & Raven, 1959).
Schema sponsors with expert power only cannot change organizational arrangements to
systematically expose firm constituents to their expertise. Therefore, the ability of schema
sponsors with expert power only to consistently sustain firm constituents’ experience of
discrepancy is limited.
Proposition 8b: Integrative schema sponsors with expert power only are unlikely
to sustain firm constituents’ experience of discrepancy with integrative schemas so
as to trigger collective schema change following a second-order change model.
Legitimate Power
Definition. French and Raven (1959) define legitimate power as based on internalized
values which guide people’s evaluation of certain behaviors, attitudes, beliefs as more or less
legitimate. Legitimate power can be based on cultural values, acceptance of social structure, and/or
designation by a legitimizing agent. Cultural values and acceptance of social structure give people
with certain characteristics or hierarchical authority the right to prescribe behavior for others. For
example, “a foreman should assign work [and] it is the management’s prerogative to make certain
decisions.” (French & Raven, 1959: 154). Designation by a legitimizing agent means that one or
more persons receive the legitimacy to perform certain tasks from a legitimate source. In

30
organizational settings, typical groups with legitimate power are management and shareholders
(e.g. majority equity holders) each in their own area of authority.
Degree of discrepancy. Legitimate power comes from a value-induced feeling of moral
obligation to follow the leader’s prescriptions and can therefore affect firm constituents’
perception of discrepancy. Leaders’ support for ideas and actions aligned with expectations signals
no discrepancy. Dissuasion, mild or marked, from the same ideas and actions indicates a
corresponding degree of discrepancy. The (mis)alignment of legitimate support and dissuasion
with existing cognitive structures relates to change in perceived discrepancy. Influential schema
sponsors with legitimate power can thus affect firm constituents’ perceived degree of discrepancy.
From a schema perspective, they can induce switches among schema change patterns between
bookkeeping and subtyping, and between replacement and relocation, along the y-axis of Figure
1. We have proposed that more integrative sustainability schemas have higher discrepancy and a
higher likelihood of first-order schema change following subtyping in most firms. Accordingly,
legitimate prescriptions are expected to align with an instrumental view, but legitimate
prescriptions supporting integrative ideas and actions can decrease their degree of discrepancy.
Proposition 9a: By prescribing integrative sustainability ideas and actions, schema
sponsors with legitimate power can decrease the degree of discrepancy of
integrative sustainability schemas so that they trigger collective schema change
following the bookkeeping model instead of the subtyping model.
Sustainment of discrepancy. Legitimate power leads to “highly dependent” change in that
the application of the prescription depends on the relationship with the leader and firm
constituents’ perception of her legitimacy (French & Raven, 1959: 154). Change induced by
legitimate power can become less dependent to the extent that the leader’s influence “serves to
activate the values and to relate them to the system which is influenced, but thereafter the new
state of the system may become directly dependent on the values” (French & Raven, 1959: 154).
Firm values are heterogeneous however and the leader’s prescriptions are bound to go against the
values of some firm constituents, triggering resistance. The ability of schema sponsors to
consistently sustain firm constituents’ experience of discrepancy through legitimate power thus
seems limited. The difference with other bases of power, though, is that schema sponsors with
legitimate power can change organizational arrangements to systematically expose firm
constituents to prescribed actions and ideas. Depending on their area of influence, schema sponsors

31
with legitimate power – such as managers – can change company strategy, resource allocation,
structure, policies, procedures, and actions in a way that aligns with the schemas they sponsor
(Ferraro et al., 2005). As firm constituents interact with these changes, they repeatedly experience
discrepancy (or congruence), and provided these changes are consistent (Labianca et al., 2000),
their schemas evolve (or are confirmed) over time.
Proposition 9b: Integrative schema sponsors with legitimate power only can
sustain firm constituents’ experience of discrepancy with integrative schemas so as
to trigger collective schema change following a second-order change model.
Table 2
Schema Sponsors’ Power Base, Discrepancy and the Range of Schema Change
Power base Can impact the
degree of discrepancy
Can impact the duration of discrepancy
Change Range
Reward Yes No First-order only
Coercion Yes No First-order only
Reference Yes No First-order only
Expertise Yes No First-order only
Legitimacy Yes Yes First- and second-order
DISCUSSION
The purpose of this article is to deepen our understanding of strategic schema interaction
in firms so as to characterize the mutual influence of instrumental and integrative schemas and
explain why firms obtain faint results when it comes to solving natural environmental issues. We
have proposed that the predominance of instrumental schemas combined with power-induced
mechanisms of schema perpetuation explains firms’ weak results with regards to natural
environmental issues. Specifically, we have argued that instrumental and integrative schemas co-
exist in firms but mostly interact in patterns that foster the dominance of extant instrumental
schemas. The enactment of instrumental schemas engenders organizational structure and action
unfit to support change toward corporate sustainability. This is unless powerful sponsors actively
promote integrative schemas and enable second-order schema change patterns, leading to
organizational change over time.

32
Why firms obtain faint environmental results. The primary contribution of this paper is
to the organizational sustainability literature. The predominance of instrumentality in firm-level
schemas since the 1950’s has shaped the structure and actions of Western firms in ways that made
them fit for profit maximization, but less so for effective solutions to contemporary ecological
issues. Schemas tend to self-protect and self-perpetuate by absorbing or isolating other schemas
and experience. With time, instrumental schemas have brought about arrangements –language,
norms, measurement and reward systems- that have further entrenched the economic conception
in society and business organizations (Ferraro et al., 2005). We argue that unless powerful groups
in- and out-side firms promote integrative schemas consistently over an extended period, the
cognitive, structural and behavioral changes needed for corporate sustainability are unlikely to
happen.
Progress toward corporate sustainability occurs in a context of social interdependencies in
which actors -individuals, groups, and organizations alike- are unlikely to realize green plans as
intended, but rather, as the hardly foreseeable product of multiple diverging influences (Newton,
2002). If greening projects are more likely to be successful when “there is strong agreement
between the key actors involved” (Newton, 2002: 532), long-term schema change toward
sustainability in firms requires evolution not only in organizational structure and arrangements,
but also in societal systems that perpetuate the instrumental perspective, such as business education
(Ferraro et al., 2005) and business law (Newton, 2002: 530).
Schema evolution framework. This paper contributes to research on organizational
schemas by proposing a framework for schema evolution. First, our framework suggests that
specific combinations of two factors –schema discrepancy and support by powerful schema
sponsors- selectively trigger schema evolution patterns, as depicted in figure 1. Inquiry into these
two factors suggests that the degree of discrepancy shapes the primary reaction of firm
constituents, either assimilation or rejection, while power bases delimit schema sponsors’ ability
to generate first-order or second-order schema change.
Second, although extant research considers schema interaction models as discrete, this
conceptualization draws systematic relationships among them, answering the puzzling question of
high schema discrepancy leading both to the subtyping model (first-order change), and to the
relocation model (second-order change). As noted, the degree of discrepancy switches the schema
interaction pattern from assimilation (bookkeeping/replacement) to rejection

33
(subtyping/relocation). Then the sustainment of discrepancy, depending on schema sponsors’
interventions, moves the schema interaction pattern from first- to second-order. In this light, the
replacement model constitutes the second-order extension of the bookkeeping model, and the
relocation model forms the second-order extension of the subtyping model.
Third, we argue that discrepancy avoidance is the overarching mechanism that guides and
explains schema interactions. Firm constituents prefer to interpret new information through
existing schemas (bookkeeping) because consonant experience does not challenge their cognitive
structure. When new information is highly discrepant, firm constituents tend to reject it (subtyping)
to avoid exposure to discrepancy and the revision of existing schemas. Only when these two coping
strategies fail do firm constituents have no other way to avoid discrepancy than to modify their
own schemas. Depending on circumstances, this happens gradually (replacement) or over a short
time span (relocation). This explanation of schema interaction reasserts the centrality of
discrepancy avoidance in interpretation processes (Weick, 1995), in contrast with recent
theorizations (e.g. Basu & Palazzo, 2008; Hahn et al., 2014).
Finally, this paper also discusses how schema sponsors with different power bases affect
the degree and sustainment of discrepancy. All power bases have the potential to impact the degree
of discrepancy of targeted ideas and actions. However, only legitimate power allows for the
alignment of sponsored schemas with organizational arrangements such as firm structure, control
systems, and routines. Therefore, only schema sponsors with legitimate power –typically but not
only management– can sustain firm constituents’ experience of discrepancy so as to generate
second-order schema change.
Implications for Research and Practice
Implications for Research on Sustainability. This paper offers several implications for
scholars who feel that management researchers have “societal leadership responsibilities” whereby
we are not only to anticipate but also to shape the future (Corley & Gioia, 2011: 28). First,
researchers are in a unique position to recognize schemas and their alternatives. By training, we
are exposed to a number of theoretical lenses and thus tend to have heightened awareness of
alternative perspectives (Allison, 1971). Our practice also encourages us to reflect on extant
theories, question them, refine them or develop new ones (Corley & Gioia, 2011) that might inspire
businesses on the path to sustainability. Second, sustainability scholars have intensively studied
the “business case for sustainability”, which underlines how green initiatives can enhance

34
economic performance (Bondy, Moon, & Matten, 2012) and the “social license to operate”, which
depicts firms implementing sustainable initiatives to obtain social legitimacy (Aguilera et al.,
2007). As noted, these interpretations center on profit, draw from and reinforce instrumental
conceptions, whereas global ecological indicators indicate a need for alternative perspectives.
Ecological economics, for example, proposes that the interdependence of environmental and
economic concerns exists at the level of human survival and well-being (Jackson, 2010; Stiglitz,
Sen, & Fitoussi, 2010). Few management papers follow such approaches (for exceptions, see
Whiteman & Cooper, 2011; Whiteman et al., 2013), despite their potential for promoting long-
term economic, social and environmental sustainability.
Implications for Research on Schemas. The management literature on strategic schemas
is characterized by a relative scarcity of studies on schema change in organizations. As this paper
argues that schema discrepancy and the relative power of schema sponsors are key determinants
of schema change patterns, several related questions need to be empirically explored: do higher
degrees of discrepancy consistently prompt greater subtyping isolation (e.g. Beelitz & Merkl-
Davies, 2012)? Extreme experiential discrepancy has been shown to temporarily disable
interpretation (e.g. Weick, 1993) but what happens when extreme discrepancy is sustained? What
is the threshold beyond which the sustainment of discrepancy triggers second-order change? Does
the frequency of discrepant experience also affect schema interaction and how? Precision is also
needed regarding the extent to which power predicts the speed or extent of cognitive assimilation
by firm constituents. These questions are open to a wide range of approaches and methodologies
that identify and track schema content and evolution over time.
Implications for Management. Firms routinely develop green agendas and implement
green initiatives (Banerjee, 2001; Bondy et al., 2012). This paper suggests that businesses can
engage in two types of actions to achieve corporate sustainability. Within firms, managers are
influential schema sponsors and can affect interpretations over time by adopting and promoting
integrative schemas so that organizational structure and actions evolve accordingly. Ferraro et al.
(2005) highlight the use of language, norms, and design to this end. As for language, “An
important implication of sensemaking is that, to change a group, one must change what it says and
what its words mean. […] Language transformation can be a pathway to behavioral
transformation” (Weick, 1995: 108–109). Firms can use the language of sustainability to change
the substance of interpretations and frame issues so as to give ecological, social and economic
35
concerns equal priority. Norms circumscribe the range of socially-acceptable behaviors in the firm
and significantly shape organizational actions (Howard-Grenville, 2007b). Management can create
norms aligned with integrative schemas to reinforce these schemas and mold actions accordingly.
In particular, firms can socially construct norms by ensuring long-term consistency between
integrative schemas, organizational discourse (e.g. policies, rules, reports), and actions (e.g.
practices, routines). Finally, so far as organizational design and managerial practices constitute the
enactment of schemas, they create the conditions that make schemas come ‘true’ over time. For
instance, “What organizations do in terms of reward practices comes to determine what people
want and expect from their jobs, […] creating a cycle of behavior” (Ferraro et al., 2005: 20). Firms
can thus implement environmentally-aligned arrangements such as selection policies, reward and
measurement systems to encourage sustainable behavior. As the perceived consonance of
organizational actions with extant and new schemas seems decisive in the prevalence of one
schema over another (Labianca et al., 2000), firms willing to migrate to integrative schemas need
to take actions consistently.
Outside their boundaries, firms can contribute to the realization of their green agenda on a
broader scale by promoting integrative schemas with suppliers, industry associations, educational
institutions, governments, and civil society. In the manner of institutional entrepreneurs (Hardy &
Maguire, 2008), firms can endeavor to shape societal institutions by creating institutional
arrangements needed to disseminate integrative schemas among a variety of stakeholders, a key to
the success of green initiatives.
CONCLUSION
We have argued that strategic schemas are key to corporate sustainability. More precisely,
we have proposed a framework that relates firm-level schemas, organizational arrangements, and
corporate sustainability. We have also shed a new light on the operation of schema change and
suggested that it is driven by firm constituents’ avoidance of discrepancy, following two factors
that shape the degree and sustainment of discrepancy. This framework helps discuss the interaction
between integrative and instrumental schemas and why firms obtain limited results in solving
environmental issues. Businesses are often caught in societal and organizational arrangements that
protect and perpetuate existing instrumental schemas. However, firms can also transform these

36
arrangements in- and outside their boundaries so as to achieve corporate sustainability and
contribute to solving global sustainability issues.

37
ARTICLE 2
Ecological Interpretation and Corporate Environmental Performance:
Do Communicative Firms Pollute Less?
CORPORATE INTERPRETATION AND ENVIRONMENTAL PERFORMANCE
Strategic management research has long recognized that organizational interpretation –“the
process of translating data into knowledge and understanding” (Thomas & McDaniel,
1990)- shapes corporate action. Researchers have described how interpretive assessments predict
the occurrence and nature of organizational response to contextual changes (Dutton & Duncan,
1987), how the categorization of issues as opportunities or threats may affect organizational
involvement in the response to these issues (Dutton & Jackson, 1987), and how managerial
interpretation is used to create momentum for strategic change (Gioia & Chittipeddi, 1991). More
recently, researchers have shown that managers faced with ambiguous strategic decisions engage
in interpretation to reconcile competing views or impose one so as to prompt desired patterns of
organizational action (Kaplan, 2008; Kaplan & Orlikowski, 2013). Further, firms enacting
interpretations shape aspects of the strategic environment, including industry velocity (Nadkarni
& Narayanan, 2007b), the resource environment (Baker & Nelson, 2005), strategically-relevant
knowledge (Nag & Gioia, 2012), and the development of strategic capabilities (Eggers & Kaplan,
2013). Yet, despite these works’ inherent links to strategic outcomes, few studies have looked at
the relationship between organizational interpretations and firm performance (for an exception,
see Thomas, Clark, & Gioia, 1993).
Similarly, researchers have studied organizational interpretations as predictors of corporate
environmental actions (Etzion, 2007; Howard-Grenville, 2007a; Muller & Kolk, 2010). Basu and
Palazzo (2008) have proposed that firms’ interpretation process consists of interactions between
thinking, language, and actions that shape their understanding of, and response to, natural
environmental issues. Hahn, Preuss, Pinkse, & Figge, (2014) theorize that cognitive frames, also
known as schemas (Bartunek, 1984; Nadkarni & Narayanan, 2007b), influence how broadly and
deeply firms interpret and respond to environmental issues. However, although research has
investigated various internal and external predictors of environmental outcomes (Aguinis &
Glavas, 2012), very few studies have looked at organizational interpretations as predictors of
corporate environmental performance (CEP).
38
In addition, much research investigating corporate environmental performance confounds
CEP and corporate environmentalism; it treats as identical the corporate impact on the natural
environment (Walls et al., 2012) and the degree to which firms integrate environmental practices
in their operations (Van Marrewijk & Werre, 2003). At a time when the global business
community, government officials, academics, and international/civil society organizations
consistently place environmental issues among the top five global business risks (World Economic
Forum, 2014, 2015), while scientific research offers a darkening portrait of the global ecosystem
(Field, Barros, Mach, & Mastrandrea, 2014), there is a need for research on antecedents of CEP
that distinguishes CEP from corporate environmentalism, and addresses both.
We intend to start filling these gaps by answering the following research question: Does
ecological interpretation expressed in disclosed corporate schemas predict CEP? In this study, we
assumed that ecological interpretation, defined as the translation of data into knowledge and
understanding about the natural environment, takes place in three consecutive stages: scanning,
understanding, and responding (Daft & Weick, 1984; Hahn et al., 2014; Thomas et al., 1993). We
used computer-aided text analysis (Short et al., 2010) to capture elements of ecological
interpretation in the disclosed corporate schemas (sustainability reports) of 108 companies from
2005 to 2008. We tested whether relationships exist between our selected elements of
interpretation –scanning, positive/negative labelling of ecological issues, understanding,
responding- and corporate environmental impact.
The purpose of this article is to investigate the relationship between ecological
interpretation and CEP. More broadly, by applying a schema perspective to the study of corporate
environmental performance, we attempt to examine the links between cognitions, actions, and
performance within the context of corporate sustainability. We also shed light on the working
assumption that there is significant overlap between corporate schemas, i.e. firm-level cognitive
maps, and disclosed schemas, the carefully crafted maps that companies communicate in publicly-
available reports.
In the next section, we draw on Daft and Weick’s (1984) model of organizations as
interpretation systems to describe ecological interpretation, the three-stage process through which
firms scan for, understand, and respond to ecological issues. We then describe our methods and
findings. In the discussion section, we explain why our results contradict a rational model of
organizational interpretation, and why corporate environmental response might paradoxically
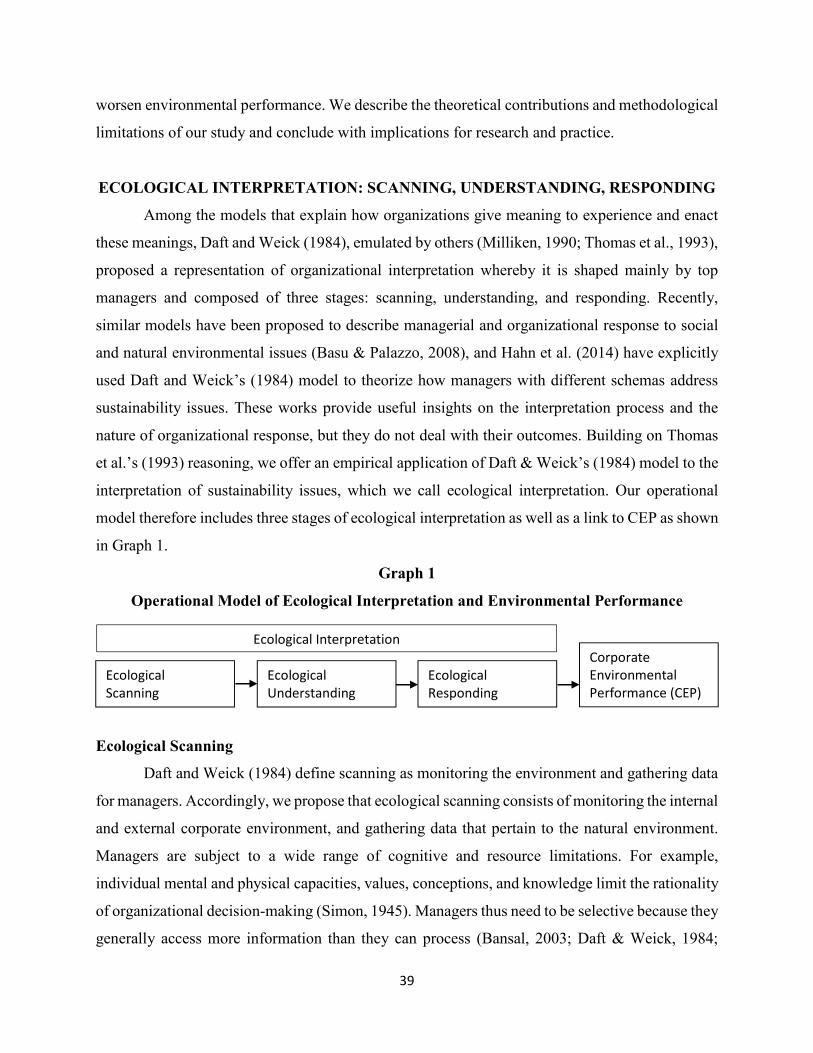
39
worsen environmental performance. We describe the theoretical contributions and methodological
limitations of our study and conclude with implications for research and practice.
ECOLOGICAL INTERPRETATION: SCANNING, UNDERSTANDING, RESPONDING
Among the models that explain how organizations give meaning to experience and enact
these meanings, Daft and Weick (1984), emulated by others (Milliken, 1990; Thomas et al., 1993),
proposed a representation of organizational interpretation whereby it is shaped mainly by top
managers and composed of three stages: scanning, understanding, and responding. Recently,
similar models have been proposed to describe managerial and organizational response to social
and natural environmental issues (Basu & Palazzo, 2008), and Hahn et al. (2014) have explicitly
used Daft and Weick’s (1984) model to theorize how managers with different schemas address
sustainability issues. These works provide useful insights on the interpretation process and the
nature of organizational response, but they do not deal with their outcomes. Building on Thomas
et al.’s (1993) reasoning, we offer an empirical application of Daft & Weick’s (1984) model to the
interpretation of sustainability issues, which we call ecological interpretation. Our operational
model therefore includes three stages of ecological interpretation as well as a link to CEP as shown
in Graph 1.
Graph 1
Operational Model of Ecological Interpretation and Environmental Performance
Ecological Scanning
Daft and Weick (1984) define scanning as monitoring the environment and gathering data
for managers. Accordingly, we propose that ecological scanning consists of monitoring the internal
and external corporate environment, and gathering data that pertain to the natural environment.
Managers are subject to a wide range of cognitive and resource limitations. For example,
individual mental and physical capacities, values, conceptions, and knowledge limit the rationality
of organizational decision-making (Simon, 1945). Managers thus need to be selective because they
generally access more information than they can process (Bansal, 2003; Daft & Weick, 1984;
Ecological Scanning
Ecological Responding
Corporate Environmental Performance (CEP)
Ecological Understanding
Ecological Interpretation

40
Thomas et al., 1993). As a result, they do not systematically include ecological scanning in their
scanning activities.
How managers select areas for scanning depends on the relevance they assign to various
topics on the basis of their schemas (Hahn et al., 2014; Hambrick, 1982; Pfeffer & Salancik, 1978).
Managers tend to pursue information that is congruent with organizational schemas while they are
prone to ignore information that contradicts them (Bartunek, 1984; Das & Teng, 1999; Hahn et
al., 2014; Schutz, 1962). Whether a firm deliberately scans its internal and external environments
for thematic information therefore indicates the type of issues which managers view as
strategically relevant (Dutton & Duncan, 1987).
Managers with schemas centered on the economic side of business attend less to
environmental and social issues, unless the latter are advanced by stakeholders that directly bear
on business (Hahn et al., 2014). As a result, firms tend not to recognize numerous sustainability
issues that arise in their organizational setting, and to focus on few sustainability topics which
relate to financial outcomes. As a result, certain sustainability issues which require scanning non-
conventional sources, such as biodiversity, may go unnoticed (Hahn et al., 2014). In contrast,
managers with schemas emphasizing environmental issues tend to pay attention to a wide range of
environmental issues (Hahn et al., 2014). They are likely to use a variety of tools and techniques
that monitor information of an ecological nature and gather data on their own environmental
impact. In turn, the amount of information that managers gather on an issue influences their
interpretation of this issue. Managers who use much information are better able to deal with
ambiguity and uncertainty (Milliken, 1990; Thomas et al., 1993). Further, they are likely to
emphasize the positive aspects of an issue; managers with high-capacity information systems tend
to label strategic issues positively (Thomas & McDaniel, 1990). Accordingly, we expect managers
who know and use more environmental data gathering tools to interpret ecological issues
positively.
Hypothesis 1a: Ecological scanning is positively related to firm-level interpretation
of environmental issues in positive terms.
Extant research considers scanning as a predictor of interpretation (Daft & Weick, 1984;
Hambrick, 1982). For instance, many firms actively monitor their markets to better understand
their environment, and design fitting strategies (Nadkarni & Narayanan, 2007a). Managers with
different schemas value and collect different types of information, and are thus likely to differ in
41
their interpretations and actions (Dutton & Duncan, 1987; Thomas et al., 1993). Managers with
schemas that underline the natural environment heed a number of environmental issues and, for
any given sustainability issue, notice various aspects of it (Hahn et al., 2014). As they gather
information and become more knowledgeable, their schemas become larger and more complex,
containing more components, and more relationships among components (Dane, 2010). Managers
who collect large amounts of ecological information are therefore more capable of attributing
meaning to, and establishing connections among, a wide array of environmental issues. In other
terms, they are more likely to gain a deeper understanding of environmental issues.
Hypothesis 1b: Ecological scanning is positively related to firm-level ecological
understanding.
Ecological Understanding
Daft and Weick (1984) define understanding as developing shared comprehension of
events and building joint schema content. Accordingly, we propose that ecological understanding
means attributing shared meaning to experience, events, and data that pertain to the natural
environment, and developing firm-level schemas. Meaning is attributed by applying existing
structures for understanding, schemas, or developing new ones (Thomas et al., 1993). Schemas
thus guide understanding, as well as issue handling and response (Bartunek, 1984, 1993) and
research has shown that understanding is a predictor and determinant of strategic action (Bartunek,
1984; Dutton, Fahey, & Narayanan, 1983; Gioia & Chittipeddi, 1991; Kaplan, 2008; Thomas et
al., 1993).
Daft and Weick (1984) envisioned interpretation mainly at the strategic level of
management. In particular, whereas scanning can be performed by various organizational
members, a small group of top managers has primary influence on understanding and responding
for the firm as whole (Bartunek, 1984; Hambrick & Mason, 1984, Thomas et al., 1993). Meaning
attribution to strategic issues often stems from managers’ categorizations which themselves
originate in their schemas. Categorization sorts objects, events, etc. into cognitive groups with
similar perceived attributes (Dutton & Jackson, 1987; Thomas et al., 1993). Two commonly used
categories are opportunities and threats (Anderson & Nichols, 2007; Barr & Glynn, 2004; Dutton
& Duncan, 1987), respectively associated with positive and negative valence (Jackson & Dutton,
1988; Thomas et al., 1993). Indeed, one of the simplest and most used distinctions in strategic
interpretation is between positive and negative understanding of an issue (Hahn et al., 2014).
42
Understandings guide actions in specific directions: issue participants are more likely to
increase their engagement in problem-solving when they understand an issue positively, as an
opportunity, rather than negatively, as a threat (Dutton et al., 1983). Positive understandings also
lead to more open search for issue resolution than negative ones (Sharma, 2000). As regards
sustainability issues, Sharma found that the likelihood of proactive strategic environmental action,
“ranging from pollution prevention to habitat preservation, voluntary restoration, reduction in the
use of unsustainable materials and fossil fuels, […] increased use of environmentally friendly
technologies […] creative problem solving, […] adoption of innovative technologies […] and
collaborative interactions with stakeholders” (Sharma, 2000: 683), increases with positive
managerial understanding of environmental issues.
Hypothesis 2a: Firm-level interpretation of environmental issues in positive terms
is positively related to ecological responding.
Understanding involves attributing explicit meaning to experience; it serves as a prompter
for action (Weick, Sutcliffe, & Obstfeld, 2005). From a schema perspective, understanding
manifests in increased, more complex schema content, that is, a greater number of concepts and
relationships among them (Dane, 2010). In particular, understandings of an issue “relate various
events or concepts together in a causal manner” so that issue participants can devise a chain of
actions thought to resolve the issue (Dutton et al., 1983: 315). Consequently, managers with low
understanding of an issue may have little or no idea of the causal mechanisms that lead to issue
resolution. On the other hand, people with deeper understanding of an issue, such as subject matter
experts, tend to solve problems in a more forward-oriented and effective manner (Dane, 2010).
Further, deep understanding of strategic situations allows managers to escape “the bounding
qualities of information, beliefs, and values which restrict […] potential actions” and to elaborate
alternative courses of actions (Dutton et al., 1983: 309). Managers’ understanding of an issue
therefore relates to the spectrum of possible actions they can consider and take regarding that
particular issue. Sustainability issues are no exception: once managers have given meaning to
sustainability issues following their schemas, they will respond on that basis (Hahn et al., 2014).
We thus expect that firms whose managers have a deeper understanding of ecological issues use a
greater number and variety of environmental actions.
Hypothesis 2b: Ecological understanding is positively related to firm-level
ecological responding.

43
Ecological Responding
Understanding leads to action: as new understandings of causal relationships emerge, they
translate into action. In this sense, action is the enactment of extant and new understandings (Daft
& Weick, 1984), which we call responding (Hahn et al., 2014). Consequently, we define ecological
responding as firm-level action in response to natural environmental issues.
“The link between effective action and successful performance is a fundamental
presumption in the strategic management literature.” (Thomas et al., 1993: 245) and empirical
research supports the notion that the number of responses is related to firm performance. For
example, Smith, Grimm, Gannon, and Chen (1991) observed that high counts of responses by
domestic airlines were related to profitability. More recently, Patel, Kohtamäki, Parida, and
Wincent (2015) found that firms which have higher variability in their innovation portfolios
achieve better performance, especially when they develop deeper understanding of issues at hand.
Extant research also suggests variance in the ecological impact of different environmental
practices and strategies (Klassen & Whybark, 1999; Rodrigue, Magnan, & Cho, 2013; Walls et
al., 2012) and we therefore expect to find links between ecological responding and corporate
environmental performance (CEP). More precisely, we argue that the magnitude of corporate
response relates to CEP; this can be attributed to several factors such as the amount of resources
allocated to corporate environmental response (Elsayed, 2006), the degree of integration of
environmental actions in strategic planning (Judge & Douglas, 1998), and the long-term coherence
of environmental innovation portfolios (Klassen & Whybark, 1999), among others. As noted,
corporate environmental performance should not be confounded with ecological responding. CEP
is “the outcome of a firm’s strategic activities that manage (or not) its impact on the natural
environment” (Walls et al., 2012: 891). CEP is therefore concerned with tangible and material
impacts on the natural environment (Delmas et al., 2013). In other words, high CEP signifies low
environmental impact.
Hypothesis 3: Ecological responding is negatively related to environmental impact.
METHODS AND ANALYSIS
Sample
To test these hypotheses, we randomly selected companies listed in the Trucost database,
a leading data provider which tracks the environmental impacts of over 4200 publicly traded
44
companies from various industries and countries, including all Standard and Poor 500 firms. Our
initial sample included 68 companies in 2003, 106 in 2004, 128 in 2005, 148 in 2006, 171 in 2007,
and 182 in 2008. Since Trucost holds environmental performance data on thousands of firms,
sample size limitation primarily came from our ability to obtain and analyze the sustainability
reports needed to measure our independent variables. We gathered sustainability reports mostly
from corporate websites, but also from the Global Reporting Initiative’s (GRI) database, and from
CorporateRegister.com, an online directory of corporate responsibility reports. Fewer reports were
available in the earlier years covered by this study, as fewer companies published sustainability
reports then, and fewer cared to make these reports available online for more than a couple of
years. This explains why the number of companies in our initial sample increases over time.
Because we use time lags, we needed measures of our independent variables in the two years
preceding the dependent variable; to predict corporate environmental impact in 2009, we employed
a measure of ecological responding in 2008, and of ecological scanning and understanding in 2007.
These constraints guided the construction of our final sample, a balanced panel of 108 firms with
data on environmental impact from 2006 to 2009. These companies come from a wide range of
industries including automobiles and parts, banks, basic resources, chemicals, construction and
materials, financial services, food and beverage, healthcare, industrial goods and services,
insurance, media, oil and gas, personal and household goods, real estate, retail, technology,
telecommunications, travel and leisure, and utilities. Their headquarters are located in 25
European, North American, and Asian countries.
Dependent Variable
Our dependent variable is the log-transformed1 Total Environmental Damage Cost (TEDC)
associated with firm activity, drawn from the Trucost database. Trucost calculates and expresses
corporate environmental impact in financial terms (i.e. U.S. dollar value) based on corporate
sustainability reports, publicly available environmental data, and proprietary economic modelling
using governmental, industry, and national economic accounts data. Trucost’s economic
1 In order to ensure the validity of p-values in our t-tests, we selected every variable transformation in this paper
based on a search for the closest fit to a normal distribution. We used a function of our statistical package (Stata)
that searches the ladder of powers (Tukey, 1977) running chi-squared tests to determine whether transformations
are consistent with a normal distribution. The transformations with the smallest chi-squared value are the closest
fit to a normal distribution.

45
modelling methods are validated by independent academic experts. In addition, Trucost submits
its variables to studied companies for verification. Variables encompass both direct company
impacts such as landfill waste, recycling, and boiler, car fleet, and manufacturing emissions; and
indirect, supply chain impacts like energy use, water consumption, raw materials, and logistics.
By accounting for direct and supply chain impacts, Trucost covers outsourced and de-merged
polluting activities, and allows for the comparison of vertically integrated and non-vertically
integrated companies. TEDC aggregates the costs of about 700 different types of resource use and
emissions in four categories: greenhouse gas (GHG) emissions, water use, acid rain precursor
(ARP) emission, and solid waste disposal.
Independent Variables
Data Sources. Following previous research, we use written discourse as a representation
of schemas (Barr et al., 1992; Bingham & Kahl, 2013; Tsoukas, 2009). Specifically, we examine
disclosed schemas as presented in sustainability reports. One key working assumption in this
research is therefore that disclosed schemas reasonably overlap with corporate schemas. As
mentioned however, corporate schemas are cognitive maps shared at the firm level, while disclosed
schemas are thoughtfully designed messages that firms choose to convey in public documents.
Sustainability reports, and public corporate communications more broadly, thus have several
limitations as representations of schemas. First, it is likely that firms cannot completely express
their schemas, even for themselves, and they may deliberately hide their schemas from external
stakeholders. Consequently, disclosed schemas represent the portion of corporate schemas that
firms are willing and able to reveal (Narayanan & Fahey, 1990). Second, many firms resort to
public relations and communication companies to write sustainability reports so that the
terminology used in these reports may not fully be that of the issuing firm, and the description of
environmental activities may be unduly favorable. Third, and relatedly, company reports often
contain greenwash –overly positive emphasis on corporate environmental achievements- intended
for shareholders, the media or the general public (Delmas & Burbano, 2011).
On the other hand, sustainability reports are valuable sources of information on corporate
environmental actions. In many countries including the United States, companies are not legally
required to publicize environmental initiatives, and environmental disclosure in these reports
therefore conveys strategic intention along with information on corporate environmental
management (Philippe & Durand, 2011). As well, research suggests that top management
46
participates in the framing and editing of company reports (Barr et al., 1992; Nadkarni &
Narayanan, 2007b; Schwenk, 1989), which implies that sustainability reports convey managerial
schemas. Further, noting the central role of environmental units in dealing with corporate
environmental issues (Bansal, 2003), we believe that sustainability reports (and most types of
social and environmental reports) also convey the schemas of corporate departments responsible
for environmental affairs. Finally, while we agree that companies willing to enhance their
legitimacy and reputation embellish environmental actions in public reports, we assume that
embellishment is limited. While firms may show insincere interest in the natural environment, they
can only report on environmental initiatives which they actually conducted, and they are legally
liable for the accuracy of environmental information that stakeholders use, among others, for
financial risk assessment. We also think that firms engaging in greenwash pay special attention to
their public image and are concerned with possible market retaliation if greenwash is revealed, a
likely event in times of public and media scrutiny (Bowen & Aragon-Correa, 2014). As a result,
firms must keep greenwash credible and therefore limited. Based on this discussion, we assume
that disclosed and corporate schemas reasonably overlap, so that disclosed schemas inform us
about corporate schemas and courses of action.
Measuring ecological interpretation. Following Hahn et al. (2014) we used Daft and
Weick’s (1984) three-dimensional conceptualization of organizational interpretation and
distinguished three stages of ecological interpretation: ecological scanning, understanding, and
responding. To identify manifestations of each stage in sustainability reports, we first associated
each stage with a list of words and phrases, which we called a dictionary. We built the three
dictionaries following a procedure for computer-aided text analysis (CATA) recommended by
Short, Broberg, Cogliser, and Brigham (2010). We first created lists deductively from existing
glossaries in academic books, regulatory agencies, business associations, non-governmental
organizations, and international organizations. We then inductively generated words by scanning
30 randomly selected reports in our sample with the CATScanner software (McKenny, Short, &
Newman, 2012), manually retaining relevant terms and sorting them into the appropriate
dictionary. We combined the deductive and inductive lists and trimmed all repeated terms to avoid
double counts. For example, we crossed out “air pollutant” because “pollutant” was also listed. As
well, all terms that might refer to non-environmental concepts were removed to prevent false
positives. For example, “atmosphere” was deleted because it may relate to the gases around the

47
earth or to a general feeling or mood. We validated the dictionary with a panel of 3 faculty members
from the Academy of Management’s Organization and the Natural Environment (ONE) Division.
Each panel member received a spreadsheet containing the three dictionaries and was asked to
validate every word and phrase according to instructions and definitions provided in Appendix 1
& Table 1 respectively. We also asked our panel members to add missing terms and reinstate
deleted ones as they deemed necessary. The final dictionaries hold 94 words and phrases for
ecological scanning, 283 for ecological understanding, and 110 for ecological responding, totalling
487 terms reflecting stages of ecological interpretation.
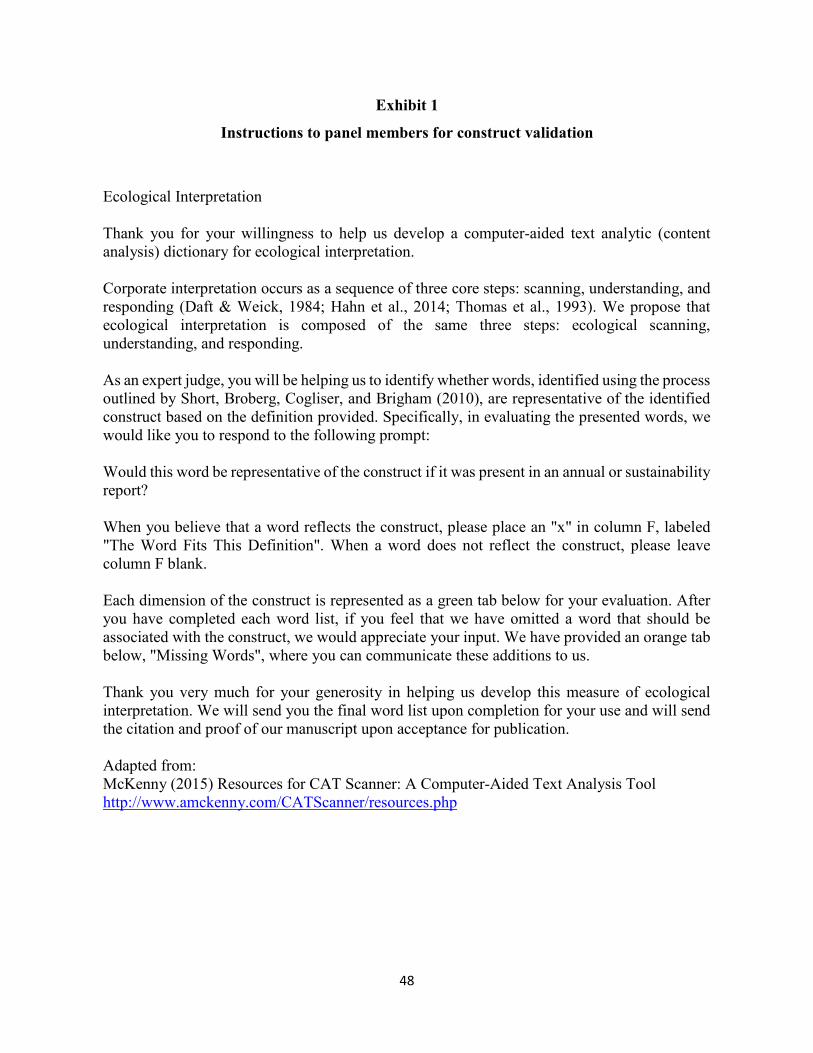
48
Exhibit 1
Instructions to panel members for construct validation
Ecological Interpretation Thank you for your willingness to help us develop a computer-aided text analytic (content analysis) dictionary for ecological interpretation. Corporate interpretation occurs as a sequence of three core steps: scanning, understanding, and responding (Daft & Weick, 1984; Hahn et al., 2014; Thomas et al., 1993). We propose that ecological interpretation is composed of the same three steps: ecological scanning, understanding, and responding. As an expert judge, you will be helping us to identify whether words, identified using the process outlined by Short, Broberg, Cogliser, and Brigham (2010), are representative of the identified construct based on the definition provided. Specifically, in evaluating the presented words, we would like you to respond to the following prompt: Would this word be representative of the construct if it was present in an annual or sustainability report? When you believe that a word reflects the construct, please place an "x" in column F, labeled "The Word Fits This Definition". When a word does not reflect the construct, please leave column F blank. Each dimension of the construct is represented as a green tab below for your evaluation. After you have completed each word list, if you feel that we have omitted a word that should be associated with the construct, we would appreciate your input. We have provided an orange tab below, "Missing Words", where you can communicate these additions to us. Thank you very much for your generosity in helping us develop this measure of ecological interpretation. We will send you the final word list upon completion for your use and will send the citation and proof of our manuscript upon acceptance for publication. Adapted from: McKenny (2015) Resources for CAT Scanner: A Computer-Aided Text Analysis Tool http://www.amckenny.com/CATScanner/resources.php

49
Table 1
Definitions accompanying instructions to panel members for dictionary validation
Ecological interpretation Ecological interpretation in organizations occurs as a sequence of three core stages: scanning, understanding, and responding (Daft & Weick, 1984; Hahn et al., 2014; Thomas et al., 1993)
Ecological scanning The words in the list below refer to tools, activities, measures and systems for the monitoring/measurement of environmental impact.
Ecological understanding The words in the list below refer to (1) natural phenomena and processes, as well as (2) aspects of natural environmental impacts and their causes.
Ecological responding The words in the list below refer to tools, activities, and principles that mitigate/prevent environmental degradation or restore the natural environment.
Missing words Are we missing words on one or more of the lists? Please indicate these words in the appropriate lists below.
Rejected words Words we considered & rejected because they may refer to non-environmental topics or to both positive and negative environmental impacts.
Still following Short et al. (2010), we assessed interrater reliability using Holsti’s (1969)
coefficient, which is the ratio of coding agreements to the total number of coding decisions:
IRC = 2M / (N1+N2), where IRC is the interrater reliability coefficient, M is the number of coding
decisions on which the 2 judges are in agreement, and N1 and N2 are the numbers of coding
decisions made by judge 1 and 2 respectively. Content analysts suggest that IRCs of 0.80 and
above (Krippendorff, 2004; Riffe, Lacy, & Fico, 2005), or 0.75 and above (Ellis, 1994) reflect
high reliability. We interpret our IRCs, ranging from 0.71 to 0.93 (see Table 2 for detailed IRC
report), as indicative of acceptable consistency among our raters.

50
Table 2
Interrater reliability coefficients (IRC) of the ecological interpretation dictionaries
Dictionary / IRC Judges 1&2 Judges 2&3 Judges 1&3
Ecological scanning .76 .82 .71
Ecological understanding .80 .93 .78
Ecological responding .91 .91 .87
To measure ecological scanning, understanding, and responding in sustainability reports,
we assumed that the frequency of concepts in texts indicates their importance (Knoke & Kuklinski,
1982; Nadkarni & Narayanan, 2007b). We loaded our three dictionaries into the Linguistic Inquiry
and Word Count (LIWC) software which returns the ratio of dictionary words to the total word
count in documents (Pennebaker, Booth, & Francis, 2007). We used the square-root
transformations of the ratios for scanning, understanding, and responding as our measures.
As noted, research suggests that organizational interpretation is composed of three
dimensions: scanning, understanding, and responding. We therefore tested the multidimensionality
of our construct: ecological interpretation. One important assumption for the measurement of
multidimensional constructs is that each dimension differs from, and simultaneously relates to, the
others (Short et al., 2010). Researchers who use content analysis can observe results from several
dictionaries and determine multidimensionality by visual inspection of the correlation matrix
comparing dictionaries: dimensions should be correlated, although not too highly, that is, below
0.8 (Hair, Anderson, Tatham, & Black, 1998), and if possible, below 0.5 (Short et al., 2010). The
correlations for the dimensions of ecological interpretation are presented in Table 3. They range
from 0.19 to 0.49 with the highest p-value at 0.0001, providing evidence that ecological
interpretation is a multidimensional construct.

51
Table 3
Correlations of ecological interpretation dimensions
Dimensions Scanning Understanding Responding Scanning (p-value)
1
Understanding (p-value)
.4870 (.0000)
1
Responding (p-value)
.1908 (.0001)
.3862 (.0000)
1
Positive-negative interpretation of environmental issues. We used LIWC’s built-in
dictionary of positive and negative emotions to assess the overall valence of sustainability reports.
LIWC’s authors have established the internal and external validity of this dictionary (Pennebaker,
Boyd, Jordan, & Blackburn, 2015) and management researchers have successfully used this
method to evaluate the positive-negative nature of media coverage (Bednar, 2012; Pfarrer, Pollock,
& Rindova, 2010; Zavyalova, Pfarrer, Reger, & Shapiro, 2012). For each report, we computed a
ratio of positive affective content to total affective content (Pfarrer et al., 2010). We used the cubic
transformation of this ratio as our variable representing the positive-negative interpretation of
environmental issues.
Control Variables
We included other variables to control for effects on corporate environmental performance.
We estimated firm size with log-transformed firm sales available in the Trucost database. We
calculated the variation of sales divided by total sales, also from Trucost, to account for changes
in production. Following Berrone, Cruz, Gomez-Mejia, and Larraza-Kintana (2010), we
controlled for industry air pollution, computing the log-transformation of industry specific CO2-
equivalent emissions from 22 member-countries of the Organisation for Economic Co-operation
and Development (OECD). These data are available online in the OECD’s Environmental Data
Compendium. Because every industry has a particular air pollution profile, this variable allowed
us to control for industry pollution and industry simultaneously. Finally, drawing on Russo and
Harrison (2005), as well as Berrone et al. (2010), we assessed country-level stringency of
environmental regulations using the log-transformation of CO2-equivalent emissions per thousand
dollars of national gross domestic product (GDP), and the inverse square root transformation
(1/√x) of energy consumption (kg of oil equivalent) per thousand dollars of GDP. Our CO2-
52
equivalent emissions and energy consumption data comes from the United Nations Statistics
Division, and our GDP data, from the World Bank DataBank.
Statistical Methods
Our final sample is a panel data set containing cross-sectional and time-series information
on 108 firms over 4 years for a total of 432 observations. Although ordinary multiple regression
models can be used on panel data, they are prone to a number of issues related to unobserved and
time-invariant variables that may generate correlation in error terms and spurious regression
results, and thus need to be controlled (Barnett & Salomon, 2012; Hausman & Taylor, 1981; Hsiao,
2003). One convenient way to control for these unwanted effects is to use panel regression models.
We tested our hypotheses using fixed effects and random effects panel regressions. A fixed effects
model controls for unobserved variables that are constant over time and vary across entities (firms).
A random effects model assumes the presence of both unobserved variables that are constant over
time and vary across cases, and unobserved variables that vary over time and remain constant
across cases. Breusch-Pagan Lagrange multiplier tests indicated that random effects regressions
were more appropriate than ordinary least squares regressions in all cases. We used a Hausman
test (Hausman, 1978) to decide between fixed and random effects for each hypothesis (see
Table 4). As well, Wald tests showed when time-fixed effects were needed in our (entity-)fixed
effects models, and we included year dummy variables in our models to account for time-fixed
effects accordingly (see Tables 7 & 8).

53
Table 4
Hausman tests for each hypothesis
Hypothesis Hausman test’s chi-squared value
Hausman test’s p-value
Regression model indicated by test
1a - Scanning & positive interpretation
0.29 0.59 Random effects
1b - Scanning & understanding
5.90 0.02 Fixed effects
2a - Positive interpretation & responding
1.87 0.17 Random effects
2b - Understanding & responding
24.57 0.0000 Fixed effects
3 - Responding & environmental impact
41.07 0.0000 Fixed effects
3 - Reversed causality
10.66 0.0011 Fixed effects
Note: low p-values indicate that the unique errors in the model are correlated with the regressors and point to the fixed effects model. In contrast, high p-values point to the random effects model.
Finally, due to the presence of heteroskedasticity, we performed regressions with robust
standard errors using Huber-White estimators (see Tables 7 & 8).
RESULTS
Tables 5 and 6 respectively provide descriptive statistics and pairwise correlations for our
variables of interest. Table 7 shows the results of our fixed effects, random effects, and robust
standard errors regressions for hypotheses 1a, 1b, 2a, and 2b. Table 8 presents our regression
results for hypothesis 3. In Table 7 and 8, we highlighted in grey the models we selected after
running Hausman, Wald, and heteroskedasticity tests.

54
Table 5
Descriptive statistics
Variable Mean Standard deviation
Minimum Maximum
Environmental impact L +2
5.76575 1.810926 1.210699 9.714928
Ecological responding S +1
0.4937938 0.2412959 0 1.24499
Ecological understanding S
0.6249746 0.2567137 0 1.506652
Interpretation of env. issues C
0.5899597 0.1123481 0 1
Ecological scanning S
0.2160867 0.1138692 0 0.6855655
Sales turnover L +1
9.390193 1.374572 4.963124 13.03541
Sales variation +1
0.0996018 0.2131863 -0.5837362 1.40144
Country-level energy intensity 1/S +1
0.0926733 0.0116611 0.0691714 0.1259882
Country-level carbon intensity L +1
-1.294253 0.4222819 -2.496174 0.2116811
Industry carbon intensity L 08
17.16581 1.921872 13.71886 21.20501
L Log-transformed; S Square-root-transformed; C Cubic-transformed; 1/S 1/Square-root-transformed; +2 lagged 2 years; +1 lagged 1 year; 08 fixed year: 2008.
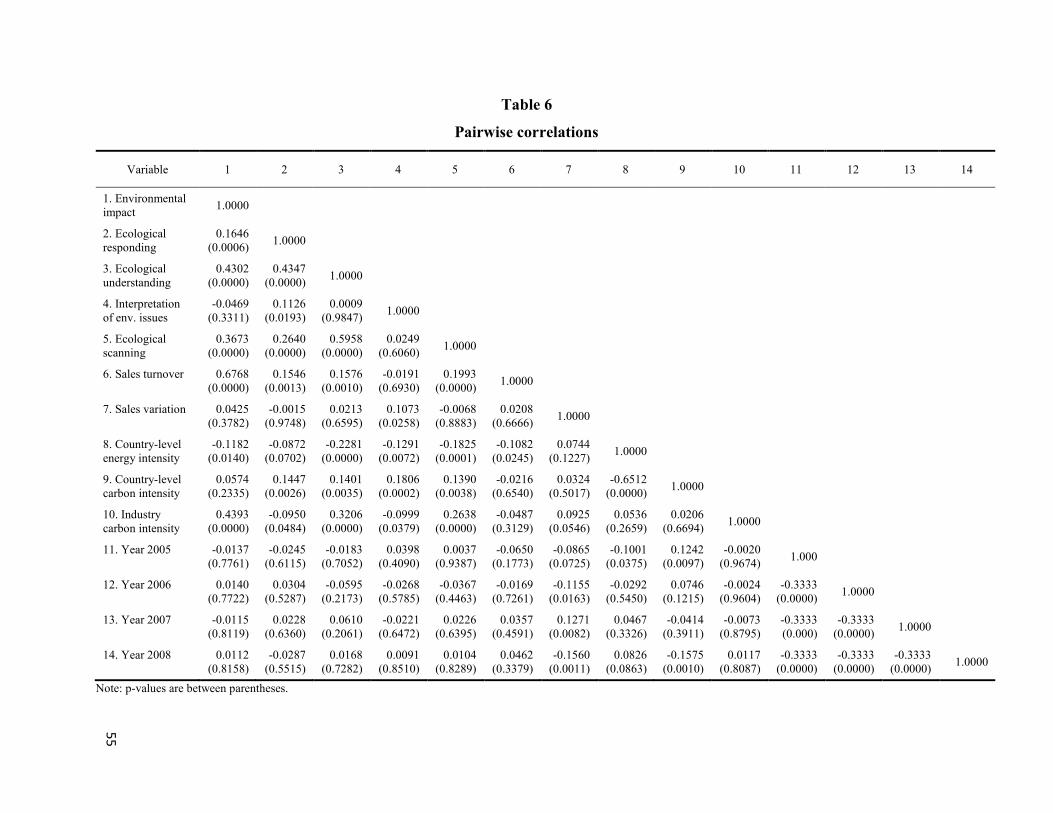
Table 6
Pairwise correlations
Variable 1 2 3 4 5 6 7 8 9 10 11 12 13 14
1. Environmental impact
1.0000
2. Ecological responding
0.1646 (0.0006)
1.0000
3. Ecological understanding
0.4302 (0.0000)
0.4347 (0.0000)
1.0000
4. Interpretation of env. issues
-0.0469 (0.3311)
0.1126 (0.0193)
0.0009 (0.9847)
1.0000
5. Ecological scanning
0.3673 (0.0000)
0.2640 (0.0000)
0.5958 (0.0000)
0.0249 (0.6060)
1.0000
6. Sales turnover 0.6768 (0.0000)
0.1546 (0.0013)
0.1576 (0.0010)
-0.0191 (0.6930)
0.1993 (0.0000)
1.0000
7. Sales variation 0.0425 (0.3782)
-0.0015 (0.9748)
0.0213 (0.6595)
0.1073 (0.0258)
-0.0068 (0.8883)
0.0208 (0.6666)
1.0000
8. Country-level energy intensity
-0.1182 (0.0140)
-0.0872 (0.0702)
-0.2281 (0.0000)
-0.1291 (0.0072)
-0.1825 (0.0001)
-0.1082 (0.0245)
0.0744 (0.1227)
1.0000
9. Country-level carbon intensity
0.0574 (0.2335)
0.1447 (0.0026)
0.1401 (0.0035)
0.1806 (0.0002)
0.1390 (0.0038)
-0.0216 (0.6540)
0.0324 (0.5017)
-0.6512 (0.0000)
1.0000
10. Industry carbon intensity
0.4393 (0.0000)
-0.0950 (0.0484)
0.3206 (0.0000)
-0.0999 (0.0379)
0.2638 (0.0000)
-0.0487 (0.3129)
0.0925 (0.0546)
0.0536 (0.2659)
0.0206 (0.6694)
1.0000
11. Year 2005 -0.0137 (0.7761)
-0.0245 (0.6115)
-0.0183 (0.7052)
0.0398 (0.4090)
0.0037 (0.9387)
-0.0650 (0.1773)
-0.0865 (0.0725)
-0.1001 (0.0375)
0.1242 (0.0097)
-0.0020 (0.9674)
1.000
12. Year 2006 0.0140 (0.7722)
0.0304 (0.5287)
-0.0595 (0.2173)
-0.0268 (0.5785)
-0.0367 (0.4463)
-0.0169 (0.7261)
-0.1155 (0.0163)
-0.0292 (0.5450)
0.0746 (0.1215)
-0.0024 (0.9604)
-0.3333 (0.0000)
1.0000
13. Year 2007 -0.0115 (0.8119)
0.0228 (0.6360)
0.0610 (0.2061)
-0.0221 (0.6472)
0.0226 (0.6395)
0.0357 (0.4591)
0.1271 (0.0082)
0.0467 (0.3326)
-0.0414 (0.3911)
-0.0073 (0.8795)
-0.3333 (0.000)
-0.3333 (0.0000)
1.0000
14. Year 2008 0.0112 (0.8158)
-0.0287 (0.5515)
0.0168 (0.7282)
0.0091 (0.8510)
0.0104 (0.8289)
0.0462 (0.3379)
-0.1560 (0.0011)
0.0826 (0.0863)
-0.1575 (0.0010)
0.0117 (0.8087)
-0.3333 (0.0000)
-0.3333 (0.0000)
-0.3333 (0.0000)
1.0000
Note: p-values are between parentheses.
55
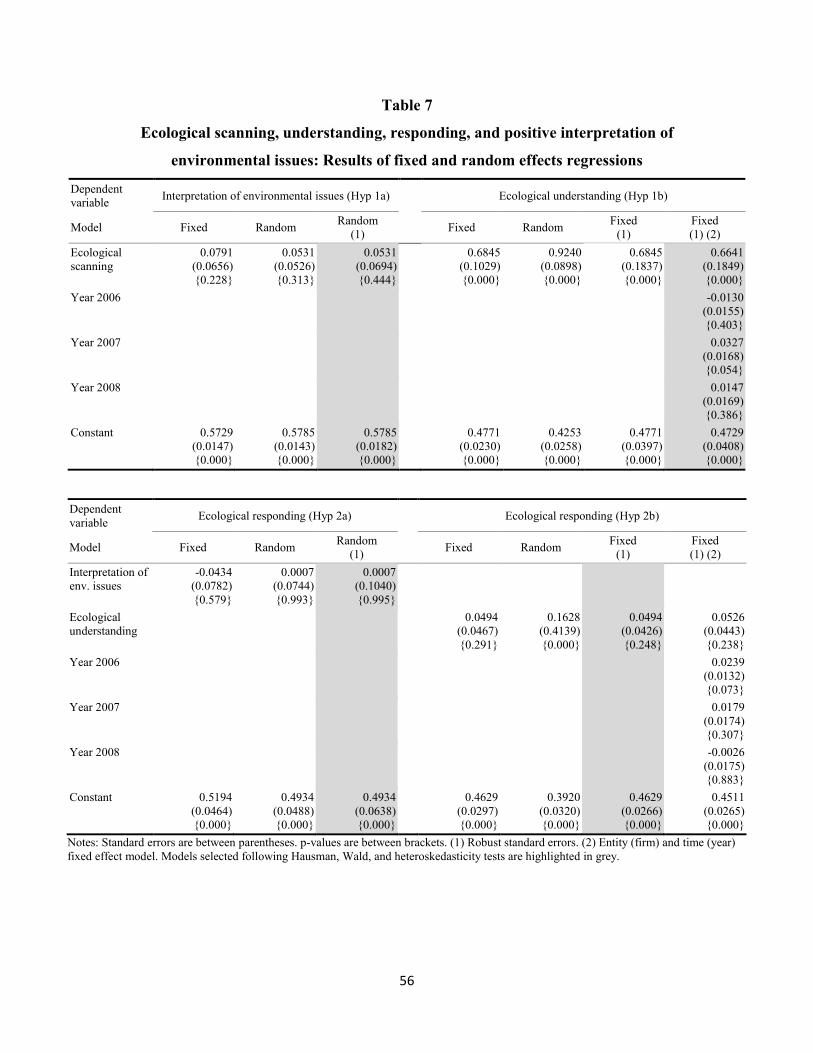
56
Table 7
Ecological scanning, understanding, responding, and positive interpretation of
environmental issues: Results of fixed and random effects regressions
Dependent variable
Interpretation of environmental issues (Hyp 1a)
Ecological understanding (Hyp 1b)
Model Fixed Random Random
(1)
Fixed Random Fixed
(1) Fixed (1) (2)
Ecological scanning
0.0791 (0.0656) {0.228}
0.0531 (0.0526) {0.313}
0.0531 (0.0694) {0.444}
0.6845 (0.1029) {0.000}
0.9240 (0.0898) {0.000}
0.6845 (0.1837) {0.000}
0.6641 (0.1849) {0.000}
Year 2006 -0.0130 (0.0155) {0.403}
Year 2007 0.0327 (0.0168) {0.054}
Year 2008 0.0147 (0.0169) {0.386}
Constant 0.5729 (0.0147) {0.000}
0.5785 (0.0143) {0.000}
0.5785 (0.0182) {0.000}
0.4771 (0.0230) {0.000}
0.4253 (0.0258) {0.000}
0.4771 (0.0397) {0.000}
0.4729 (0.0408) {0.000}
Dependent variable
Ecological responding (Hyp 2a)
Ecological responding (Hyp 2b)
Model Fixed Random Random
(1)
Fixed Random Fixed
(1) Fixed (1) (2)
Interpretation of env. issues
-0.0434 (0.0782) {0.579}
0.0007 (0.0744) {0.993}
0.0007 (0.1040) {0.995}
Ecological understanding
0.0494 (0.0467) {0.291}
0.1628 (0.4139) {0.000}
0.0494 (0.0426) {0.248}
0.0526 (0.0443) {0.238}
Year 2006 0.0239 (0.0132) {0.073}
Year 2007 0.0179 (0.0174) {0.307}
Year 2008 -0.0026 (0.0175) {0.883}
Constant 0.5194 (0.0464) {0.000}
0.4934 (0.0488) {0.000}
0.4934 (0.0638) {0.000}
0.4629 (0.0297) {0.000}
0.3920 (0.0320) {0.000}
0.4629 (0.0266) {0.000}
0.4511 (0.0265) {0.000}
Notes: Standard errors are between parentheses. p-values are between brackets. (1) Robust standard errors. (2) Entity (firm) and time (year) fixed effect model. Models selected following Hausman, Wald, and heteroskedasticity tests are highlighted in grey.

57
Table 8
Regression models of corporate environmental impact
Dependent variable Corporate environmental impact
Model Fixed Random Fixed (1) Fixed (2)
Ecological responding 0.3322 (0.1974) {0.093}
0.4424 (0.1861) {0.017}
0.3322 (0.1979) {0.096}
0.3327 (0.1983) {0.094}
Sales turnover -0.0209 (0.1600) {0.896}
0.7501 (0.0637) {0.000}
-0.0209 (0.1099) {0.850}
-0.021 (0.1770) {0.905}
Sales variation 0.1474 (0.1184) {0.214}
-0.1646 (0.1057) {0.120}
0.1474 (0.1204) {0.224}
0.1619 (0.1255) {0.198}
Country-level energy intensity 16.2434 (17.2802)
{0.348}
-7.3710 (9.0924) {0.418}
16.2434 (15.0797)
{0.284}
15.5286 (22.9212)
{0.499}
Country-level carbon intensity 0.1185 (0.2612) {0.650}
0.3371 (0.1941) {0.082}
0.1185 (0.1907) {0.536}
0.1531 (0.2708) {0.572}
Industry carbon intensity 0.2297 (0.0729) {0.002}
0.3822 (0.042)
{0.000}
0.2297 (0.0197) {0.000}
0.2206 (0.0733) {0.003}
Year 2006 0.0531 (0.0629) {0.399}
Year 2007 -0.0308 (0.0885) {0.728}
Year 2008 0.0528 (0.1044) {0.614}
Constant 0.4884 (1.9874) {0.806}
-6.9213 (1.1678) {0.000}
0.4884 (1.1092) {0.661}
0.7360 (2.8475) {0.796}
Notes: Standard errors are between parentheses. p-values are between brackets. (1) Robust standard errors. (2) Entity (firm) and time (year) fixed effect model. The model selected following Hausman, Wald, and heteroskedasticity tests is highlighted in grey.
Ecological Scanning
Results show a weak and non-significant relationship between ecological scanning and the
positive interpretation of environmental issues (β = 0.0531, p = 0.444), providing no support to
hypothesis 1a. The limited variance in the interpretation of environmental issues may explain this
result. As shown in Graph 2, nearly all firms in our panel present environmental issues very
positively; only 2 out of 432 observations show positive interpretation ratios below 0.6. The
absence of support to hypothesis 1a suggests that a vast majority of firms consistently chooses to
address environmental issues under a positive light in sustainability reports notwithstanding how
deeply they monitor ecological data.
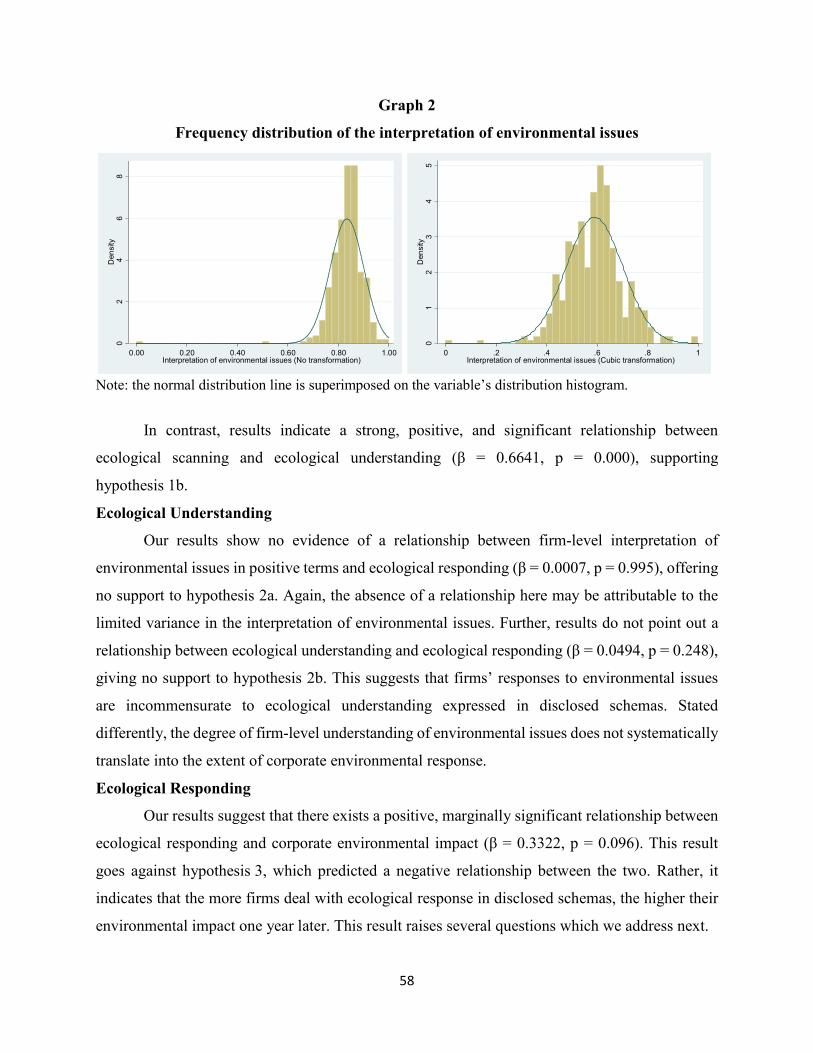
58
Graph 2
Frequency distribution of the interpretation of environmental issues
Note: the normal distribution line is superimposed on the variable’s distribution histogram.
In contrast, results indicate a strong, positive, and significant relationship between
ecological scanning and ecological understanding (β = 0.6641, p = 0.000), supporting
hypothesis 1b.
Ecological Understanding
Our results show no evidence of a relationship between firm-level interpretation of
environmental issues in positive terms and ecological responding (β = 0.0007, p = 0.995), offering
no support to hypothesis 2a. Again, the absence of a relationship here may be attributable to the
limited variance in the interpretation of environmental issues. Further, results do not point out a
relationship between ecological understanding and ecological responding (β = 0.0494, p = 0.248),
giving no support to hypothesis 2b. This suggests that firms’ responses to environmental issues
are incommensurate to ecological understanding expressed in disclosed schemas. Stated
differently, the degree of firm-level understanding of environmental issues does not systematically
translate into the extent of corporate environmental response.
Ecological Responding
Our results suggest that there exists a positive, marginally significant relationship between
ecological responding and corporate environmental impact (β = 0.3322, p = 0.096). This result
goes against hypothesis 3, which predicted a negative relationship between the two. Rather, it
indicates that the more firms deal with ecological response in disclosed schemas, the higher their
environmental impact one year later. This result raises several questions which we address next.
02
46
8D
en
sity
0.00 0.20 0.40 0.60 0.80 1.00Interpretation of environmental issues (No transformation)
01
23
45
Den
sity
0 .2 .4 .6 .8 1Interpretation of environmental issues (Cubic transformation)

59
Complementary Analysis
How come that the more firms address ecological responding in their disclosed schemas,
the more they pollute later on? We found two possible explanations. First, if schemas and disclosed
schemas reasonably overlap as we have assumed so far, it means that firms engage in inappropriate
responses that do not affect or worsen environmental issues rather than mitigate them. This
interpretation is supported by our other finding that firms’ responses to environmental issues are
incommensurate to ecological understanding expressed in disclosed schemas. The disconnection
between firms’ understanding of environmental issues and corporate environmental response can
explain the inadequacy of the latter. Second, if our working assumption is not met, the presence of
ecological responding in disclosed schemas is greenwash rather than a reflection of firms’ actual
pattern of meanings and actions. This alternative explanation is supported by our observation that
a vast majority of firms associate environmental issues with positive wording in sustainability
reports. In this perspective, firms use sustainability reports to project favorable images of
themselves and impress stakeholders. This can lead to exaggerating the importance of ecological
responding in disclosed schemas, particularly when corporate environmental performance is low.
Despite our argument that schemas prompt action and eventually influence performance,
we therefore need to consider the possibility that environmental performance informs disclosed
schemas, that is, reversed causality. We used the same panel to test for reversed causality, and we
lagged our dependent variable, ecological responding, by one year. Because we did not collect
ecological responding data for 2009, we had to drop one year of observations. Our final panel to
test for reversed causality included dependent variable data on 108 firms from 2006 to 2008, for a
total of 324 observations. Like before, we used a Hausman test (see Table 4) to choose between
fixed and random effects, and a Wald test to detect heteroskedasticity. These tests pointed to a
fixed effects model with robust standard errors. The results of the robust fixed effects regression
show a significant, negative coefficient (β = -0.1124, p = 0.009) indicating that the more firms
pollute, the less they address ecological responding in disclosed schemas.
We further divided our panel into three groups based on observed environmental impact
and conducted independent group t-tests (see Table 9). These tests indicate that the difference of
means in ecological responding differs between low-impact and medium-impact firms, as well as
between low-impact and high-impact firms. However, there was no statistically significant
difference of means in ecological responding between medium-impact and high-impact firms.

60
Actually, the mean statistic for ecological responding was lower for high-impact firms than for
medium-impact firms. Additional panel regressions within low-, medium-, and hi-impact groups
(see Table 10) showed marginal evidence that the more low-impact firms pollute, the more they
address ecological responding in disclosed schemas (β = 0.0642, p = 0.094). No significant
relationship was found for medium-impact or high-impact firms.
Table 9
Independent group t-tests on mean ecological responding
Group Mean
responding Standard
error Standard deviation Low impact
Medium impact
Low-impact firms
0.4499 0.0214 0.2225 n/a
Medium-impact Firms
0.5230 0.0219 0.2275
t = -2.3867 p = 0.0179
group means differ
n/a
High-impact firms
0.5187 0.0251 0.2607
t = -2.0857 p = 0.0382
group means differ
t = 0.1291 p = 0.8974
group means do not differ
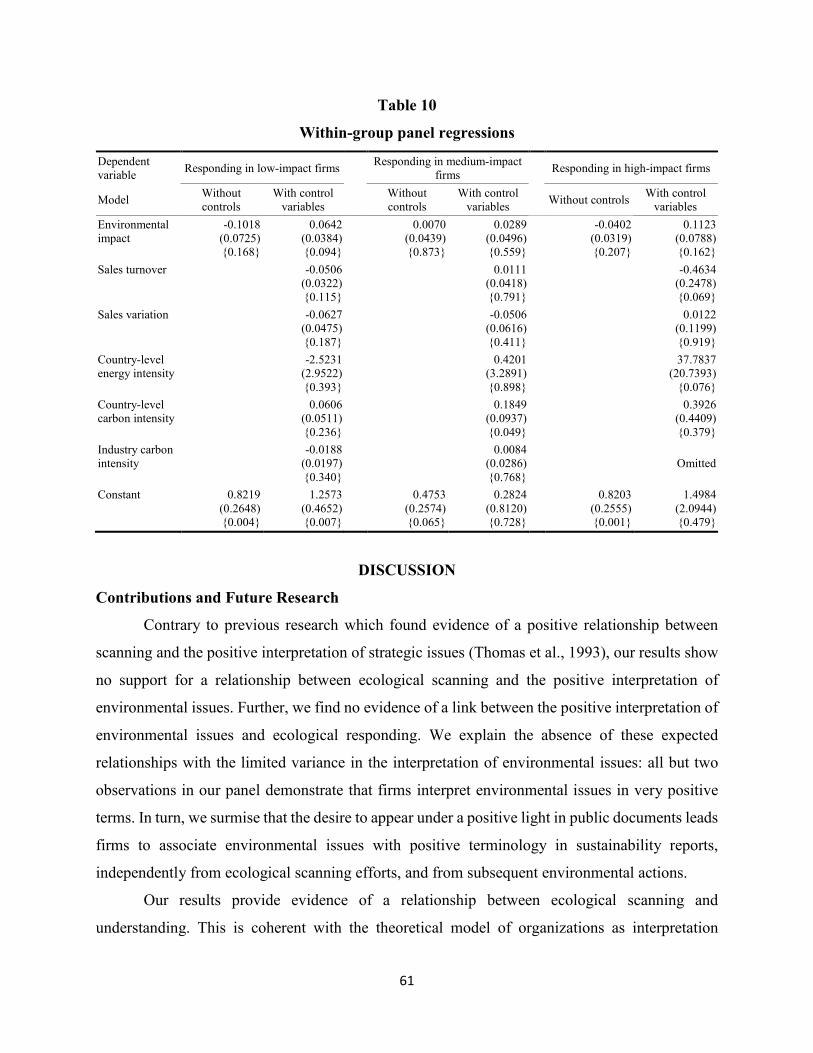
61
Table 10
Within-group panel regressions
Dependent variable
Responding in low-impact firms Responding in medium-impact
firms
Responding in high-impact firms
Model Without controls
With control variables
Without controls
With control variables
Without controls
With control variables
Environmental impact
-0.1018 (0.0725) {0.168}
0.0642 (0.0384) {0.094}
0.0070 (0.0439) {0.873}
0.0289 (0.0496) {0.559}
-0.0402 (0.0319) {0.207}
0.1123 (0.0788) {0.162}
Sales turnover -0.0506 (0.0322) {0.115}
0.0111 (0.0418) {0.791}
-0.4634 (0.2478) {0.069}
Sales variation -0.0627 (0.0475) {0.187}
-0.0506 (0.0616) {0.411}
0.0122 (0.1199) {0.919}
Country-level energy intensity
-2.5231 (2.9522) {0.393}
0.4201 (3.2891) {0.898}
37.7837 (20.7393)
{0.076}
Country-level carbon intensity
0.0606 (0.0511) {0.236}
0.1849 (0.0937) {0.049}
0.3926 (0.4409) {0.379}
Industry carbon intensity
-0.0188 (0.0197) {0.340}
0.0084 (0.0286) {0.768}
Omitted
Constant 0.8219 (0.2648) {0.004}
1.2573 (0.4652) {0.007}
0.4753 (0.2574) {0.065}
0.2824 (0.8120) {0.728}
0.8203 (0.2555) {0.001}
1.4984 (2.0944) {0.479}
DISCUSSION
Contributions and Future Research
Contrary to previous research which found evidence of a positive relationship between
scanning and the positive interpretation of strategic issues (Thomas et al., 1993), our results show
no support for a relationship between ecological scanning and the positive interpretation of
environmental issues. Further, we find no evidence of a link between the positive interpretation of
environmental issues and ecological responding. We explain the absence of these expected
relationships with the limited variance in the interpretation of environmental issues: all but two
observations in our panel demonstrate that firms interpret environmental issues in very positive
terms. In turn, we surmise that the desire to appear under a positive light in public documents leads
firms to associate environmental issues with positive terminology in sustainability reports,
independently from ecological scanning efforts, and from subsequent environmental actions.
Our results provide evidence of a relationship between ecological scanning and
understanding. This is coherent with the theoretical model of organizations as interpretation
62
systems underlying this paper: data acquisition allows managers to give meaning to experience
(Daft & Weick, 1984). However, opposite to Daft and Weick’s (1984) model, and a fundamental
assumption of Western rationalist thinking, our results show that understanding does not translate
into proportionate action (i.e. responding). Following the model’s logic and terminology, we might
say that firms in our sample failed to “learn” (1984: 286). This result also goes against Thomas et
al.’s (1993) conclusion that scanning and understanding ease strategic action. However, Daft and
Weick (1984) issued a caveat stating that the three-stage model of scanning, understanding, and
responding oversimplifies processes involving beliefs, politics, and perceptions. Thomas et al.
(Thomas et al., 1993) also noted that oversimplifications of interpretation-performance
relationships do not properly reflect the complex processes occurring in organizational settings.
Accordingly, recent research has proposed that managers whose schemas encompass a wide array
of business and ecological issues are more likely to interpret sustainability issues ambivalently
(Hahn et al., 2014). Relatedly, it has been argued that firms with business-centred approaches to
sustainable initiatives are ill-equipped for environmental sustainability (Pain, 2015). Future
research could investigate how ambivalence, trade-offs, and contradictions as regards the
importance and centrality of sustainability in firm-level schemas explains the apparent
disconnection between ecological understanding and responding.
Despite our expectations, the testing of our last hypothesis produced some evidence of a
positive relationship between ecological responding and corporate environmental impact. We
envisioned two explanations for this result. First, assuming overlap between schemas and disclosed
schemas, we speculated that firms implement inappropriate responses that either do not affect or
worsen environmental issues. Second, assuming limited overlap between schemas and disclosed
schemas, we offered that firms might exaggerate ecological responding when corporate
environmental performance (CEP) is low. Additional testing refuted the latter explanation,
showing a significant negative relationship between corporate environmental impact and
ecological responding the following year. With this complementary analysis, our results suggest
that firms’ ecological responding is inappropriate for the challenges at hand. The inappropriateness
of ecological responding may in turn be attributable to various factors ranging from changing
corporate goals, lack of resources, competing priorities, ambivalence, or as hinted by our other
results, the observed disconnection between ecological understanding and ecological responding.

63
Altogether, these results provide weak support for a deterministic perspective on the model
of organizations as interpretation systems, and in particular, for the schema-action-performance
relationship. In sum, while firms’ data gathering seems to be related to their comprehension of
environmental issues, companies neither convert comprehension into commensurate actions, nor
actions into reduced environmental impact. This resonates with Daft and Weick’s (1984), and
Thomas et al.’s (1993) caveat against oversimplification. Research has documented elaborate
debates between sponsors of eco-centric and business-driven schemas within firms (Bansal, 2003;
Howard-Grenville, 2007a) engaging in framing contests (Kaplan, 2008) to influence
organizational actions. Building on this literature, the examination of how corporate sustainability
debates impact ecological responding and CEP constitutes a complementary research avenue.
Beyond ecological interpretation, this paper has also shed light on our working assumption
that disclosed schemas overlap schemas (Narayanan & Fahey, 1990). Testing for reversed
causality, we were able to rule out the possibility that firms with high environmental impact
systematically enhance ecological responding in sustainability reports. Instead, we found that these
firms systematically reduce ecological responding in sustainability reports, suggesting an intention
to underemphasize ecological responding. Given the strategic nature of sustainability reports
(Philippe & Durand, 2011), it is unlikely that firms publicly express the scarcity of their responses
to ecological challenges. Rather, our interpretation is that high-impact firms deliberately adopt a
low profile to avoid being perceived as dishonest and risking societal and market sanction. This is
coherent with recent research proposing that it is not always in the best interest of firms to
greenwash under conditions of public scrutiny (Lyon & Maxwell, 2011). Following events or
periods of high corporate environmental impact, firms remain strategically modest or even silent
in corporate sustainability disclosure so as to prevent criticism (Bowen, 2014; Carlos & Lewis,
2015; Eun-Hee & Lyon, 2015). This interpretation supports our assumption that, while
sustainability reports are carefully crafted tools for strategic communication, firms cautiously keep
their discourse credible in reaction to increasing public skepticism toward corporate sustainability
claims.
Limitations
We wish to acknowledge several limitations to this study. First, this paper has described
the creation and validation of three dictionaries of ecological terms. This self-developed measure
for the identification of ecological interpretation needs further validation. While we have followed
64
rigorous procedures to enhance content and discriminant validity (Short et al., 2010), we need to
test our tool with various samples to demonstrate external validity. Analyzing different types of
corporate communications such as annual reports, 10-K forms, press releases and executive
interviews might produce insights as to the generalizability of findings across settings. Further
testing will also be needed to establish nomological validity, our tool’s capacity to predict separate
but theoretically linked concepts, such as corporate environmentalism (Van Marrewijk & Werre,
2003) and environmental orientation (Banerjee, 2001), for instance. Used with text analysis
software, our dictionaries can identify terms and phrases related to environmental monitoring,
environmental phenomena and impacts, and environmental restoration. They can inform future
research by capturing the salience of the natural environment in various types of textual sources
reflecting, among others, organizational interpretation, strategy, and discourse.
Second, our proxies for ecological scanning, understanding, and responding are built on
the analysis of disclosed schemas in public documents. As discussed, disclosed schemas represent
only what firms are willing and able to communicate, and are subject to embellishment and undue
modesty. Although there exist alternative documentary sources, some of which are listed above,
we expect that social desirability affects all firm-issued documents in a similar manner. Qualitative
research methods (e.g. case study, ethnography) could allow for a more transparent depiction of
ecological scanning, understanding, and responding, perhaps closer to firm-level schemas. By
design however, researchers employing qualitative techniques will need to make a trade-off
between the depth of analysis and the number of firms studied. Working with publicly-available
documents, we have conducted a longitudinal study of a relatively large number of firms.
Third, we recognize that corporate reporting has evolved since the period covered by our
data: 2006-2009. The 2008 financial crisis triggered by the American mortgage market has ended;
public awareness and scrutiny have increased; reporting standards and practices have changed.
Although we have controlled for time-varying unobserved variables by using random effects
regression models when needed, future research could investigate more recent periods. In addition
to accounting for changes in the social, economic, and technical context of corporate sustainability
reporting, coverage of later periods should permit studies on larger samples because of the greater
availability of corporate reports in recent years.
Fourth, our measure of corporate environmental impact, Trucost’s TEDC, is partially based
on self-reported firm data and thus subject to the same social desirability bias. We have argued,
65
however, that firms are legally liable for false declarations in public documents. Further,
companies face public scrutiny on corporate environmental actions and the threat of corrective
market reactions if irresponsible behavior toward the environment is revealed (Flammer, 2013).
On another note, TEDC contains estimates of unavailable data, leaving room for approximation.
We have found that Trucost uses established environmental economics methodologies approved
by independent experts, and validates estimations with the studied firms. Indeed, some
sustainability researchers consider TEDC one of “the most significant measures of environmental
performance” in the literature (Delmas et al., 2013: 259). Finally, TEDC aggregates impact types
(e.g. waste, volatile organic compounds, etc.) that differ importantly within and across companies,
and thus offers a coarse-grained picture of corporate environmental impact. We have preferred
TEDC to finer-grained data also available in the Trucost database because TEDC weights
environmental impact types through dollar valuation before it aggregates them, thus allowing for
comparison across companies with different resources use and emissions. In sum, we find that
TEDC offers acceptable credibility and valuable practicality.
IMPLICATIONS AND CONCLUSION
This paper opened with the statement that strategic management research has long
recognized the shaping influence of organizational interpretation on corporate action (Daft &
Weick, 1984; Thomas et al., 1993; Thomas & McDaniel, 1990). Our study’s main contribution is
the qualification of relationships between stages of firm-level interpretation: scanning,
understanding, responding (i.e. action), and corporate environmental performance. We have shown
that organizational interpretation does not always clearly mould firms’ actions. In the case of
ecological interpretation -the interpretation of ecological issues and phenomena- we have found
no relationship between the depth of corporate understanding and the extent of corporate actions.
It seems that the scanning-understanding-responding interpretation sequence is disrupted so that
responding does not take place in a commensurate fashion. We suggested that hidden interpretation
mechanisms involving divergent, undisclosed schemas might be the cause. Our results also
indicate that disclosed corporate environmental actions positively relate to corporate
environmental impact, and we inferred that firms’ environmental actions tend to be ecologically
inadequate.
66
As well, this paper contributes to the management literature on sustainability. Together,
our findings hint that firms can hardly reduce their environmental impact unless they become able
to translate their understanding of ecological issues into adequate, proportionate corporate actions.
Firm-level understanding of sustainability issues is not always straightforward however (Hahn et
al., 2014), and competing schemas often lead to business-driven, ineffective responses to
ecological issues (Pain, 2015). In addition, this paper provides a dictionary to measure ecological
interpretation with computer-aided text analysis software, for further validation and use in future
research.
More broadly, this paper is anchored in a stream of research that examines the relationships
between strategic cognitions, actions, and their consequences (Narayanan et al., 2011). As such, it
sheds some light on the link between organizational interpretation and performance. Recently,
research has given much attention to the interaction of divergent schemas and their cognitive
outcomes (Hahn et al., 2014) and to the competition between divergent schema sponsors who
attempt to affect strategic choice and action (Kaplan, 2008). Yet, there has been little emphasis on
the performance outcomes of such struggles. Further, our results indicate that there are feedback
mechanisms linking past performance and corporate actions. Recent works have examined how
organizational members reconcile events of the past with present and upcoming stakes (Kaplan &
Orlikowski, 2013) and future research in that area could provide insights on the linkages between
“temporal work” (2013: 965) and performance outcomes, and reciprocally.
Future research might also integrate additional organizational factors that interact with
schemas and shape performance. Firm structure is an apparent starting point, schema evolution
being associated with structural change (Bartunek, 1984; Ranson et al., 1980). Congruence
between firm-level schemas, structure and actions would be expected to produce better
performance outcomes, including as regards environmental performance (Russo & Harrison,
2005). Then, the question arises whether schemas, structure, and actions can simultaneously be
made congruent for multiple types and contexts of performance. As scholars address these and
other emerging questions, they will heed previous calls for cautiousness (Daft & Weick, 1984;
Thomas et al., 1993) by providing a more adequate depiction of the complex relationships between
interpretation, action, and performance in organizational settings.
67
ARTICLE 3
Different yet the same:
The evolution of disclosed strategic schemas on sustainability
STRATEGIC SCHEMAS AND SUSTAINABILITY
Scholarly interest for corporate sustainability keeps growing and researchers have inquired
into the cognitive settings that favor corporate environmentalism (Aguinis & Glavas, 2012). Many
studies mention schemas and related concepts explicitly or tacitly as key antecedents of
organizational change and actions toward sustainability (Angus-Leppan et al., 2010; Banerjee,
2001; Basu & Palazzo, 2008; Eberhardt-Toth & Wasieleski, 2013; Thomas, 2005). Built on values
and fundamental assumptions about causal relationships (Weick, 1995), schemas are defined as
socially-shared cognitive templates used to interpret experience on a given topic or domain
(Bartunek, 1993). Schemas filter and structure organizational experience, and guide the attribution
of meaning to experience as well as the enactment of attributed meaning (i.e. corporate action).
Schemas determine both what is relevant in the flow of organizational experience, how it should
be treated, and acted upon (Bartunek, 1984). In brief, schemas form the basis for firm sensemaking
(Weick, 1995) and action (Nadkarni & Barr, 2008; Nadkarni & Narayanan, 2007a; Weick et al.,
2005).
Research has looked at schemas and organizational structure (Bartunek, 1984), schemas
and organizational actions (Bartunek, 1993; Weick et al., 2005), or schema attributes like size and
complexity (Dane, 2010). But although studies of schemas in organizational settings reveal the
need for more research on schema change patterns, that is, on the ways schemas affect each other
leading to stasis or change (Balogun & Johnson, 2004; Labianca et al., 2000), extant research
remains essentially silent on this topic (for an exception, see Bingham & Kahl, 2013).
Past efforts in management and organization studies provide cues about factors that impact
schematic change dynamics. In particular, studies in organizational settings hint that the relative
power of groups that support new schemas influences which schema change patterns unfold
(Balogun & Johnson, 2004; Labianca et al., 2000). Similarly, the sustainability literature proposes
that firm experience is filtered through dominant schemas. When these devalue natural
environmental concerns, it takes great skill from green champions to convey the importance of
sustainable action and convince powerful organizational actors to take pro-environmental action

68
(Bansal, 2003; Howard-Grenville, 2007a). These works draw attention to power asymmetry across
groups that convey divergent schemas (Balogun & Johnson, 2004; Gioia & Chittipeddi, 1991;
Labianca et al., 2000; Maitlis, 2005). Some of these authors (Balogun & Johnson, 2004; Labianca
et al., 2000) have observed that groups promoting new schemas achieve various schema change
patterns: bookkeeping (incremental schema change), subtyping (isolation of a new schema),
replacement (emergence of a new schema), and relocation (shift between two existing schemas).
These studies, however, do not emphasize the possible relationship between group power and
schema change patterns. Beyond power, extant research does not investigate other factors that
might trigger different schema change patterns.
We propose to fill this void by exploring two research questions: 1) How do corporate
schemas evolve over time? 2) How do powerful schema sponsors influence others’ schemas? In
particular, we observe how firm-level schemas evolve as they interact with other schemas within
the mining industry. We use cause mapping (Axelrod, 1976; Barr et al., 1992; Huff, 1990; Huff &
Jenkins, 2002) to describe disclosed schemas on sustainability at the International Council for
Mining and Metals (ICMM) and four ICMM member companies from 2003 to 2013. Our findings
deepen our understanding of schema change by highlighting that schemas tend to grow
incrementally over time while obeying enduring corporate values, thus becoming different yet the
same. Our findings also reveal how powerful actors influence others’ schemas and actions by
anticipating future trends and experimenting with new sustainability practices, promoting adoption
by less proactive industry members.
In the next sections, we briefly review extant research before we describe our data and
methods. We then present our findings. In the last section, we discuss the contributions of this
paper and implications for research and practice.
STRATEGIC SCHEMA EVOLUTION
Research in management and organization studies has shed light on schema content and
structure. Studies on organizational schemas suggest that schema content includes information on
concepts along with causal links among concepts inside the schema (Bartunek, 1993; Bartunek &
Moch, 1987), consistent with earlier work in social psychology (Fiske & Dyer, 1985). As well,
constituent concepts are given meaning and value (Bartunek, 1993; Bingham & Kahl, 2013),
which implies that there exists a hierarchy of concepts reflecting firm values within schemas. Some

69
authors have characterized schema structure as focused -schema structure revolves around a
limited number of concepts with few relations- to complex -structure encompasses a large number
of concepts with multiple relations (Nadkarni & Narayanan, 2007b). Little work describes how
schema content and structure evolve over time, and more research is needed in that direction
(Bingham and Kahl, 2013).
Schema evolution has been found to follow certain patterns, by which old schemas evolve
as firms either “digest” new schemas or adopt them (Balogun & Johnson, 2004; Labianca et al.,
2000; Rothbart, 1981; Weber & Crocker, 1983). Four patterns have been identified:
(1) bookkeeping characterizes gradual change from old to new schemas. Given schemas tend to
endure and resist gradual change, a bookkeeping pattern may result in the absorption of the new
by the old; (2) subtyping happens when a new schema is created as a sub-schema (of lesser value)
under an old schema as a result of its marked discrepancy; (3) relocation represents a migration
from an old schema to a concurrent new one; (4) replacement describes the disconfirmation of an
old schema accompanied by, and possibly causing, the emergence of a new one (Albert, 1992;
Balogun & Johnson, 2004; Labianca et al., 2000). However, most research on schema interaction
patterns does not examine the relationships that might exist among them, nor the factors associated
with the occurrence of one schema interaction pattern over others. In brief, there exists no
framework that integrates schema interaction patterns and presents the conditions and processes
through which these patterns unfold.
Much attention has been given to the ways in which management may deliberately or not
impact internal groups’ schemas (Bartunek, 1984; Gioia & Chittipeddi, 1991; Poole et al., 1989).
More generally, scholars have studied how organizational groups –managerial or not- negotiate
the meaning attributed to firm experience and attempt to modify or replace other groups’ schemas
(Bartunek, 1993; Kaplan, 2008; Kaplan & Orlikowski, 2013). In particular, the sustainability
literature portrays environmental champions “selling” green initiatives and employing an array of
techniques to this end (Bansal, 2003; Howard-Grenville, 2007a, 2007b). Yet, this literature is not
explicit about the effects of meaning negotiation on schema content and structure. For instance,
although sustainability champions best succeed at changing behaviors when they borrow schemas
from the groups they try to influence, it seems that schema borrowing reinforces old schemas and
marginalizes new ones (Howard-Grenville, 2007a). Answers to these questions require further
inquiry about schema interaction dynamics.

70
DATA AND METHODS
Research Design
We observe strategic schema evolution in several member companies of a large industry
association, the International Council for Mining and Metals (ICMM) whose mission is to enhance
environmental performance in the mining industry. Schema evolution is the transformation of
schemas as a result of their exposure to other schemas and experience. ICMM member companies
are exposed to ICMM’s schemas because they voluntarily affiliate with and fund ICMM knowing
that its purpose is to enhance sustainability practice and performance in the industry. Further,
members must commit to enhanced corporate environmental performance and adhere to ICMM
sustainability policies. Finally, ICMM’s strategic decisions are sanctioned by member companies’
executives, which ensures corporate commitment at the highest hierarchical level. Simultaneously,
member companies’ and ICMM’s schemas on climate change diverge due to local priorities and
circumstances. Further, while members actively contribute to produce ICMM’s sustainable
development positions and actions through their participation in various ICMM work groups, the
outcomes of the work groups are beyond the control of any individual member company. ICMM
also employs about 20 directors, managers and program officers whose administration affects the
direction and results of work groups’ activities. We therefore expect that, while they are fully
aware of ICMM’s positions, individual ICMM members have varied positions on sustainable
development and climate change. Further, it is our understanding that those members who convey
divergent strategic orientations in their official discourse do so knowingly.
Schemas are cognitive structures that guide firms’ interpretations; corporate discourse
draws on schemas to convey carefully crafted messages to selected audiences. To capture firms’
schema evolution, we look for changes in the concepts, conceptual values, and conceptual
relationships that constitute schemas (Bartunek, 1993), using cause mapping (Axelrod, 1976; Barr
et al., 1992; Huff, 1990; Huff & Jenkins, 2002). Doing so, we assume that the production of
discourse with meaning (i.e. ICMM’s annual reports and policies, members’ sustainability reports)
is an act of interpretation and enactment that exposes strategic schemas. As such, consecutive
reports reveal schema evolution, as discussed in more detail below.
Analyzing Sustainability Reports
This study looks at annual reviews from ICMM and sustainability reports from its corporate
members. As a firm’s public discourse contains elements of reflection which decision makers
71
select for disclosure with specific stakeholders in mind (Narayanan & Fahey, 1990; Philippe &
Durand, 2011), the question arises whether these reports accurately represent the studied firms’
schemas. One side of the question is whether sustainability reports can be taken to represent firm-
level schemas. A number of studies show that corporate documents intended for public disclosure
tend to be jointly prepared by various individuals and departments, for instance, top executives
and public relations departments (e.g. Barr et al., 1992). They are therefore more likely to represent
a collective or corporate point of view, and have been specifically used to this end in management
research, including to study firms’ environmental strategies (Philippe & Durand, 2011; Sharma &
Henriques, 2005).
Another aspect of the question is whether sustainability reports are accurate representations
of schemas. We propose that representations of corporate interpretations in public documents are
fractional because (1) firms may not be able to fully articulate their positions, even for themselves,
and (2) firms may decide to strategically withhold part of their positions from external stakeholders
(see below). Sustainability reports thus convey selected parts of the schemas that firms are able to
express (Narayanan & Fahey, 1990), which we call “disclosed schemas”. In addition, sustainability
reports are expected to feature overstatement of sustainability priorities and embellishment of
green accomplishments, known as “greenwash” (Lyon & Montgomery, 2015). Again, we follow
Narayanan and Fahey (1990) in stating that the correlation between corporate discourse and
corporate schemas depends on the context in which public discourse happens. We argue that the
current context characterized by public scrutiny of firms’ environmental performance deters
greenwash and enhances the likelihood that sustainability reports correctly communicate corporate
achievements. This claim is supported by a growing body of research showing that it is not always
in a firm’s best interests to exaggerate environmental accomplishments. Economic modelling
suggests that firms which are publicly expected to perform well and have limited information about
their own environmental performance are better off not disclosing anything than greenwashing,
while firms which are publicly expected to perform poorly and have accurate information about
their own environmental performance are better off fully disclosing than greenwashing (Lyon &
Maxwell, 2011). Recent research also shows that firms are less likely to make sustainability claims
and to announce environmental certifications when their recent activities are in contradiction with
such claims (Carlos & Lewis, 2015). These studies suggest that there can be significant penalty
for greenwash, of which firms are acutely aware especially at times of active monitoring by the
72
media and civil society (Bowen & Aragon-Correa, 2014). Notably, ICMM represents an industrial
sector where companies need a ‘social licence to operate’ (Aguilera, Rupp, Williams, & Ganapathi,
2007) and are thus under enhanced scrutiny by local communities, environmental groups, and
governments. Finally, all firms are legally liable for false representation in their sustainability
reports to the extent that financial stakeholders feed sustainability information into risk
assessments. Together, these points represent powerful constraints on the public discourse of the
companies we have studied. This context suggests acceptable overlap between the studied
sustainability reports and our sample organizations’ strategic schemas.
Using Cognitive Mapping to Capture Schema Evolution
Cognitive mapping, or cause mapping, is a content analysis technique that highlights
conceptual relationships, including causal assertions, in texts (Axelrod, 1976; Huff, 1990; Huff &
Jenkins, 2002). In this study, we take sustainability reports to represent revealed parts of collective
schemas (Narayanan & Fahey, 1990) and we use cognitive mapping to identify concepts and
relationships among them (Axelrod, 1976; Barr et al., 1992) within sustainability reports. We thus
capture conceptual relationships in the schemas disclosed in sustainability reports. As we do so,
we acknowledge that these maps do not offer a perfect representation of strategic thought, but we
take the position that cognitive maps capture part of the strategic knowledge that studied
companies use (Huff, 1990: 14).
Cognitive mapping graphically represents concepts as boxes and the relationships between
them as arrows. Each arrow is associated with a letter code that characterizes the type of
relationship depicted. Two coders, the first author and a research assistant, learned the coding
procedure developed by Tucker Wrightson for Axelrod (Tucker Wrightson, 1976: 291–332) and
later modified by Huff, Narapareddy, & Fletcher (1990). We developed our own adaptation of
these procedures as shown in Table 1. By representing each relationship separately, cognitive
mapping clarifies the concepts and conceptual relationships contained in texts.
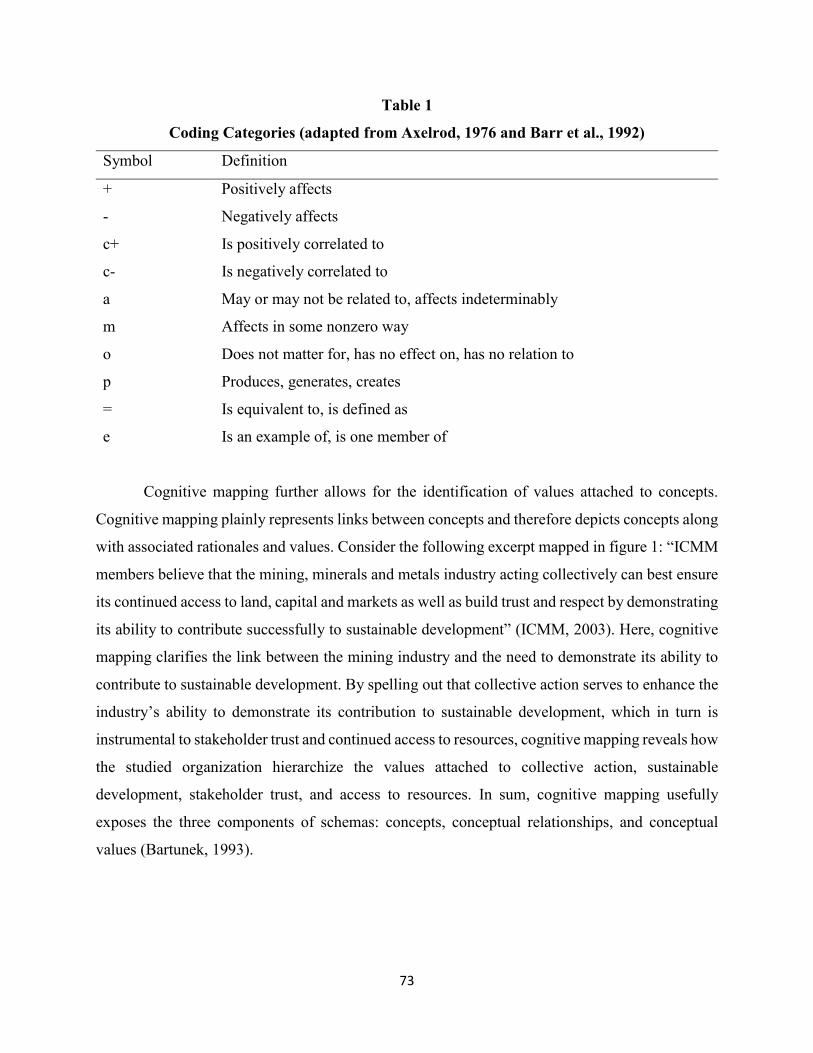
73
Table 1
Coding Categories (adapted from Axelrod, 1976 and Barr et al., 1992)
Symbol Definition
+ Positively affects
- Negatively affects
c+ Is positively correlated to
c- Is negatively correlated to
a May or may not be related to, affects indeterminably
m Affects in some nonzero way
o Does not matter for, has no effect on, has no relation to
p Produces, generates, creates
= Is equivalent to, is defined as
e Is an example of, is one member of
Cognitive mapping further allows for the identification of values attached to concepts.
Cognitive mapping plainly represents links between concepts and therefore depicts concepts along
with associated rationales and values. Consider the following excerpt mapped in figure 1: “ICMM
members believe that the mining, minerals and metals industry acting collectively can best ensure
its continued access to land, capital and markets as well as build trust and respect by demonstrating
its ability to contribute successfully to sustainable development” (ICMM, 2003). Here, cognitive
mapping clarifies the link between the mining industry and the need to demonstrate its ability to
contribute to sustainable development. By spelling out that collective action serves to enhance the
industry’s ability to demonstrate its contribution to sustainable development, which in turn is
instrumental to stakeholder trust and continued access to resources, cognitive mapping reveals how
the studied organization hierarchize the values attached to collective action, sustainable
development, stakeholder trust, and access to resources. In sum, cognitive mapping usefully
exposes the three components of schemas: concepts, conceptual relationships, and conceptual
values (Bartunek, 1993).
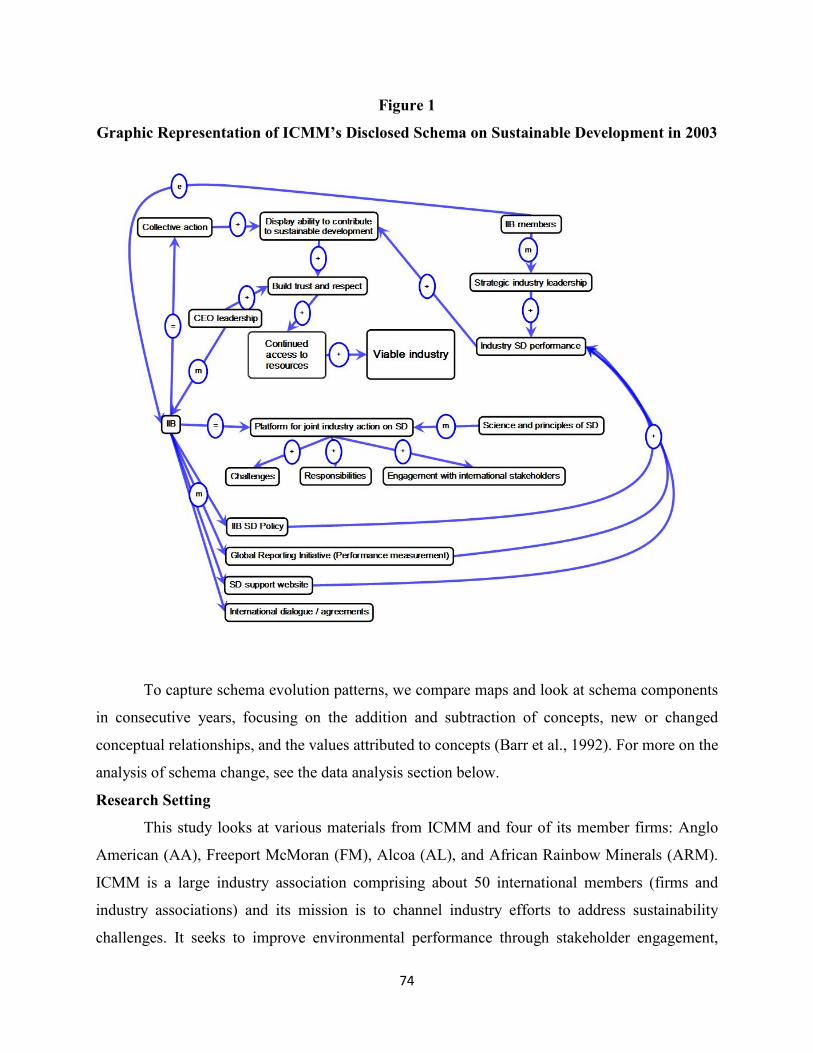
74
Figure 1
Graphic Representation of ICMM’s Disclosed Schema on Sustainable Development in 2003
To capture schema evolution patterns, we compare maps and look at schema components
in consecutive years, focusing on the addition and subtraction of concepts, new or changed
conceptual relationships, and the values attributed to concepts (Barr et al., 1992). For more on the
analysis of schema change, see the data analysis section below.
Research Setting
This study looks at various materials from ICMM and four of its member firms: Anglo
American (AA), Freeport McMoran (FM), Alcoa (AL), and African Rainbow Minerals (ARM).
ICMM is a large industry association comprising about 50 international members (firms and
industry associations) and its mission is to channel industry efforts to address sustainability
challenges. It seeks to improve environmental performance through stakeholder engagement,

75
member sensitization, capacity building, performance measurement, sustainability reporting,
outreach activities, and involvement in policy making. Since ICMM’s action addresses various
sustainability-related issues, we chose to focus on environmental issues and more precisely climate
change, which has been an area of heightened focus for ICMM, its members, and their stakeholders
in the last decade.
Based on the theoretical understanding that interaction among discrepant schemas is a
determinant in the occurrence of schema change (Pain, 2015), we attempted to capture schema
discrepancy and ensuing patterns of schema evolution by looking at different ICMM member
profiles: newcomer, longstanding members, and recently disengaged member. Since ICMM
members must publicly commit to sustainable development (SD), we expected schema change in
newcomers following their enrollment due to exposure to ICMM’s SD discourse and requirements.
Likewise, we anticipated schema change in disengaged members after their withdrawal and likely
dissociation from ICMM’s ideas. Further, we foresaw schema change in long-time members as
their schemas interact with ICMM’s. In order to theoretically and purposefully sample these three
profiles, we selected four ICMM members as the focal firms for this study: two founding
companies that continued membership over the studied period (Anglo American and Freeport-
McMoran), one founding company that left in 2007 (Alcoa), and a newcomer as of 2009 (African
Rainbow Minerals).
Anglo American is a multinational company with headquarters in London, United
Kingdom, and revenues of $33.06bn in 2013. AA’s operations are located on all continents and
encompass iron ore, manganese, coal, copper, nickel, platinum, and diamonds. Alcoa is a
multinational company with headquarters in Pittsburg, U.S.A., and revenues of $23.03bn in 2013.
AL specializes in bauxite mining, alumina, aluminium, and aluminium products and has operations
in Australia, Brazil, Jamaica, Suriname, Guinea, and Saudi Arabia. Freeport-McMoran is a
multinational company with headquarters in Phoenix, U.S.A., and revenues of $20.92bn in 2013.
FM operates copper, gold, molybdenum, and cobalt mines, as well as oil and gas extraction sites
located in Chile, the Democratic Republic of Congo, Indonesia, Peru, and the U.S.A. African
Rainbow Minerals is a multinational company with headquarters in Johannesburg, South Africa,
and revenues of $2.01bn in 2013. ARM mines iron, manganese, chrome, coal, copper, nickel, and
platinum in the Democratic Republic of Congo, Malaysia, South Africa, and Zambia.

76
Although the mining industry is not currently at the center of public debate, it is known as
a sector of activity with high environmental footprint that needs some level of social legitimacy to
operate. As such, the mining industry generates continuous communication on environmental
issues between ICMM, its members, and local and global stakeholders. Further, ICMM’s role is
explicitly to generate and channel collective action as an industry platform for joint corporate
action on environmental issues (ICMM, 2003). This lively communication context makes ICMM
and its members ideal cases for cognitive mapping.
Data Sources and Data Analysis
We used ICMM’s annual reports and policy statements as found on ICMM’s website.
Member companies’ sustainability reports come from their websites. In order to show change, we
examined three types of documents produced by ICMM and its members over a period of 11
consecutive years, from 2003 to 2013. ICMM’s annual reviews explain ICMM’s strategic
orientations and provide some assessment of goal achievement. Members’ annual sustainability
reports highlight corporate environmental strategies and performance. Finally, we cross-checked
and complemented information from the sustainability reports with data from the members’ annual
reports.
In the first stage of analysis, we converted all the reports into corresponding maps using
cognitive mapping as described above. Every map consists of concepts and relationships among
them. We first drew the 11 cognitive maps representing ICMM’s schemas on sustainability and
climate change from 2003 to 2013. While annual reviews and sustainability reports address
numerous issues such as shareholder value, health and occupational safety, and human rights,
schemas are topic-specific (Bartunek, 1993). Accordingly, we focused mapping on strategy,
sustainability, the natural environment, and climate change. Using the same technique, we
graphically represented the disclosed schemas of the four selected member companies, producing
44 additional cognitive maps, a total of 55 maps (see figure 1 for a sample map). We then assessed
the size of schemas represented in the maps, counting the number of concepts in each map and
adding the number of relationships (Calori, Johnson, & Sarnin, 1994; Eden, Ackermann, &
Cropper, 1992). Each map contains between 63 and 430 concepts and relationships. We further
obtained member companies’ revenues data from their annual sustainability reports,
environmental impact data from the Trucost database (for AA, FM, AL, 2003-2010), and ICMM
membership details from ICMM annual reviews. We present compiled information on schema

77
size, ICMM membership, and members’ revenues and environmental impact in Table 2. The
evolution of corporate schema sizes over the studied period is represented in Graph 1.
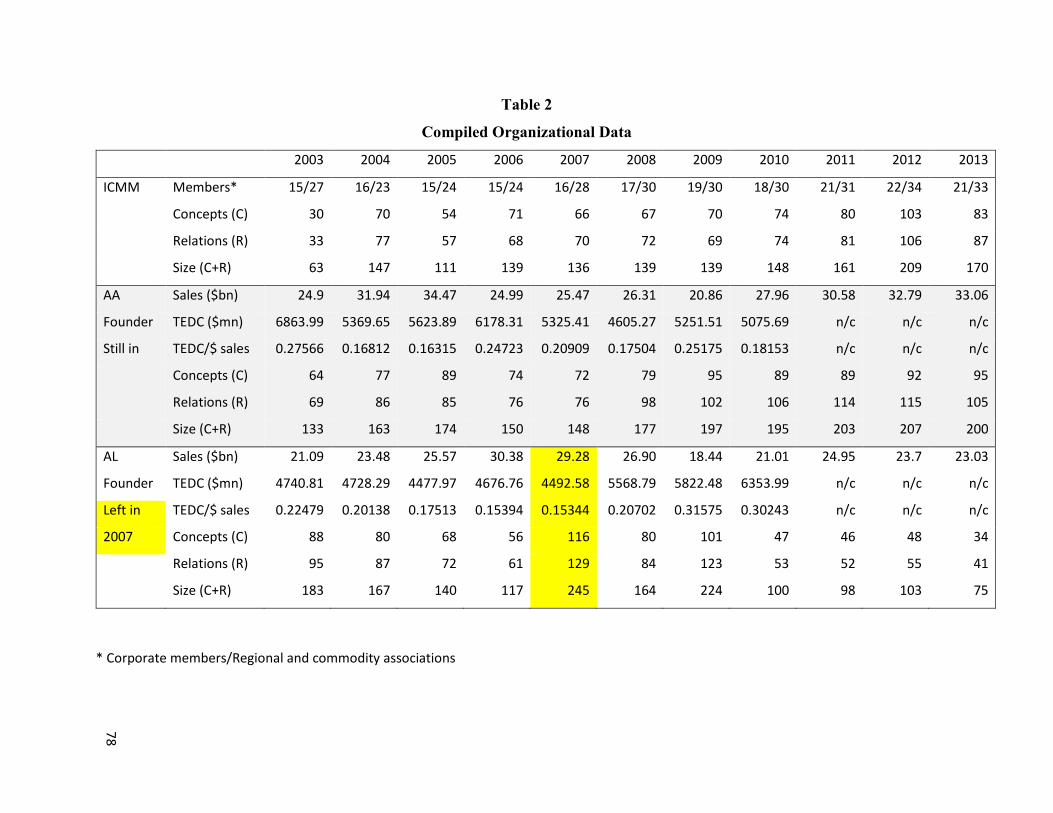
Table 2
Compiled Organizational Data
2003 2004 2005 2006 2007 2008 2009 2010 2011 2012 2013
ICMM Members* 15/27 16/23 15/24 15/24 16/28 17/30 19/30 18/30 21/31 22/34 21/33
Concepts (C) 30 70 54 71 66 67 70 74 80 103 83
Relations (R) 33 77 57 68 70 72 69 74 81 106 87
Size (C+R) 63 147 111 139 136 139 139 148 161 209 170
AA Sales ($bn) 24.9 31.94 34.47 24.99 25.47 26.31 20.86 27.96 30.58 32.79 33.06
Founder TEDC ($mn) 6863.99 5369.65 5623.89 6178.31 5325.41 4605.27 5251.51 5075.69 n/c n/c n/c
Still in TEDC/$ sales 0.27566 0.16812 0.16315 0.24723 0.20909 0.17504 0.25175 0.18153 n/c n/c n/c
Concepts (C) 64 77 89 74 72 79 95 89 89 92 95
Relations (R) 69 86 85 76 76 98 102 106 114 115 105
Size (C+R) 133 163 174 150 148 177 197 195 203 207 200
AL Sales ($bn) 21.09 23.48 25.57 30.38 29.28 26.90 18.44 21.01 24.95 23.7 23.03
Founder TEDC ($mn) 4740.81 4728.29 4477.97 4676.76 4492.58 5568.79 5822.48 6353.99 n/c n/c n/c
Left in TEDC/$ sales 0.22479 0.20138 0.17513 0.15394 0.15344 0.20702 0.31575 0.30243 n/c n/c n/c
2007 Concepts (C) 88 80 68 56 116 80 101 47 46 48 34
Relations (R) 95 87 72 61 129 84 123 53 52 55 41
Size (C+R) 183 167 140 117 245 164 224 100 98 103 75
* Corporate members/Regional and commodity associations
78

Compiled Organizational Data – Continued
2003 2004 2005 2006 2007 2008 2009 2010 2011 2012 2013
FM Sales ($bn) 2.21 2.37 4.18 5.79 16.94 17.8 15.04 18.98 20.88 18.01 20.92
Founder TEDC ($mn) 724.79 393.34 414.56 391.96 1260.3 1830.42 1444.64 1564.22 n/c n/c n/c
Still in TEDC/$ sales 0.32796 0.16597 0.09918 0.06770 0.0744 0.10283 0.09605 0.08241 n/c n/c n/c
Concepts (C) 53 56 55 58 100 84 72 77 75 79 76
Relations (R) 58 56 62 64 110 83 85 87 80 85 83
Size (C+R) 111 112 117 122 210 167 157 164 155 164 159
ARM Sales ($bn) 0.63 0.63 0.82 0.64 0.87 1.61 1.30 1.45 2.20 2.14 2.01
New as TEDC ($mn) n/c n/c n/c n/c n/c n/c n/c n/c n/c n/c n/c
of 2009 Concepts (C) 42 64 48 47 50 73 106 181 202 162 196
Relations (R) 40 61 50 48 53 87 122 196 216 165 234
Size (C+R) 82 125 98 95 103 160 228 377 418 327 430
79

80
Graph 1
Evolution of Schema Complexity
In the second stage of analysis, we coded map content to capture the meaning and structure
of schemas on sustainable development, and in particular, the strategic reasoning underpinning
corporate SD initiatives. This stage was intended to facilitate further analysis by clustering map
content under comparable categories since our maps cover a variety of topics that do not always
lend themselves to comparison. Adopting an inductive and interpretive approach, we identified
emerging categories describing sustainability strategies and their components, then clustered map
content under these categories. Using terms and phrases employed by the studied organizations,
we labeled these categories as follows: strategic objectives, credibility, stakeholder management,
leadership, commitment, sustainability performance, and sustainability practices.
0
50
100
150
200
250
300
350
400
450
500
2002 2003 2004 2005 2006 2007 2008 2009 2010 2011 2012 2013 2014
Size
= C
on
cep
ts +
Rel
atio
nsh
ips
Year
Evolution of Schema Size by Organization
ARM
AL
FM
AA
ICMM
2007: AL left
2009: ARM
81
Table 3 summarizes how these categories were identified. In addition, we reviewed the
cognitive maps built in the first stage of analysis, highlighting the nature of relationships among
concepts within the studied schemas. From a schema perspective, by characterizing relationships
among concepts and clustering concepts into categories, we reveal the value ascribed to categories,
thus fully depicting schema components: concepts (categories), relationships, and values
(Bartunek, 1993). In broader terms, we explain how the studied organizations relate and value
components of sustainability strategies.
In the third stage of analysis, we looked for similarities and differences between ICMM
and member companies’ schemas along the considered period, focusing on actions taken. We first
identified a set of actions suitable for cross-organizational comparison. It is useful here to note that
the activities of the studied companies, although mining-related, differ in nature and scale. Thus,
corporate actions linked to technology and production, such as energy supply and consumption,
water management, emissions reductions, equipment and operations optimization are hardly
comparable across companies in our sample. Instead, we examined sustainability and stakeholder
management practices applicable to all the studied companies, including internal control systems,
risk management, stakeholder outreach, environmental certifications, dissemination of best
practices, and policy implementation. Among these practices is the application of the reporting
guidelines developed by the Global Reporting Initiative (GRI), an independent international
organization that provides tools for businesses, governments and others to communicate the impact
of business on sustainability issues through rigorous sustainability reporting (Global Reporting
Initiative, 2017). We chose to showcase the adoption of GRI guidelines because the details of
implementation (e.g. audit, level of reporting) and evolution (i.e. GRI G2 in 2002, G3 in 2006, and
G4 in 2013) provide multiple points of comparison across companies and over time. We then built
an event history database (Maguire & Hardy, 2013; van de Ven & Poole, 1990) to systematically
document the sequence of events related to the adoption of GRI guidelines. In this part of the
analysis, we used two additional data sources: ICMM annual reviews which report members’ GRI
application levels as of 2009, and the GRI online database which discloses companies’ GRI
compliance and application levels. Cross-organizational comparison over time uncovered patterns
of convergence, allowing inferences on mutual influence among ICMM member companies.

Table 3
Categories Describing Sustainability Strategies and Their Components
Categories Description of Data Coded Example
Strategic objectives Conceptual relationships associated with strategy, objectives, goal setting, targets, corporate future, orientation, approaches, priorities, focus, values, vision, and mandate.
The likelihood of operating in a carbon constrained future has been built into our strategic thinking (AA, 2006).
Credibility Conceptual relationships associated with credibility, confidence, trust, reputation, respect, transparency, accountability, compliance, awards, third-party certification, and audits.
ARM is committed to working smartly, responsibly and efficiently to effectively integrate economic, environmental and social needs as a basis for continuously improving performance and ensuring trust (ARM, 2004).
Stakeholder management Conceptual relationships associated with stakeholders, partnerships, participations, associations, collaborations, cooperation, joint work, communication, and dialogue.
FM’s engagement with suppliers on the issue of fuel efficiency and GHG emissions helps improve FM’s sustainability performance (FM, 2010).
Leadership Conceptual relationships associated with leadership, leading, being a leader/catalyst for change/example/role model/partner of choice, pioneering, and providing advice/guidance.
It is through the member companies’ leadership in these critical areas, united by a set of common core values, that we can serve as an example for the mining and metals industry globally (ICMM, 2008).
Commitment Conceptual relationships associated with commitment, being committed, engagement, moral obligation, doing “what is right”, duty, and responsibility.
As we search for stable and long-term energy supplies, we are committed to decreasing our reliance on fossil fuels by increasing […] our use of natural, renewable energy sources that help us lower our carbon dioxide emissions (AL, 2003).
Sustainability performance Conceptual relationships associated with improved environmental performance, reduced environmental footprint/impact, social and environmental outcomes, and contribution to sustainable development.
Working toward sustainable development through our operations and programs helps ensure a healthy environment and communities in our area of operation, which is vital to our future success (FM, 2003).
Sustainability practices Conceptual relationships associated with the management of sustainability issues, actions taken, efforts made, investments, programs, practices, policies, social and environmental management systems, and performance monitoring.
[We implement] best-practice programmes in enterprise development, local procurement, local capacity building, education and training, and community social investment (AA, 2013)
82

83
In the fourth and final stage of analysis, we compared organizational schemas over
consecutive years to identify patterns of schema evolution, and underlying processes of change.
We used schema change patterns identified in previous research to characterize schema change in
the studied sample. Bookkeeping and subtyping are first-order schema change (Bartunek, 1984)
patterns, associated with stability in the most valued concepts. Bookkeeping happens through
incremental modifications due to minor experiential discrepancy (Balogun & Johnson, 2004;
Rothbart, 1981; Weber & Crocker, 1983). Subtyping involves the creation of a subtype or sub-
schema to discriminate and isolate strongly discrepant new schemas or experience (Balogun &
Johnson, 2004; Labianca et al., 2000; Weber & Crocker, 1983). Replacement and relocation are
second-order schema change (Bartunek, 1984) patterns, associated with change in the most valued
concepts (Balogun & Johnson, 2004; Labianca et al., 2000; Rothbart, 1981). Replacement occurs
through the gradual emergence of a new schema, while relocation starts with the momentary co-
existence of two schemas and unfolds with a shift from one to the other (Albert, 1992). We have
explained above that the nature of relationships among concepts also reveals the third component
of schemas: values. We therefore heeded the nature of new relationships as concepts added to
extant schemas in order to capture the value of new concepts. With existing patterns in mind, we
attempted to unveil change processes, new schema change patterns, and sequences in patterns.
RESULTS
We present four sets of findings: observations on the studied organizations’ schemas,
ICMM membership, and environmental performance; a description of schema content and
articulation; a cross-organizational comparison of schemas illustrated by the adoption of GRI
reporting guidelines; and an analysis of the evolution of corporate members’ schemas.
Observations on Schemas, ICMM Membership, and Environmental Performance
In this section, we make general observations on the evolution of the studied organizations’
disclosed schemas over time, how they coincide with ICMM membership, with improving
environmental efficiency, and in two cases, with net environmental impact reduction.
Schema growth over time. Overall, we observed an augmentation in the size of disclosed
schemas over the studied period, as presented in detail in Table 2 and Graph 1. From 2003 to 2013,
schema size rose from 63 to 170 for ICMM, 133 to 200 for AA, 111 to 159 for FM, and 82 to 430
for ARM. At AL, the only company to leave ICMM during the period of study, schema size notably

84
dropped from 183 to 75 in the same period. Except for AL, member companies’ schemas increased
in size over time, slowly for founding members AA and FM, and rapidly for the new member,
ARM. Overall, the size of ICMM’s schemas tends to be below that of its members. These
observations are coherent with extant research proposing that schemas become more complex with
new concepts and relationships as knowledge is acquired (Dane, 2010). Implied is the idea that
new concepts and relationships are added and therefore that schemas have a tendency to grow over
time. In this sense, increasing schema size in the organizations we studied reflects increasing
expertise on the topic of sustainable development.
ICMM membership and schema growth. In addition, our observations suggest that ICMM
membership relates to disclosed schemas’ size. ARM’s schema size, which had been mostly below
ICMM’s, rose significantly above ICMM’s and other members’ schema size after it joined ICMM
in 2009. In 2013, ARM’s disclosed schemas had about 225 more concepts and relationships than
ICMM’s. Reversely, AL’s schema size, which had been above ICMM’s during its membership,
dropped below ICMM’s after its membership ended in 2007. In the final year of the study, AL’s
disclosed schemas had 100 concepts and relationships less than ICMM’s. In contrast, the schema
size of founding members AA and FM remained relatively close to ICMM’s along the studied
period.
Improving environmental efficiency over time. Looking at revenue and environmental
impact data, our findings suggest that studied companies improve their environmental efficiency
(environmental impact to revenue ratio) over time and build larger schemas on sustainable
development. In the studied organizations, environmental impact per dollar of revenue decreases
over ICMM membership time, while it increases over non-membership time. From 2003 to 2010,
the environmental impact to revenue ratio decreased from 0.28 to 0.18 at AA, and from 0.33 to
0.08 at FM. At AL, it decreased from 0.22 to 0.15 over the period 2003-2007. After AL left ICMM
in 2007, its impact to revenue ratio went from 0.15 to 0.30. Where environmental impact data is
available (i.e. studied member companies except ARM), schema size coincides with
environmental efficiency.
Cases of net environmental impact reduction over time. Importantly, improving impact
to revenue ratios do not reflect net environmental impact reduction. Most companies present
explicit growth plans in SD reports and insist that long-term net environmental impact reduction
should not be expected since environmental impact correlates with operations’ growth. This is the

85
main reason why companies focus on efficiency rather than net impact reduction. One Alcoa report
mentions:
“Although the total amount of waste generated in our metals process area has
increased as a result of the growth of Alcoa, our processes are generally among
the most efficient in the world, with several benchmark plants in terms of process
efficiencies and low emissions.” (Alcoa, 2003)
It is therefore remarkable that one company increased efficiency faster than operations,
achieving net environmental impact reduction. Anglo American’s environmental
impact -measured in dollars of environmental damage cost- declined from $6.9bn to $5.1bn in the
period 2003-2010. Also notable is Alcoa’s environmental impact down from $4.7bn to $4.5bn
between 2003 and 2007. After it left ICMM, Alcoa’s environmental impact rose from $5.6bn to
$6.4bn from 2008 to 2010. Finally, Freeport McMoran’s environmental impact doubled from 2003
to 2010, while its revenues increased tenfold, illustrating the effect of operations’ growth on
environmental impact despite best-in-class environmental efficiency.
Schema Content and Articulation
In this section, we describe the seven categories that emerged from coding map content to
capture the strategies and strategic components underpinning corporate sustainability initiatives,
as explained in Table 3. Building on the conceptual relationships highlighted by cognitive
mapping, Figure 2 reveals how these categories relate within the studied schemas. Remarkably,
the path diagram in Figure 2 applies to all organizations and endures, indicating similar schemas
and shared values across organizations over time. In a nutshell, Figure 2 clarifies that firms
leverage sustainability strategies to gain credibility and achieve strategic goals. We unfold this
finding in the outline of the seven categories below. Each outline starts with a definition derived
from the studied schemas, followed by its location within schemas, and an overview of its content.
Finally, we explain how each category connects to the others and to corporate sustainability.

86
Figure 2
Articulation of Strategic Components Underpinning Corporate Sustainability
Strategic objectives are the most valued goals stated by the studied organizations. They
guide organizational actions in the long term and spell out how the other components of strategy
connect. Strategic objectives are presented in disclosed schemas as part of the corporate mission,
vision, strategy, and policies. Table 4 illustrates that the content of strategic objectives in the
studied schemas is centered on the viability and long-term growth of mining operations. Emphasis
is placed on continued access to land, capital, markets, and other resources such as a skilled
workforce. All other goals connect with strategic objectives following an instrumental logic. In
this context, sustainability is primarily understood as business sustainability: “sustainability is
defined as using our values to build financial success, environmental excellence, and social
responsibility” (AL, 2003-2009); “ensure that we remain a vibrant, sustainable business entity”
(FM, 2012); “ensuring the sustainability of our business” (ARM, 2013). Sustainability’s place
among other strategic targets depends on its contribution to economic and financial performance.
Credibility represents the mining companies’ ability to make their discourse on
sustainability believable by relevant stakeholders (defined below). Credibility amounts to
stakeholder trust and is instrumental for mining companies to achieve their stated strategic
objectives of access to land, capital, markets and other resources. For example, government trust
facilitates the release of mining permits, that is, access to land. Credibility is addressed in disclosed
schemas together with content on stakeholders, social capital, reputation, and trust. Table 5 shows
that credibility-related content in the studied schemas emphasizes maintaining company and
Strategic objectives Credibility
Stakeholder management
Leadership
Sustainability practices
Commitment
Sustainability performance
87
industry reputation, establishing credibility and building trust, communicating with stakeholders,
keeping commitments, and meeting society’s expectations. Credibility connects to strategic goals
as a means to an end. In turn, all other components of strategy identified in the maps are intended
to build, establish, and maintain credibility. Sustainability is no exception: “If resources are not
extracted responsibly and in accordance with the needs and standards of society, we will lose the
trust of stakeholders.” (FM, 2009).
Stakeholder management consists in establishing and maintaining productive
communication and collaboration with relevant stakeholders. Relevant stakeholders are those
controlling the resources, the access to which is considered a strategic objective. These include
investors whose trust affects the financial resources available for operations and growth (access to
capital); governments that issue exploration and mining permits (access to land); local
communities whose cooperation can make or break a mining operation (access to land); civil
society organizations with the influence to enhance or damage a company’s reputation (access to
all resources); employees whose skills and behavior affects performance outcomes (access to
workforce); and other mining companies acting as competitors and partners (access to markets).
Disclosed schemas tend to group stakeholder management with content on credibility, market
intelligence, and local operations. Table 6 indicates that content on stakeholder management
encompasses trend monitoring, change anticipation, crisis prevention, industry promotion, public
relations, technological innovation, and market entry. Stakeholder management connects to
credibility in a mutually influential relationship: credibility eases stakeholder management, while
stakeholder management strengthens credibility. All other components of strategy identified in the
maps feed into stakeholder management and credibility. In this sense, perceived sustainability
contributes to peaceful and constructive stakeholder relations.

88
Table 4
Strategic Objectives
Organization Examples
ICMM [We] recognise that only by continually demonstrating its ability to contribute to sustainable development, can the industry build the trust and respect necessary to ensure its continued access to land, capital and markets. (ICMM, 2003)
Anglo American These distinctive challenges mean we must manage a wide range of increasingly salient social and political risks. These issues are fundamental to our continuing access to land and resources and to our ability to attract investors and the best talent. (AA, 2006)
Alcoa At Alcoa, sustainability is defined as using our values to build financial success, environmental excellence, and social responsibility in partnership with all stakeholders in order to deliver net long-term benefits to our shareowners, employees, customers, suppliers, and the communities in which we operate. (AL, 2003-2009)
Freeport-McMoran To supply essential metals to current and future generations, we are guided by our stated business objectives, principles and policies, and we continuously improve our sustainable development programs. Our approach has three core elements. Economic: Leverage our operating and financial expertise, technologies and supply chain to ensure that we remain a vibrant, sustainable business entity. Social: Operate safely, and uphold and promote human rights. Engage openly and transparently with internal and external stakeholders and keep our commitments to build trust. This enhances our ability to obtain permits to operate, ensures we have a dedicated workforce and affords us business opportunities. Environmental: Evaluate environmental aspects continuously throughout a project’s life cycle to minimize adverse impacts and promote opportunities. (FM, 2012)
African Rainbow Minerals In order to meet our commitment to preserving and enhancing shareholder value, ensuring the sustainability of our business and achieving long-term growth, ARM: works responsibly; has a governance structure in place; is respectful of all our stakeholders; provides an environment which encourages our employees; maintains a non-discriminatory workplace; invests in the health and wellbeing; employs a devolved management structure; aims for operational excellence; improves the living conditions; and, adds shareholder value. (ARM, 2013)
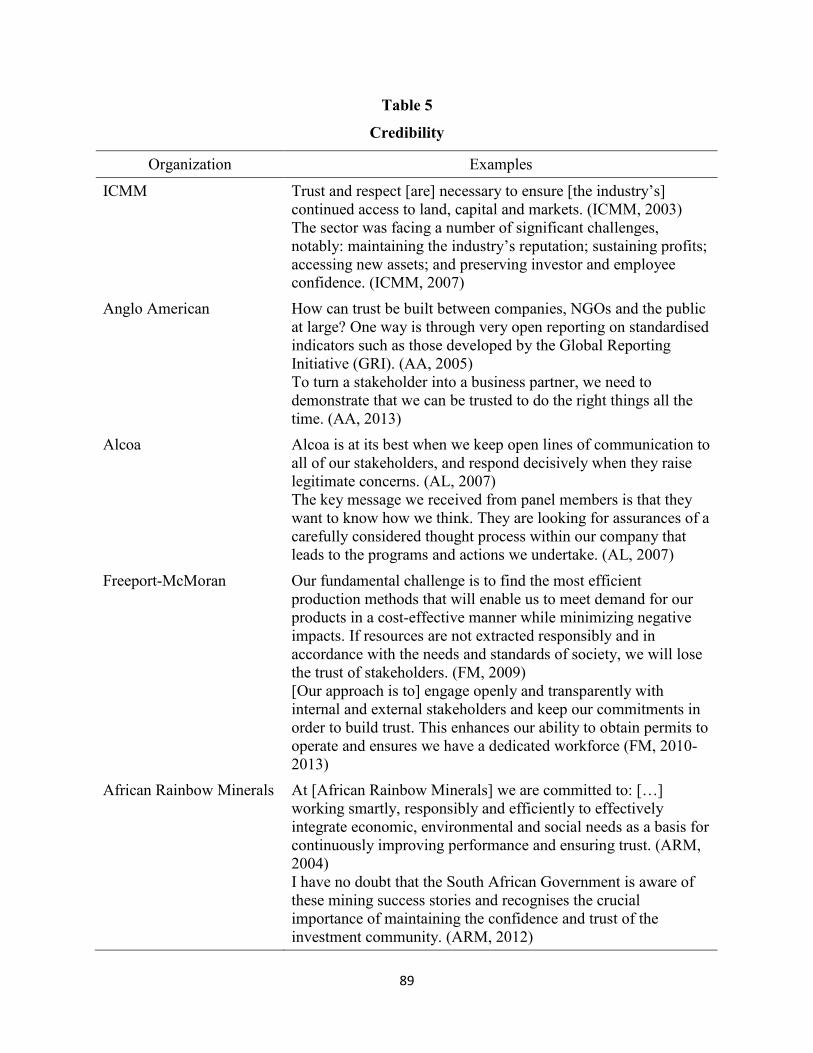
89
Table 5
Credibility
Organization Examples
ICMM Trust and respect [are] necessary to ensure [the industry’s] continued access to land, capital and markets. (ICMM, 2003) The sector was facing a number of significant challenges, notably: maintaining the industry’s reputation; sustaining profits; accessing new assets; and preserving investor and employee confidence. (ICMM, 2007)
Anglo American How can trust be built between companies, NGOs and the public at large? One way is through very open reporting on standardised indicators such as those developed by the Global Reporting Initiative (GRI). (AA, 2005) To turn a stakeholder into a business partner, we need to demonstrate that we can be trusted to do the right things all the time. (AA, 2013)
Alcoa Alcoa is at its best when we keep open lines of communication to all of our stakeholders, and respond decisively when they raise legitimate concerns. (AL, 2007) The key message we received from panel members is that they want to know how we think. They are looking for assurances of a carefully considered thought process within our company that leads to the programs and actions we undertake. (AL, 2007)
Freeport-McMoran Our fundamental challenge is to find the most efficient production methods that will enable us to meet demand for our products in a cost-effective manner while minimizing negative impacts. If resources are not extracted responsibly and in accordance with the needs and standards of society, we will lose the trust of stakeholders. (FM, 2009) [Our approach is to] engage openly and transparently with internal and external stakeholders and keep our commitments in order to build trust. This enhances our ability to obtain permits to operate and ensures we have a dedicated workforce (FM, 2010-2013)
African Rainbow Minerals At [African Rainbow Minerals] we are committed to: […] working smartly, responsibly and efficiently to effectively integrate economic, environmental and social needs as a basis for continuously improving performance and ensuring trust. (ARM, 2004) I have no doubt that the South African Government is aware of these mining success stories and recognises the crucial importance of maintaining the confidence and trust of the investment community. (ARM, 2012)
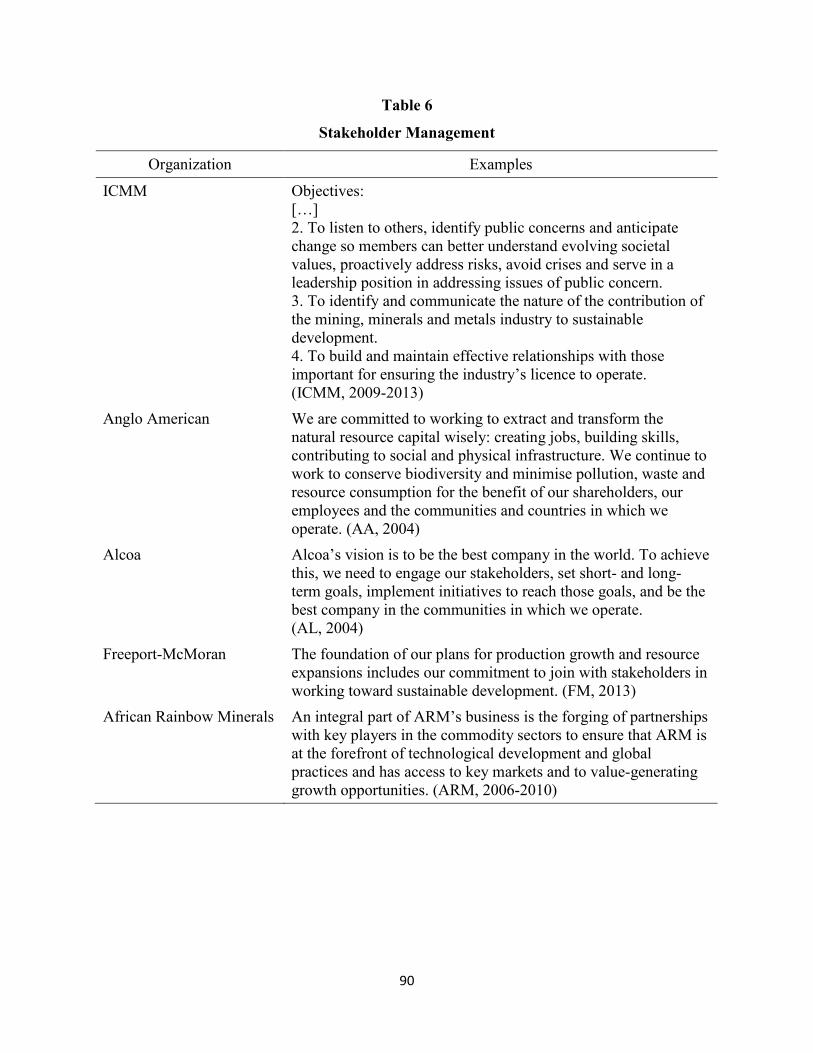
90
Table 6
Stakeholder Management
Organization Examples
ICMM Objectives: […] 2. To listen to others, identify public concerns and anticipate change so members can better understand evolving societal values, proactively address risks, avoid crises and serve in a leadership position in addressing issues of public concern. 3. To identify and communicate the nature of the contribution of the mining, minerals and metals industry to sustainable development. 4. To build and maintain effective relationships with those important for ensuring the industry’s licence to operate. (ICMM, 2009-2013)
Anglo American We are committed to working to extract and transform the natural resource capital wisely: creating jobs, building skills, contributing to social and physical infrastructure. We continue to work to conserve biodiversity and minimise pollution, waste and resource consumption for the benefit of our shareholders, our employees and the communities and countries in which we operate. (AA, 2004)
Alcoa Alcoa’s vision is to be the best company in the world. To achieve this, we need to engage our stakeholders, set short- and long-term goals, implement initiatives to reach those goals, and be the best company in the communities in which we operate. (AL, 2004)
Freeport-McMoran The foundation of our plans for production growth and resource expansions includes our commitment to join with stakeholders in working toward sustainable development. (FM, 2013)
African Rainbow Minerals An integral part of ARM’s business is the forging of partnerships with key players in the commodity sectors to ensure that ARM is at the forefront of technological development and global practices and has access to key markets and to value-generating growth opportunities. (ARM, 2006-2010)
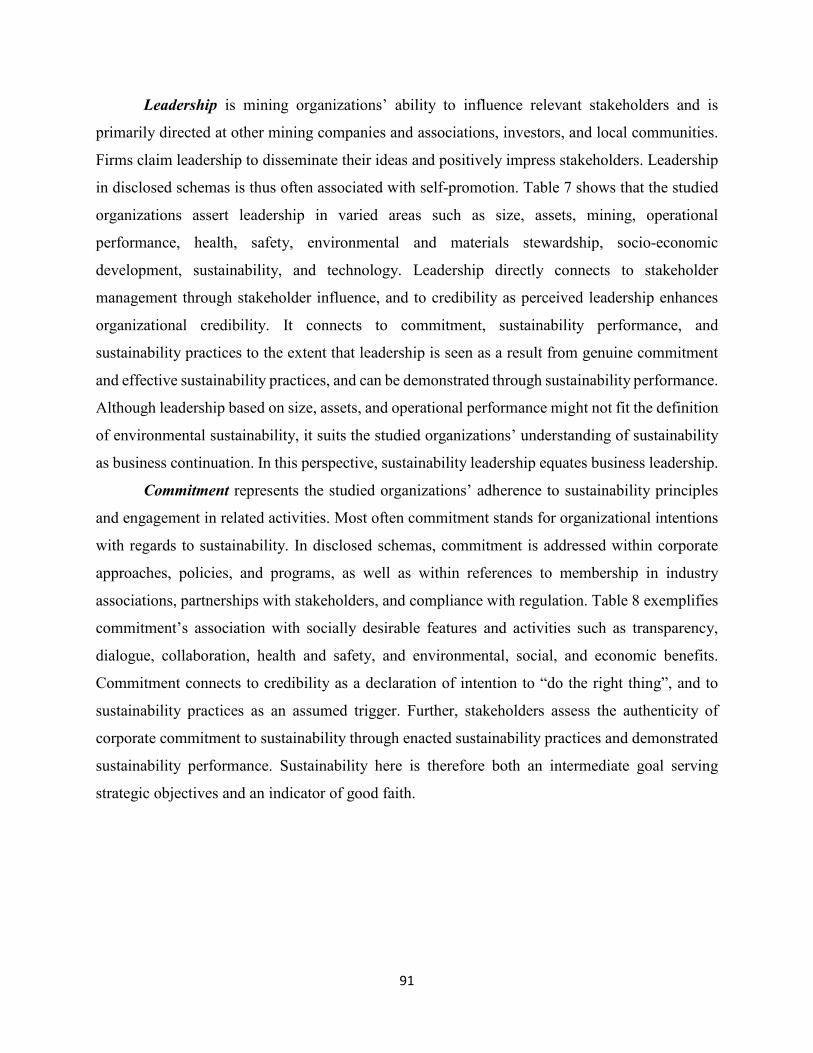
91
Leadership is mining organizations’ ability to influence relevant stakeholders and is
primarily directed at other mining companies and associations, investors, and local communities.
Firms claim leadership to disseminate their ideas and positively impress stakeholders. Leadership
in disclosed schemas is thus often associated with self-promotion. Table 7 shows that the studied
organizations assert leadership in varied areas such as size, assets, mining, operational
performance, health, safety, environmental and materials stewardship, socio-economic
development, sustainability, and technology. Leadership directly connects to stakeholder
management through stakeholder influence, and to credibility as perceived leadership enhances
organizational credibility. It connects to commitment, sustainability performance, and
sustainability practices to the extent that leadership is seen as a result from genuine commitment
and effective sustainability practices, and can be demonstrated through sustainability performance.
Although leadership based on size, assets, and operational performance might not fit the definition
of environmental sustainability, it suits the studied organizations’ understanding of sustainability
as business continuation. In this perspective, sustainability leadership equates business leadership.
Commitment represents the studied organizations’ adherence to sustainability principles
and engagement in related activities. Most often commitment stands for organizational intentions
with regards to sustainability. In disclosed schemas, commitment is addressed within corporate
approaches, policies, and programs, as well as within references to membership in industry
associations, partnerships with stakeholders, and compliance with regulation. Table 8 exemplifies
commitment’s association with socially desirable features and activities such as transparency,
dialogue, collaboration, health and safety, and environmental, social, and economic benefits.
Commitment connects to credibility as a declaration of intention to “do the right thing”, and to
sustainability practices as an assumed trigger. Further, stakeholders assess the authenticity of
corporate commitment to sustainability through enacted sustainability practices and demonstrated
sustainability performance. Sustainability here is therefore both an intermediate goal serving
strategic objectives and an indicator of good faith.

92
Table 7
Leadership
Organization Examples
ICMM It is through the member companies’ leadership in these critical areas [health, safety, environmental and materials stewardship, socio-economic development], united by a set of common core values, that we can serve as an example for the mining and metals industry globally. (ICMM, 2008)
Anglo American Anglo American has long had a reputation for being a sustainability leader. […] Major mining companies can and should be considered development partners while at the same time continuing to be successful businesses. My ambition is for all our host communities, and our wider stakeholder base, to feel their lives are better for Anglo American’s presence. (AA, 2013)
Alcoa [We] believe that this upgraded technology can be used by others to increase hydro efficiency worldwide. (AL, 2003) In many instances, we are performing beyond compliance and leading the establishment of new, higher standards. (AL, 2003) We were included in the Dow Jones Sustainability Indexes for the twelfth consecutive year and again recognized as the global sustainability leader for the aluminum industry. (AL, 2013)
Freeport-McMoran On March 19, 2007, Freeport-McMoRan Copper & Gold Inc. completed its acquisition of Phelps Dodge Corporation, creating the world’s largest publicly traded copper company. The new Freeport-McMoRan Copper & Gold Inc. will be an international mining industry leader with its corporate headquarters in North America (FM, 2006) Getting [sustainable development] wrong would jeopardize our position as a leading international mining company. (FM, 2011)
African Rainbow Minerals ARM is a leading South African diversified mining and minerals company with world-class long-life, low-cost assets in key commodities. An integral part of ARM’s business is the forging of partnerships with major players in the resource sector. (ARM, 2010) [ARM] aims for operational excellence and continuous quality improvement, which includes employing a leading practice sustainable framework to fulfil our aim of achieving leading environmental and health performance and a safe, injury-free workplace. (ARM, 2013)

93
Table 8
Commitment
Organization Examples
ICMM Our members are committed to improving their sustainable development performance and to producing responsibly the mineral and metal resources society needs. (ICMM, 2004) There are few short cuts to trust building. It relies on industry to commit to continuous disclosure, information sharing, openness to engagement and dialogue. (ICMM, 2012)
Anglo American A major challenge for the extractive sector is to ensure that we work in harmony with local communities and that our operations are acknowledged as good neighbours. This requires regular engagement with local people and a commitment to maximising the social and economic contribution which we make during the lifetime of our operations so that they contribute to sustainable development. (AA, 2003) Today, businesses that operate sustainably are likely to prosper. For Anglo American it means meeting our commitments to stakeholders and seeking to operate to the highest possible standards of safety, health, environmental and community development practices. (AA, 2013)
Alcoa Our commitment to sustainability has a long history and is evident everyday — from the way we live our Values to the following strategic framework for sustainability supported by measurable objectives for guiding our operations. (AL, 2003) By staying true to that commitment, we made significant strides toward our strategic sustainability targets in 2012 despite significant global economic volatility. (AL, 2012)
Freeport-McMoran Demonstrating the strength of our commitment, we spent a total of $93 million on sustainable development programs in the area of our mining operations during 2003, including $52 million on environmental management and $41 million on social development. (FM, 2003) The foundation of our plans for production growth and resource expansions includes our commitment to join with stakeholders in working toward sustainable development. (FM, 2012-2013)
African Rainbow Minerals At [ARM] we are committed to embedding sustainable development as an integral part of the business (ARM, 2003-2005) We are committed to conduct our business safely and responsibly, as we seek to forge partnerships that increase our access to markets and value-generating growth opportunities. (ARM, 2010)

94
Sustainability performance describes the impacts of corporate programs, practices, and
products in the economic, social, and environmental domains. Mining companies use sustainability
performance to demonstrate commitment and progress. Sustainability performance is disclosed in
introductions, executive addresses, and general and topic-specific performance reviews on climate
change, materials stewardship, health and safety, etc. Table 9 evidences that the content of
sustainability performance centers on economic, social, and environmental benefits. Sustainability
performance connects to commitment, leadership, and sustainability practices respectively as a
proof of authenticity, progress, and effectiveness. Ultimately, it facilitates stakeholder
management and enhances organizational credibility. Again here, environmental sustainability is
an intermediate goal serving strategic objectives and an indicator of good faith.
Sustainability practices are organizational actions meant to enhance business viability
through positive impacts in the economic, social, and environmental domains. Like with
sustainability performance, mining companies use sustainability practices to demonstrate
commitment and progress. Indeed, firms frequently confound practices and performance, so that
sustainability practices stand as contributions to sustainability whose positive impact is presumed
rather than shown: “Although anecdotal evidence points to member practices creating significant
sustainable development-related improvements, for example, objective documentation and
assessment of overall progress remains elusive.” (ICMM, 2009: 7). Within disclosed schemas,
sustainability practices are presented in general and topic-specific performance reviews, and
detailed in case studies. Table 10 attests that the content of sustainability practices revolves around
economic, social, and environmental benefits. Sustainability practices connect to commitment and
leadership respectively as evidence of authenticity and progress. Further, when substantiated by
sustainability performance, sustainability practices fuel stakeholder management and enhance
credibility.
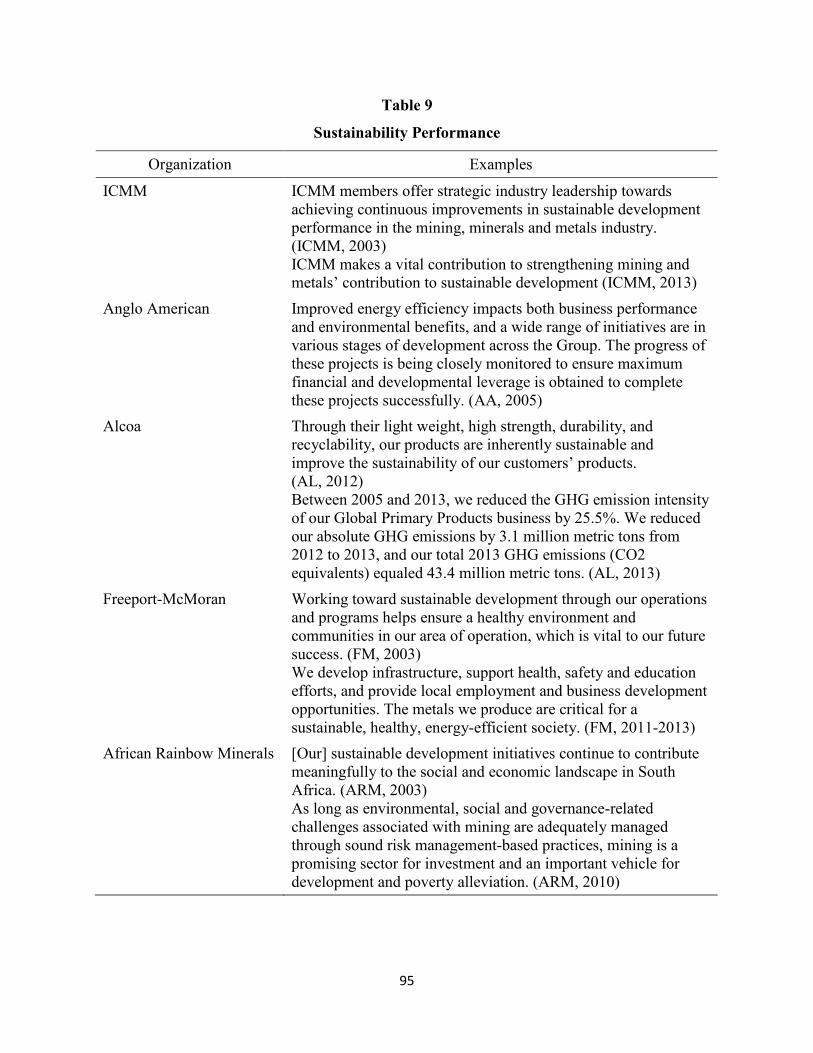
95
Table 9
Sustainability Performance
Organization Examples
ICMM ICMM members offer strategic industry leadership towards achieving continuous improvements in sustainable development performance in the mining, minerals and metals industry. (ICMM, 2003) ICMM makes a vital contribution to strengthening mining and metals’ contribution to sustainable development (ICMM, 2013)
Anglo American Improved energy efficiency impacts both business performance and environmental benefits, and a wide range of initiatives are in various stages of development across the Group. The progress of these projects is being closely monitored to ensure maximum financial and developmental leverage is obtained to complete these projects successfully. (AA, 2005)
Alcoa Through their light weight, high strength, durability, and recyclability, our products are inherently sustainable and improve the sustainability of our customers’ products. (AL, 2012) Between 2005 and 2013, we reduced the GHG emission intensity of our Global Primary Products business by 25.5%. We reduced our absolute GHG emissions by 3.1 million metric tons from 2012 to 2013, and our total 2013 GHG emissions (CO2 equivalents) equaled 43.4 million metric tons. (AL, 2013)
Freeport-McMoran Working toward sustainable development through our operations and programs helps ensure a healthy environment and communities in our area of operation, which is vital to our future success. (FM, 2003) We develop infrastructure, support health, safety and education efforts, and provide local employment and business development opportunities. The metals we produce are critical for a sustainable, healthy, energy-efficient society. (FM, 2011-2013)
African Rainbow Minerals [Our] sustainable development initiatives continue to contribute meaningfully to the social and economic landscape in South Africa. (ARM, 2003) As long as environmental, social and governance-related challenges associated with mining are adequately managed through sound risk management-based practices, mining is a promising sector for investment and an important vehicle for development and poverty alleviation. (ARM, 2010)

96
Table 10
Sustainability Practices
Organization Examples
ICMM ICMM members launched a pilot third party assurance procedure to report on their performance […] Independent assurance is not only critical to the credibility of the Framework, it is also proof that […] ICMM’s member companies are prepared to both stand by these commitments and be openly and independently judged against them. (ICMM, 2006)
Anglo American Besides the potential cost savings of using wind power where grid power is expensive, wind energy reduces the burning of fossil fuels for conventional power generation. The carbon credits that will accrue to sustainable power generation will play an important role in our ability to secure environmental permits for our new mining operations. (AA, 2003)
Alcoa We eliminate waste every day, reducing our costs and capital requirements. (AL, 2003) In 2009, we piloted a “design for sustainability” product strategy for consumer electronics and conducted product pilots for a laptop and a cell phone. We expanded our product pilots in 2010, including significantly increasing furniture’s recyclable material content and reducing its end-of-life landfilling by nearly 75% and weight by 50%. (AL, 2010)
Freeport-McMoran PT Freeport Indonesia was one of the first mining operations in Indonesia to achieve this recognition when we were awarded ISO 14001 certification in December 2001 for our mining and ore processing operations. This significant achievement demonstrates our strong commitment to providing effective environmental management at our operations. (FM, 2004) Our Environmental Policy is based on our objective to be compliant with laws and regulations and to minimize environmental impacts using risk management strategies based on valid data and sound science. It requires that we […] conduct the design, development, operation and closure of each facility in a manner that optimizes the economic use of resources while reducing adverse environmental effects. (FM, 2011)
African Rainbow Minerals A number of short-term measures have been put in place at an operational level to deal with reduced energy consumption constraints […] such as: Replacing incandescent lights with fluorescent lights, and the distribution of low-energy bulbs; Improved control of geysers; Introducing new ventilation start-up procedures and reviewing ventilation requirements; Optimisation of compressed air usage […]. (ARM, 2008)

97
Cross-Organizational Comparison: The Adoption of the GRI Guidelines
In this section, we describe when and how each of the studied organizations adopted the
GRI guidelines, updates, and related practices (e.g. GRI application level assurance) with a view
to infer influence from certain ICMM members on others’ schemas and actions. Although our
review of organizational schemas indicates that many sustainability-related actions follow a
similar pattern of adoption as that of the GRI guidelines, we present the latter to illustrate
characteristics of adoption shared across sustainability-related actions. We start with individual
chronologies of adoption of GRI guidelines, summarized in Table 11, followed by a comparison
of GRI adoption timelines in the studied companies.
Chronologies of adoption. The GRI released the 2002 Sustainability Reporting Guidelines
(G2) in an effort to enhance the quality and rigour of its first set of guidelines (G1) tested in 1999
and published in 2000. As early as 2003, the ICMM signed an agreement with the GRI to work on
a Mining and Metals sector supplement to the G2, completed in 2004 and published in 2007. The
ICMM also participated in the development of the 2006 GRI G3 and 2013 GRI G4 guidelines,
along with a large and diverse group of companies, unions, non-governmental organizations, and
research institutions. In 2005, the ICMM formally committed its corporate members to report in
accordance with the GRI guidelines and tested a procedure for independent third-party assurance
of sustainability reports in 2006. The assurance procedure was approved in 2008, formally
committing ICMM corporate members to independent external assurance as regards ICMM
sustainability principles and the GRI (G3) guidelines.
AA issued its first report in accordance with GRI (G1) guidelines in 2001. AA’s reports
complied with G2 from 2003 to 2006, and with G3 from 2007 to 2013, when AA transitioned to
the G4. AA participated in the review of the G3 in 2005, started reporting the highest level of
application of GRI guidelines (i.e. A+) immediately after it adopted the G3 in 2007, and
maintained that level consistently until 2013. In 2003, AA was the first among the studied
companies to provide independent third-party assurance of its sustainability reports, and of its GRI
application levels in 2007, entrusting these tasks to two of the big four accounting and assurance
firms, KPMG and PricewaterhouseCoopers. Finally, AA was one of the first two companies to
make a GRI compliance table (called a GRI index) publicly available every year to demonstrate
their reports’ conformity with GRI guidelines.
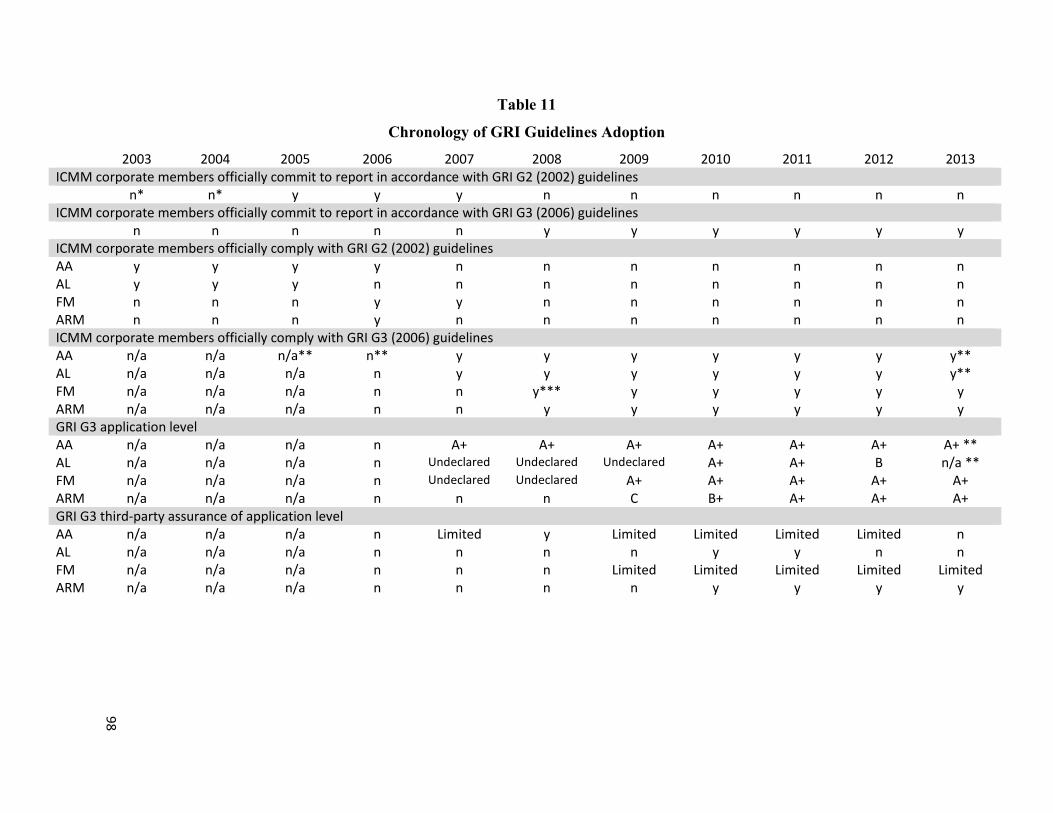
Table 11
Chronology of GRI Guidelines Adoption
2003 2004 2005 2006 2007 2008 2009 2010 2011 2012 2013 ICMM corporate members officially commit to report in accordance with GRI G2 (2002) guidelines n* n* y y y n n n n n n ICMM corporate members officially commit to report in accordance with GRI G3 (2006) guidelines n n n n n y y y y y y ICMM corporate members officially comply with GRI G2 (2002) guidelines AA y y y y n n n n n n n AL y y y n n n n n n n n FM n n n y y n n n n n n ARM n n n y n n n n n n n ICMM corporate members officially comply with GRI G3 (2006) guidelines AA n/a n/a n/a** n** y y y y y y y** AL n/a n/a n/a n y y y y y y y** FM n/a n/a n/a n n y*** y y y y y ARM n/a n/a n/a n n y y y y y y GRI G3 application level AA n/a n/a n/a n A+ A+ A+ A+ A+ A+ A+ ** AL n/a n/a n/a n Undeclared Undeclared Undeclared A+ A+ B n/a ** FM n/a n/a n/a n Undeclared Undeclared A+ A+ A+ A+ A+
ARM n/a n/a n/a n n n C B+ A+ A+ A+ GRI G3 third-party assurance of application level AA n/a n/a n/a n Limited y Limited Limited Limited Limited n AL n/a n/a n/a n n n n y y n n FM n/a n/a n/a n n n Limited Limited Limited Limited Limited ARM n/a n/a n/a n n n n y y y y
98
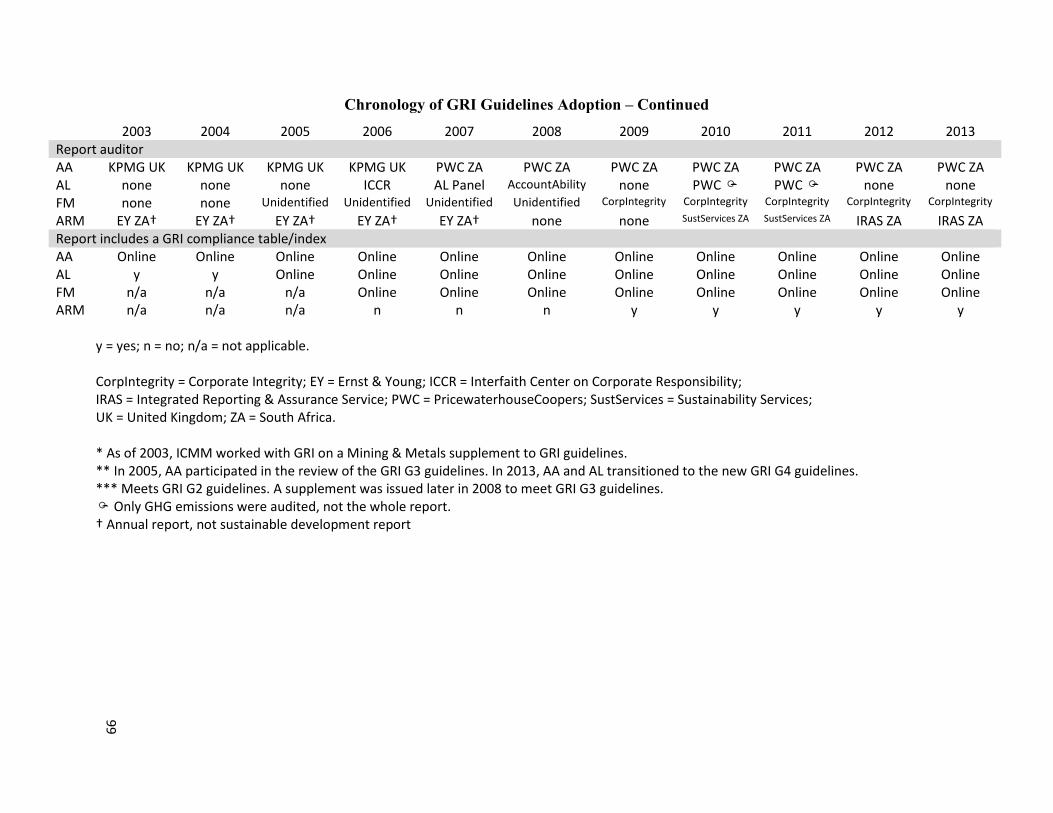
Chronology of GRI Guidelines Adoption – Continued
2003 2004 2005 2006 2007 2008 2009 2010 2011 2012 2013 Report auditor AA KPMG UK KPMG UK KPMG UK KPMG UK PWC ZA PWC ZA PWC ZA PWC ZA PWC ZA PWC ZA PWC ZA AL none none none ICCR AL Panel AccountAbility none PWC PWC none none FM none none Unidentified Unidentified Unidentified Unidentified CorpIntegrity CorpIntegrity CorpIntegrity CorpIntegrity CorpIntegrity
ARM EY ZA† EY ZA† EY ZA† EY ZA† EY ZA† none none SustServices ZA SustServices ZA IRAS ZA IRAS ZA Report includes a GRI compliance table/index AA Online Online Online Online Online Online Online Online Online Online Online AL y y Online Online Online Online Online Online Online Online Online FM n/a n/a n/a Online Online Online Online Online Online Online Online ARM n/a n/a n/a n n n y y y y y
y = yes; n = no; n/a = not applicable. CorpIntegrity = Corporate Integrity; EY = Ernst & Young; ICCR = Interfaith Center on Corporate Responsibility; IRAS = Integrated Reporting & Assurance Service; PWC = PricewaterhouseCoopers; SustServices = Sustainability Services; UK = United Kingdom; ZA = South Africa. * As of 2003, ICMM worked with GRI on a Mining & Metals supplement to GRI guidelines. ** In 2005, AA participated in the review of the GRI G3 guidelines. In 2013, AA and AL transitioned to the new GRI G4 guidelines. *** Meets GRI G2 guidelines. A supplement was issued later in 2008 to meet GRI G3 guidelines. Only GHG emissions were audited, not the whole report. † Annual report, not sustainable development report
99

100
AL published its first GRI-compliant report in 2003 and adhered to G2 from 2003 to 2005.
After not complying in 2006, reports aligned with G3 from 2007 to 2012, and with G4 in 2013.
AL left the ICMM in 2007 and was thus not constrained by ICMM membership requirements to
report in accordance with the GRI guidelines from 2007 to 2013. Perhaps reflecting its voluntary
compliance, AL did not state its G3 application level from 2007 to 2009, declared an A+-level in
2010 and 2011, a B-level in 2012, and in 2013, converted fully to G4 which has different
application levels. Further, AL only had its G3 application level assured by an independent firm
in 2010 and 2011. AL provided a GRI index within its sustainability report in 2003 and 2004, then
online from 2005 to 2013. Although AL had its reports audited twice over the studied period, it
experimented with various types of report feedback, never settling on one. AL solicited
shareholder comments from the Interfaith Center on Corporate Responsibility (an association of
faith-based institutional investors) in 2006, recommendations from a pilot sustainability report
review panel (seen then as an initial step toward third-party assurance) in 2007, an independent
commentary on reporting by the consulting and standards firm AccountAbility in 2008, and limited
assurance on greenhouse gas emissions by PricewaterhouseCoopers in 2010-2011.
FM released its first GRI report in 2006, three years after AA and AL. FM’s reports aligned
with the G2 in 2006 and 2007, with G2 then G3 in 2008, and with G3 from 2009 to 2013. FM did
not declare its level of application of the G3 guidelines in 2008, but reported the highest level (i.e.
A+) as of 2009. From 2009 to 2013, FM had its application level assured by an independent firm,
Corporate Integrity, which also audited FM’s sustainability reports. FM started publishing a GRI
index as of 2006.
ARM’s reports first complied with G2 in 2006, and after a GRI-free year in 2007, with G3
from 2008 to 2013. ARM thus started experimenting with GRI guidelines before becoming an
ICMM member in 2009, perhaps as a result of its business relations with AA South Africa (see
below). As of 2009, ARM declared its G3 application levels, starting with “C” in 2009, “B+” in
2010, and “A+” from 2011 to 2013. ARM obtained independent assurance for its GRI application
level and sustainability reports from 2010 to 2013 and included GRI indices in its sustainability
reports from 2009 to 2013.
Cross-organizational comparison. The chronology of GRI adoption indicates that AA
pioneered the application of GRI guidelines while the other studied organizations followed. In the
first stage of analysis, we have determined that AA is the largest company in our sample with

101
revenues of $24.9bn in 2003. AL, a close second in revenues/size ($21.09bn in 2003) adopted GRI
reporting two years later. Smaller companies, FM ($2.21bn in 2003) and ARM ($0.63bn in 2003
and not an ICMM member until 2009) started releasing GRI reports four years after AA. Larger
firms adopted GRI guidelines earlier, perhaps enabled by slacker resources than their smaller
counterparts.
In 2003, two years after its inception and the same year as its first annual review, ICMM
signed an agreement with the GRI to work on a mining and metals supplement to the G2 guidelines.
The chronology of adoption further suggests that the smaller ICMM member and ICMM outsider
either did not know about G2, or did not consider its implementation a priority at the time. This
shows, first, that some ICMM founders were promoting the adaptation of GRI reporting standards
to the mining industry when other mining companies had not started implementing GRI guidelines;
and second, that GRI proponents had enough influence to have the trade association engage in
discussions with the GRI in the name of all 42 members (15 firms and 27 national and commodity
associations) shortly after ICMM’s inception. Further, GRI proponents were able to make GRI G2
compliance and external assurance formal requirements for ICMM’s corporate members,
respectively as of 2006 and 2008. FM adopted GRI reporting one year after the 2006 milestone.
So did ARM without obligation, but possibly as a result of its multiple ties to AA. AA South Africa
was a shareholder of the company whose restructuration created ARM in 2004. As well, up to four
former AA employees were on ARM’s board of directors between 2004 and 2013, including the
CEO, André Wilkens. Finally, ARM maintained business relationships with AA over the studied
period, particularly two joint ventures in platinum mining.
Before the ICMM committed its corporate members to report in accordance with the new
G3 guidelines in 2008, AA reviewed the G3 for two years and implemented the G3 for one year
at the highest application level, assured by an independent firm. As noted, AA maintained G3
reporting, A+ application level, and independent report assurance until 2013. In contrast, AL did
not participate in the review of the G3, and although it started complying with G3 the same year
as AA, it declared an application level only four years later and provided application level
assurance only in 2010 and 2011. Further, AL did not maintain the highest application level; it
went from A+ in 2010-2011 to B in 2012. FM started reporting along the G3 one year after AA
and AL, in 2008. That year, FM released a G2-compliant report and a G3-compliant report later
on with no application level. FM first declared an application level in 2009, two years after AA
102
and one year before AL. From 2009 on, FM declared an A+ application level and provided
independent assurance, surpassing AL’s efforts in the later years. ARM, though not an ICMM
member yet, started reporting according to the G3 the same year as FM, and did not declare an
application level right away. In 2009, ARM declared a beginner’s application level, “C”, without
independent assurance. In 2010, ARM reported an intermediate application level, “B+”, with
independent assurance. From 2011 to 2013, ARM filed an advanced application level of “A+”
with independent assurance, thus surpassing AL’s reporting transparency in 2012. Corporate
publication of GRI indices followed a similar adoption pattern, with AA and AL starting in 2003,
FM following in 2006, and ARM in 2009. Remarkably, ARM made the extra effort to present GRI
indices within the report in contrast with the other firms which provided GRI indices online.
In sum, we find that larger firms in our sample adopted GRI guidelines, their updates, and
related practices earlier than their smaller counterparts. One firm in particular, AA, acted
proactively by monitoring upcoming guidelines, participating in their review, being the first to
publish a GRI index along with its reports, the first to declare a GRI application level and to have
it assured, and the first to have its sustainability reports audited. This level of engagement with
GRI guidelines distinguishes AA, still an ICMM member to this day, from AL, which left the
ICMM in 2009. Our review of other practices such as formal compliance with ICMM sustainability
principles, international stakeholder engagement, dissemination of best sustainability practices,
and implementation of mining site closure policies suggests that their adoption followed a similar
pattern. Larger firms adopted these sustainability practices first, but only one firm anticipated
future trends, influencing and experimenting with new practices before others -including the
industry association itself- formally adopted them. The other large firm implemented sustainability
practices early but inconsistently, occasionally letting smaller companies exceed its sustainability
reporting performance. Smaller firms were later adopters, but while FM quietly followed in AA’s
tracks, ARM became a model complier quickly after joining ICMM.
The Evolution of Organizational Schemas
In this section, we describe the findings of our analysis of change in the schemas of ICMM
and the studied corporate members over time. We identified two basic processes of schema
evolution -growth and reduction- which form the building blocks of schema change patterns and
schema evolution more broadly. We also found that change does not equally affect all schema
content. Concepts and relationships which do not disturb existing values often arise and disappear,
103
whereas concepts and relationships which define existing values persist. We call the former
peripheral content, and the latter core content, and depict both in Figure 3.
While we inquired into new schema change patterns and pattern sequences, our data rather
exemplified known schema change patterns: common occurrences of bookkeeping (incremental
change), infrequent episodes of subtyping (isolation of new ideas), and no instance of replacement
(disappearance of an old schema and emergence of a new one) or relocation (coexistence then
switch from an old to a new schema). Our data revealed two basic change processes –growth and
reduction– that characterize all schema evolution. Growth adds new concepts and relationships to
existing schemas, whereas reduction subtracts concepts and relationships. Although growth and
reduction occurred repeatedly, growth predominated, consistent with the finding from the first
stage of analysis that schemas expand over time. Further, schema growth chiefly followed the
values that we exposed in our second set of findings: sustainability strategies enhance credibility
and advance strategic goal attainment. Thus, corporate expertise about sustainability deepened as
disclosed schemas grew, but new knowledge obeyed persistent values as it connected to extant
one. Concepts and relationships changed although broader meaning conformed to relatively
invariant values. In this sense, evolving schemas became different yet the same.
As we looked at the continual operation of growth and reduction, the overall homogeneity
in the studied schemas at first baffled us. How could blind addition and subtraction of content
assemble such a coherent whole? Looking closer, we found that growth and reduction followed
certain rules. When a given concept and connecting relationships could not directly impact the
ultimate values of credibility enhancement and strategic goal attainment, they would go through
many additions and subtractions. We termed these concepts and relationships peripheral content.
For example, content related to carbon emissions and climate change (CC) went through numerous
changes in FM’s disclosed schemas. Initial considerations in 2006 focused on energy conservation.
Quickly, concerns emerged regarding carbon regulations and the potential increase of energy and
compliance costs. FM’s schema on CC thickened with the addition of concepts like greenhouse
gases (GHG), and direct and indirect GHG emissions. In 2009, FM first linked CC and water
management, stating: “Cyclical weather changes and competing uses may, however, affect water
availability and we are evaluating ways to use water more efficiently and develop contingency
plans to ensure uninterrupted operations” (FM, 2009). After 2010 though, FM cancelled two out
of three GHG emissions reduction initiatives and essentially muted the topic of CC. The potential

104
impacts of CC in water-stressed regions came back to FM’s disclosed schemas in 2013. In this
example, we observe that FM’s schema about CC underwent various additions -energy
conservation, carbon tax mitigation, water management- and subtractions –no emphasis on energy
and carbon tax in later years. These additions and subtractions however left strategic goals intact;
change in peripheral content preserved underlying schema values.
In contrast, when a concept and connecting relationships could directly affect the ultimate
values of credibility enhancement and strategic goal attainment, they would go through additions
but few or no subtractions. We termed these concepts and relationships core content. For example,
content related to trust and respect grew steadily within ICMM’s disclosed schemas. The idea that
trust and respect condition access to land, capital, and markets popped up from the start. So did
the notion that the mining industry needs to prove and improve its contribution to sustainable
development in order to build trust and respect (2003-04). Both assumptions persisted and gathered
ancillary content over time: collective action (2003), transparency and accountability (2004),
dialogue with stakeholders, independent insurance, credibility, reputation (2006), responsible
voice for the industry (2007), wide recognition of contribution to sustainable development (2008),
being held in high regard, evidence of recognition, being increasingly known, engagement with
civil society, respect across core stakeholder groups (2009), ICMM effectiveness, collaboration
with stakeholders, open and honest exchange of ideas, strong relationships, pride and integrity
(2010), a credible and constructive voice (2011), distrust, trust deficit, conflict, the trust challenge,
shared goals, trust is a long-term investment, compliance with laws and regulations, beyond legal
obligations, community trust, increasing social awareness of consumers (2012), mutual benefit,
joint stakeholder research programs at the country and community levels (2013). In this example,
we observe that ICMM’s schema about trust persisted and grew with the addition of new concepts
and relationships and no subtractions over the studied period. Further, the conceptual relationship
between trust and strategic goals was regularly reaffirmed, so that successive additions to the
concept of trust energized strategic goals. Change in core content mainly took the form of additions
and preserved underlying schema values.

105
Figure 3
Core and Peripheral Schema Content
DISCUSSION AND CONCLUSION
We have used the theoretical lens of schemas to study the evolution of strategic thought on
sustainability at the International Council for Mining and Metals and four member companies
between 2003 and 2013. Pushed by Anglo American and possibly others not examined in this
study, the ICMM has taken steps to boost the environmental and social performance of the
industry, and consequently its credibility, the key factor to maintain industry viability. Specific
steps included the formal requirement for corporate members to embrace ICMM’s sustainability
principles, report sustainability performance along GRI guidelines, publish GRI application levels,
and have GRI application levels and sustainability reports independently assured. Despite some
variation in individual strategies, our findings expose that the organizations in our sample shared
a stable, instrumental conceptualization of sustainability (Aguilera et al., 2007; Gao & Bansal,
2013) over the studied period. Partial data also shows that ICMM members in our sample reduced
environmental impact per dollar of revenue, and in some cases, net environmental impact. As per
their own admission though, net environmental impact reduction should not be expected in the
long term since all companies pursue proactive growth strategies. Subsequently, ICMM has
Strategic objectives Credibility
Stakeholder management
Leadership
Sustainability practices
Commitment
Sustainability performance
Peripheral content Core content
More content additions and subtractions More stability and content additions

106
lamented a lack of systematic evidence supporting progress in industry-level sustainability
performance.
Our first research question asked: How do corporate schemas evolve over time? Our
findings suggest that, fundamentally, schemas evolve through two mechanisms: growth, the
addition of new concepts and relationships, and reduction, the subtraction of concepts and
relationships from existing schemas. These two mechanisms spark the most basic changes in
schemas and can therefore portray all schema change including more elaborate patterns. For
example, drawing on the notions of peripheral and core schema content, we might describe
bookkeeping (Balogun & Johnson, 2004; Rothbart, 1981) as the incremental addition and
subtraction of peripheral content; subtyping (Balogun & Johnson, 2004; Weber & Crocker, 1983)
as the substantial addition of core content; replacement (Albert, 1992; Labianca et al., 2000) as the
incremental reduction of core content followed by the incremental addition of new core content;
and, relocation (Albert, 1992; Labianca et al., 2000) as the substantial addition of new core content
followed by the substantial subtraction of existing core content. These distinctions matter for two
main reasons. First, explanations of change processes in organizations are too often made of
discrete phases connected in a linear sequence and tend to oversimplify the change process and its
components (Stevenson & Greenberg, 1998; Van De Ven & Poole, 1995). In contrast, although
growth and reduction depict schema change in its simplest manifestations, they highlight the
characteristics of change, specifically, the “what” (i.e. core and peripheral content) the “how” (i.e.
incremental and substantial change), and the “when” (i.e. different sequences of growth and
reduction lead to distinct schema change patterns). Practically, much research conceptualizes
schema change as a state followed by a different one. By shedding light on growth and reduction,
this paper makes clear that, for one state to follow another, existing schema content must shrink
until it disappears and new schema content must appear and grow, not necessarily in that order.
Second, there is a significant difference between patterns of schema change and mechanisms of
schema change. Patterns of schema change can only be identified ex-post, because the sequence
of a given pattern needs to unfold before we can recognize it. Growth and reduction combined
with the notions of core and peripheral content offer the possibility of an ongoing, fine-grained
analysis and description of schema change patterns through the basic mechanisms of addition and
subtraction. For example, the description of schema change patterns above suggests that the
subtraction of core content is a key distinction between first- and second-order schema change.

107
Future research can leverage this distinction to facilitate the identification of replacement and
relocation which are rarely observed in organizational settings. Also, by allowing a clear
description of existing schema change patterns, growth and reduction also facilitate the
identification of new schema change patterns in future research.
Further explaining how schemas evolve, our findings reveal that schemas tend to grow over
time. Growth and reduction occurred frequently in the studied schemas, but growth predominated
and schemas expanded while the companies in our sample, with the exception of Alcoa, disclosed
more intricate thinking about sustainability. This is consistent with the theorization that individual
expert schemas encompass more “attributes and interrelationships” and “are more complex than
the novice’s schemas” (Dane, 2010: 582). Our findings indicate that organizational schemas
evolve similarly: schemas tend to grow as corporate expertise on sustainability deepens. We do
not affirm that organizational schemas never shrink, but rather that reduction occurs less often.
The predominance of schema growth corroborates that organizational members strive not to revise
extant schemas (Garfinkel, 1967; Weick, 1995). As noted, we found that some concepts,
relationships, and values are central to the schemas under study and underpin the entire schema
about sustainability. They depict sustainability strategies in the service of higher strategic goals.
We called them core content. Change in core content is prone to cascade through the entire schema,
significantly changing the way in which organizations strategically ponder sustainability. We
exposed that core content remained stable across companies and over time, and underwent
additions but virtually no subtraction. In contrast, some concepts, relationships, and values are on
the fringe of schemas. They depict sustainability considerations with little impact on higher
strategic goals. We designated them as peripheral content. Change in peripheral content appears
to disrupt nearby concepts and relationships, not the whole schema, so that organizations’ look at
sustainability remains the same. We uncovered that peripheral content fluctuated across companies
and over time, and went through a number of additions and subtractions. By showing that core
content is more stable than peripheral content, and growth prevails over reduction, we support
prior theorization that organizations prefer not to amend extant schemas when they can and
therefore favor first-order schema change over the more disruptive second-order schema change
(Pain, 2015).
In sum, the phrase “schema change” may mislead because it obfuscates change
mechanisms that add to and subtract from existing content, leading to new one. At the simplest
108
level, schema change manifests in content addition and subtraction, simple mechanisms that can
help future research on documented and perhaps new schema change patterns. As well, not all
schema content equally undergoes change. Core content tends to persist and grow over time, which
explains how schemas become different yet the same. Peripheral content grows and reduces often,
but does not challenge core values. Finally, in the long run, it is less accurate to talk about schema
change than about schema growth.
Our second research question inquired: How do powerful schema sponsors influence
others’ schemas? As discussed, although the companies in our sample all belong to the mining
industry, they operate very different businesses in terms of technology, products, scope and
geography. It is therefore remarkable that they have been sharing similar and stable strategic goals
as regards sustainability over a relatively long period of time. We found that larger companies can
influence others’ schemas by acting as role models and by espousing more advanced sustainability
policies early, as illustrated by the adoption of the GRI guidelines. One large firm, Anglo American
(AA), monitored the development of these new standards to keep abreast of their meaning and
implications. AA also participated in the development of new GRI standards, likely to assess how
they might constrain the company’s strategic objectives, and possibly to shape forthcoming
guidelines. Presumably, AA also promoted the formal adoption of new sustainability standards
within ICMM, eventually impacting a large part of the industry. After studying the emergence of
the insurance industry’s shared schema about computers (Bingham & Kahl, 2013), Kahl (2017)
suggests that trade associations both enable market discourse and influence market cognition. He
argues that trade associations can play a key role in the production of market discourse by serving
as the social arenas that enable members to discuss certain topics (Kahl, 2017: 2). As such, trade
associations have considerable influence on market discourse and cognitions because they
represent broader groups than individual corporate communications. Simultaneously, trade
associations can shape market cognitions by partially controlling which voices are heard, what
content gets discussed, and by offering an authoritative voice within the discourse (Kahl, 2017).
Here, we submit that large companies leverage trade associations as vectors to disseminate their
own schemas and influence substantial parts of an industry. This resonates with research that has
shown trade association founders –typically some of the largest industry members- to demonstrate
effective political acumen in the creation and growth of private regulatory trade associations
similar to ICMM (Marques, 2016).

109
We conclude this paper with practical implications for ICMM and its members. Most of
the studied firms diminished their environmental impact to revenue ratio over the studied period.
From a business sustainability perspective, ICMM and its members have successfully mustered
enough credibility to maintain the social licence to operate. From an environmental sustainability
point of view, efficiency gains did not translate into environmental impact reduction, admittedly
not a goal of ICMM members. There are however a few reasons why the ICMM and its members
might want to consider environmental impact reduction as a strategic objective in the future. In
2004, the ICMM adopted the definition of sustainable development from the United Nations’
Brundtland report (World Commission on Environment and Development, 1987). Twelve years
later, the ICMM’s mission is still to strengthen the social and environmental performance of the
mining industry and the trade association is officially committed to contributing to the United
Nations’ Sustainable Development Goals for 2030 (International Council for Mining and Metals,
2016; United Nations General Assembly, 2015). Further, the ICMM’s mission remains to build
recognition of the industry’s contributions to local communities and society at large. To maintain
credibility with stakeholders, the ICMM recognizes the need to demonstrate systematic evidence
of progress in environmental performance, which ultimately manifests in environmental impact
reduction. Ascribing causal importance to strategic cognitions in the explanation of strategy
(Narayanan et al., 2011) and performance (Thomas et al., 1993), we submit that ICMM members
can hardly boost environmental performance following the same schema that produced few
tangible results from 2003 to 2013. Rather, environmental performance needs to partake in
strategic objectives, disrupting the core schema content which the ICMM and its members have
been cultivating, growing, and preserving since they first collaborated.

110
GENERAL DISCUSSION
Contributions
Schemas. The first article theorizes that managers and organizations tend to adhere to
existing schemas and resist cognitive change because they avoid the experience of schema
discrepancy. This mechanism explains why firms favor instrumental schemas (traditional, profit-
oriented) and repel integrative schemas (economically, socially, and environmentally balanced):
instrumental schemas are the established, prevalent way to think about sustainability in a business
context. Some schema sponsors however have a voice that allows them to weigh in on
sustainability issues. Powerful schema sponsors perpetuate or challenge existing schemas by
promoting schemas that resonate with perceived organizational reality and/or by curving perceived
organizational reality through modifications in organizational arrangements that validate
sponsored schemas. The second thesis article finds that while firms that collect copious data about
the natural environment develop more complex schemas about environmental issues, they do not
translate complex schemas into corresponding environmental response. Further, the more firms
respond to environmental issues, the more they deteriorate the natural environment. After
examining alternative explanations, the study concludes that environmental response is
inappropriate, consistent with the finding that corporate response disregards corporate schemas
about environmental issues, although other factors such as conflicting corporate priorities or lack
of resources might also explain these results. Finally, the last thesis paper reports that sampled
firms have been sharing similar instrumental schemas centered on invariant underlying values over
a long period of time. Two types of schema content emerged. Core content, which defines
underlying corporate values, endures, whereas peripheral content, innocuous to corporate values,
varies. Thus, although studied firms developed elaborate schemas over time, new sustainability
knowledge obeyed stable underlying corporate values and supported established meanings.
Combining these propositions and findings, further insights emerge.
The third paper illustrates the first paper’s notion of discrepancy avoidance by highlighting
the existence of underlying corporate values that exhibit inertia and significantly affect the
development of new knowledge. Schemas become different yet the same to the extent that new
schema content adds to previous content while underlying values and meanings persist and guide
the interpretation of new knowledge. In the same line of thought, the second paper shows that
firms sometimes ignore accumulated topical knowledge. Although the second paper does not offer
111
an explanation other than the complexity within interpretation-performance relationships (Daft &
Weick, 1984; Thomas et al., 1993), the third paper suggests that firms disregard acquired
knowledge when new knowledge undermines underlying corporate values. This indicates how
important it is for research to distinguish between schema components: concepts, relationships,
and values (Bartunek, 1993). As new concepts and relationships are added to schema content, the
cognitive map changes, yet the underlying values may not. It is therefore crucial to account for the
map as well as for the associated values in studies on schemas. Concepts and relationships provide
the map; values supply built-in directions.
The third article also illustrates how schema sponsors build on different power bases
(coercive, reward, referent, expert, and legitimate power) to influence others’ schemas, as
theorized in the first article. Although the sampled companies operate very different businesses,
they share similar sustainability goals. Larger companies influence others’ schemas by acting as
exemplars and adopting progressive sustainability measures early (referent power). One firm
scrutinized and partook in the advancement of forthcoming sustainability reporting standards
(expert power) to both shape them and foresee their ramifications. Of direct relevance to the
conceptualization of power in the first paper is the formal adoption of new sustainability standards
within the studied trade association. By achieving change in the trade association’s organizational
arrangements (legitimate power), proponents of GRI reporting impacted numerous industry
players’ business reality and thus promoted their own ideas on corporate transparency.
Organizational Cognitions. There has long been a debate as to whether organizations are
capable of cognition – mental processes of awareness, perception, reasoning, and judgment related
to knowledge acquisition (Maciejovsky, Schwarzenberger, & Kirchler, 2012). Some researchers
struggle with the notion that one can treat organizations as living systems whose characteristics
may differ from those of people inside (Hedberg, 1981). Yet, organizations possess their own
cognitive systems: “Members come and go, and leadership changes, but organization’s memories
preserve certain behaviors, mental maps, norms, and values over time.” (Hedberg, 1981: 6). One
contribution of this thesis is to follow this view and consider organizations as open social systems
that process information from their environment (Daft & Weick, 1984), while at the same time
acknowledging that group and organizational information processing differ, and integrating group
interpretation as a component of organizational interpretation. This thesis therefore contributes to
the development of organizational cognition research by making a step toward a multilevel
112
conceptualization of corporate schemas. One distinctive feature of organizational schemas in the
present work resides in the imperfect and incomplete sharing across organizational groups, which
highlights the existence of diverging schemas within one organization. One organization can
therefore simultaneously harbor different schemas and types of knowledge among various groups.
Recognizing schema diversity beyond the conventional focus on managerial schemas, this thesis
explains why convergence occurs and how divergence is resolved.
Another key recognition in the literature on organizations as interpretation systems is that:
“organizations influence their members’ learning, and they retain the sediments of
past learning after the original learners have left. Organizations can be thought of
as stages where repertoires of plays are performed by individual actors. The actors
act, but they are directed. They are assigned roles, they are given scripts, and they
become socialized into a theatre’s norms, beliefs, and behaviors. Although the
repertoires of plays shift, especially with the arrivals of new leaders, directors, or
schools, there are rich traditions of plays and standards that remain as time
passes.” (Hedberg, 1981: 6)
The present work clarifies processes through which existing schemas enable and constrain
organizational interpretation. First, whereas extant schema change models show patterns of
change, they are not explicitly associated with schema growth and reduction (e.g. Balogun &
Johnson, 2004; Labianca et al., 2000). Rather descriptions of change imply that old content is
discarded as new content comes in. Schema size is ignored. In contrast, growth, by definition,
affects size. Growth suits Dane’s (2010) depiction of individual expertise: schemas widen as they
become more complex. By proposing that growth is the dominant schema change mechanism, this
thesis proposes that old schema content is not replaced, but mostly remains in place, while new
content is added. Second, by identifying fundamental mechanisms of schema change -growth and
reduction- this thesis allows for a non-traditional depiction of schema change patterns. If we accept
growth and reduction as fundamental schema change mechanisms, we may liken bookkeeping to
adding a grain of sand; subtyping to creating an outgrowth; replacement with chipping pieces and
gradually replacing them with grains of sand; and, relocation with creating and outgrowth and
suddenly considering the outgrowth as the new core. In practical terms, not only do extant schemas
shape what firms pay attention to and learn, but new experience tends to overlay extant schemas
rather than to replace them.
113
Corporate Environmentalism. Today’s companies routinely engage in corporate
environmentalism (Whiteman et al., 2013). Yet, whether corporate environmental initiatives
remedy environmental issues remains equivocal. Globally, the pace of environmental degradation
increases (Field et al., 2014). At the firm level, the second article indicates that corporate response
to environmental issues, allegedly a close proxy of corporate environmentalism, magnifies
environmental degradation. Further, the third paper portrays companies that have formally
committed to sustainable development for years and still crave rigorous evidence of improved
environmental performance. In the second paper, an explanation is that firms remain unable to
convert environmental knowledge into appropriate response. The third paper however suggests
that knowledge conversion may be a symptom and not a cause. Rather, it points to re-ordering the
values embedded in corporate schemas.
Re-ordering embedded values implies two different implications depending on whether
corporate actions deliberately stem from maps within corporate schemas. First, claims of corporate
environmentalism “could well be mere exercises in public relations” (Banerjee, 2001: 499).
Decoupling, the loose articulation between corporate structure and operations (Meyer & Rowan,
1977), is indeed a likely explanation for weak corporate environmental performance. However,
our three papers taken together suggest that, to the extent that values are implicit and intermittently
expressed, firms with genuine intention to redress environmental issues may still fail to do so
because implicit values pull them in a different direction. In other words, firms that engage in
corporate environmentalism may obstruct their own efforts when they do not acknowledge
underlying corporate values within their schemas.
Environmental management. Barrow (2005: viii) proposes that environmental
management is the planning and coordination of diverse activities aimed for humans to address
environmental challenges and prosper as a species. In a business context, environmental
management can be defined as the planning and coordination of activities through which firms
address environmental challenges. Environmental management was born in the 1990’s following
landmark publications such as the Brundtland report (World Commission on Environment and
Development, 1987) which conveyed the realization that society, business, and the natural
environment were at a turning point, and spurred an emerging consensus in business that the
environment is a major challenge in need of responses (Roome, 1992). However, there has been
little agreement on strategic options and specific actions for environmental management. Many
114
researchers have questioned the motivations of companies for environmental management,
arguing that they were mostly financial (Boiral, Henri, & Talbot, 2012; Feng & Wang, 2016). This
line of research evidenced, for example, that implementing the ISO 14001 environmental
certification standard tends to be superficial behavior meant to exhibit conformity (Boiral, 2007).
It showed, further, that a minority of managers follow action logics that allow environmental
management to change the values and incorporate the complex demands needed to achieve
environmental sustainability (Boiral et al., 2009).
Although this thesis acknowledges that there exists decoupling (Wijen, 2014) between
corporate environmental discourse and actions, the goal here is not to judge intentions or issue
normative statements. Societal pressures push firms in certain directions but it is ultimately
enterprise strategists who ponder the role their firm will play in society (Schendel & Hofer, 1979).
This thesis rather investigates corporate schemas that shape the thinking of enterprise strategists,
management, and other organizational groups, affecting corporate decisions as regards the natural
environment. In brief, this work acknowledges corporate motives (i.e. values) but focuses on
corporate interpretation. From this perspective, one key contribution to environmental
management concerns the business case for sustainability, assuming there exists corporate
intention to implement substantive (Carlos & Lewis, 2015) environmental management.
In the business case logic, organizational groups who carry integrative schemas often “sell”
environmental issues to other groups using a language, assumptions and norms borrowed from the
dominant instrumental schema (Anderson & Bateman, 2000; Bansal, 2003; Howard-Grenville,
2007b). One of the most successful issue-selling techniques is indeed the enactment of the recipient
group’s schema (Howard-Grenville, 2007a). Accordingly, “framing an environmental issue as a
financial opportunity may be one of the keys to a successful championing episode.” (Anderson &
Bateman, 2000: 564). As noted, these techniques reinforce existing schemas (Howard-Grenville,
2007a; Weick, 1995) by allowing them to assimilate discrepant experience, a mechanism that
characterizes the bookkeeping model. Making the business case for sustainability is a typical
example of dominant schema enactment. By showing that sustainability initiatives can contribute
to profit making, or avoidance of losses, sustainability champions enact an instrumental schema to
promote sustainable behavior. Although this has been shown to generate sustainable behavior in
the short term, it also reinforces the extant schema (Howard-Grenville, 2007a), making it relevant
and applicable to environmental issues, and precluding integrative pro-environmental behavior in
115
the longer term. This thesis therefore recognizes the short-term effects of “business case” strategies
on environmental management, but simultaneously questions their long-term effectiveness.
Greenwashing. Greenwashing is misleadingly positive environmental communication
(Lyon & Montgomery, 2015) which places overly positive emphasis on corporate environmental
achievements in order to influence shareholders, the media or the general public in opinion
(Delmas & Burbano, 2011). There is a large literature on greenwashing and the disconnection
between corporate discourse and actions, especially as regards sustainability reports. Some of this
literature has called sustainability reports “simulacra” based on the observation that corporate
reporting fails to report environmental incidents most of the time (Boiral, 2013: 1036). Such
“organized hypocrisy” may even be required by the contradictory societal and institutional
pressures that firms face (Cho, Laine, Roberts, & Rodrigue, 2015), to the extent that failure to meet
societal expectations threatens the viability of individual firms and possibly industries (Böhling,
Murguía, & Godfrid, 2017). Yet, there are important distinctions between corporate disclosure
biases. First, there is greenwashing, as defined above, the exaggeration of environmental
achievements (Delmas & Burbano, 2011). Second, one might call camouflage the omission of
environmental incidents (Boiral, 2013). Third, researchers have termed “undue modesty” the
omission of environmental achievements to avoid public perception of hypocrisy (Eun-Hee &
Lyon, 2015: 705). The present work does not deal with camouflage but contributes to the scholarly
discussion on greenwashing and undue modesty.
As regards greenwashing, although it is understood that companies inflate environmental
actions in public reports to enhance legitimacy and reputation, this thesis argues that
overstatements are necessarily limited for several reasons. First, while firms may engage in
ceremonial or symbolic environmental management they bear legal liability for the exactness of
environmental reports which various stakeholders feed into financial risk assessment. Second,
assuming that firms greenwash out of concern for public image, firms equally worry about their
public image and market retaliation if greenwashing is revealed. Third, we live times of increased
public and media scrutiny (Bowen & Aragon-Correa, 2014) in which external pressure intensifies
penalties for environmentally harmful action (Flammer, 2013). As a result, firms need to keep
embellishment in environmental reporting credible and therefore limited, a proposition that
contrasts with existing depictions of greenwashing as rampant.

116
As for undue modesty, the second paper’s findings show that firms reduce accounts of
ecological responding in sustainability reports following periods of poor environmental
performance, suggesting an intention to underemphasize corporate environmental initiatives.
Given the strategic nature of environmental reporting (Philippe & Durand, 2011) and firms’
propensity to greenwash (Delmas & Burbano, 2011), firms need a business-related rationale to
underreport environmental achievements. It is advanced here that firms intentionally adopt a low
profile to avoid being judged as hypocritical and risking reputational and market penalties.
Similarly, findings from the third paper evidence what might be extreme cases of corporate
modesty, whereby several environmental reports plainly declare the primacy of corporate
economic goals and the consequent impracticality of environmental impact reduction. Such
reporting behaviors might be attempts to manage stakeholder expectations and/or to break free
from contradictory societal and institutional pressures by exposing them. In contrast with existing
accounts of undue modesty, these examples might illustrate how some firms seek a reputation of
corporate honesty over one of environmental performance.
In sum this thesis observes that sustainability reports are carefully crafted tools for strategic
communication where firms cautiously keep their discourse credible in reaction to increasing
public skepticism toward corporate sustainability claims. Acutely aware of public scrutiny, firms
have mastered the disclosure of environmental achievements, strategically greenwashing and
withholding achievements depending on corporate environmental performance. These
explanations contribute to a stream of research advancing that it can be prejudicial for firms to
greenwash while under public scrutiny (Lyon & Maxwell, 2011), especially following periods of
poor environmental performance (Bowen, 2014; Carlos & Lewis, 2015; Eun-Hee & Lyon, 2015).
Corporations that engage in a balancing act between corporate honesty and environmental
performance constitute an original addition to this literature.
Implications for managers and policy makers
Implications for managers. One key takeaway from this work is that schema evolution in
reaction to changes in the organizational environment affects corporate response to ecological
issues. As a corollary, managers who understand strategic schema evolution are better equipped to
create change toward integrative schemas than those who do not. Adding the notion that successful
organizational change requires schema change (Bartunek & Moch, 1987), it follows that managers
who understand strategic schemas are more susceptible to succeed with strategic change, including
117
toward ecological goals. Understanding strategic schemas, however, is far from trivial, and second
order schema change is very difficult to achieve (Bartunek, 1993). Following a schema
perspective, managers driving their firm on the sustainability path improve the likelihood of
success when they clarify, first, their own beliefs and values (i.e. schemas); second, what change
is required in existing schemas; and, how to make organizational members aware of their own
schemas and thus capable to change them (Bartunek & Moch, 1987).
But the path to sustainability is not always obvious: what schema to pursue often needs
defining (Hahn et al., 2014). Based on the finding that there exists a relationship between
ecological scanning and understanding, managers seeking to determine appropriate sustainability
approaches and goals should be aware that data acquisition helps meaning attribution. In other
terms, organizations and their members who expose themselves to a variety of sustainability
information sources are more likely to develop an understanding of sustainability issues that
permits to formulate appropriate approaches and goals. Further, this thesis has identified groups
with different schemas wielding power within and around organizations. The presence of multiple
schema sponsors suggests that exposure to sustainability information should not be restricted to
management but offered to as many individuals and groups as possible. The sensitization of varied
groups who have a dynamic relationship to power may be a fruitful way to turn a company around.
Managers remain influential schema sponsors and, once a path to sustainability is
determined, they can shape corporate schemas in the long term through modifications in
organizational arrangements, social norms, and language (Ferraro et al., 2005). As noted,
“Language transformation can be a pathway to behavioral transformation” (Weick, 1995: 108–
109). Norms establish adequate behaviors and actions (Howard-Grenville, 2007b). Finally,
organizational arrangements –structures, reward systems, measurement practices, selection
processes- reflect the schemas of their designers and create the conditions that make schemas come
‘true’ over time (Ferraro et al., 2005: 9). However, recent research suggests that, when modifying
organizational arrangements toward green goals, managers should try to mitigate disruption, or at
least to frame disruption as minimal (Dowell & Muthulingam, 2017).
Importantly, mitigating disruption should not imply consonance with existing schemas. As
discussed, managers are under increasing pressure to engage in eco-friendly initiatives (Flammer,
2013) and to adopt a ‘business case’ approach to environmental management which encourages
the pursuit of profitable environmental initiatives (Dowell & Muthulingam, 2017). This thesis
118
contends, however, that the business case approach enacts and reinforces dominant instrumental
schemas (Howard-Grenville, 2007b). As such, although a business case approach can generate
instrumental ecological actions in the short term, it may forestall integrative initiatives and be
counterproductive in the longer term.
Implications for policy makers and society. There is evidence that schemas, or similar
cognitive structures, exist at the industry-level (Bingham & Kahl, 2013; Kahl, 2017) and societal
level (Hoffman, 2015). In organizations, schemas survive long after they have ceased to be useful
(Hedberg, 1981), and sometimes after they have been replaced (Zietsma, Winn, Branzei, &
Vertinsky, 2001). In society, the existence of persistent cognitive structures may explain why some
ignore accumulating environmental evidence and multiplying extreme weather events (Hoffman,
2015). Extrapolating the above discussion on organizational arrangements to societal
arrangements, this thesis suggests that policy makers may effect societal change by instilling
integrative schemas into societal arrangements which have perpetuated instrumental schemas, such
as business education (Ferraro et al., 2005) and business law (Newton, 2002: 530).
As well, past research has shown that regulatory decisions can have a decisive impact in
triggering schema and organizational change: Faced with the prospect of drastic sanctions, firms
engage in efforts to alter existing schemas, structure and actions (Poole et al., 1989). Although
more stringent regulations might trigger schema and organizational change throughout industries,
this thesis indicates that radical regulatory change will trigger strong resistance, cueing policy
makers to ponder trade-offs between change and resistance. Further, following evidence from
studies on environmental certification (Aravind & Christmann, 2011; Christmann & Taylor, 2006),
more stringent enforcement of existing regulations may lead to increased CEP. Because stringent
enforcement involves using coercion, reward, and other power bases, this thesis suggests that
regulatory agencies stay within their legally prescribed and socially-accepted area of authority lest
they lose power and legitimacy (French & Raven, 1959).
On a different note, corporations often act as policy makers, for instance within industry
associations, chambers of commerce, and similar interest groups which practically replace
environmental legislators in several branches of activity (Marques, 2016). Within such contexts,
this thesis illustrates how larger companies can influence others’ schemas by adopting progressive
ecological policies early. Strategies revealed here involve monitoring the development of new
standards and participating in the development of new standards, allowing participating firms to

119
assess and shape upcoming opportunities and constraints. Large companies may also promote the
formal adoption of new standards within trade associations with the prospect of impacting a large
part of the industry. Research has proposed that trade associations have considerable influence on
industry-level discourse and cognitions because they represent large groups as opposed to
individual firms (Kahl, 2017): trade associations can shape market cognitions by selecting which
voices are allowed to communicate and what content is debated. This thesis submits that large
companies leverage trade associations as vectors to disseminate selected schemas and influence
which ecological standards an industry follows.
Limitations
Some scholars criticize the use of sustainability reports to capture corporate level
cognitions, specifically the assumption that disclosed and corporate schemas reasonably overlap
so that disclosed schemas represent corporate schemas and actions to a certain extent (Narayanan
& Fahey, 1990). This comment is rooted in the literature on greenwashing and the disconnection
between corporate discourse and actions, notably in sustainability reports (e.g. Boiral, 2013; Cho
et al., 2015). As discussed above, this work acknowledges and contributes to the literature on
greenwashing. Further, it recognizes that schema complexity prevents full disclosure.
Consequently, firms only communicate what they are willing and able to disclose. At the same
time, firms must keep distortions limited for legal, reputational, and market reasons. In the current
social context characterized by intense public scrutiny, sustainability reports provide a reasonable,
admittedly imperfect, reflection of corporate schemas and actions. Some authors also comment
that many companies mandate public relations agencies to prepare sustainability reports, and
question the corporate ownership of reports. Many reports used in this thesis openly display the
names and contact information of such communication agencies. However, the plural involvement
of management, sustainability departments, and public relations companies in sustainability
reports brings forth, not the ideas of select persons, but shared, corporate considerations.
Collaborative involvement in the preparation of sustainability reports contributes to the collective,
corporate nature of their contents, and constitutes an asset within the framework of this thesis,
which attempts to capture a corporate-level construct.
The second paper has created, validated, and employed three dictionaries of ecological
terms. While rigorously developed, these dictionaries need further validation through tests with
various samples to demonstrate external validity. Practically, various types of corporate

120
communications can demonstrate the generalizability of findings across settings: annual reports,
10-K forms, etc. As well, to show the dictionaries’ capacity to predict distinct but theoretically
linked concepts (i.e. nomological validity), further testing will be needed. Corporate
environmentalism (Van Marrewijk & Werre, 2003) and environmental orientation (Banerjee,
2001), may prove useful to this end.
Finally, the measure of CEP in the second paper partially comes from self-reported
corporate data and may be subject to social desirability bias. For reasons already explained above,
information distortion in sustainability reports is likely limited. In addition, Trucost -the company
which provides our measure of CEP- uses proven economic modeling techniques sanctioned by
independent experts to estimate unavailable data, thus mitigating potential biases from self-
reporting. Indeed, Trucost’s environmental impact is deemed one of “the most significant
measures of environmental performance” in the literature (Delmas et al., 2013: 259). It offers good
credibility and practicality.
Future research directions
Sustainability and environmental performance. Researchers have explored the “business
case for sustainability”, through which green initiatives enhance economic performance (Bondy et
al., 2012) and the “social license to operate”, in which green initiatives serve to obtain social
legitimacy from stakeholders (Aguilera et al., 2007). Both these perspectives are instrumental in
that green initiatives are instruments to achieve economic and sociological goals, profit and
legitimacy. So far, these perspectives have produced limited results in terms of corporate
environmental performance. Meanwhile, global ecological indicators deteriorate and point to
alternative perspectives. The continued development of people, planet and business requires a shift
from the business case for sustainability to the sustainability case for business. In a way, this shift
is already happening locally and regionally as air pollution forces the temporary closure of industry
clusters in North Eastern China (Reuters, 2016), or when extreme drought causes farm closures
and city evacuations in the Australian Queensland (Neubauer, 2014). Alternative perspectives are
needed, but few management papers research such approaches (for exceptions, see Whiteman &
Cooper, 2011; Whiteman et al., 2013). This thesis calls for management research to explore
alternative integrative perspectives that deliberately step away from instrumental views.
Contrary to extant research (Daft & Weick, 1984; Thomas et al., 1993) and a fundamental
assumption in strategy research and Western rationalist thinking, results indicate that corporate
121
ecological understanding does not translate into proportionate action. Results also suggest that
firms engage in inappropriate responses that worsen environmental performance. This
interpretation is supported by the finding that firms’ responses to environmental issues are
incommensurate to ecological understanding. The disconnection between firms’ ecological
understanding and ecological responding may explain the inadequacy of the latter. In turn, this
inadequacy may be attributable to various factors ranging from changing corporate goals, lack of
resources, competing priorities, or environmental ambivalence. Future research could investigate
the relationships between these factors, corporate response, and CEP to reveal the more robust
explanations.
Schemas. This thesis raises a number of questions related to schema discrepancy and the
power of schema sponsors. Does high discrepancy consistently trigger subtyping? Research has
shown that extreme discrepancy can disable interpretation (e.g. Weick, 1993). What happens then
if extreme discrepancy is sustained? Integrating temporality, research may ask how long
discrepancy needs to be sustained in order to generate second-order schema change. Does the
intensity of discrepancy affect the speed of schema change? Can the power of schema sponsors
affect the speed of schema change? Does the frequency of exposure to discrepancy affect schema
evolution? A wide array of quantitative and qualitative methods can help investigate these
questions, to the extent that they can track schema content and evolution over time.
This thesis is embedded in a stream of research that looks at the links between strategic
cognitions, actions, and their consequences (Narayanan et al., 2011). Researchers have addressed
divergent schemas and their cognitive outcomes (Hahn et al., 2014), as well as schema interactions
through competing sponsors who wish to shape strategic decision-making and action (Kaplan,
2008). Little research exists however on the performance outcomes of such competitions. Further,
recent research have investigated how organizational members make sense of past events in light
of present and upcoming goals (Kaplan & Orlikowski, 2013). This thesis suggests that past
performance relates to corporate actions and future research could explore the mutual influence
between the interpretation of past performance and performance outcomes.
The scholarly conversation on internal and external predictors of CEP may also benefit
from the consideration of other organizational factors that shape schemas and performance. The
first paper discusses the relationship between schema evolution and structural change (Bartunek,
1984; Ranson et al., 1980) and thus points to firm structure. Extant research suggests that alignment
122
between corporate schemas, structure and actions produces better environmental performance
outcomes (Russo & Harrison, 2005). Whether firms can simultaneously align schemas, structure,
and actions with multiple types of performance remains to be explored, in theory and in practice.
Methods. Among other activities, this thesis has required the development of three
dictionaries for use in computer-aided text analysis to capture terms and phrases related to
environmental monitoring, environmental phenomena and impacts, and environmental restoration.
These dictionaries can contribute to future research by capturing environmental terms in various
textual sources.
The concepts of schema growth and reduction identified in the third thesis paper describe
schema change in its simplest manifestations. The development and use of methods based on
growth and reduction can help research highlight the characteristics of change: Does core and/or
peripheral content change? Is change incremental or radical? What changes when? Future research
building on such methods, including but not limited to cognitive mapping, can overcome simplistic
conceptualizations of schema change as a succession of states and shed light on schema change
mechanisms and patterns. Methods that capture growth and reduction together with core and
peripheral content offer the possibility of detailed analysis of schema change patterns. As noted,
for example, applying a growth and reduction lens on schema change patterns suggests that the
subtraction of core content distinguishes first- and second-order schema change. Future research
can explore and use this distinction to identify replacement and relocation patterns rarely captured
in organizational settings, and perhaps new schema change patterns.
Conclusion: All Roads Lead to Rome
The central idea of this thesis is that to understand firms’ response to environmental issues,
one must comprehend how strategic thinking evolves in reaction to changes in the organizational
environment. Based on the longstanding assumption that strategic maps prompt actions, changes
in maps should result in new actions and different results. Yet this thesis found otherwise: firms
are sometimes unable to convert knowledge into corresponding actions. Despite the widespread
metaphor, schemas are not just maps. They are maps with directions. Concepts and relationships
form the map and values give directions. Although firms might use the maps to go anywhere, they
tend to go where the directions point. All roads lead to Rome. Core and peripheral map contents
are unequal in the face of change. Core content tends to remain stable while peripheral content is
temporary. Core content defines values and gives meaning to the rest of the map. Most of the time,

123
directions remain essentially the same when the map changes, and firms tend to go places they
already know.
Taken in its entirety, this thesis suggests that dynamics of schema evolution both enable
and significantly constrain corporate response to environmental issues. Evolution dynamics help
explain how firms with high levels of corporate environmentalism may fail to reap the expected
environmental benefits.
124
REFERENCES
Aguilera, R. V., Rupp, D. E., Williams, C. A., & Ganapathi, J. 2007. Putting the S back in
corporate social responsibility: A multilevel theory of social change in organizations.
Academy of Management Review, 32(3): 836–863.
Aguinis, H., & Glavas, A. 2012. What we know and don’t know about corporate social
responsibility: A review and research agenda. Journal of Management, 38(4): 932–968.
Albert, S. 1992. The algebra of change. In B. M. Staw & L. L. Cummings (Eds.), Research in
organizational behavior, vol. 14: 179–229. Greenwich, CT: JAI Press.
Allison, G. T. 1971. Essence of decision: Explaining the Cuban missile crisis. Boston, MA:
Little, Brown & Company.
Anderson, L. M., & Bateman, T. S. 2000. Individual environmental initiative: Championing
natural environmental issues in U.S. business organizations. Academy of Management
Journal, 43(4): 548–570.
Anderson, M. H., & Nichols, M. L. 2007. Information Gathering and Changes in Threat and
Opportunity Perceptions. Journal of Management Studies, 44(3): 367–387.
Anderson, R. 2009. The business logic of sustainability.
http://www.ted.com/talks/ray_anderson_on_the_business_logic_of_sustainability.
Angus-Leppan, T., Metcalf, L., & Benn, S. 2010. Leadership Styles and CSR Practice: An
Examination of Sensemaking, Institutional Drivers and CSR Leadership. Journal of
Business Ethics, 93(2): 189–213.
Aravind, D., & Christmann, P. 2011. Decoupling of Standard Implementation from Certification:
Does Quality of ISO 14001 Implementation Affect Facilities’ Environmental
Performance? Business Ethics Quarterly, 21(1): 73–102.

125
Axelrod, R. (Ed.). 1976. Structure of decision: the cognitive maps of political elites. Princeton,
NJ: Princeton Univ. Press.
Baker, T., & Nelson, R. E. 2005. Creating something from nothing: Resource construction
through entrepreneurial bricolage. Administrative Science Quarterly, 50(3): 329–366.
Balogun, J., & Johnson, G. 2004. Organizational restructuring and middle manager sensemaking.
Academy of Management Journal, 47(4): 523–549.
Banerjee, S. B. 2001. Managerial perceptions of corporate environmentalism: Interpretations
from industry and strategic implications for organizations. Journal of Management
Studies, 38(4): 489–513.
Bansal, P. 2003. From issues to actions: The importance of individual concerns and
organizational values in responding to natural environmental issues. Organization
Science, 14(5): 510–527.
Bansal, P., & Gao, J. 2006. Building the Future by Looking to the Past. Organization &
Environment, 19(4): 458–478.
Barnett, M. L., & Salomon, R. M. 2012. Does it pay to be really good? Addressing the shape of
the relationship between social and financial performance. Strategic Management
Journal, 33(11): 1304–1320.
Barr, P. S., & Glynn, M. A. 2004. Cultural Variations in Strategic Issue Interpretation: Relating
Cultural Uncertainty Avoidance to Controllability in Discriminating Threat and
Opportunity. Strategic Management Journal, 25(1): 59–67.
Barr, P. S., Stimpert, J. L., & Huff, A. S. 1992. Cognitive change, strategic action, and
organizational renewal. Strategic Management Journal, 13(S1): 15–36.

126
Barrow, C. J. 2005. Environmental management and development. London ; New York:
Routledge.
Bartunek, J. M. 1984. Changing interpretive schemes and organizational restructuring: The
example of a religious order. Administrative Science Quarterly, 29(3): 355–372.
Bartunek, J. M. 1993. The multiple cognitions and conflicts associated with second order
organizational change. In J. K. Murnighan (Ed.), Social psychology in organizations:
Advances in theory and research: 322–349. Englewood Cliffs, NJ: Prentice Hall.
Bartunek, J. M., & Keys, C. B. 1982. Power Equalization in Schools Through Organization
Development. The Journal of Applied Behavioral Science, 18(2): 171–183.
Bartunek, J. M., & Moch, M. K. 1987. First-Order, Second-Order, and Third-Order Change and
Organization Development Interventions: A Cognitive Approach. The Journal of
Applied Behavioral Science, 23(4): 483–500.
Basu, K., & Palazzo, G. 2008. Corporate social responsibility: A process model of sensemaking.
Academy of Management Review, 33(1): 122–136.
Bednar, M. K. 2012. Watchdog or Lapdog? A Behavioral View of the Media as a Corporate
Governance Mechanism. Academy of Management Journal, 55(1): 131–150.
Beelitz, A., & Merkl-Davies, D. M. 2012. Using discourse to restore organisational legitimacy:
“CEO-speak” after an incident in a German nuclear power plant. Journal of Business
Ethics, 108(1): 101–120.
Berrone, P., Cruz, C., Gomez-Mejia, L. R., & Larraza-Kintana, M. 2010. Socioemotional Wealth
and Corporate Responses to Institutional Pressures: Do Family-Controlled Firms Pollute
Less? Administrative Science Quarterly, 55(1): 82–113.

127
Bingham, C. B., & Kahl, S. J. 2013. The Process of Schema Emergence: Assimilation,
Deconstruction, Unitization and the Plurality of Analogies. Academy of Management
Journal, 56(1): 14–34.
Blomquist, T., & Sandström, J. 2004. From issues to checkpoints and back: managing green
issues in R&D. Business Strategy & the Environment (John Wiley & Sons, Inc), 13(6):
363–373.
Böhling, K., Murguía, D. I., & Godfrid, J. 2017. Sustainability Reporting in the Mining Sector:
Exploring Its Symbolic Nature. Business & Society, 0007650317703658.
Boiral, O. 2007. Corporate Greening Through ISO 14001: A Rational Myth? Organization
Science, 18(1): 127–146.
Boiral, O. 2013. Sustainability reports as simulacra? A counter-account of A and A+ GRI
reports. Accounting, Auditing & Accountability Journal, 26(7): 1036–1071.
Boiral, O., Cayer, M., & Baron, C. 2009. The action logics of environmental leadership: A
developmental perspective. Journal of Business Ethics, 85(4): 479–499.
Boiral, O., Henri, J.-F., & Talbot, D. 2012. Modeling the impacts of corporate commitment on
climate change. Business Strategy & the Environment (John Wiley & Sons, Inc), 21(8):
495–516.
Bondy, K., Moon, J., & Matten, D. 2012. An institution of corporate social responsibility (CSR)
in multi-national corporations (MNCs): Form and implications. Journal of Business
Ethics, 111(2): 281–299.
Bowen, F. 2014. After greenwashing: symbolic corporate environmentalism and society. New
York: Cambridge University Press.

128
Bowen, F., & Aragon-Correa, J. A. 2014. Greenwashing in Corporate Environmentalism
Research and Practice: The Importance of What We Say and Do. Organization &
Environment, 27(2): 107–112.
Brands, R. A., Menges, J. I., & Kilduff, M. 2015. The Leader-in-Social-Network Schema:
Perceptions of Network Structure Affect Gendered Attributions of Charisma.
Organization Science, 26(4): 1210–1225.
Buehler, V. M., & Shetty, Y. K. 1974. Motivations for Corporate Social Action. Academy of
Management Journal, 17(4): 767–771.
Calori, R., Johnson, G., & Sarnin, P. 1994. CEOs’ cognitive maps and the scope of the
organization. Strategic Management Journal, 15(6): 437–457.
Carlos, W. C., & Lewis, B. W. 2015. Substantive implementation with symbolic silence: The
strategic publication of certification status. Submitted for Publication.
http://papers.ssrn.com/sol3/papers.cfm?abstract_id=2585270.
Cho, C. H., Laine, M., Roberts, R. W., & Rodrigue, M. 2015. Organized hypocrisy,
organizational façades, and sustainability reporting. Accounting, Organizations and
Society, 40: 78–94.
Christmann, P., & Taylor, G. 2006. Firm self-regulation through international certifiable
standards: determinants of symbolic versus substantive implementation. Journal of
International Business Studies, 37(6): 863–878.
Cordano, M., Marshall, R., & Silverman, M. 2010. How do Small and Medium Enterprises Go
“Green”? A Study of Environmental Management Programs in the U.S. Wine Industry.
Journal of Business Ethics, 92(3): 463–478.
129
Corley, K. G., & Gioia, D. A. 2011. Building theory about theory building: What constitutes a
theoretical contribution? Academy of Management Review, 36(1): 12–32.
Corner, P. D., Kinicki, A. J., & Keats, B. W. 1994. Integrating Organizational and Individual
Information Processing Perspectives on Choice. Organization Science, 5(3): 294–308.
Daft, R. L., & Weick, K. E. 1984. Toward a Model of Organizations as Interpretation Systems.
Academy of Management Review, 9(2): 284–295.
Daly, H. E. 1990. Toward some operational principles of sustainable development. Ecological
Economics, 2(1): 1–6.
Dane, E. 2010. Reconsidering the Trade-Off Between Expertise and Flexibility: A Cognitive
Entrenchment Perspective. Academy of Management Review, 35(4): 579–603.
Das, T. K., & Teng, B.-S. 1999. Cognitive Biases and Strategic Decision Processes: An
Integrative Perspective. Journal of Management Studies, 36(6): 757–778.
de Villiers, C., Naiker, V., & van Staden, C. J. 2011. The Effect of Board Characteristics on Firm
Environmental Performance. Journal of Management, 37(6): 1636–1663.
Delmas, M. A., & Burbano, V. C. 2011. The Drivers of Greenwashing. California Management
Review, 54(1): 64–87.
Delmas, M. A., Etzion, D., & Nairn-Birch, N. 2013. Triangulating environmental performance:
What do corporate social responsibility ratings really capture? Academy of Management
Perspectives, 27(3): 255–267.
Dowell, G. W. S., & Muthulingam, S. 2017. Will firms go green if it pays? The impact of
disruption, cost, and external factors on the adoption of environmental initiatives: Will
Firms Go Green If It Pays? Strategic Management Journal, 38(6): 1287–1304.
130
Dutton, J. E., & Duncan, R. B. 1987. The influence of the strategic planning process on strategic
change. Strategic Management Journal, 8(2): 103–116.
Dutton, J. E., Fahey, L., & Narayanan, V. K. 1983. Toward Understanding Strategic Issue
Diagnosis. Strategic Management Journal, 4(4): 307–323.
Dutton, J. E., & Jackson, S. E. 1987. Categorizing Strategic Issues: Links to Organizational
Action. Academy of Management Review, 12(1): 76–90.
Eberhardt-Toth, E., & Wasieleski, D. M. 2013. A Cognitive Elaboration Model of Sustainability
Decision Making: Investigating Financial Managers’ Orientation Toward Environmental
Issues. Journal of Business Ethics, 117(4): 735–751.
Eden, C., Ackermann, F., & Cropper, S. 1992. The Analysis of Cause Maps. Journal of
Management Studies, 29(3): 309–324.
Eggers, J. P., & Kaplan, S. 2013. Cognition and capabilities. The Academy of Management
Annals, 7(1): 293–338.
Egri, C. P., & Pinfield, L. T. 1996. Organizations and the biosphere: Ecologies and
environments. In S. Clegg, C. Hardy, & W. Nord (Eds.), Handbook of organization
studies: 730. Thousand Oaks, CA: Sage Publications.
Ellis, L. 1994. Research methods in the social sciences. Madison, WI: Brown & Benchmark.
Elsayed, K. 2006. Reexamining the Expected Effect of Available Resources and Firm Size on
Firm Environmental Orientation: An Empirical Study of UK Firms. Journal of Business
Ethics, 65(3): 297–308.
Etzion, D. 2007. Research on organizations and the natural environment, 1992-present: A
review. Journal of Management, 33(4): 637–664.
131
Eun-Hee, K., & Lyon, T. P. 2015. Greenwash vs. Brownwash: Exaggeration and Undue Modesty
in Corporate Sustainability Disclosure. Organization Science, 26(3): 705–723.
Feng, T., & Wang, D. 2016. The Influence of Environmental Management Systems on Financial
Performance: A Moderated-Mediation Analysis. Journal of Business Ethics, 135(2):
265–278.
Ferraro, F., Pfeffer, J., & Sutton, R. I. 2005. Economics language and assumptions: How theories
can become self-fulfilling. Academy of Management Review, 30(1): 8–24.
Field, C., Barros, V., Mach, K., & Mastrandrea, M. 2014. Climate Change 2014: Impacts,
Adaptation, and Vulnerability - Technical Summary: 76. no. IPCC WGII AR5,
Intergovernmental Panel on Climate Change.
Fineman, S., & Clarke, K. 1996. Green Stakeholders: Industry Interpretations and Response.
Journal of Management Studies, 33(6): 715–730.
Fiske, S. T., & Dyer, L. M. 1985. Structure and development of social schemata: Evidence from
positive and negative transfer effects. Journal of Personality and Social Psychology,
48(4): 839–852.
Flammer, C. 2013. Corporate Social Responsibility and Shareholder Reaction: The
Environmental Awareness of Investors. Academy of Management Journal, 56(3): 758–
781.
French, J. R. P., & Raven, B. 1959. The bases of social power. In D. Cartwright (Ed.), Studies in
social power: 150–167. Ann Arbor, MI: University of Michigan Press.
Gao, J., & Bansal, P. 2013. Instrumental and Integrative Logics in Business Sustainability.
Journal of Business Ethics, 112(2): 241–255.
Garfinkel, H. 1967. Studies in Ethnomethodology. Prentice-Hall.
132
Giddens, A. 1979. Central problems in social theory: Action, structure, and contradiction in
social analysis. Berkeley: University of California Press.
Gioia, D. A., & Chittipeddi, K. 1991. Sensemaking and sensegiving in strategic change
initiation. Strategic Management Journal, 12(6): 433–448.
Gladwin, T. N., Kennelly, J. J., & Krause, T.-S. 1995. Shifting Paradigms for Sustainable
Development: Implications for Management Theory and Research. Academy of
Management Review, 20(4): 874–907.
Global Reporting Initiative. 2017. About GRI. GRI - Empowering Sustainable Decisions.
https://www.globalreporting.org/information/about-gri/Pages/default.aspx.
Goffman, E. 1974. Frame analysis: An essay on the organization of experience. New York:
Harper & Row.
Greenwood, R., & Hinings, C. R. 1988. Organizational design types, tracks and the dynamics of
strategic change. Organization Studies, 9(3): 293–316.
Hahn, T., Preuss, L., Pinkse, J., & Figge, F. 2014. Cognitive frames in corporate sustainability:
Managerial sensemaking with paradoxical and business case frames. Academy of
Management Review, 39(4): 463–487.
Hair, J. F., Anderson, R. E., Tatham, R. L., & Black, W. C. 1998. Multivariate data analysis
(Prentice Hall). Upper Saddle River, NJ.
Hambrick, D. C. 1982. Environmental Scanning and Organizational Strategy. Strategic
Management Journal, 3(2): 159–174.
Hardy, C., & Maguire, S. 2008. Institutional entrepreneurship. In R. Greenwood, C. Oliver, K.
Sahlin, & R. Suddaby (Eds.), The Sage handbook of organizational institutionalism:
198–217. London, UK: Sage.

133
Hausman, J. A. 1978. Specification Tests in Econometrics. Econometrica, 46(6): 1251–1271.
Hausman, J. A., & Taylor, W. E. 1981. Panel Data and Unobservable Individual Effects.
Econometrica, 49(6): 1377–1398.
Hawken, P. 1993. The ecology of commerce: a declaration of sustainability (1st Collins
Business ed). New York, NY: Collins Business.
Hedberg, B. 1981. How organizations learn and unlearn. In P. C. Nystrom & W. H. Starbuck
(Eds.), Handbook of organizational design: 3–27. New York, NY: Oxford University
Press.
Hoffman, A. J. 2015. How culture shapes the climate change debate. Stanford, California:
Stanford Briefs, an imprint of Stanford University Press.
Holsti, O. R. 1969. Content Analysis for the Social Sciences and Humanities. Reading, MA:
Addison-Wesley.
Howard-Grenville, J. A. 2007a. Developing issue-selling effectiveness over time: Issue selling as
resourcing. Organization Science, 18(4): 560–577.
Howard-Grenville, J. A. 2007b. Corporate culture and environmental practice: Making change
at a high-technology manufacturer. Cheltenham, UK ; Northampton, MA: Edward
Elgar.
Hsiao, C. 2003. Analysis of panel data (2nd ed). Cambridge ; New York: Cambridge University
Press.
Huff, A. S. (Ed.). 1990. Mapping strategic thought. New York, NY: Wiley.
Huff, A. S., & Jenkins, M. (Eds.). 2002. Mapping strategic knowledge. London ; Thousand
Oaks, Calif: SAGE.
134
Huff, A. S., Narapareddy, V., & Fletcher, K. E. 1990. Coding the causal association of concepts.
In A. S. Huff (Ed.), Mapping Strategic Thought: 311–325. New York, NY: Wiley.
International Council for Mining and Metals. 2016. Making a positive contribution to the SDGs.
International Council for Mining and Metals. https://www.icmm.com/sdg.
Jackson, S. E., & Dutton, J. E. 1988. Discerning Threats and Opportunities. Administrative
Science Quarterly, 33(3): 370–387.
Jackson, T. 2010. Prosperity without growth: Economics for a finite planet. London: Earthscan.
Jarzabkowski, P. 2008. Shaping strategy as a structuration process. Academy of Management
Journal, 51(4): 621–650.
Judge, J., William Q., & Douglas, T. J. 1998. Performance Implications of Incorporating Natural
Environmental Issues into the Strategic Planning Process: An Empirical Assessment.
Journal of Management Studies, 35(2): 241–262.
Kahl, S. J. 2017. The Role of Trade Associations in Market Discourse and Cognition. Journal of
Management Inquiry, 1–3.
Kant, I. 1998. Critique of pure reason. (P. Guyer & A. W. Wood, Eds.). Cambridge ; New York:
Cambridge University Press.
Kaplan, S. 2008. Framing contests: Strategy making under uncertainty. Organization Science,
19(5): 729–752.
Kaplan, S., & Orlikowski, W. J. 2013. Temporal work in strategy making. Organization
Science, 24(4): 965–995.
Kassinis, G., & Vafeas, N. 2006. Stakeholder Pressures and Environmental Performance.
Academy of Management Journal, 49(1): 145–159.

135
Key, S. 1999. Toward a new theory of the firm: A critique of stakeholder “theory.” Management
Decision, 37(3/4): 317.
Kim, P. H., Pinkley, R. L., & Fragale, A. R. 2005. Power Dynamics in Negotiation. Academy of
Management Review, 30(4): 799–822.
Klassen, R. D., & Whybark, D. C. 1999. The Impact of Environmental Technologies on
Manufacturing Performance. Academy of Management Journal, 42(6): 599–615.
Knoke, D., & Kuklinski, J. H. 1982. Network analysis. Beverly Hills, CA: Sage Publications.
Kock, C. J., Santaló, J., & Diestre, L. 2012. Corporate Governance and the Environment: What
Type of Governance Creates Greener Companies? Journal of Management Studies,
49(3): 492–514.
Krippendorff, K. 2004. Content analysis: An introduction to its methodology (2nd ed).
Thousand Oaks, CA: Sage.
Labianca, G., Gray, B., & Brass, D. J. 2000. A grounded model of organizational schema change
during empowerment. Organization Science, 11(2): 235–257.
Lampikoski, T. 2012. Green, Innovative, and Profitable: A Case Study of Managerial
Capabilities at Interface Inc. Technology Innovation Management Review, (November:
Insights): 4–12.
Lyon, T. P., & Maxwell, J. W. 2011. Greenwash: Corporate Environmental Disclosure under
Threat of Audit. Journal of Economics & Management Strategy, 20(1): 3–41.
Lyon, T. P., & Montgomery, A. W. 2015. The Means and End of Greenwash. Organization &
Environment, 1–27.
Maciejovsky, B., Schwarzenberger, H., & Kirchler, E. 2012. Rationality Versus Emotions: The
Case of Tax Ethics and Compliance. Journal of Business Ethics, 109(3): 339–350.

136
Maguire, S., & Hardy, C. 2013. Organizing Processes and the Construction of Risk: A
Discursive Approach. Academy of Management Journal, 56(1): 231–255.
Maitlis, S. 2005. The social processes of organizational sensemaking. Academy of Management
Journal, 48(1): 21–49.
Maitlis, S., & Sonenshein, S. 2010. Sensemaking in crisis and change: Inspiration and insights
from Weick (1988). Journal of Management Studies, 47(3): 551–580.
Margolis, J. D., & Walsh, J. P. 2003. Misery loves companies: Rethinking social initiatives by
business. Administrative Science Quarterly, 48(2): 268–305.
Marques, J. C. 2016. Private Regulatory Strategies: Theory and Evidence from the Global
Apparel Industry. Academy of Management Proceedings, 2016(1): 17934.
McKenny, A. F., Short, J. C., & Newman, S. M. 2012. CAT Scanner. Norman, OK: Authors.
http://www.amckenny.com/CATScanner/.
Melo, C. J., & Wolf, S. A. 2005. Empirical Assessment of Eco-Certification: The Case of
Ecuadorian Bananas. Organization & Environment, 18(3): 287–317.
Meyer, J. W., & Rowan, B. 1977. Institutionalized Organizations: Formal Structure as Myth and
Ceremony. American Journal of Sociology, 83(2): 340–363.
Milliken, F. J. 1990. Perceiving and Interpreting Environmental Change: An Examination of
College Administrators’ Interpretation of Changing Demographics. Academy of
Management Journal, 33(1): 42–63.
Mintzberg, H., Ahlstrand, B. W., & Lampel, J. 2005. Strategy safari: a guided tour through the
wilds of strategic management. New York: Free Press.
137
Muller, A., & Kolk, A. 2010. Extrinsic and intrinsic drivers of corporate social performance:
Evidence from foreign and domestic firms in Mexico. Journal of Management Studies,
47(1): 1–26.
Nadkarni, S., & Barr, P. S. 2008. Environmental context, managerial cognition, and strategic
action: an integrated view. Strategic Management Journal, 29(13): 1395–1427.
Nadkarni, S., & Narayanan, V. K. 2007a. The Evolution of Collective Strategy Frames in High-
and Low-Velocity Industries. Organization Science, 18(4): 688–710.
Nadkarni, S., & Narayanan, V. K. 2007b. Strategic schemas, strategic flexibility, and firm
performance: the moderating role of industry clockspeed. Strategic Management
Journal, 28(3): 243–270.
Nag, R., & Gioia, D. A. 2012. From Common to Uncommon Knowledge: Foundations of Firm-
Specific Use of Knowledge as a Resource. Academy of Management Journal, 55(2):
421–457.
Narayanan, V. K., & Fahey, L. 1990. Evolution of revealed causal maps during decline: A case
study of Admiral. In A. S. Huff (Ed.), Mapping Strategic Thought: 109–133. New York,
NY: Wiley.
Narayanan, V. K., Zane, L. J., & Kemmerer, B. 2011. The Cognitive Perspective in Strategy: An
Integrative Review. Journal of Management, 37(1): 305–351.
Neubauer, I. L. 2014, February 13. Is Drought Becoming the New Normal for Australia? Time.
http://time.com/7320/is-drought-becoming-the-new-normal-for-australia/.
Newton, T. J. 2002. Creating the new ecological order? Elias and actor-network theory.
Academy of Management Review, 27(4): 523–540.
138
Nicholson, L., & Anderson, A. R. 2005. News and nuances of the entrepreneurial myth and
metaphor: Linguistic games in entrepreneurial sense-making and sense-giving.
Entrepreneurship: Theory & Practice, 29(2): 153–173.
Pain, G. C. F. 2015. Sensemaking, schema interaction dynamics, and corporate environmental
performance. In J. Humphreys (Ed.), Proceedings of the Seventy-fifth Annual Meeting
of the Academy of Management. Presented at the Annual Meeting of the Academy of
Management, Academy of Management.
Patel, P. C., Kohtamäki, M., Parida, V., & Wincent, J. 2015. Entrepreneurial orientation-as-
experimentation and firm performance: The enabling role of absorptive capacity.
Strategic Management Journal, 36(11): 1739–1749.
Pavelin, S., & Porter, L. 2008. The Corporate Social Performance Content of Innovation in the
U.K. Journal of Business Ethics, 80(4): 711–725.
Pennebaker, J. W., Booth, R. J., & Francis, M. E. 2007. Linguistic inquiry and word count
(LIWC): A computerized text analysis program. Austin, TX: LIWC.net.
Pennebaker, J. W., Boyd, R. L., Jordan, K., & Blackburn, K. 2015. The development and
psychometric properties of LIWC 2015. University of Texas at Austin, 1–27.
Pfarrer, M. D., Pollock, T. G., & Rindova, V. P. 2010. A Tale of Two Assets: The Effects of
Firm Reputation and Celebrity on Earnings Surprises and Investors’ Reactions. Academy
of Management Journal, 53(5): 1131–1152.
Pfeffer, J., & Salancik, G. R. 1978. The external control of organizations: A resource
dependence perspective. New York, NY: Harper & Row.
Philippe, D., & Durand, R. 2011. The impact of norm-conforming behaviors on firm reputation.
Strategic Management Journal, 32(9): 969–993.
139
Piaget, J. 1952. The Origins of Intelligence in Children. New York, NY: International
Universities Press, Inc. http://www.pitt.edu/~strauss/origins_r.pdf.
Poesche, J. 1998. Business Ethics in the Choice of New Technology in the Kraft Pulping
Industry. Journal of Business Ethics, 17(5): 471–489.
Poole, P. P., Gioia, D. A., & Gray, B. 1989. Influence Modes, Schema Change, and
Organizational Transformation. Journal of Applied Behavioral Science, 25(3): 271–289.
Queller, S. 2002. Stereotype Change in a Recurrent Network. Personality & Social Psychology
Review (Lawrence Erlbaum Associates), 6(4): 295–303.
Ranson, S., Hinings, B., & Greenwood, R. 1980. The structuring of organizational structures.
Administrative Science Quarterly, 25(1): 1–17.
Reuters. 2016, December 17. Beijing orders factories to cut output or shut down to tackle urban
pollution crisis. The Telegraph. http://www.telegraph.co.uk/news/2016/12/17/beijing-
orders-factories-cut-output-shut-tackle-urban-pollution/.
Riffe, D., Lacy, S., & Fico, F. 2005. Analyzing media messages: Using quantitative content
analysis in research (2nd ed). Mahwah, NJ: Lawrence Erlbaum.
Rockström, J., Steffen, W., Noone, K., Persson, Å., Chapin, F. S., et al. 2009. A safe operating
space for humanity. Nature, 461(7263): 472–475.
Rodrigue, M., Magnan, M., & Cho, C. 2013. Is Environmental Governance Substantive or
Symbolic? An Empirical Investigation. Journal of Business Ethics, 114(1): 107–129.
Roome, N. 1992. Developing environmental management strategies. Business Strategy and the
Environment, 1(1): 11–24.
Rothbart, M. 1981. Memory processes and social beliefs. In D. L. Hamilton (Ed.), Cognitive
processes in stereotyping and intergroup behavior: 145–181. Hillsdale, NJ: Erlbaum.

140
Russo, M. V., & Harrison, N. S. 2005. Organizational Design and Environmental Performance:
Clues from the Electronics Industry. Academy of Management Journal, 48(4): 582–593.
Savitz, A. W., & Weber, K. 2006. The triple bottom line - How today’s best-run companies are
achieving economic, social, and environmental success-and how you can too. San
Francisco: Jossey-Bass. http://www.books24x7.com/marc.asp?bookid=15464.
Schaefer, A. 2007. Contrasting Institutional and Performance Accounts of Environmental
Management Systems: Three Case Studies in the UK Water & Sewerage Industry.
Journal of Management Studies, 44(4): 506–535.
Schendel, D. E., & Hofer, C. W. 1979. Strategic Management (1st edition). Boston, MA: Little,
Brown & Company.
Schutz, A. 1962. Collected papers 1 - The problem of social reality. (M. Natanson, Ed.). The
Hague: Nijhoff.
Schwenk, C. R. 1989. Linking Cognitive, Organizational and Political Factors in Explaining
Strategic Change. Journal of Management Studies, 26(2): 177–187.
Sharma, S. 2000. Managerial interpretations and organizational context as predictors of corporate
choice of environmental strategy. Academy of Management Journal, 43(4): 681–697.
Sharma, S., & Henriques, I. 2005. Stakeholder influences on sustainability practices in the
Canadian forest products industry. Strategic Management Journal, 26(2): 159–180.
Short, J. C., Broberg, J. C., Cogliser, C. C., & Brigham, K. C. 2010. Construct Validation Using
Computer-Aided Text Analysis (CATA): An Illustration Using Entrepreneurial
Orientation. Organizational Research Methods, 320–347.
Shrivastava, P. 1995. Ecocentric management for a risk society. Academy of Management
Review, 20(1): 118–137.
141
Simon, H. A. 1945. Administrative behavior : A study of decision-making processes in
administrative organizations. New York, NY: Free Press.
Smith, K. G., Grimm, C. M., Gannon, M. J., & Chen, M.-J. 1991. Organizational Information
Processing, Competitive Responses, and Performance in the U.s. Domestic Airline
Industry. Academy of Management Journal, 34(1): 60–85.
Steffen, W., Richardson, K., Rockström, J., Cornell, S. E., Fetzer, I., et al. 2015. Planetary
boundaries: Guiding human development on a changing planet. Science, 347(6223): 736–
746.
Stevenson, W. B., & Greenberg, D. N. 1998. The Formal Analysis of Narratives of
Organizational Change. Journal of Management, 24(6): 741–762.
Stiglitz, J. E., Sen, A., & Fitoussi, J.-P. 2010. Mismeasuring our lives: Why the GDP doesn’t
add up. New York: The New Press. http://thenewpress.com/books/mismeasuring-our-
lives.
Stormer, F. 2003. Making the shift: Moving from “ethics pays” to an inter-systems model of
business. Journal of Business Ethics, 44(4): 279–289.
Stubbs, W., & Cocklin, C. 2008. Conceptualizing a “Sustainability Business Model.”
Organization & Environment, 21(2): 103–127.
Thomas, J. B., Clark, S. M., & Gioia, D. A. 1993. Strategic sensemaking and organizational
performance: linkages among scanning, interpretation, action, and outcomes. Academy of
Management Journal, 36(2): 239–270.
Thomas, J. B., & McDaniel, R. R. 1990. Interpreting Strategic Issues: Effects of Strategy and the
Information-Processing Structure of Top Management Teams. Academy of Management
Journal, 33(2): 286–306.
142
Thomas, T. E. 2005. Are business students buying it? A theoretical framework for measuring
attitudes toward the legitimacy of environmental sustainability. Business Strategy and
the Environment, 14(3): 186–197.
Tsoukas, H. 2009. A Dialogical Approach to the Creation of New Knowledge in Organizations.
Organization Science, 20(6): 941–957.
Tucker Wrightson, M. 1976. The documentary coding method. In R. Axelrod (Ed.), Structure of
decision: 291–332. Princeton, NJ: Princeton University Press.
Tukey, J. W. 1977. Exploratory data analysis. Reading, MA: Addison-Wesley.
United Nations Environment Programme. 2012. UNEP year book 2012: Emerging issues in our
global environment. United Nations Publications.
United Nations General Assembly. 2015. Transforming our world: the 2030 Agenda for
Sustainable Development: 35. United Nations General Assembly Resolution no.
A/RES/70/1, United Nations.
Ury, W. 1988. Getting disputes resolved: designing systems to cut the costs of conflict (1st ed).
San Francisco: Jossey-Bass.
van de Ven, A. H., & Poole, M. S. 1990. Methods for Studying Innovation Development in the
Minnesota Innovation Research Program. Organization Science, 1(3): 313–335.
Van De Ven, A. H., & Poole, M. S. 1995. Explaining Development and Change in
Organizations. Academy of Management Review, 20(3): 510–540.
van Marrewijk, M., & Werre, M. 2003. Multiple Levels of Corporate Sustainability. Journal of
Business Ethics, 44(2–3): 107–119.
Van Marrewijk, M., & Werre, M. 2003. Multiple Levels of Corporate Sustainability. Journal of
Business Ethics, 44(2–3): 107–119.
143
Walls, J. L., Berrone, P., & Phan, P. H. 2012. Corporate governance and environmental
performance: Is there really a link? Strategic Management Journal, 33(8): 885–913.
Walsh, J. P. 1995. Managerial and Organizational Cognition: Notes from a Trip Down Memory
Lane. Organization Science, 6(3): 280–321.
Weber, M. 1947. The theory of social and economic organization. New York, NY: Free Press.
Weber, R., & Crocker, J. 1983. Cognitive processes in the revision of stereotypic beliefs.
Journal of Personality and Social Psychology, 45(5): 961–977.
Weick, K. E. 1993. The collapse of sensemaking in organizations: The Mann Gulch disaster.
Administrative Science Quarterly, 38(4): 628–652.
Weick, K. E. 1995. Sensemaking in organizations. Thousand Oaks: Sage Publications.
Weick, K. E., Sutcliffe, K. M., & Obstfeld, D. 2005. Organizing and the process of sensemaking.
Organization Science, 16(4): 409–421.
Whiteman, G., & Cooper, W. H. 2011. Ecological sensemaking. Academy of Management
Journal, 54(5): 889–911.
Whiteman, G., Walker, B., & Perego, P. 2013. Planetary boundaries: Ecological foundations for
corporate sustainability. Journal of Management Studies, 50(2): 307–336.
Wijen, F. 2014. Means Versus Ends in Opaque Institutional Fields: Trading Off Compliance and
Achievement in Sustainability Standard Adoption. Academy of Management Review,
39(3): 302–323.
World Commission on Environment and Development. 1987. Our Common Future: 374. Report
to the UN General Assembly no. A/42/427, United Nations.
World Economic Forum. 2014. Global Risks, 9th edition: 60. no. 090114, Geneva: World
Economic Forum.

144
World Economic Forum. 2015. Global Risks, 10th edition: 69. no. 090115, Geneva: World
Economic Forum.
York, R. 2004. The Treadmill of (diversifying) Production. Organization & Environment,
17(3): 355–362.
Zavyalova, A., Pfarrer, M. D., Reger, R. K., & Shapiro, D. L. 2012. Managing the Message: The
Effects of Firm Actions and Industry Spillovers on Media Coverage Following
Wrongdoing. Academy of Management Journal, 55(5): 1079–1101.
Zietsma, C., & Lawrence, T. B. 2010. Institutional work in the transformation of an
organizational field: The interplay of boundary work and practice work. Administrative
Science Quarterly, 55(2): 189–221.
Zietsma, C., Winn, M., Branzei, O., & Vertinsky, I. 2001. The war of the woods: processes of
organizational learning and institutional change. Proceedings of the Fourth
International Conference for Organizational Learning and Knowledge Management.
Presented at the The Fourth International Conference for Organizational Learning and
Knowledge Management, Warwick, UK.
http://www.warwick.ac.uk/fac/soc/wbs/conf/olkc/archive/olk4/papers/zietsma.pdf.