strategic performance report - .net framework
TRANSCRIPT

Strategic performance report
Strategic delivery: ☒ Setting standards ☒ Increasing and informing choice
☒ Demonstrating efficiency economy and value
Details:
Meeting Authority
Agenda item 6
Paper number HFEA (11/05/2016) 793
Meeting date 11 May 2016
Author Helen Crutcher, Project Risk and Performance Manager
Output:
For information or decision?
For information
Recommendation The Authority is asked to note and comment on the latest strategic performance report.
Resource implications In budget
Implementation date Ongoing – strategic period 2014-2017
Communication(s) CMG reviews performance in advance of each Authority meeting, and their comments are incorporated into this Authority paper. The Department of Health reviews our performance at a formal accountability meeting every quarter (based on the CMG paper). The Authority receives this summary paper at each meeting, enhanced by additional reporting from Directors. Authority’s views are fed back to the subsequent CMG performance meeting.
Organisational risk ☐ Low ☒ Medium ☐ High
Annexes Annex 1: Strategic performance report – February data

Strategic performance report Human Fertilisation and Embryology Authority 2
1. Introduction 1.1. The attached paper summarises the main performance indicators, following
discussion by the Corporate Management Group (CMG) at its April performance meeting.
1.2. Most of the data relates to the position at the end of February 2016. Two parts cover the period ending 31 March 2016 - these are the finance and strategic delivery totaliser sections. These therefore give an end-of-year view for the 2015/16 financial and strategic year.
1.3. One presentation change has been made in the report following CMG discussion. The eSET graph has been updated to show the relative percentages of eSET for NHS and private treatment, rather than the overall percentage of treatments that are eSET, divided by funding type. This relative approach gives a clearer picture of eSET provision, given that the number of overall cycles completed in the private sector is significantly higher than the number of NHS cycles.
1.4. Overall performance is good, with a single performance indicator in the red, and we are making good progress towards our strategic aims.
2. Recommendation 2.1. The Authority is asked to note the latest strategic performance report.

1
Annex A - HFEA strategic performance scorecard 1. Summary section
Dashboard – February data Strategic delivery totaliser (see overleaf for more detail)
Setting standards: critical and major recommendations on inspection
Increasing and informing choice: public enquiries received (email)
Overall performance - all indicators: Efficiency, economy and value: Budget status: cumulative surplus/(deficit)
(See RAG status section for detail.)
Standards
Choice
Value
28
20
18
11
13
39
Delivered to date / for later delivery
Strategic milestones: Aug 2014 - Jul 2017Position for end March 2016
05
101520253035
Sep Oct Nov Dec Jan Feb
0 1 5
1 1 2
14
27 29
12
26
5
14
28
34
13
27
7
Critical Major Total critical + major
186168 156
193 248
259
99 9893 102 111 105
0
50
100
150
200
250
300
Sep Oct Nov Dec Jan Feb
This year Last year
19
25
26
Red
Amber
Green
Neutral
Q1-Jun-15
Q2-Sep-15
Q3-Dec-15
Q4-Mar-16
Budgeted surplus/deficit (5.04) (53.98) 47.94 (74.36)
Forecast surplus/deficit 40.79 196.01 372.06 435.60
(100.00)
-
100.00
200.00
300.00
400.00
500.00
Su
rplu
s / d
efic
it £
'000
s
This graph details our net position as at 31 March 2016 (month 12) and our actual year end outturn. The graph shows we performed better than budget ie, we have ended the year at a surplus. The components making up the surplus/deficit are shown in the ‘budget status’ section by two graphs (income and expenditure).

2
Dashboard - Commentary
Strategic delivery (to end of March) – summary:
It was previously necessary to re-cast the timeline for the beta phase of IfQ, which is still in progress. Earlier delays have contributed to us appearing ‘behind’ on the above graph compared with the original plan. However we have now started to see the ‘earned value’ of IfQ improving, and over the next few months we expect to see greater convergence between the delivery line and the elapsed timeline in the above graph, especially once beta has been completed and the remaining GDS gateways have been passed. Very little was due for delivery in January and February, so the apparent dip in those months is not a cause for concern. In contrast, a number of business plan items that contribute to strategic delivery were due for completion at the end of the business year, which has improved the overall picture.
CMG’s assessment of end of year delivery was that a majority of planned work was either partially or fully delivered in 2015/16. A minority has been carried forward into 2016/17, either because of tie-ins with IfQ products (and the revised timeline for beta delivery), or because it became clear during the year that
51% 56%
0%
10%
20%
30%
40%
50%
60%
70%
% delivery % elapsedtimeline
% strategic delivery compared to elapsed
time

3
some elements of the work would need to be longer term, were more extensive than originally envisaged, or should be re-considered in light of in-year changes or likely future developments.
For the purposes of this totaliser, where there was good progress based on the original intentions in the 2015/16 business plan, this work has been counted as ‘delivered’. Where items have been rescheduled into 2016/17 in their entirety, because of the link with IfQ, these have been counted as ‘not delivered’ in 2015/16 (but will be counted in a few months’ time when the new delivery date is reached). Some items were cancelled in-year owing to other changes, and these were counted as ‘not delivered’. The end of year (final quarter) progress against milestones due is described below.
Strategic delivery for January to March:
Setting standards
In January, a report was made to CMG summarising information gathered from the most recent meeting of the EU competent authorities, which took place in December. The purpose of reporting back is to demonstrate that we continue to fulfil our role as an EU competent authority, and to ensure that CMG is sighted on information that will inform our approach to high quality regulation and may result in internal projects. We began, some time ago, to include more explicit information about patient experiences in inspection reports to licensing committees. However, building on this work further will require completion of the new Choose a Fertility Clinic function, which will be one of the key outputs of the IfQ programme in 2016/17. When delivered (July 2016), this work will also address our aim to improve the presentation of our data, so as to drive continued improvement in success rates and improved value for money for patients. Clinics already receive performance alerts in relation to success rates, and the HFEA has continued throughout the year to review emerging procedures and to consider and publish evidence. The HFEA also explored with professional stakeholders the issue of acknowledging that treatment is often unsuccessful. We remain keen to see clinics putting better support in place for patients when treatment is unsuccessful. During this year we have been developing our new website, which will provide more information for prospective patients, so as to ensure that they enter treatment with a realistic understanding of their chances of success, and more signposting information for patients who have experienced unsuccessful treatment. The HFEA has continued to work with the Lifecycle campaign, making a range of information leaflets available so as to ensure that potential donors, recipients and donor conceived people have better access to clear, authoritative impartial information about a range of issues. The leaflets, together with the pack about donor information produced earlier for clinics, and the new provision of our counselling support service (from June 2015 onwards), have improved role clarity for clinics in relation to donation and information guardianship. We believe this set of actions contributes to an improved experience for donors, donor-conceived people seeking information, and patients and their families. In March, the HFEA also attended the Association of Fertility Patient Organisations (AFPO) standing stakeholder group meeting, to engage with patients and donor organisations.

4
Increasing and informing choice
Following the rescheduling of IfQ beta phase work, no final deliverables were due in this area during January to March. However, the majority of the new content and templates for the website have been successfully developed, with the aim of ensuring that patients will have access to high quality meaningful information.
By year-end, the HFEA had also completed significant user research to inform the IfQ Programme, especially to clarify what patients view as the key indicators of quality in treatment. This research has underpinned our approach to developing the new CaFC. Patients’ views have been, and will continue to be, integrated into our ways of working and our future plans for the new website.
Through collaborative working with stakeholders and NHS Choices, we have made significant progress with ensuring that patients consistently get good early advice and appropriate referral, regardless of the fertility knowledge of their particular GP. This has been underlined by our user research and is fundamental to the ‘user journeys’ that are now being implemented in our new website.
We also set an objective of ensuring that clinics give accurate and sufficient information to patients in their websites and literature. During renewal inspections, we ask patients directly about these points, and we conduct desk-based research to provide factual feedback to clinics and encourage best practice.
During the 2015/16 business year, we started to consider how we might work with NHS commissioning bodies to help them to commission the best services for patients using available data. Some of this work will need to follow on from IfQ, since it relies on being able to make more use of our data. A draft guide for commissioners was developed and road tested with the multiple births stakeholder group in 2015/16. A deeper look at commissioning is likely to form part of our strategy for 2017-2020.
In March we published our ‘Fertility treatment in 2014’ report, covering treatments in 2013-2014, including a statistical report on donation and donor conception. We launched this publication at our Annual Conference on 24 March.
Efficiency, economy and value
Based on the original IfQ timeline, the cleansing of ‘priority one’ data in preparation for data migration should have been completed this month. Owing to prior resource pressures, the volume of cleansing work needed, and the changes made to the timeline for IfQ, this work is still ongoing into 2016/17. Good progress is being made on HFEA-based cleansing (important in reducing the burden of cleansing for clinics). Clinic based cleansing is starting up now, and the process and rationale for this were explained to delegates at the Annual Conference. Since overall IfQ beta phase delivery was re-timed to the summer, the completion of the clinic portal (release one), website and CaFC, will be carried forward into 2016/17. However a great deal of work has been done during 2015/16, including good progress towards user testing for a public beta phase of the website (which was completed in April 2016). Alongside continuing IfQ programme delivery, we have maintained the existing Register of treatments and outcomes, throughout the year, so as to ensure that patients and others have ongoing access to high quality information. This also ensures that we continue to have high quality data available to help us to deliver new patient information and publications, and to support risk-based regulation and evidence-based policy-making.

5
We have continued to maintain our shared services and collaborative arrangements so that we are efficient, and perpetuate savings made in earlier years. This helps us to achieve measurable ‘added value’ and demonstrate our internal efficiency. Our accountability to the sector for fee rates was maintained through the continuing Fees Group, which enables us to evidence the value of what we do in return for the fees paid by clinics. This group has become well established and is working effectively.

6
Red/amber/green status of performance indicators as at February 2016 The single red key performance indicator (KPI) shown in the ‘overall status - performance indicators’ pie chart on the dashboard is as follows: The number of working days from the day of inspection to the day the draft report is sent to the PR has a target of 90% in 20 working days. In February, performance was at 22% - much lower than expected, with seven reports missing the target. Four reports were sent within 7 days of the target. Three reports took longer, up to 39 working days. A report outstanding from January was sent at 63 working days, and there are still two reports which remain outstanding for February which will be followed up in next month’s strategic performance report. Reasons for delays are varied, but mainly relate to either workload or complexity (or both), or sometimes because legal advice is needed. The team always prioritises robustness and quality over speed. The team’s performance in this area is managed closely, and breaches are always known and managed at the time they occur, in their own particular context. No projects were on a red risk rating in February.

7
Budget status – March data The dashboard shows the overall surplus/deficit position. The graphs below show how the surplus or deficit has arisen. These figures are updated quarterly, approximately one month after the end of each quarter.
This graph shows our budgeted (planned) licence fee income and grant-in-aid (GIA) compared to what is actually happening. As of month 12 (31 March 2016) we have exceeded our budget (a significant surplus of £436k).
This graph is the second component that makes up the surplus/deficit. This excludes costs relating to IfQ, since this is being funded from reserves and accounted for separately. Our actual outturn (year-end position) shows an underspend on expenditure of over £300k. This underspend has been helped by inclusion of receipts from legal cases where we were awarded costs. Our year end position has also been impacted by underspends within salaries and other staff costs. The Strategy and Corporate Affairs directorate has ended the year under spending in key areas such as the Annual Conference and publications.
1,406
2,707
4,0625,240
1,292
2,658
4,021
5,336
1,000
2,000
3,000
4,000
5,000
6,000
Q1 Q2 Q3 Q4
Tre
atm
ent
Fee
s £'
000s
Cum. quarterly treatment income and GIA 2015-16
Budget Actual/Forecast
1,410
2,762
4,014
5,314
1,228
2,462
3,649
4,900
1,000
2,000
3,000
4,000
5,000
6,000
Q1 Q2 Q3 Q4
Exp
end
itu
re £
'000
s
Cum. quarterly expenditure 2015-16
Budget Actual/Forecast

8
Quality and safety of care As agreed previously, the following items are most meaningful when reported on an annual basis. The following items will continue to be presented to the Authority each year in September:
number of risk tool alerts (and themes) common non-compliances (by type) incidents report (and themes).
The following figures and graphs were run on 4 April 2016.
eSET split by private/NHS:
Funding Year
2010 2011 2012 2013 2014 2015 2016
NHS Funded:
Recorded as eSET
4294 4903 6264 7868 8443 9725 2774
7% 8% 10% 13% 13% 15% 18%
Not recorded as eSET
19283 19491 17869 17719 17830 16906 3801
33% 32% 30% 29% 28% 26% 24%
Private:
Recorded as eSET
3422 4629 5699 6857 7736 9309 2576
6% 8% 9% 11% 12% 14% 17%
Not recorded as eSET
31021 31546 30398 29391 29536 29234 6458
53% 52% 50% 48% 46% 45% 41%
Graph: eSET relative % trends NHS/private:
Explanatory text: Showing the total of all reported IVF treatment forms and counting those that the clinics recorded as eSET
As of February data, we have updated the graph to display the relative percentages of eSET for NHS and privately funded cycles, rather than the percentage of all treatments as was previously shown. This relative approach gives a clearer picture, given that the number of overall cycles completed in the private sector is significantly higher than the number of NHS cycles. We have retained the raw figures in the table, so that the ‘all treatment’ numbers can still be seen as well.
0%
5%
10%
15%
20%
25%
30%
35%
40%
45%
2010 2011 2012 2013 2014 2015 2016
NHSFundedeSET
PrivateeSET

9
Unfiltered success rates as % - pregnancies (rather than outcomes, since this provides a better real-time picture):
Years All cycles Pregnancies Pregnancy rate %
2010 58020 16117 27.78
2011 60569 16896 27.9
2012 60230 17453 28.98
2013 61835 18648 30.16
2014 63545 19875 31.28
2015 65174 20445 31.37
2016 15609 2565 16.43
Graph showing the pregnancy rate over recent years
Explanatory text: Looking at all IVF treatment forms, and providing a count of pregnancies - as recorded on the early outcome form.
2016 figures are in grey since it is still quite early in the year, and there is always a lag in reporting pregnancies.
27.78 27.9
28.98
30.16
31.28 31.37
25
26
27
28
29
30
31
32
2010 2011 2012 2013 2014 2015
Pregnancy Rate (%)

10
2. Indicator section Key performance and volume indicators – February data:
Indicator Performance RAG Recent trend1 Aim2 Notes
Setting standards: improving the quality and safety of care through our regulatory activities.
Licensing decisions made:
- By ELP - By Licence
Committee
11 0
No KPI – tracked for workload
monitoring purposes
Volume indicator (no KPI target).
Setting standards: improving the lifelong experience for donors, donor-conceived people, patients using donor conception, and their wider families.
Percentage of Opening the Register requests responded to within 20 working days
100% (23)
Maintain at 100%
KPI: 100% of complete OTR requests to be responded to within 20 working days (excluding counselling time)
1 Blue dashed line in graphs = KPI target level. This line may be invisible when performance and target are identical (eg, 100%). 2 Direction in which we are trying to drive performance. (Are we aiming to exceed, equal, or stay beneath this particular KPI target?)
10
12
3
9
7
11
4
0
5
0 3 0
ELP Licence Committee
33
28
18 17
12
23
100% 100% 100% 100% 100% 100%
0%
20%
40%
60%
80%
100%
0
10
20
30
40
Sep Oct Nov Dec Jan Feb
Number of requests
% OTR requests within 20 days (KPI = 100%)

11
Indicator Performance RAG Recent trend1 Aim2 Notes
Increasing and informing choice: using the data in the Register of Treatments to improve outcomes and research.
See graphs focused on quality of outcomes – after dashboard page.
Increasing and informing choice: ensuring that patients have access to high quality meaningful information.
Number of visits to the HFEA website (compared with previous year) (trend arrow indicates movement since previous month)
129,156
(132,132)
No KPI – tracked for
general monitoring purposes.
Volume indicator showing general website traffic compared to the same period in previous year. Measured on the basis of ‘unique visitors’.
Efficiency, economy and value: ensuring the HFEA remains demonstrably good value for the public, the sector and Government.
Average number of working days taken for the whole licensing process, from the day of inspection to the decision being communicated to the centre.
69 working days
Maintain at
70wd or less
KPI: Less than or equal to 70 working days.
124171
125613
118336
97490
122644129156124849
145444
135210
108872
135778132132
This year
Last year
6459
70
57 58
69
70
40
60
80
100
Sep Nov Jan
12
Indicator Performance RAG Recent trend1 Aim2 Notes
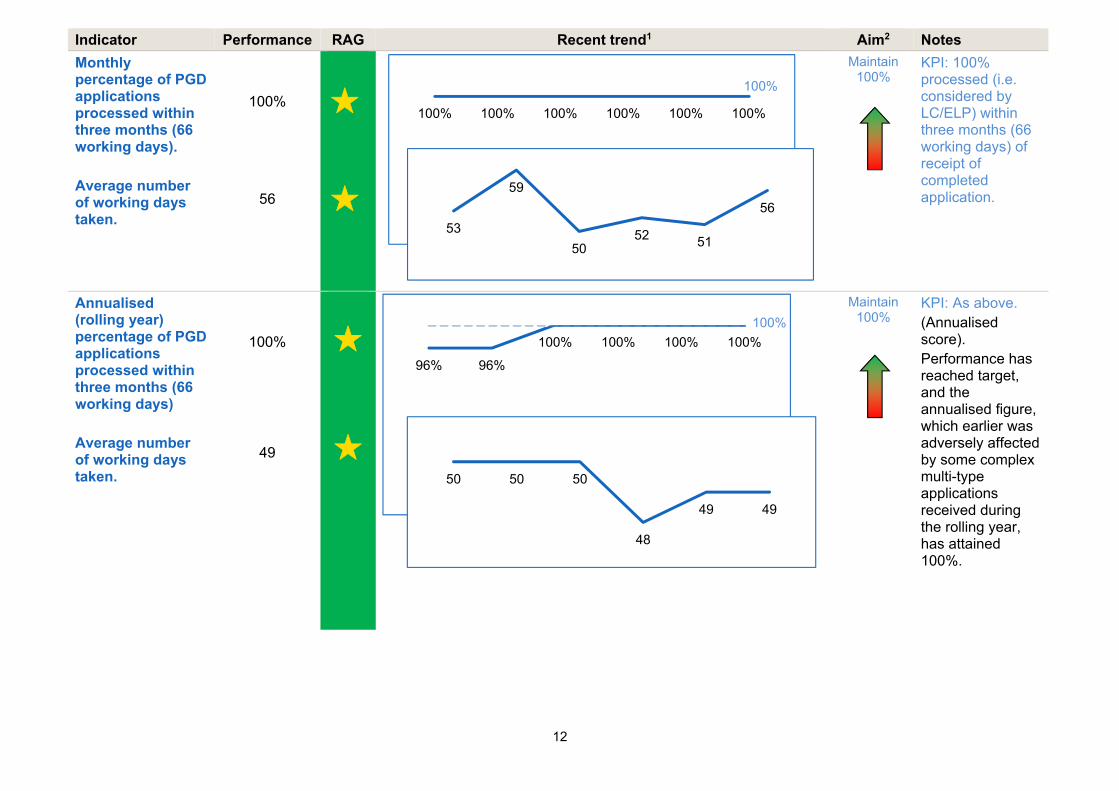
Monthly percentage of PGD applications processed within three months (66 working days). Average number of working days taken.
100%
56
Maintain 100%
KPI: 100% processed (i.e. considered by LC/ELP) within three months (66 working days) of receipt of completed application.
Annualised (rolling year) percentage of PGD applications processed within three months (66 working days) Average number of working days taken.
100%
49
Maintain 100%
KPI: As above. (Annualised score). Performance has reached target, and the annualised figure, which earlier was adversely affected by some complex multi-type applications received during the rolling year, has attained 100%.
96% 96%
100% 100% 100% 100%
100%
100% 100% 100% 100% 100% 100%
100%
53
59
5052 51
56
50 50 50
48
49 49

13
Indicator Performance RAG Recent trend1 Aim2 Notes
Number of requests for contributions to Parliamentary questions
Total = 18
No KPI – tracked for
general monitoring purposes.
Volume indicator. Last year’s numbers were notably high. Many of those PQs related to the work we were then doing on mitochondria. The recent approval of research using the CRISPR-Cas9 gene editing technique has led to multiple requests about this subject.
Number of Freedom of Information (FOI), Environmental Information Regulations (EIR) requests and Data Protection Act (DPA) requests
6
No KPI – tracked for
general monitoring purposes.
Volume indicator. There does not appear to be any trend or predictability in the volume or focus of our FOI (and other) requests.
0 0 2
3
18 18
0 0
11
6
14 14
36
14
0
5
10
15
20
25
30
35
40
Sep Oct Nov Dec Jan Feb
PQs dealt with No. re mitochondria
Same month last year
9 7
7
10
8 6
9
6
9
9 9
11
0
2
4
6
8
10
12
Sep Oct Nov Dec Jan Feb
FOIs etc. dealt with Same month last year

14
Indicator Performance RAG Recent trend1 Aim2 Notes
Staff sickness absence rate (%) per month.
3.2%
Maintain 2.5% or
less
KPI: Absence rate of ≤ 2.5%. Public sector sickness absence rate average is eight days lost per person per year (3.0%).
Commentary: The current absence rate has risen above the KPI, but this is due mainly to long-term sick leave and seasonal illnesses. This has been investigated and does not demonstrate a trend towards problematic sickness absence, though we will continue to monitor this.
Cash and bank balance
£2,378k
Reduce
KPI: To move closer to minimum £1,520k cash reserves (figure agreed with DH). Commentary: March’s balance is approximately 9% below February’s levels, helped by the increase in payment of March purchase invoices. See below for full end-of-year position and commentary.
2.2%
2.8% 2.9%
2.4%
3.2%
3.2%2.5%
0.0%
0.5%
1.0%
1.5%
2.0%
2.5%
3.0%
3.5%
Sep Oct Nov Dec Jan Feb
£2,458 £2,360
£2,557
£2,185
£2,378
£2,157
£1,520
£1,000
£1,200
£1,400
£1,600
£1,800
£2,000
£2,200
£2,400
£2,600
£2,800
Oct Nov Dec Jan Feb Mar
Cash and bank balance KPI

15
Indicator Performance RAG Recent trend1 Aim2 Notes
Management accounts:
March accounts:
Income & Expenditure Account
Accounting PeriodCost Centre NameDepartment Name
Actual YTD
Budget YTD
Variance YTD Forecast Budget Variance
£ £ £ £ £ £Income Grant-in-aid 1,120 1,120 - 1,120 1,120 - Licence Fees 4,216 4,120 96 4,564 4,120 445 Other Income 55 6 49 56 6 50
Total Income 5,391 5,246 145 5,740 5,246 495
Revenue costs - Charged to Expenditure
Salaries 3,654 3,807 153- 3,608 3,807 199- Other Staff costs 221 258 37- 225 258 33- Authority/Committee costs 144 166 22- 150 166 16- Other Compliance costs 56 39 17 61 39 22 Other Strategy costs 100 175 75- 107 175 69- Facilities costs incl non-cash 339 355 16- 359 355 3 IT costs costs 115 106 9 110 106 4 Legal costs 204 340 136- 275 340 65- Professional Fees 67 67 0 80 68 12
Total Revenue costs 4,900 5,313 413- 4,975 5,314 340-
Total Surplus/(Deficit) before Capital & Project costs 491 67- 559 766 69- 834
Capital & Project - Reserves funded
IFQ 683 1,100 417- 633 1,100 467- Donor Support 8 20 12- 8 20 12- Other Capital costs 69 100 31- 69 - 69
TOTAL NET ACTIVITY 760 1,220 1,212- 641 1,120 479-
Mar-2016
Year to Date Full Year

16
Indicator Performance RAG Recent trend1 Aim2 Notes
Commentary:
Summarised management accounts – commentary Q4
Income
January saw treatment fees down against budget by 3%, with February turning around and up by 1%. March saw a positive increase against budget of 2% (£96k). We believe this is due to clinics submitting data late due to issues with submissions in earlier months.
Our year end outturn (actual result) resulted in a 3% increase on budget. We drew down our full grant-in-aid (GIA) for both revenue and capital.
Expenditure
In January we overspent by 1% against budget with overspends in the areas of other staff costs (T&S) within the Compliance directorate, IT and legal costs.
February saw an improvement with underspends totalling £32k, around 8%. There were underspends within salaries, Authority and Committee costs.
At year-end (March 2016), we underspent on our expenditure by 2% (£23k). Salaries due to vacancies were under spent by 4% and were the main reason for this. There were smaller underspends across directorates. Our legal costs were significantly down against budget due to receipts from cases won over the year.
IfQ and other project costs
The costs of IfQ at year-end were removed from the Income and Expenditure Account and transferred to the Balance Sheet. This is because these costs are being capitalised. This means that they will be amortised (released) over a period of time. This is in line with our policy to capitalise anything that releases economic benefit for more than a year.
The year-end position for IfQ was a total cost of £638k which is largely made up of developer/project management and the cost of building the key components of IfQ. The project is expected to incur costs in Q1-3 of the 2016/17 business year. It is expected that these too will be capitalised.

17
IfQ indicators: February update for Beta project phase
Frequency / trigger point
Metric Purpose Latest status:
At programme set-up / major reorganisation / new tranche
MSP health check overall score achieved / maximum score as a %
Is the programme set up to deliver?
January/February update: The MSP health check process was commenced, with interviews taking place with a range of key internal stakeholders. (Final interviews subsequently took place at the end of March 2016, with the final report to be completed by end April 2016.)
Monthly Timescales: Sprint progress and estimate of remaining work.
Is there scope creep/over-run?
January/February update: Work has progressed well through sprints two to sprint seven. There have been continued challenges progressing through the work according to schedule, with the trend of work running over to the following sprint continuing. This has increased the pressure on the last sprints of beta and may have further consequences on the features that are brought forward to user testing and DH/GDS Assessment. This issue is discussed regularly at IfQ Programme Board (which meets monthly).
Monthly Resource usage: The total number of days Reading Room are contracted to provide, vs the number of days consumed to date.
To monitor the rate of resource usage.
January/February updates Reading Room had a total of 257 days allocated to IfQ at HFEA, for Release 1 Beta. This does not include days to be allocated to user testing activities. A total of 215 days have been consumed to the end of beta sprint 6, with 42 days remaining.
215
42
Reading Room Resource - Beta Days Consumed vs Remaining
Days Consumed BetaDays Remaining Beta

18
IfQ indicators: February update for Beta project phase
Frequency / trigger point
Metric Purpose Latest status:
The below graph shows days consumed by sprint, against a pro-rata trend of those days divided equally by the number of sprints in Beta. At the current rate of resource usage, Reading Room will have consumed all their estimated days by the end of Sprint 7. Due to the nature of the capped time and resource contract with Reading Room, they are contractually required to continue building the Beta product at their own cost. This may lead to some requirement for further contractual conversations with Reading Room.
IfQ indicators: February update for Beta project phase
Frequency / trigger point
Metric Purpose Latest status:
Monthly Cost: earned value (% complete * estimated spend at completion)
Is the spend in line with milestone delivery?
There are four things we can attribute value to: websites and CaFC; Clinic Portal; the Register and internal systems; defined dataset, discovery, stakeholder engagement etc. 25% of the value of the 1.8M programme cost at completion has been attributed to each project. January/February update: The graph below indicates that the earned value has been increasing since Beta started in December.
20
59
97
129
174
215
2143
6486
107129
150171
193214
236257
0
50
100
150
200
250
300
Sprint 1 Sprint 2 Sprint 3 Sprint 4 Sprint 5 Sprint 6 Sprint 7 Sprint 8 Sprint 9 Sprint10
Sprint11
Sprint12
Reading Room Resource Beta Burndown Chart (Days)
Cumulative days consumed Available days pro-rata

19
IfQ indicators: February update for Beta project phase
Frequency / trigger point
Metric Purpose Latest status:
At this stage we are not expecting any significant spend untill the end of Beta currently scheduled for June 2016. The following graph shows the earned value starting to increase in January/February. In the separate IfQ item on the agenda, the Authority will receive an update on progress for March.
36.5%38.3% 39.3%
41.3%
47.5%
53.8%44.9%
47.7% 49.0%
59.6%61.3%
64.8%
20.0%
30.0%
40.0%
50.0%
60.0%
70.0%
80.0%
Sep-15 Oct-15 Nov-15 Dec-15 Jan-16 Feb-16
Earned Value Spend to date

20
IfQ indicators: February update for Beta project phase
Frequency / trigger point
Metric Purpose Latest status:
Monthly Stakeholder engagement: combined stakeholder engagement score (internal plus external stakeholder events or communications)
Are we keeping stakeholders with us? Is it getting better or worse?
January: We held two show and tell sessions in January which were well attended by staff. We updated the IfQ intranet pages and distributed some snippets to keep colleagues up to date. The IfQ stakeholder group didn’t take place in January as we decided there wasn’t enough to share with them at this point in the project. Total combined score = 2 February: The IfQ stakeholder group took place in February and went through some of the draft website content. We held one show and tell session. Total combined score = 2
Monthly Risks: sum of risk scores (L x I)
Is overall risk getting worse or better (could identify death by a thousand cuts)?
January/February update: The below line graph represents the overall IfQ risk score, which combines the perceived impact and likelihood of the current risks on hand each month. The overall risk score for the IfQ Programme has increased.
158
106114 119
3823 28 33
0
20
40
60
80
100
120
140
160
180
Dec-15 Jan-16 Feb-16 Mar-16
Inherent RiskScore
Residual RiskScore

21
IfQ indicators: February update for Beta project phase
Frequency / trigger point
Metric Purpose Latest status:
The major risks score are associated with resources, development, timescale, business continuity and data security.
Quarterly Benefits: value (£) of tangible benefits planned to be delivered by the programme
Is the value of the benefits increasing or decreasing – could trigger a review of the business case?
January/February update: The benefits realisation value should be reviewed periodically based on the business case; this will be looked at by IfQ Programme Board. No issues have been raised regarding benefits realisation to date.
0 1 2 3 4 5
Resources
Quality
Development
Timescales
Design
Reputation
Clinic Costs
Stakeholder Engagement
Service transition
Business Continuity
Data security
Operational
Programme
1-Insignificant
2-Minor
3-Moderate
4-Major