strategic journey to a groupe danone acceleration of a...
TRANSCRIPT
1
Groupe Danone Acceleration of a proven model
Boca Raton - Miami, Feb 20th 2008
2008 Consumer Analyst Group of New York
Strategic journey to a 100% healthy food portfolio
Emmanuel FABER
Co-Chief Operating Officer
2
DisclaimersDisclaimers
This document contains certain forward-looking statements concerning Groupe DANONE. Although Groupe DANONE believes its expectations are based on reasonable assumptions, these forward-looking statements are subject to numerous risks, which could cause actual results to differ materially from those anticipated in these forward-looking statements. For a detailed description of these risks and uncertainties, please see the sections “Risks Factors” in Groupe DANONE’s Annual Report (which is available on www.danone.com).
Groupe DANONE undertakes no obligation to publicly update or revise any of these forward-looking statements.
This document does not constitute an offer to sell, or a solicitation of an offer to buy, Danone shares.
This document does not constitute an (extension of any) offer or invitation to purchase any securities of Numico B.V (formerly Royal Numico N.V.) and nothing contained herein shall form the basis of any contract or commitment whatsoever.
3
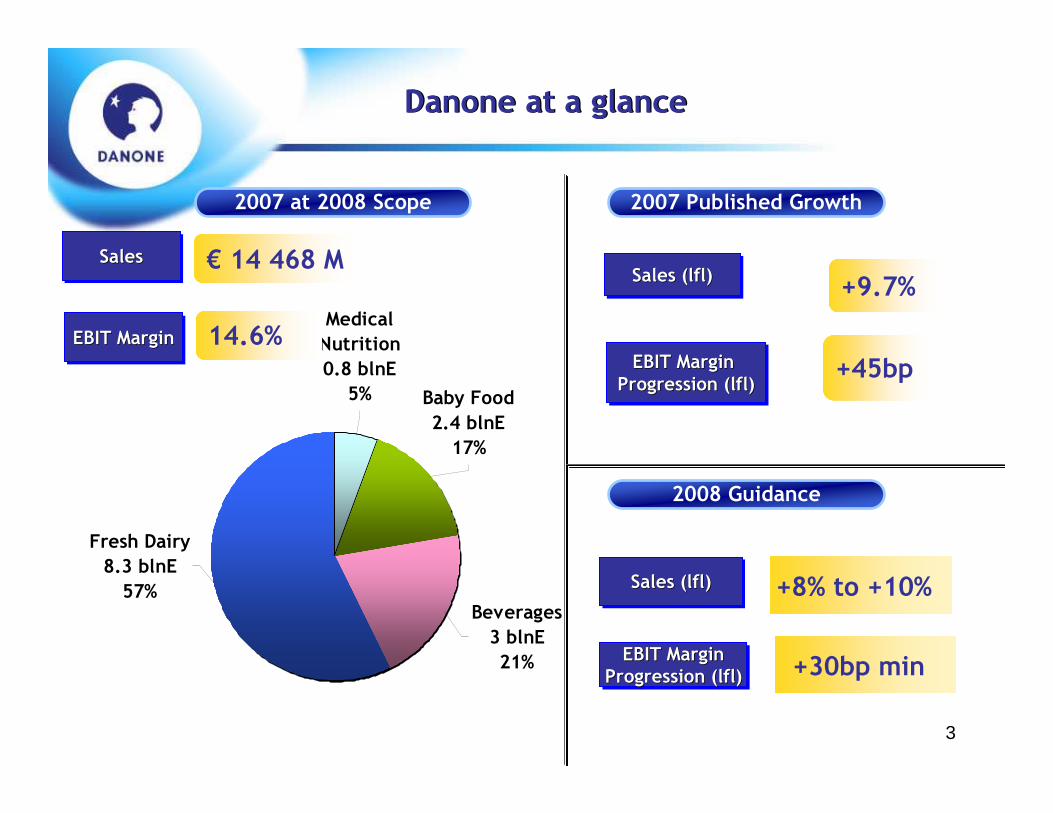
SalesSalesSales
Baby Food
2.4 blnE
17%
Medical
Nutrition
0.8 blnE
5%
Fresh Dairy
8.3 blnE
57%Beverages
3 blnE
21%
EBIT MarginEBIT EBIT MarginMargin
€ 14 468 M
14.6%
2007 at 2008 Scope
Sales (lfl)Sales (Sales (lfllfl))
EBIT MarginProgression (lfl)
EBIT EBIT MarginMargin
Progression (Progression (lfllfl))
+9.7%
+45bp
+8% to +10%
2007 Published Growth
2008 Guidance
Sales (lfl)Sales (Sales (lfllfl))
+30bp minEBIT MarginProgression (lfl)
EBIT EBIT MarginMargin
Progression (Progression (lfllfl))
Danone at a glanceDanone at a glance
4
The unique capacity to be inspired
by a powerful mission
To bring health through food to the largest number of people

5
1997 – 2006: Total Shareholder Return(1) +17% exceeding our peer group(2) average of 10%
10 Years of Shareholder Value Creation
Business 1997-2006Yearly progression
(1) Source Bloomberg, in local currency(2) Nestlé, Unilever, Cadbury, General Mills, Pepsico, Coke, Kellogg, Danone(3) On like-for-like basis
Sales Growth CAGR(3) +6.2%
EBIT yearly average +42 bp
FCF CAGR +12%
ROIC yearly average +115bp

6
1997 – 2006: Total Shareholder Return(1) +17% exceeding our peer group(2) average of 10%
Strategy 1997-2006
10 Years of Shareholder Value Creation
(1) Source Bloomberg(2) Nestlé, Unilever, Cadbury, General Mills, Pepsico, Coke, Kellogg, Danone
Disposals +9.9 blnE
Dividends (3.6) blnE
Share Buy Back (5.8) blnE
Acquisitions (8.8) blnE
Net Financial Debt 2006 nil

7
A healthy geographic portfolio management
Eastern
Europe
11%
Asia
17%
Latin
America
11%
North
America
9%Other
2%France
21%
Rest
Western
Europe
29%
Rest
Western
Europe
39%
France
38%
Other
1%
North
America
6%
Latin
America
7%
Asia
7%
Eastern
Europe
2%
1996 2006
8
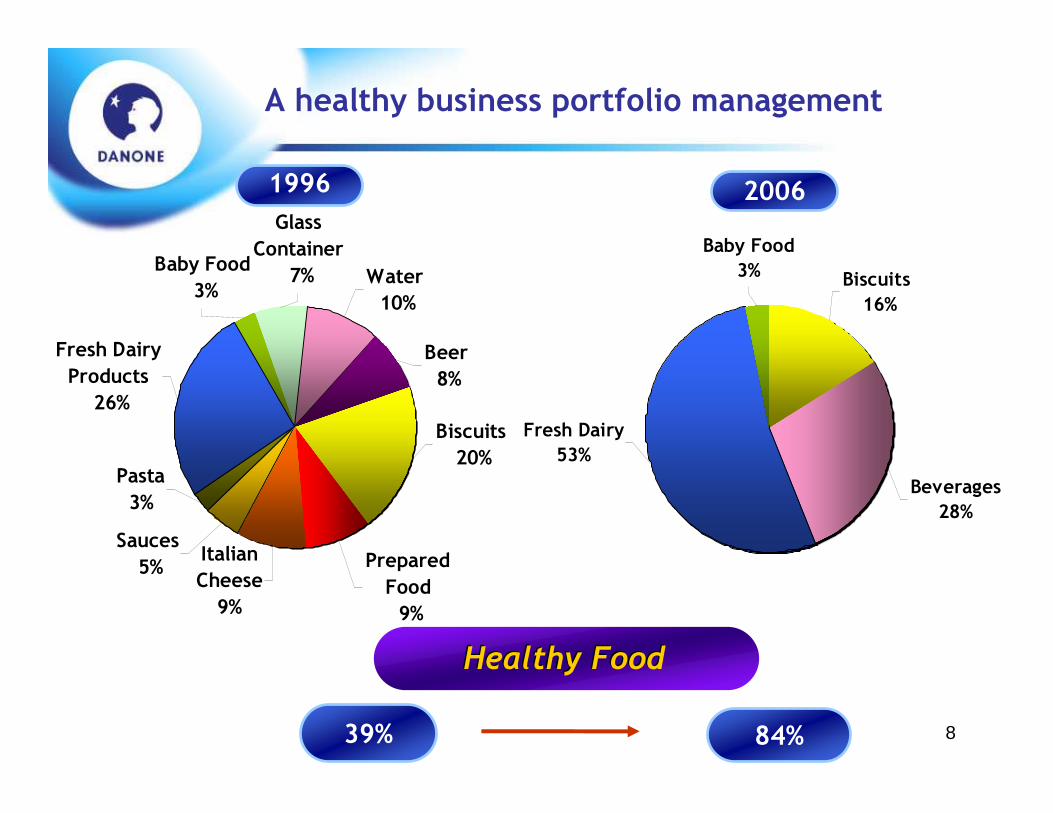
A healthy business portfolio management
Healthy FoodHealthy Food
39% 84%
Baby Food
3%
Fresh Dairy
53%
Beverages
28%
Biscuits
16%
1996 2006
Fresh Dairy
Products
26%
Prepared
Food
9%
Biscuits
20%
Beer
8%
Water
10%
Glass
Container
7%Baby Food
3%
Italian
Cheese
9%
Pasta
3%
Sauces
5%

9
~1900M€ ~1100M€ ~500M€ ~500M€
Danone is the global expert in providing
Health through Food
2007 Sales

10
SALES GROWTH (2) BY REGION (2006)SALES BY SEGMENT (2006)
20,0%
10,9%
22,0%
12,0%6,0%
NorthernEurope
SouthernEurope
EasternEurope
Rest ofthe World
TotalGroup
Medical Nutrition
65%
Disease Targeted Nutrition
35%
SALES GROWTH (2) BY REGION (2006)
20,0% 20,0%
12,2%
22,0%
3,0%
WesternEurope
EasternEurope
Dumex Rest of theWorld
Total Group
Rest of the World5%
Western Europe
56%
Asia-Pacific25%
Eastern Europe
14%
KE
Y
FIN
AN
CIA
LSB
RE
AK
DO
WN
BABY FOOD CLINICAL NUTRITION
Sales 2006: €1,880mEBITA: €340mMargin: 18.1%
Sales 2006: €743mEBITA: €192mMargin: 25.8%
72%72%
28%28%
NUMICO
Sales 2006: €2,623mEBITA 2006 (1): €483mMargin (%): 18.4%Employees: 12,888
(1) Including central overheads / headquarter costs of (49)M€(2) Excluding exceptional items and on a comparable basis
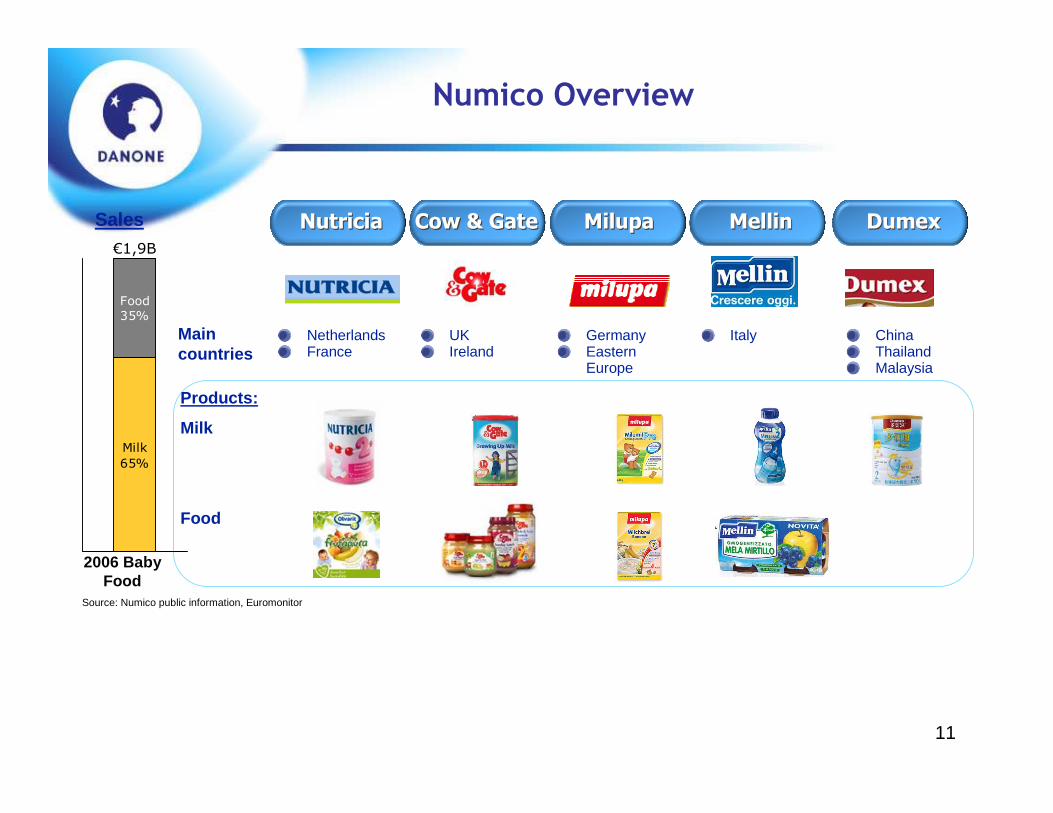
Numico Overview
11
Main countries
Products:
Milk
Food
NetherlandsFrance
UKIreland
GermanyEastern Europe
Italy ChinaThailandMalaysia
2006 Baby Food
NutriciaNutricia Cow & GateCow & Gate MilupaMilupa MellinMellin DumexDumexSales
Source: Numico public information, Euromonitor
Food
35%
Milk
65%
€1,9B
Numico Overview
12
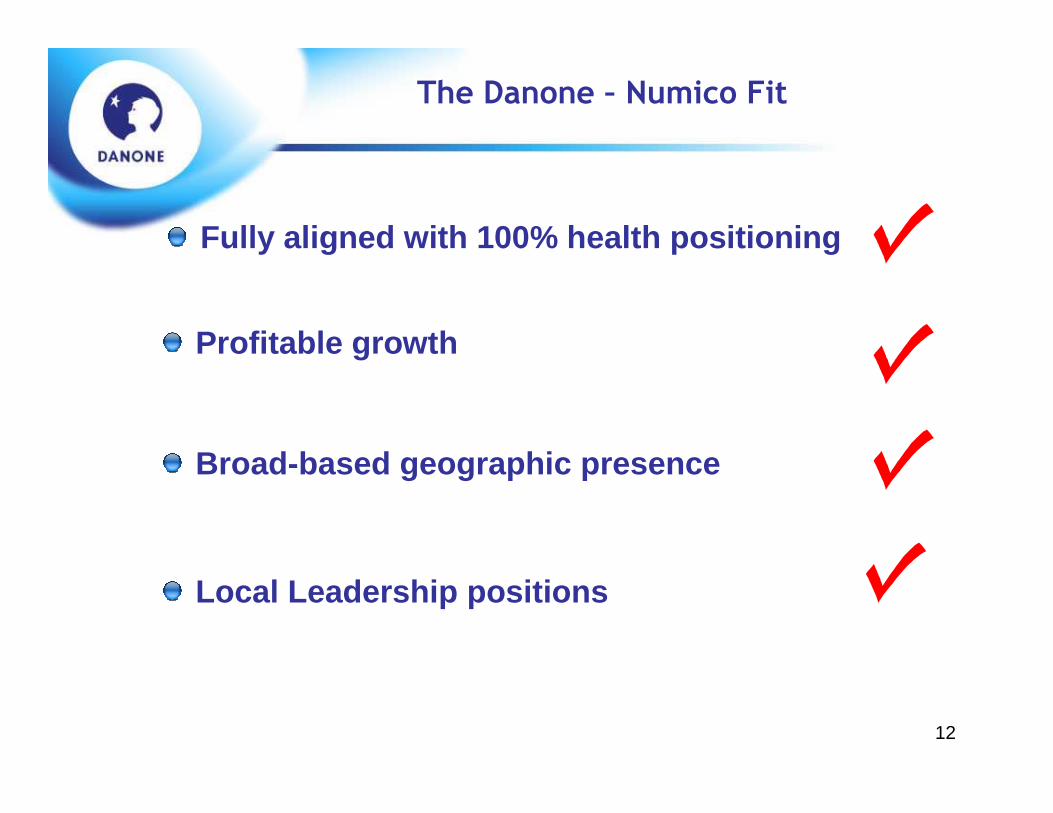
Local Leadership positions
Broad-based geographic presence
Profitable growth
Fully aligned with 100% health positioning
The Danone – Numico Fit

13
Healthy FoodHealthy Food
84% 100%
2006 2007 Pro-Forma
Danone + Numico: 100% Health Story
Baby Food
3%
Fresh Dairy
53%
Beverages
28%
Biscuits
16%
Baby Food
2.4 blnE
17%
Medical
Nutrition
0.8 blnE
5%
Fresh Dairy
8.3 blnE
57%Beverages
3 blnE
21%
2007 at 2008 Scope

14
9.7%9.7%5.1% 6.0% 7.2% 7.8% 6.7% 7.2%
2001 2002 2003 2004 2005 2006 2007OpeningScope
2007
Top-line growth well within our targeted
range in FY 2007
+6%
+8%
Like-for-like sales growth
IFRS
+7%
+5%

15
Q1 Q2 Q3 Q4 FYTrading Operating
Margin Progression
Published Scope 11.0% 7.5% 7.7% 13.1% 9.7% +45bp
Opening Scope 10.1% 7.3% 3.9% 7.7% 7.2% +59bp
2007 Sales and Trading Operating Marginprogression at high-end of our guidance
Like-for-like sales growth
Published Scope: Dairy and Beverages (with Wahaha H1 only)
Opening Scope: Dairy, Biscuits (11 months) and Beverages (with Wahaha FY)

16
Fresh DairyFresh DairyDivisionDivision

17
Fresh Dairy – Key Figures
2007 Vs. 2006*
Net Sales (m€) 8,791 +12.2% 8,299
Trading Operating Income (m€) 1,229 +62bp 1,133
Trading Operating Income margin 14.0% 13.6%
* On like-for-like basis
L-f-L Sales Growth
2007 PF
7.2%4.6%
9.8%7.8% 6.7%
9.3% 5.0%2.2%
3.4% 5.2%
Q1 Q2 Q3 Q4 FY
ValueVolume
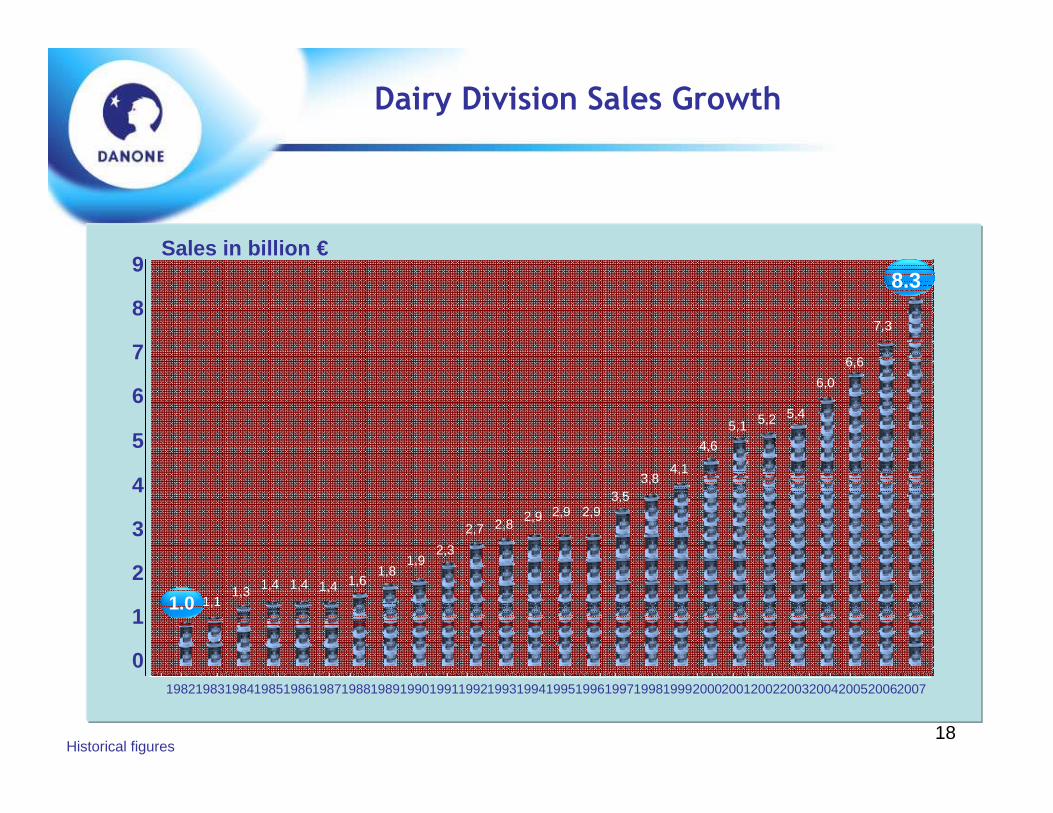
18
0
1
2
3
4
5
6
7
8
9
1.0 1,11,3 1,4 1,4 1,4 1,6
1,81,9
2,3
2,7 2,82,9 2,9 2,9
3,53,8
4,1
4,6
5,1 5,2 5,4
6,0
6,6
7,3
Sales in billion €
Historical figures
19821983198419851986198719881989199019911992199319941995199619971998199920002001200220032004200520062007
8.3
Dairy Division Sales Growth

19
Dairy Operating Margin Growth
Operating margin in billion €
0
0.2
0.4
0.6
0.8
1.0
1.2
1997 1998 1999 2000 2001 2002 2003 2004 2005 2006 2007
0.40.4
0.50.5
0.7 0.70.8
0.80.9
1.0
>1.1

20
Activia Global Model
DIAMOND
Brand Name
Demo
Key Audio- Selling line: “Regulatesinside and it shows outside”
- Music: “Barcarola” by Offenbach
Icons Brand Block
Advertising signature
Naturally regulates the digestive disorders caused by stress & bad eating(digestive disorder conso wording & relevant insights adapted to each country)
RW:Acti-Regularis, Bifidus Regularis
Brand Personality :
Reliable, confident &friend
Benefit:Activia naturally regulates
digestive disorders in 15 days
Target:Women with digestive disorders
Insight:Stress and bad eating can create digestive
disorders which have negative impact on our well being (bloated feeling, cave mentality)
GLOBAL = BACKBONE GLOBAL
POSITIONING RW SCIENCECOMMUNICATION
STRUCTUREPACK/ICON

21
Activia Global Model
LOCAL = DRESS CODE
POSITIONINGCLUSTER RANGE
COMMUNICATION INSIGHTS & SELLING IDEAS
FRANCEYOGURTF. CHEESE
POLANDYOGURTF.CHEESE
MEXICODRINKSYOGURT
AUSTRIAYOGURTKEFIR

22
Activia Value Market Share on Total Dairy Market
Proven Potential to 16%
0%
2%
4%
6%
8%
10%
12%
14%
16%
18%
Cze
chR
ep.
Rom
ania
Can
ada
Slo
vaki
a
Bul
garia
Italy
Spa
in
Bal
tics
Bra
zil
Por
tuga
l
Rus
sia
Fra
nce
Irel
and
Slo
veni
a
Hun
gary
Arg
entin
a
Bel
gium U
S
Mex
ico*
Pol
and
Aus
tria
Can
ary
Isla
nds
UK
Fin
land
Japa
n
Ger
man
y
Alg
eria
Sau
diA
rabi
a
Gre
ece
Net
herla
nds
Tur
key
Sw
itzer
land

23
Per capita consumptionFrom 1 cup a month to one cup a week
0
10
20
30
40

24
WatersWatersDivisionDivision

25
Waters Division – Key Figures
2007 vs. 2006*
Net Sales (m€) 3,535 +4% 2,958
Trading Operating Income (m€) 480 +1bp 425
Trading Operating Income margin 13.6% 14.4%
* On like-for-like basis
L-f-L Sales Growth
2007 PFat 2008
11.8% 12.4%14.9%
21.7%
9.1%
0.9%
-3.3%
10.8%
Q1 2006 Q2 2006 Q3 2006 Q4 2006 Q1 2007 Q2 2007 Q3 2007 Q4 2007
Without Wahaha +6.8% +5.8% +8.2% +10.5% +9.7% +9.0% -3.3% +10.8%

26
Leading Water Brands
USAUSA
Mexico Mexico NN°°11
Argentina NArgentina N °°11
IndonesiaIndonesia NN°°11
Spain NSpain N °°11
France NFrance N °°22
TurkeyTurkey NN°°11
Germany NGermany N °°11StillStill waterwater
UK NUK N°°11
PolandPoland NN°°11
China NChina N °°11
JapanJapan NN°°11
27
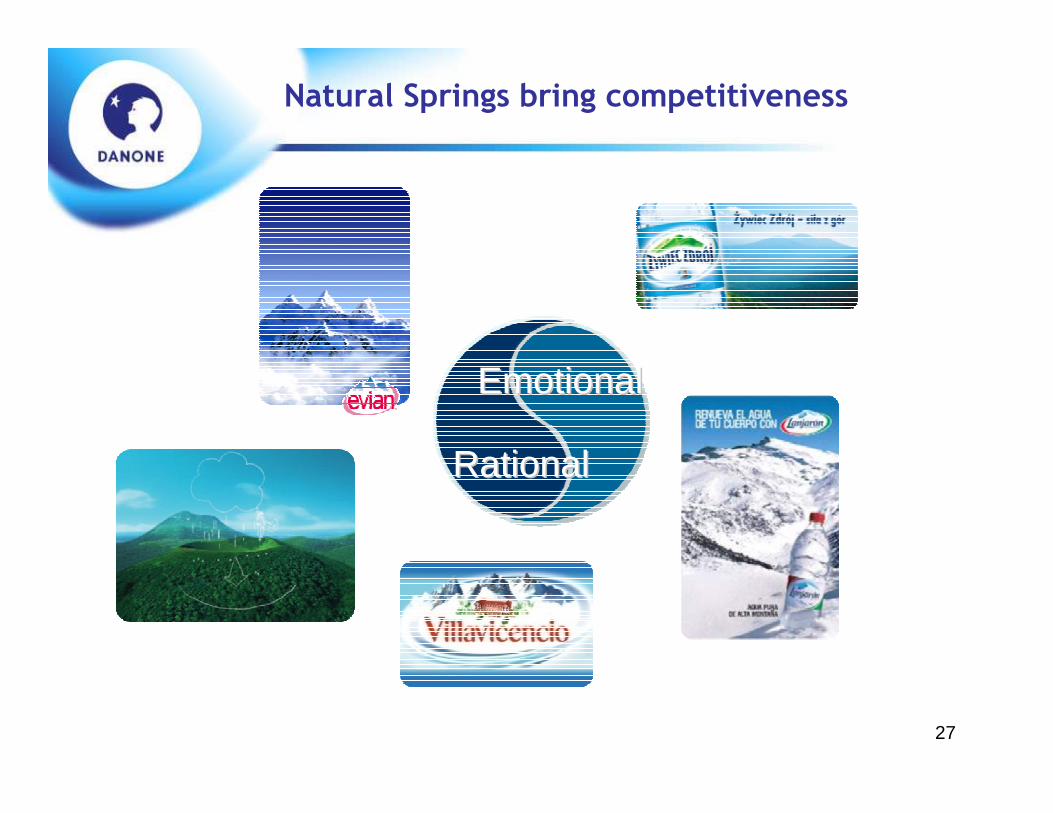
Natural Springs bring competitiveness
EmotionalEmotional
RationalRational
28
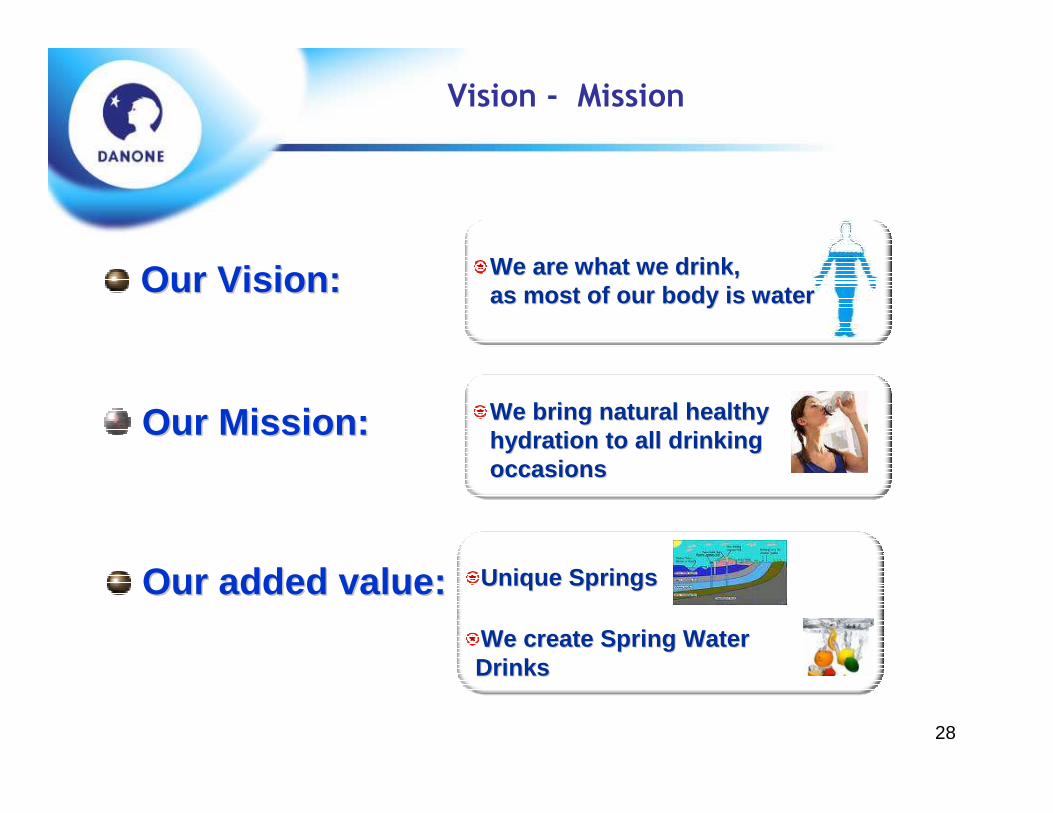
Vision - Mission
Our Mission:Our Mission: WeWe bringbring naturalnatural healthyhealthyhydrationhydration to all to all drinkingdrinkingoccasionsoccasions
Our Vision:Our Vision: WeWe are are whatwhat wewe drink, drink, as as mostmost of of ourour body body isis waterwater
Unique SpringsUnique SpringsOur Our addedadded value:value:We create Spring Water We create Spring Water Drinks Drinks

29
Spring Water Focus: the Brand Platforms
Relevant rational Relevant rational benefitbenefit
StrongStrong emotionalemotionalBenefitBenefit
EmotionalEmotional
RationalRational
Lightness/Lightness/EliminationElimination
Vitality / Deep Vitality / Deep HydrationHydration
Youth/Body Youth/Body RenewalRenewal
BodyBodyManagementManagement

30
ydratingydrating
rinkablerinkable
aturalatural
31
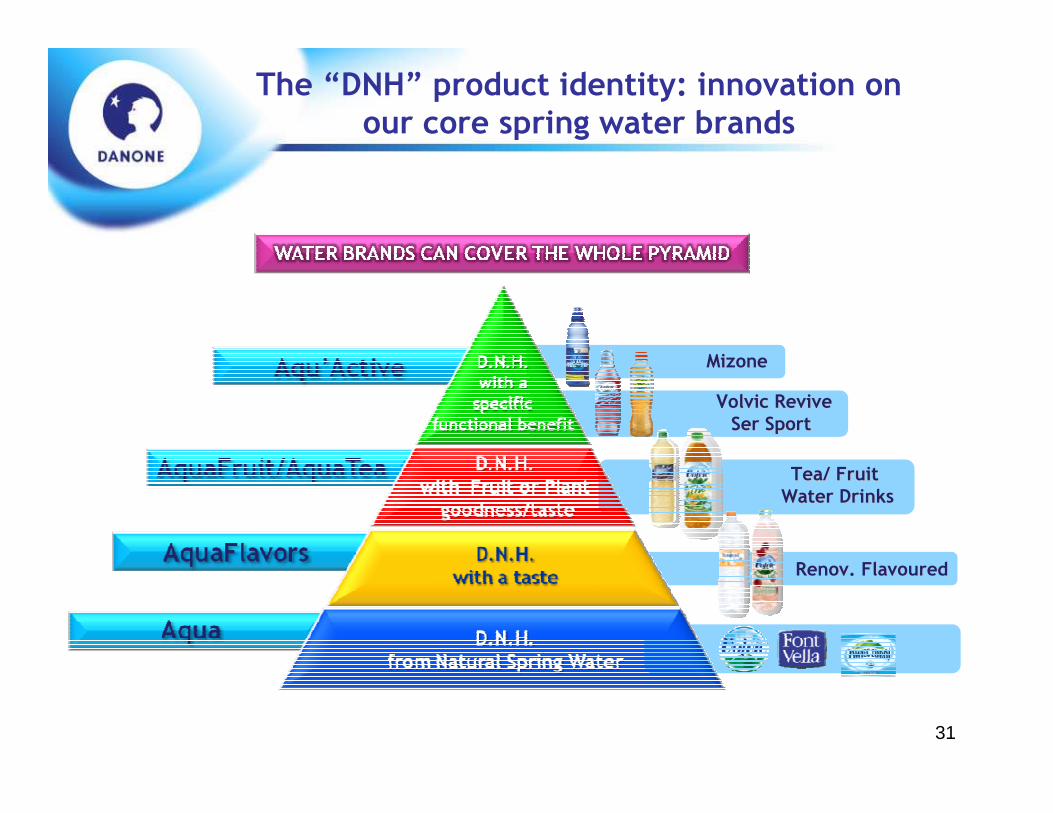
The “DNH” product identity: innovation on our core spring water brands
MizoneMizone
VolvicVolvic ReviveRevive
Ser Sport Ser Sport
Tea/ Fruit Tea/ Fruit
Water DrinksWater Drinks
RenovRenov. . FlavouredFlavoured

32
Sustainable Development as part of our Water Business Model
Further increase rail & boat transport
Continue to further decrease PET weight / Bottle
Reduce plastic waste
Strong know-how on natural sources protection
Engagement in local communities
Use of our expertise for Social initiatives around Water
33
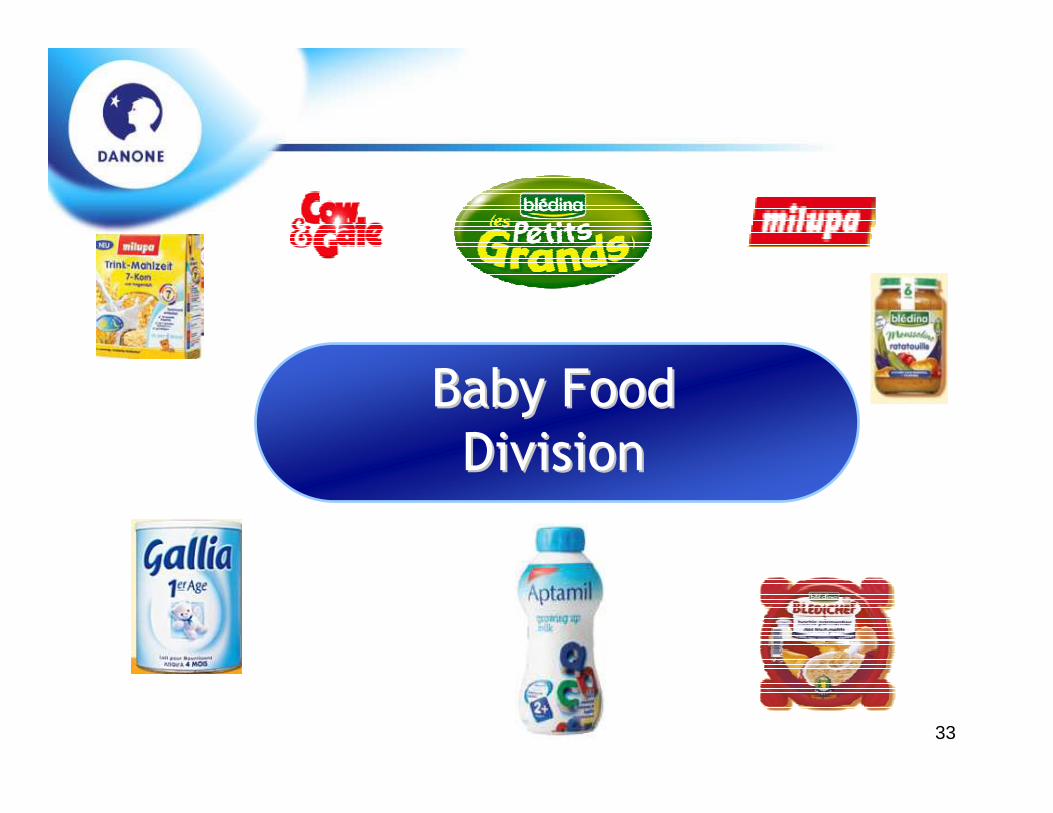
Baby FoodBaby FoodDivisionDivision

34
Baby Food – Key Figures
Net Sales (m€) 2,417
Trading Operating Income (m€) 373
Trading Operating Income margin ca. 15.4%
Numico Only
L-f-L Sales Growth
2007 PF*
* Central costs allocation is estimated (based on historical keys)
4.7%
-0.9%
5.4% 7.8% 8.2%
4.9%
5.0% 2.6%
3.7% 4.0%
Q1 Q2 Q3 Q4 FY
Sales impacted by managed
reduction of in-trade stock-levels+8%
+11.5%+12.2%
+4.0%
+9.7%
Value
Volume

35
A crucial period: between 0 and 3 years, babies double their size and increase their weight fivefold
Weight x 5Size x 2
Brain increases by 2g each day
Progressive digestive, kidney and immunity maturation
baby growth curve from 0 and 36 monthssize (cm)
100
75
50
newborn baby 1 year 2 years age
Source: internal data

36
Babies and toddlers need a specific and adapted diet
Birth 3 years12 months6 months
100% Breast-milk/infant milk
Milk exclusively
Progressive diversification with adapted nutrition
Cereals
Fruits & Veg
Meals
Biscuits
Juices
Follow-on milk
Growthmilk
Fresh Dairy Products
Source: internal data

37
Babies and toddlers nutrition today: a major growth opportunity
9
82
9
Breastfeeding
Home made food
10
42
310
42
45
9
82
9
Adult food
Baby food
6 - 15 Months 16 - 36 Months
% of food intakeFrench example
Source consumption diaries : % of acts of consumption according to the origin of the products

38
Baby Food: a €18B market
06-11 growth
6% 2% 4% 7% 6%
Bottled water Sauces,dressings, condiments
Fresh Dairy Functional drinks Baby Food
Market sizes (€B)
Source: Euromonitor, external sources

39
A highly attractive business: significant growth rates…
Source: Euromonitor, internal data, Baby Food players public information
Australasia
2006
€18B
0
20
40
60
80
100%
Baby Food market
BabyFoodmarket
Blédina
BabyFoodmarket
Numico
France UK
2%
6%
2%
10%+
2006 Baby Food growth
AME
Especially in Asia and Eastern Europe…
Especially in Asia and Eastern Europe…
… With potential also in developed countries
… With potential also in developed countries

40
…Highly profitable and with high entry barriers….
High profitability High profitability High entry barriersHigh entry barriers
Milk & Foodplayers
Milk players
Baby Food playermargin (%)
Source: Baby Food public information, brokers, Nielsen
2%Baby Food
Alcoholicbeverages
confectionnery
Non alcoholicbeverages
Yogurt
Shelfstable food
Pet food
Frozen food
2%6%
9%12%
15%19%
21%25%
0 5 10 15 20 25 30%WW Private Labels market share

41
Australasia
Mid. East/Afr.
East. Eur.
Latam
Asia
North
America
Western
Europe
Baby food
2005
sales ($M)
2005 Number
of newborn
babies (Mil)
22,357 93
Note: 2005 fixed exchange rate and 2005 constant pricesSource: Euromonitor data
Asia accounts for 65% of newborn babies while only 25% of baby food
sales
…A baby boom in Asia….

42
…and with significant growth potential
WW average20kg
France
WesternEurope
NorthAmerica
EasternEurope
Latin America
AMEA
APac
0 50 100 150 200 250Per capita consumption (kg/ baby)
Source: Euromonitor, External data – APac: Asia Pacific

43
The New Danone Baby Food business: the 2nd global player with leading regional positions
W. EuropeW. Europe E. EuropeE. Europe AsiaAsia Africa Middle East
Africa Middle East
Numico + Blédina Baby Food positionsNumico + Blédina Baby Food positions

44
Medical NutritionMedical NutritionDivisionDivision

45
Medical Nutrition – Key Figures
Net Sales (m€) 793
Trading Operating Income (m€) 173
Trading Operating Income margin ca. 21.8%
L-f-L Sales Growth
2007 PF*
12.0%9.2%
12.6% 12.0% 11.4%
1.5% 3.1% 2.6%
1.0%
1.4%
Q1 Q2 Q3 Q4 FY
+14.1%+15.1%
+14%
+10.2%
+13.4%
ValueVolume
* Central costs allocation is estimated (based on historical keys)

46
Strong Market Positions
Brazil
Argen-tina
China
Australia
New Zealand
11

47
We Have Two Distinct Businesses
Medical Nutrition
Disease Targeted Nutrition

48
Medical Nutrition treats malnutritionfor various conditions
Dementia
Inability to eat (stroke)
Surgery
Swallowing disorders
Cancer
Diabetes

49
Disease Targeted Nutrition
Severe Cow’s Milk Allergies
Metabolic Diseases
Paediatrics
Epilepsy
Alzheimers ?HIV ?

50
Key Channels for disease targeted nutrition

51
A Critical Social Mission
Ageing population
Lifestyle diseases exploding
Growing role of Nutrition in disease management and prevention
Industry in its infancy and growing at a fast rate

52
€ 14 468 M
14.6%
Baby Food
2.4 blnE
17%
Medical
Nutrition
0.8 blnE
5%
Fresh Dairy
8.3 blnE
57%Beverages
3 blnE
21%
The New Danone
SalesSalesSales
EBIT MarginEBIT EBIT MarginMargin

53
9.7%9.7%5.1% 6.0% 7.2% 7.8% 6.7% 7.2%
2001 2002 2003 2004 2005 2006 2007OpeningScope
2007
Accelerated Top-line Growth
+6%
+8%
IFRS
+7%
+5%
Like-for-like sales growth
2008
+8%
+10%

54
Sales growth*
Enhanced mid-term financial performance objectives
< 2006
2007
2008+
+6% to + 8%
+5% to +7%
+8% to +10%
*: On like-for-like basis

55
Trading Operating Profit *
For 2008 +30bp minimum
To grow faster than like-for-like sales growth
Trading Operating Margin *
To improve every year
Underlying EPS Growth
For 2008> +15%
vs 2007 Pro forma
*: On like-for-like basis
Enhanced mid-term financial performance objectives

56
Groupe Danone Acceleration of a proven modelStrategic journey to a
100% healthy food portfolio

57
• Film (60 sec)