strategic framework and q2 2018 results
TRANSCRIPT

STRATEGIC FRAME WORK AND
Q2 2018 RESULTS
A m s te r da m , 2 A u g u s t 2 0 1 8

2Q 2 2 0 1 8 R E S U L T S
Agenda
GROUP FINANCIAL RESULTS
COUNTRY RESULTS
OVERVIEW AND PRIORITIES
OPENING
FINAL REMARKS
Richard James - Head of IR
Ursula Burns - Executive Chairman
Trond Westlie - CFO
Kjell Johnsen - COO
Q&A
Ursula Burns - Executive Chairman

3
This presentation contains “forward-looking statements”, as the phrase is defined in Section 27A of the U.S. Securities Act of 1933, as amended, and Section 21E of the U.S. Securities Exchange Act of 1934, as amended. These forward-
looking statements may be identified by words such as “may,” “might,” “will,” “could,” “would,” “should,” “expect,” “plan,” “anticipate,” “intend,” “seek,” “believe,” “estimate,” “predict,” “potential,” “continue,” “contemplate,” “possible” and
other similar words. Forward-looking statements include statements relating to, among other things, VEON’s plans to implement its strategic priorities, including operating model and development plans, among others; anticipated
performance and guidance for 2018 and 2019, including VEON’s ability to generate sufficient cash flow; future market developments and trends; operational and network development and network investment, including expectations
regarding the roll-out and benefits of 3G/4G/LTE networks, as applicable; the effect of the acquisition of additional spectrum on customer experience; VEON’s ability to realize the acquisition and disposition of any of its businesses and
assets; VEON’S ability to realize financial improvements, including an expected reduction of net pro-forma leverage ratio following the successful completion of certain dispositions and acquisitions; and VEON’s ability to realize its
targets and strategic initiatives in its various countries of operation. The forward-looking statements included in this presentation are based on management’s best assessment of VEON’s strategic and financial position and of future
market conditions, trends and other potential developments. These discussions involve risks and uncertainties. The actual outcome may differ materially from these statements as a result of demand for and market acceptance of VEON’s
products and services; continued volatility in the economies in VEON’s markets; unforeseen developments from competition; governmental regulation of the telecommunications industries; general political uncertainties in VEON’s
markets; government investigations or other regulatory actions; litigation or disputes with third parties or other negative developments regarding such parties; risks associated with data protection or cyber security, other risks beyond
the parties’ control or a failure to meet expectations regarding various strategic priorities, the effect of foreign currency fluctuations, increased competition in the markets in which VEON operates and the effect of consumer taxes on the
purchasing activities of consumers of VEON´s services. Certain other factors that could cause actual results to differ materially from those discussed in any forward-looking statements include the risk factors described in VEON’s Annual
Report on Form 20-F for the year ended December 31, 2017 filed with the U.S. Securities and Exchange Commission (the “SEC”) and other public filings made by VEON with the SEC. Other unknown or unpredictable factors also could
harm our future results. New risk factors and uncertainties emerge from time to time and it is not possible for our management to predict all risk factors and uncertainties, nor can we assess the impact of all factors on our business or the
extent to which any factor, or combination of factors, may cause actual results to differ materially from those contained in any forward-looking statements. Under no circumstances should the inclusion of such forward-looking statements
in this presentation be regarded as a representation or warranty by us or any other person with respect to the achievement of results set out in such statements or that the underlying assumptions used will in fact be the case. Therefore,
you are cautioned not to place undue reliance on these forward-looking statements. The forward-looking statements speak only as of the date hereof. We cannot assure you that any projected results or events will be achieved. Except to
the extent required by law, we disclaim any obligation to update or revise any of these forward-looking statements, whether as a result of new information, future events or otherwise, after the date on which the statements are made, or
to reflect the occurrence of unanticipated events. Non-IFRS measures are reconciled to comparable IFRS measures in VEON Ltd.’s earnings release published on its website on the date hereof.
VEON Ltd. owns a 50% share of the Italy Joint Venture (with CK Hutchison owning the other 50%) and we account for this JV using the equity method as we do not have control. All information related to the Italy Joint Venture is the sole
responsibility of the Italy Joint Venture’s management, and no information contained herein, including, but not limited to, the Italy Joint Venture’s financial and industry data, has been prepared by or on behalf of, or approved by, our
management. As a result of this, we do not provide any reconciliations for non-IFRS measures for the Wind Tre Joint Venture. For further information on the Italy Joint Venture and its accounting treatment, see "Explanatory Note—
Presentation of Financial Information of the Italy Joint Venture" included in our Annual Report on Form 20-F for the year ended 31 December 2017 and notes 5, 14 and 25 to our audited consolidated financial statements filed therewith.
All non-IFRS measures disclosed further in this presentation (including, without limitation, EBITDA, EBITDA margin, EBT, net debt, equity free cash flow, organic growth, capital expenditures excluding licenses and LTM (last twelve months)
capex excluding licenses/revenue) are reconciled to comparable IFRS measures in VEON Ltd.’s earnings release published on its website on the date hereof. In addition, we present certain information on a forward-looking basis
(including, without limitation, the expected impact on revenue, EBITDA and equity free cash flow from the consolidation of the Euroset stores after completing the transaction ending the Euroset joint venture). We are not able to, without
unreasonable efforts, provide a full reconciliation to IFRS due to potentially high variability, complexity and low visibility as to the items that would be excluded from the comparable IFRS measure in the relevant future period, including,
but not limited to, depreciation and amortization, impairment loss, loss on disposal of non-current assets, financial income and expenses, foreign currency exchange losses and gains, income tax expense and performance transformation
costs, cash and cash equivalents, long - term and short-term deposits, interest accrued related to financial liabilities, other unamortized adjustments to financial liabilities, derivatives, and other financial liabilities.
Disclaimer
Q 2 2 0 1 8 R E S U L T S

4Q 2 2 0 1 8 R E S U L T S
Agenda
GROUP FINANCIAL RESULTS
COUNTRY RESULTS
OVERVIEW AND PRIORITIES
OPENING
FINAL REMARKS
Richard James - Head of IR
Ursula Burns - Executive Chairman
Trond Westlie - CFO
Kjell Johnsen - COO
Q&A
Ursula Burns - Executive Chairman

5Q 2 2 0 1 8 R E S U L T S
Full Year 2018 guidance reaffirmed
1 Organic change is a non-IFRS measure and reflects changes in revenue and EBITDA. Organic change excludes the effect of foreign currency movements and other factors, such as businesses under liquidation, disposals, mergers and acquisitions. In H1 2018 organic growth is calculated at constant currency
and excludes the impact from Euroset transaction. See attachment in the earnings release for reconciliations2 Equity free cash flow excluding licenses is a non-IFRS measure and is defined as free cash flow from operating activities less cash flow used in investing activities, excluding M&A transactions, capex for licenses, inflow/outflow of deposits, financial assets and other one-off items
TO TA L R E V E N U E
( U S D )
E B I TD A
( U S D )
E Q U I TY F CF
E X C L . L I C E N S E S 2
( U S D )4.5bn 1.7bn 540m+3.1% organic1 YoY
-3.8% reported YoY -4.5% reported YoY +71.7% reported YoY
H1 2018
+5.5% organic1 YoY

6Q 2 2 0 1 8 R E S U L T S
Executing at pace on our near term priorities
Emerging
markets
focus
Simplified
structure
Strong
balance
sheet
Progressive
dividends
Sale of Italy joint venture for a total cash consideration of EUR 2.45 billion
(~USD 2.9 billion1) expected to complete in Q3 or early Q4 2018
Offer to acquire businesses in Pakistan and Bangladesh
Lean, high-level operating model now established
Effective and efficient corporate structure
being introduced
CEO search is progressing
Digital agenda
Greater value for our shareholders
1 USD/EUR = 1.17
7
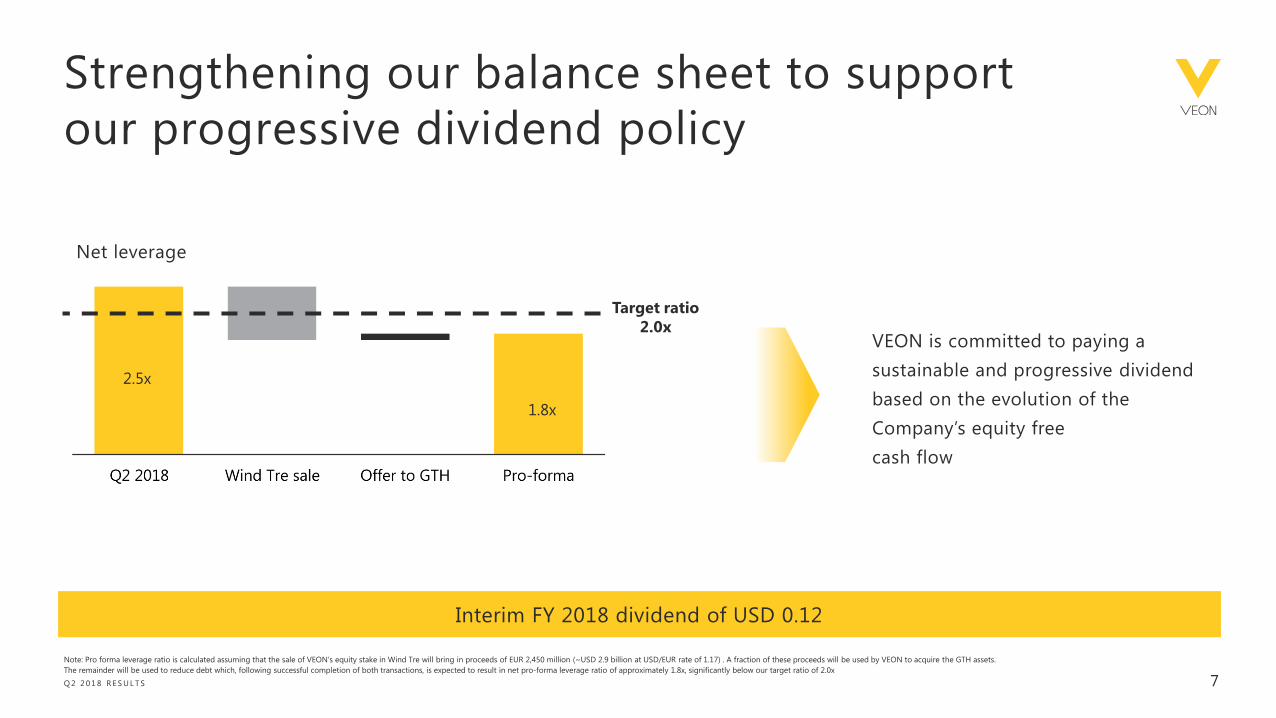
Strengthening our balance sheet to support
our progressive dividend policy
Q 2 2 0 1 8 R E S U L T S
1.8x
2.5x
Target ratio
2.0x
Note: Pro forma leverage ratio is calculated assuming that the sale of VEON’s equity stake in Wind Tre will bring in proceeds of EUR 2,450 million (~USD 2.9 billion at USD/EUR rate of 1.17) . A fraction of these proceeds will be used by VEON to acquire the GTH assets.
The remainder will be used to reduce debt which, following successful completion of both transactions, is expected to result in net pro-forma leverage ratio of approximately 1.8x, significantly below our target ratio of 2.0x
VEON is committed to paying a
sustainable and progressive dividend
based on the evolution of the
Company’s equity free
cash flow
Net leverage
Interim FY 2018 dividend of USD 0.12

8Q 2 2 0 1 8 R E S U L T S
Agenda
GROUP FINANCIAL RESULTS
COUNTRY RESULTS
OVERVIEW AND PRIORITIES
OPENING
FINAL REMARKS
Richard James - Head of IR
Ursula Burns - Executive Chairman
Trond Westlie - CFO
Kjell Johnsen - COO
Q&A
Ursula Burns - Executive Chairman

9
Q2 2018 revenue and EBITDA country trendsFigures and trends in local currency
60,000
62,000
64,000
66,000
68,000
70,000
72,000
74,000
76,000
78,000
39
40
40
41
41
42
42
43
43
21
22
23
24
25
26
27
8
9
10
11
12
13
36
37
38
39
40
41
42
43
44
300
400
500
600
700
2Q
17
3Q
17
4Q
17
Revenue
EBITDA
22,000
23,000
24,000
25,000
26,000
27,000
28,000
29,000
0
5,000
10,000
15,000
20,000
25,000
0
2,000
4,000
6,000
8,000
10,000
12,000
14,000
0
1,000
2,000
3,000
4,000
5,000
6,000
0
500
1,000
1,500
2,000
2,500
3,000
250,000
260,000
270,000
280,000
290,000
300,000
310,000
320,000
2Q
17
3Q
17
4Q
17
1Q
18
R U S S I A
( R U B B I L L I O N )
P A K I S T A N
( P K R B I L L I O N )
A L G E R I A
( D Z D B I L L I O N )
B A N G L A D E S H
( B D T B I L L I O N )
U K R A I N E
( U A H B I L L I O N )
U Z B E K I S T A N
( U Z S B I L L I O N )
+ 1.2%
YoY
+ 16.8%
YoY
- 11.9%
YoY
- 23.3%
YoY
+ 8.0%
YoY
- 11.5%
YoY
+ 6.0 %
YoY
+ 4.9%
YoY
- 8.5%
YoY
+ 11.4%
YoY
+ 10.3%
YoY
- 8.4%
YoY
Q 2 2 0 1 8 R E S U L T S
1Q
18
2Q
17
3Q
17
4Q
17
1Q
18
2Q
18
2Q
17
3Q
17
4Q
17
1Q
18
2Q
18
2Q
18
2Q
17
3Q
17
4Q
17
1Q
18
2Q
18
2Q
17
3Q
17
4Q
17
1Q
18
2Q
18
2Q
17
3Q
17
4Q
17
1Q
18
2Q
18
2Q
17
3Q
17
4Q
17
1Q
18
2Q
18
2Q
17
3Q
17
4Q
17
1Q
18
2Q
18
2Q
18
2Q
17
3Q
17
4Q
17
1Q
18
2Q
18
2Q
17
3Q
17
4Q
17
1Q
18
2Q
18
2Q
17
3Q
17
4Q
17
1Q
18
2Q
18
7.9
13.3
16.7%16.6
0
2Q17 2Q18
58.3 56.4
2Q17 2Q18
10
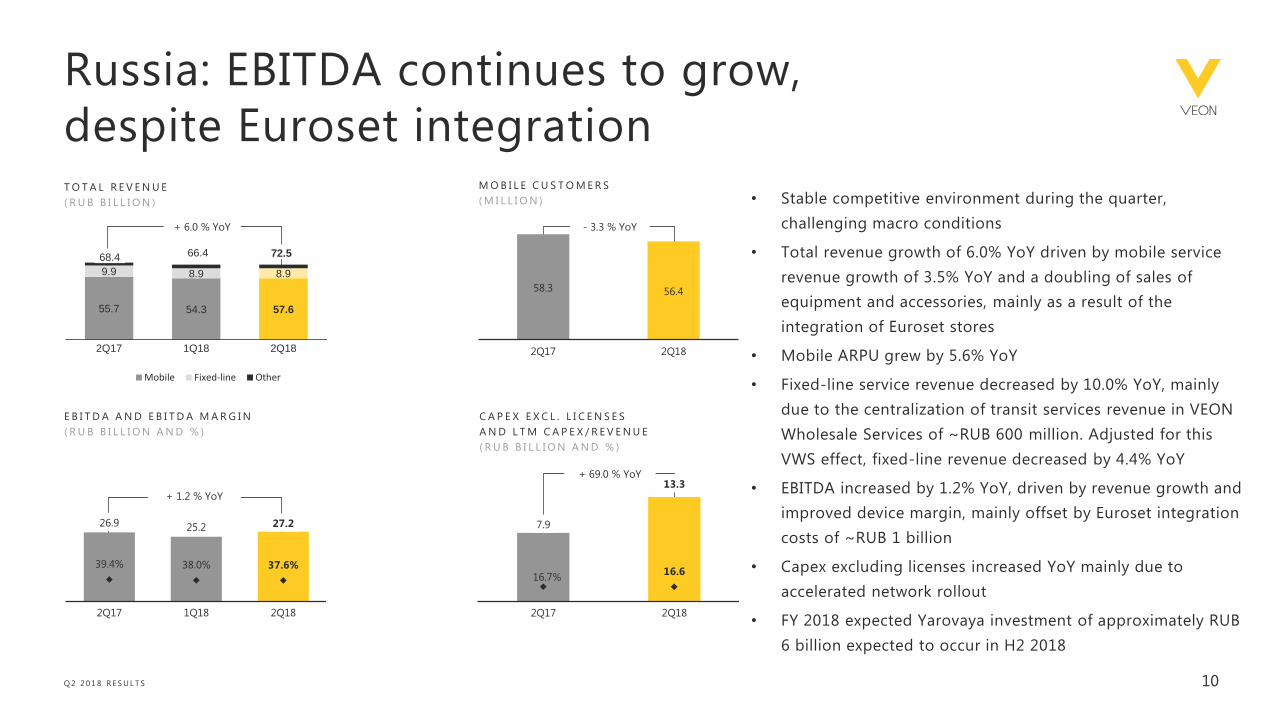
Russia: EBITDA continues to grow,
despite Euroset integrationT O T A L R E V E N U E
( R U B B I L L I O N )
M O B I L E C U S T O M E R S
( M I L L I O N ) • Stable competitive environment during the quarter,
challenging macro conditions
• Total revenue growth of 6.0% YoY driven by mobile service
revenue growth of 3.5% YoY and a doubling of sales of
equipment and accessories, mainly as a result of the
integration of Euroset stores
• Mobile ARPU grew by 5.6% YoY
• Fixed-line service revenue decreased by 10.0% YoY, mainly
due to the centralization of transit services revenue in VEON
Wholesale Services of ~RUB 600 million. Adjusted for this
VWS effect, fixed-line revenue decreased by 4.4% YoY
• EBITDA increased by 1.2% YoY, driven by revenue growth and
improved device margin, mainly offset by Euroset integration
costs of ~RUB 1 billion
• Capex excluding licenses increased YoY mainly due to
accelerated network rollout
• FY 2018 expected Yarovaya investment of approximately RUB
6 billion expected to occur in H2 2018
+ 6.0 % YoY - 3.3 % YoY
26.9 25.2 27.2
39.4% 38.0% 37.6%
0.0
10. 0
20. 0
30. 0
2Q17 1Q18 2Q18
+ 1.2 % YoY
+ 69.0 % YoY
E B I T D A A N D E B I T D A M A R G I N
( R U B B I L L I O N A N D % )
C A P E X E X C L . L I C E N S E S
A N D L T M C A P E X / R E V E N U E
( R U B B I L L I O N A N D % )
Q 2 2 0 1 8 R E S U L T S
55.7 54.3 57.6
9.9 8.9 8.9
2Q17 1Q18 2Q18
Mobile Fixed-line Other
68.4 66.4 72.5

11
Euroset integration progressing well
• Euroset integration on track:
► Targeting 1,600 rebranded Euroset stores in0+ August 2018
► ~1,400 stores already integrated and rebranded as Beeline at end-June 2018
► Medium-term target of ~5,500 monobrand Beeline stores (owned and franchise)
• Integration is driving strong sales growth in equipment and accessories (+107.2% YoY in Q2
2018)
• Equipment margins increased significantly in Q2 (6.7%, vs -0.6% in Q2 2017), driven by higher
volumes and better sales mix, providing positive margin offset to integration costs
• EBITDA grew by 1.2% YoY in Q2 2018, despite Q2 Euroset integration costs of RUB 1 billion
► FY 2018 integration cost forecast unchanged at RUB 3 billion
• Increased focus on Beeline monobrand stores is reducing exposure to alternative retail channels,
resulting in a decline in overall customer base by 3.3% YoY
• Online sales grew strongly in Q2 2018, representing 8.2% of device revenue (vs. 5.1% in Q2 2017)
Q 2 2 0 1 8 R E S U L T S
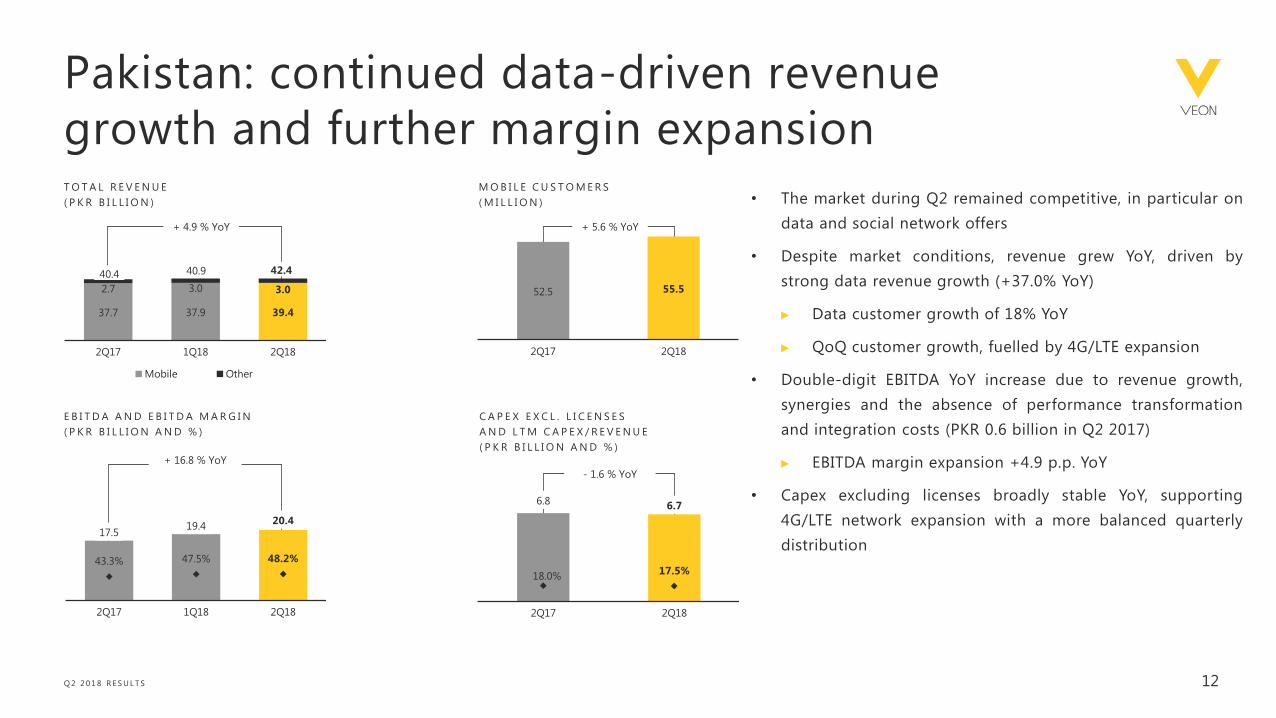
6.8 6.7
18.0%17.5%
0
2Q17 2Q18
52.5 55.5
2Q17 2Q18
Pakistan: continued data-driven revenue
growth and further margin expansionT O T A L R E V E N U E
( P K R B I L L I O N )
M O B I L E C U S T O M E R S
( M I L L I O N )
+ 4.9 % YoY + 5.6 % YoY
+ 16.8 % YoY
- 1.6 % YoY
37.7 37.9 39.4
2.7 3.0 3.0
2Q17 1Q18 2Q18
Mobile Other
40.4 40.9 42.4
17.519.4
20.4
43.3% 47.5% 48.2%
0.0
10. 0
20. 0
2Q17 1Q18 2Q18
E B I T D A A N D E B I T D A M A R G I N
( P K R B I L L I O N A N D % )
C A P E X E X C L . L I C E N S E S
A N D L T M C A P E X / R E V E N U E
( P K R B I L L I O N A N D % )
12Q 2 2 0 1 8 R E S U L T S
• The market during Q2 remained competitive, in particular on
data and social network offers
• Despite market conditions, revenue grew YoY, driven by
strong data revenue growth (+37.0% YoY)
► Data customer growth of 18% YoY
► QoQ customer growth, fuelled by 4G/LTE expansion
• Double-digit EBITDA YoY increase due to revenue growth,
synergies and the absence of performance transformation
and integration costs (PKR 0.6 billion in Q2 2017)
► EBITDA margin expansion +4.9 p.p. YoY
• Capex excluding licenses broadly stable YoY, supporting
4G/LTE network expansion with a more balanced quarterly
distribution

3.1 3.3
15.5% 13.9%
0
2Q17 2Q18
15.5 15.5
2Q17 2Q18
13
Algeria: improving trends now visible with
sequential customer growth and revenue stabilityT O T A L R E V E N U E
( D Z D B I L L I O N )
M O B I L E C U S T O M E R S
( M I L L I O N )
- 8.5 % YoY - 0.2 % YoY
- 11.9 % YoY+4.3% YoY
11.410.4 10.0
45.1% 44.9% 43.4%
0.0
10. 0
2Q17 1Q18 2Q18
24.922.9 22.9
0.2 0.2
2Q17 1Q18 2Q18
Mobile Other
25.3
23.1 23.10.5
0.4
E B I T D A A N D E B I T D A M A R G I N
( D Z D B I L L I O N A N D % )
C A P E X E X C L . L I C E N S E S
A N D L T M C A P E X / R E V E N U E
( D Z D B I L L I O N A N D % )
Q 2 2 0 1 8 R E S U L T S
• Despite Q2 characterized by intense price competition,
signals of turnaround are now evident
• Continuing macroeconomic and regulatory challenges
► Economic slowdown and high inflation continue, along
with import restrictions
► New direct taxation since 1 January 2018
• Whilst top line remains under pressure, the negative trend
has improved with stable revenue QoQ
► Customer base stable YoY and now growing 1.1% QoQ,
through the success of new offers
► Data revenue +80.7% YoY, due to new commercial offers
leveraging our 4G/LTE network
• EBITDA decrease mainly as a result of revenue YoY trend

1.41.7
18.7%27.9%
0
2Q17 2Q18
30.732.0
2Q17 2Q18
14
Bangladesh: 4G/LTE rollout progressing well,
competitive pressure still weighing on results T O T A L R E V E N U E
( B D T B I L L I O N )
M O B I L E C U S T O M E R S
( M I L L I O N )
- 8.4 % YoY + 4.1 % YoY
- 23.3 % YoY+ 22.2 % YoY
4.9
3.9 3.8
41.1% 36.1% 34.4%
0.0
2Q17 1Q18 2Q18
11.6 10.4 10.5
0.40.3 0.4
2Q17 1Q18 2Q18
Mobile Other
10.712.0 10.9
E B I T D A A N D E B I T D A M A R G I N
( B D T B I L L I O N A N D % )
C A P E X E X C L . L I C E N S E S
A N D L T M C A P E X / R E V E N U E
( B D T B I L L I O N A N D % )
Q 2 2 0 1 8 R E S U L T S
• The market during Q2 was characterized by accelerated price
pressure from competition
• The revenue trend was affected by ARPU decrease (-14.1%
YoY); however:
► Customer growth (+4.1% YoY) supported by improved
distribution
► Service revenue grew by 0.8% QoQ
► Data revenue grew by 14.5% YoY, with acceleration of
data customer growth at 20.8% YoY and data usage
(+88% YoY)
• EBITDA decline due to revenue trend and structural opex
mostly related to network expansion
• Capex increase driven by investments to improve network
resilience and 4G/LTE sites roll-out
• 4G/LTE launched in February, roll-out gaining pace
with current population coverage at ~15%

0.7
0.9
19.9%16.0%
0
2Q17 2Q18
26.1 26.5
2Q17 2Q18
15
Ukraine: sustained strong data and ARPU
performanceT O T A L R E V E N U E
( U A H B I L L I O N )
E B I T D A A N D E B I T D A M A R G I N
( U A H B I L L I O N A N D % )
M O B I L E C U S T O M E R S
( M I L L I O N )
C A P E X E X C L . L I C E N S E S
A N D L T M C A P E X / R E V E N U E
( U A H B I L L I O N A N D % )
+ 11.4 % YoY + 1.4 % YoY
+ 8.0 % YoY+ 31.5 % YoY
3.83.9 4.2
0.3
0.3 0.3
2Q17 1Q18 2Q18
Mobile Fixed-line Other
4.14.3 4.5
2.3 2.4 2.5
56.8% 56.6% 55.1%
0.0
2Q17 1Q18 2Q18
Q 2 2 0 1 8 R E S U L T S
• Kyivstar strengthened its market position in a growing
market, driven by strong growth in mobile data
• Mobile service revenue growth of 11.4% YoY, mainly driven
by data revenue growth of 69%
► ARPU increased by 9.6% YoY
• Fixed-line service revenue increased by 7.3% YoY
• Customer growth was driven by improved churn
• EBITDA increased by 8.0% YoY driven by revenue growth,
leading to an EBITDA margin of 55.1%
• 4G/LTE introduced in April 2018 and launched in 21 cities,
covering 20% of population

9.6 9.3
2Q17 2Q18
16
Uzbekistan: strong revenue growth, external cost
pressure on EBITDAT O T A L R E V E N U E
( U Z S B I L L I O N )
M O B I L E C U S T O M E R S
( M I L L I O N )
572
612629
4
5
5
2Q17 1Q18 2Q18
Mobile Fixed and other revenue
617
576
635
313
276 277
54.3%44.8%
43.5%
130 .0
140 .0
150 .0
160 .0
170 .0
180 .0
190 .0
200 .0
210 .0
220 .0
230 .0
240 .0
250 .0
260 .0
270 .0
280 .0
290 .0
300 .0
310 .0
320 .0
330 .0
2Q17 1Q18 2Q18
E B I T D A A N D E B I T D A M A R G I N 1
( U Z S B I L L I O N A N D % )
C A P E X E X C L . L I C E N S E S
A N D L T M C A P E X / R E V E N U E
( U Z S B I L L I O N A N D % )
+ 10.3% YoY
-3.1% YoY
- 11.5% YoY
Q 2 2 0 1 8 R E S U L T S
60
132
25.4%
15.0%0
100
2Q17 2Q18
120.2% YoY
• Overall market growth, with Unitel commencing repricing
activities from March 2018
• Revenue grew by 10.3% YoY driven by repricing activities
► ARPU increased by 10.9% YoY
• Mobile data revenue increased by 53.1% YoY
• EBITDA decreased by 11.5% YoY, mainly due to external cost
pressure from increased customer tax (UZS 56 billion) and
the effect of the reduction in MTR
• Capex excluding licenses increased 120% YoY as a result of
4G/LTE network roll out
• USD 86 million cash repatriated during Q2 2018

17Q 2 2 0 1 8 R E S U L T S
Agenda
GROUP FINANCIAL RESULTS
COUNTRY RESULTS
OVERVIEW AND PRIORITIES
OPENING
FINAL REMARKS
Richard James - Head of IR
Ursula Burns - Executive Chairman
Trond Westlie - CFO
Kjell Johnsen - COO
Q&A
Ursula Burns - Executive Chairman

E B I T D A
( U S D M I L L I O N ) 857T O T A L
R E V E N U E
( U S D B I L L I O N )2.3
C A P E X E X C L .
L I C E N S E S
( U S D M I L L I O N )402
E Q U I T Y F R E E
C A S H F L O W
E X C L .
L I C E N S E S 2
( U S D M I L L I O N )
206
• Total revenue organic1 growth of 3.0% YoY, mainly driven by Russia,
Pakistan, Ukraine and Uzbekistan; reported total revenue down 6.1%
primarily due to Uzbekistan and Pakistan currency devaluation
• Mobile data revenue organic growth of 24.5% YoY, reported mobile
data revenue +11%
• EBITDA organic1 growth of 4.8% YoY, driven by good operational
performance in Russia, Pakistan and Ukraine, partially offset by
EBITDA pressure in Algeria, Bangladesh and Uzbekistan
• Reported EBITDA decreased by 8.0% YoY to USD 857 million due to
currency devaluation in Uzbekistan, Russia and Pakistan, and Euroset
integration costs partially offset by lower corporate cost. EBITDA
margin at 37.7%
• Capex excl. licenses increased by 20.8% YoY due to 4G/LTE
roll-out and more equal quarterly distribution of expenditures;
resulting in 17.4% LTM capex to revenue
• Q2 2018 equity free cash flow excluding licenses2 to USD 206 million
Q2 2018 good revenue and EBITDA
organic1 growth
18
1 Organic change is a non-IFRS measure and reflects changes in revenue and EBITDA. Organic change excludes the effect of foreign currency movements and other factors, such as businesses under liquidation, disposals, mergers and acquisitions. In Q2 2018 organic growth is calculated at constant currency and excludes the
impact from Euroset transaction. See attachment in Earnings release for reconciliations2 Equity free cash flow excluding licenses is a non-IFRS measure and is defined as free cash flow from operating activities less cash flow used in investing activities, excluding M&A transactions, capex for licenses, inflow/outflow of deposits, financial assets and other one-off items
+3.0% organic1 YoY
-6.1% reported YoY
+4.8% organic1 YoY
-8.0% reported YoY
+20.8% reported YoY
LTM capex/revenue: 17.4%-1.3% reported YoY

2,417
2,490
2,270
32(99) 116
24
(220)
Reported total
revenue
2Q17
Equipment &
accessories
Voice Data and MFS Other Organic total revenue
2Q18
FOREX and Other Reported total
revenue
2Q18
Revenue and EBITDA developmentData revenue and lower costs driving organic growth in revenue and EBITDA
U S D M I L L I O N
+3.0% YoY organic
1
19Q 2 2 0 1 8 R E S U L T S
1 Other includes interconnect, roaming and intercompany eliminations2 Other refers to Euroset impact on revenue and EBITDA
931 974
857
385 (117)
Reported EBITDA
2Q17
Service
revenue
Total costs Organic
EBITDA 2Q18
FOREX and Other Reported EBITDA
2Q18
+4.8% YoY organic
2
2

20Q 2 2 0 1 8 R E S U L T S
• In Q2 2018, corporate costs were USD 54 million,
representing a decrease of ~43% YoY
► Q2 trend driven by a decrease in personnel costs, external
cost for services and the release of certain provisions
► H1 2018 costs were USD 134 million or -21% YoY
• Initiatives addressing corporate costs are progressing in
line with expectations
• Target confirmed to reduce corporate costs in FY 2018
by ~20% YoY from USD 431 million in FY 2017
Corporate costsProgress to significantly reduce corporate costs over time is under way
Corporate costs run-rate expected to halve between 20171 and year-end 2019
1 FY 2017 corporate costs at USD 431 million

21
Q2 2018 income statement
2Q18 2Q17Reported
YoY
Organic1
YoY
Revenue 2,270 2,417 (6.1%) 3.0%
Service revenue 2,136 2,331 (8.4%) 1.6%
EBITDA 857 931 (8.0%) 4.8%
Depreciation, amortization and other (465) (542) 10.4%
Operating Profit 392 389 0.4%
Net financial income and expenses (194) (208) 6.7%
Net FOREX and other gains/(losses) (27) (169) n.m.
Share of loss from joint ventures and
associates and impairments - (120) n.m.
Profit before tax 171 (108) n.m.
Tax (139) (65) n.m.
Profit/(Loss) from continued operations 32 (173) n.m.
Profit from discontinued operations (170) (85) n.m.
Non-controlling interest 1 20 n.m.
Net (loss) attributable to VEON
shareholders(138) (258) n.m.
1 Organic change is a non-IFRS measure and reflects changes in revenue and EBITDA. Organic change excludes the effect of foreign currency movements and other factors, such as businesses under liquidation, disposals, mergers and acquisitions. In Q2 2018 organic growth is calculated at constant
currency and excludes the impact from Euroset transaction. See attachment in Earnings release for reconciliations
U S D M I L L I O N
► Operating profit increased YoY mainly due to lower depreciation, driven by the classification
of Pakistan towers as assets held for sale and the depreciation of Uzbek som
► Profit before tax turned positive compared to a loss in Q2 2017 which was mainly impacted
by the Euroset impairment and above mentioned reasons
► The proportionate results (50%) of the Italy joint venture are no longer included, after the
sale announcement on 3 July 2018
► Increase in tax expense to USD 139 million in Q2 2018 was primarily attributable to higher
taxes in Russia resulting from higher profitability, while in Q2 2017 tax expenses in Russia
were low because of deductibility of fees paid in connection with bond repurchases in 2017
► Net financial income and expenses decreased YoY as a result of lower indebtedness,
coupled with lower interest rates
Q 2 2 0 1 8 R E S U L T S
► EBITDA decreased 8.0% YoY to USD 857 million due to currency devaluation in Uzbekistan
and Pakistan, and Euroset integration costs
► The Q2 loss from Italy JV (presented as a discontinued operation) increased in Q2 2018 to USD
170 million compared to USD 85 million in Q2 2017, mainly due to higher negative purchase
price allocation adjustments for VEON IFRS reporting purposes
► Net FOREX and other gains/(losses) decreased mainly due to early redemption premiums on
bond repurchases of USD 124 million in Q2 2017

22
Continued strong cash flow generation in Q2 2018
Q 2 2 0 1 8 R E S U L T S
226
456
206
118
59
24
60
18
(49) 42
(292)
Russia
OpCF
Pakistan
OpCF
Algeria
OpCF
Bangladesh
OpCF
Ukraine
OpCF
Uzbekistan
OpCF
Other countries OpCF
(incl.HQ)
Group OPCF Working capital
and provision
Interest, taxes
and other
Equity free
cash flow excl. licenses
U S D M I L L I O N
Note: OpCF refers to Operating cash flow, calculated as EBITDA minus Capex excluding licenses

23Q 2 2 0 1 8 R E S U L T S
Cash flow reconciliation tableU S D M I L L I O N
2Q18 2Q17 YoY
EBITDA 857 931 (8.0%)
Changes in working capital 66 (44) 250.6%
Movement in provisions (24) (6) (332%)
Net interest paid-received (189) (189) -
Income tax paid (108) (117) (7.5%)
Cash flow from operating activities (excl. discontinued operations) 600 578 (3.6%)
Capex excl.licenses (402) (333) 20.8%
Working capital related to Capex excl. licenses 5 (50) n.m.
Proceeds from sale of PPE 3 14 (78.9%)
Equity Free Cash Flow excl. licenses 206 209 (1.3%)
► Improvement mostly related to cash-in of certain settlements, partially
offset by device inventory increase in Russia due to Euroset integration
► Increase in capex excluding licenses mainly driven by higher capex in
Russia due to accelerated network rollout and Euroset integration
► Movement in provisions in Q2 2018 relates to payment of severance
costs accrued in Q1 2018

24
Q2 2018 net debt development
1 FOREX and Other mainly consist of FX impact in Russia
8,966
8,645
(857)
(66)
189
108
502
(197)
Net debt
31 March
2018
EBITDA Change in working capital Financial
charges
Taxes Cash capex incl. licenses FOREX and Other Net debt
30 June
2018
N E T D E B T
E B I T D A 2 .5x 2 .5x
1
Q 2 2 0 1 8 R E S U L T S
U S D M I L L I O N

25Q 2 2 0 1 8 R E S U L T S
FY 2018 targets confirmed
3.1% organic growth1
5.5%organic growth1
USD 540
million
H1 2018
actual
1 Organic change is a non-IFRS measure and reflects changes in revenue and EBITDA. Organic change excludes the effect of foreign currency movements and other factors, such as businesses under liquidation, disposals, mergers and acquisitions. In H1 2018 organic growth is calculated at constant
currency and excludes the impact from Euroset transaction. See attachment Earnings release for reconciliations
2 Equity free cash flow excluding licenses is a non-IFRS measure and is defined as free cash flow from operating activities less cash flow used in investing activities, excluding M&A transactions, capex for licenses, inflow/outflow of deposits, financial assets and other one-off items
3 FY 2018 revenue and EBITDA targets calculated on organic basis. Organic growth reflects changes in revenue and EBITDA. Organic change excludes the effect of foreign currency movements and other factors, such as businesses under liquidation, disposals, mergers and acquisitions. Major
exceptional items currently known are the impact from the Uzbekistan currency liberalization, the Pakistan tower transaction (Deodar), the Euroset transaction and the one-off adjustment to a vendor agreement. FY 2018 equity free cash flow target is calculated at 2018 target currency rates. For FY
2018 target currency rates, see appendix
Flat-to-low
single digit organic
growth
Flat-to-low
single digit organic
growth
USD ~1
billion
FY 2018
targets3
Total revenue
EBITDA
Equity free cash flow2► FY 2018 equity free cash flow target is calculated at
2018 target currency rates

26Q 2 2 0 1 8 R E S U L T S
Agenda
GROUP FINANCIAL RESULTS
COUNTRY RESULTS
OVERVIEW AND PRIORITIES
OPENING
FINAL REMARKS
Richard James - Head of IR
Ursula Burns - Executive Chairman
Trond Westlie - CFO
Kjell Johnsen - COO
Q&A
Ursula Burns - Executive Chairman

F INAL REMARKS

APPENDIX

-6.1% YoY reported
Revenue and EBITDA developmentSolid organic growth in most countries, partially offset by decrease in Bangladesh, Algeria and Uzbekistan
1
29Q 2 2 0 1 8 R E S U L T S
1 Other includes interconnect, roaming and intercompany eliminations2 Other in Q2 2018 mainly includes the results of Kazakhstan, Kyrgyzstan, Armenia, Georgia, Tajikistan, other global operations and services and intercompany eliminations
3 Other includes Euroset integration costs of approximately RUB 1 billion
931 974
857
21
28 7
(10)(14) ( 12 )
40 ( 17 )
(117)
EBITDA 2Q17 Russia Pakistan Ukraine Uzbekistan Bangladesh Algeria Corporate
costs
Other Organic
EBITDA
2Q18
FOREX and Other EBITDA
2Q18
- 8.0 % YoY reported
2 3
3
2,4172,490
2,270
45
1918 16 (20) (12) 7
(220)
Total reported
revenue 2Q17
Russia Pakistan Ukraine Uzbekistan Algeria Bangladesh Other Organic total
revenue
2Q18
FOREX and Other Total reported
revenue
2Q18

• Service revenue -8.6% YoY, of which:
► Mobile service revenue -9.8% YoY, mainly due to
continued competitive pressure in the market, exacerbated
by the new market entrant, impacting both customer base
and ARPU
► Fixed service revenue -4.0% YoY mainly due to the
replacement of old ADSL customers with new FTTx
subscribers at lower ARPU
• Other & CPE1 revenue decline mainly due to CPE1, due to lower
gross additions and more selective mobile customer scoring
introduced in H2 2017
• EBITDA2 increased by 1.9% YoY; top-line pressure more than
offset by:
► Change in accounting to IFRS 15, contributing 5.3p.p. of
EBITDA growth
► Incremental synergies (~EUR 41 million in Q2 2018)
► ~ EUR 45 million lower YoY integration costs
30
Italy: continued competitive pressure weighs on
top-lineT O T A L R E V E N U E
( E U R M I L L I O N )
M O B I L E C U S T O M E R S
( M I L L I O N )
E B I T D A A N D E B I T D A M A R G I N 2
( E U R M I L L I O N A N D % )
Q 2 2 0 1 8 R E S U L T S
-11.4% YoY
1,042 961 940
268 259 257
225 189 163
2Q17 1Q18 2Q18
Other & CPE Fixed Service Revenue
Mobile Service Revenue
1,5351,3601,410
1
30.3 28.6
2Q17 2Q18
-5.3% YoY
442 484 451
28.8% 34.3% 33.1%
0102030405060708090
100110120130140150160170180190200210220230240250260270280290300310320330340350360370380390400410420430440450460470480490500510520530540550560570580590600610620630640650
2Q17 1Q18 2Q18
+1.9% YoY
266235
17.6%19.9%
0
100
200
300
400
2Q17 2Q18
-11.6% YoY
1 CPE = Customer Premises Equipment2 EBITDA and capex figures are in line with Wind Tre statutory reported financial schemes: 2018 compliant with IFRS 15 and 2017 compliant with IAS 18. F or comparison purposes: 1Q 2018 EBITDA under IAS 18 would have been 465 EUR million; 1Q 2018 CAPEX under
IAS 18 would have been 205 EUR million; 2Q 2018 EBITDA under IAS 18 would have been 427 EUR million; 2Q 2018 CAPEX under IAS 18 would have been 212 EUR million. EBITDA negatively impacted by integration costs of ~EUR 81 million in 2Q 2017 and of ~EUR 35 million in
2Q 20183 2Q 2018 LTM CAPEX calculated under IAS 18
C A P E X 2 E X C L . L I C E N S E S
A N D L T M 3 C A P E X / R E V E N U E
( E U R M I L L I O N A N D % )

Group debt structure
• Average cost of debt: 6.6% (30 June 2017: 6.4%)
8%
75%
17% HQ - guaranteed
HQ - unguaranteed
Other
54%
24%
14%
8%USD
RUB
EUR
Other
1 Including effect of cross currency swaps
31
3 0 J U N E 2 0 1 8
Group debt currency mix1Group debt structure
Q 2 2 0 1 8 R E S U L T S
• Average maturity: 3.7 years (30 June 2017: 3.7 years)
Gross Debt
USD 10.0 billion

Group debt maturity schedule
Group debt maturity schedule by currency1
3 0 J U N E 2 0 1 8 ,
U S D B I L L I O N
32
2018 2019 2020 2021 2022 >2022
USD 0.1 1.0 0.6 0.4 0.7 2.6 54%
RUB 0.0 0.0 0.5 1.1 0.8 0.0 24%
EUR 0.1 0.0 0.2 1.0 0.1 0.0 14%
PKR 0.1 0.1 0.2 0.1 0.0 0.0 5%
OTHER 0.1 0.1 0.0 0.1 0.0 0.0 3%
1 Including effect of cross currency swaps. Principal amount of Group debt taking into account cross-currency swaps is equivalent to USD 10,020 million.
Q 2 2 0 1 8 R E S U L T S
0.4
1.2
1.5
2.7
1.6
2.6
2018 2019 2020 2021 2022 >2022
Group debt maturity schedule HQ Pakistan Other GTH Russia
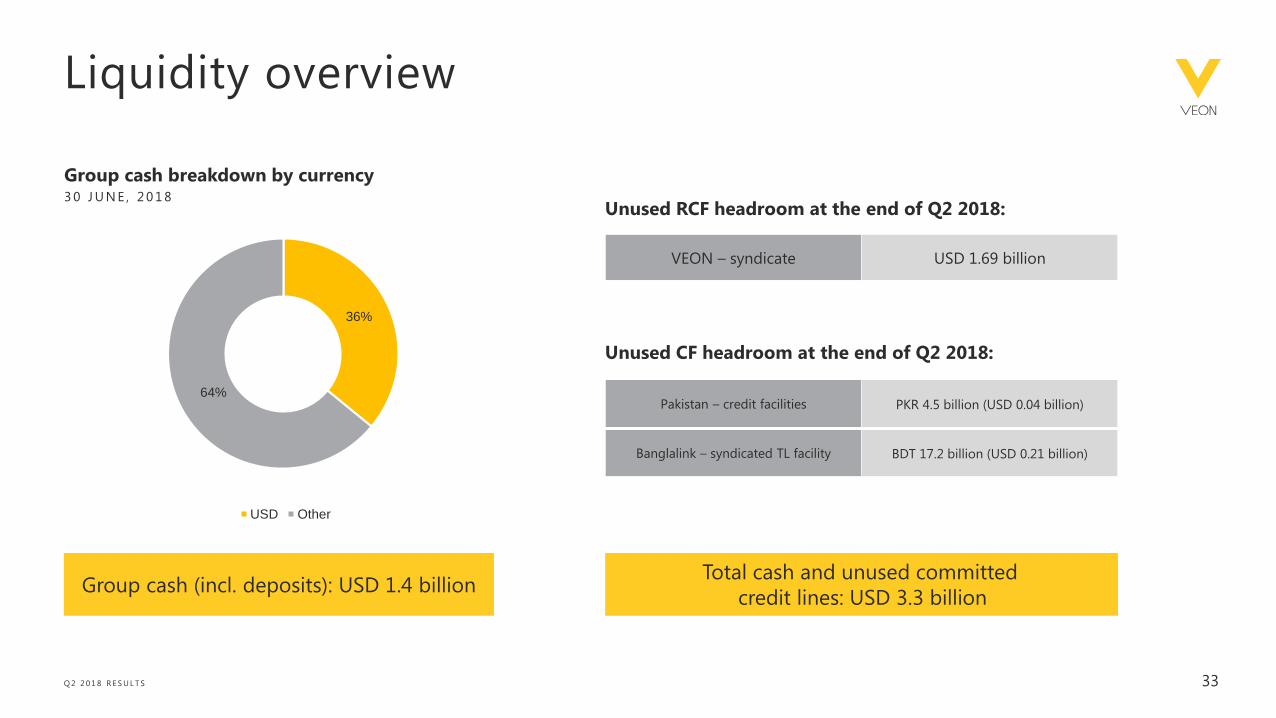
Liquidity overview
Group cash breakdown by currency3 0 J U N E , 2 0 1 8
Unused RCF headroom at the end of Q2 2018:
Unused CF headroom at the end of Q2 2018:
36%
64%
USD Other
33
VEON – syndicate USD 1.69 billion
Pakistan – credit facilities PKR 4.5 billion (USD 0.04 billion)
Banglalink – syndicated TL facility BDT 17.2 billion (USD 0.21 billion)
Total cash and unused committed
credit lines: USD 3.3 billionGroup cash (incl. deposits): USD 1.4 billion
Q 2 2 0 1 8 R E S U L T S

34
Debt by entity
Outstanding debt Type of debt
3 0 J U N E 2 0 1 8 ,
U S D M I L L I O N
Entity Bonds LoansCash-pool
overdrafts1 Other Total
VEON Amsterdam B.V. - 205 50 - 255
VEON Holdings B.V. 3,683 3,003 150 - 6,836
GTH Finance B.V. 1,200 - - - 1,200
PJSC VimpelCom 394 - - 55 449
Pakistan Mobile Communications Limited 28 635 - - 663
Banglalink Digital Communications Ltd. 300 155 - - 455
Optimum Telecom Algérie S.p.A. - 128 - - 128
Others - - 1 5 6
Total 5,605 4,126 201 60 9,992
Total excl. cash-pool overdrafts 9,791
Q 2 2 0 1 8 R E S U L T S
1 As of June 30, 2018, some bank accounts forming part of a cash pooling program and being an integral part of VEON’s cash management remained overdrawn by US$ 201 million. Even though the total balance of the cash pool remained positive, VEON has no legally enforceable right to set-off
and therefore the overdrawn accounts are presented as financial liabilities and form part of our debt in our financial statements.

35
Russian ruble
Algerian dinar
Pakistan rupee
Bangladeshi taka
Ukrainian hryvnia
Kazakh tenge
Uzbekistan som
Armenian dram
Kyrgyz som
Georgian lari
Target rates
FY 2018
60.00
110.00
105.00
79.00
27.00
340.00
8,748
480
70.00
2.40
Average rates
2Q18 2Q17 YoY
61.80 57.15 8.1%
115.80 109.04 6.2%
116.80 104.81 11.4%
83.78 80.86 3.6%
26.18 26.46 (1.1%)
329.63 315.01 4.6%
8,011.80 3,778.07 112.1%
482.75 483.37 (0.1%)
68.50 68.12 0.6%
2.45 2.42 1.1%
Closing rates
2Q18 2Q17 YoY
62.76 59.09 6.2%
117.50 107.80 9.0%
121.58 104.83 16.0%
83.78 80.64 3.9%
26.19 26.10 0.3%
341.08 321.46 6.1%
7,871.66 3,958.56 98.9%
482.24 480.47 0.4%
68.18 69.14 (1.4%)
2.45 2.41 1.8%
Forex
Q 2 2 0 1 8 R E S U L T S
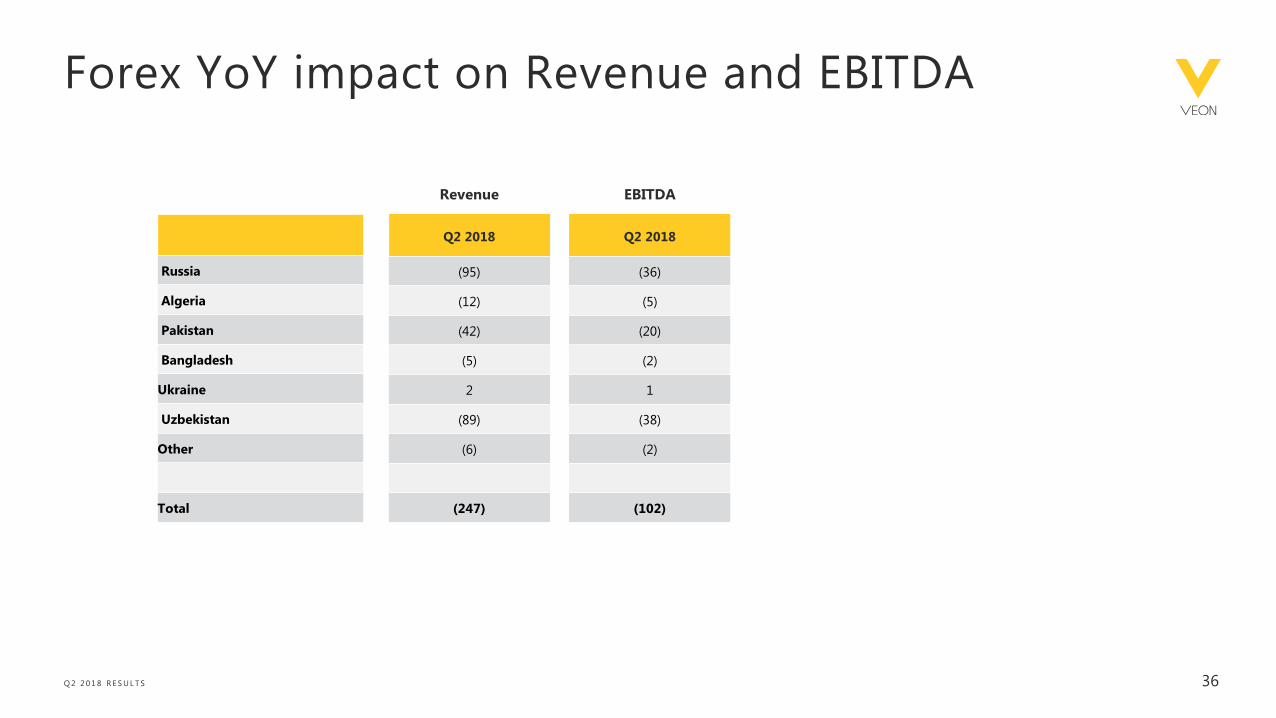
36
Russia
Algeria
Pakistan
Bangladesh
Ukraine
Uzbekistan
Other
Total
Revenue
Q2 2018
(95)
(12)
(42)
(5)
2
(89)
(6)
(247)
Forex YoY impact on Revenue and EBITDA
EBITDA
Q2 2018
(36)
(5)
(20)
(2)
1
(38)
(2)
(102)
Q 2 2 0 1 8 R E S U L T S