strategic environmental assessment of national development ... of estonian marine policy...
TRANSCRIPT

Strategic environmental assessment of national development plan “Estonian Marine Policy 2012−−−−2020”
Draft report (12.10.2015)
Client: Ministry of Economic Affairs and Communications Prepared by: Tallinna Tehnikaülikooli Meresüsteemide Instituut (Marine Systems Institute at Tallinn University of Technology) OÜ Alkranel
Head of SEA working group: Alar Noorvee
Tartu-Tallinn 2015

2 Strategic Environmental Assessment of the National Development Plan “Estonian Marine Policy
2012−2020” Draft Report, 2015
CONTENTS
INTRODUCTION .................................................................................................................................... 5
1. A SHORT OVERVIEW OF THE PRIORITIES, OBJECTIVES AND MEASURES OF THE MARINE POLICY ................................................................................................................................................... 7
2. OVERVIEW OF THE CURRENT SITUATION, PROBLEMS AND PRESSURES ........................... 10
2.3 Overview of socio-economic environment and problems ................................................................ 10
2.3.1 Maritime industry related business environment ..................................................................... 10
2.3.3 Marine transport and ports (including maritime rescue) ......................................................... 19
2.1.3 Natural resources (mineral resources, wind) and using thereof ............................................... 22
2.1.4 Marine cultural heritage and traditional coastal lifestyle ......................................................... 26
2.1.5 Maritime education and research and development activity .................................................... 27
2.1.6 Air quality, including traffic noise in the air environment ....................................................... 29
2.2 Overview of the natural environment ............................................................................................ 32
2.2.1 Bathymetry, characteristics of seafloor and coast .................................................................... 32
2.2.2 Temperature, salinity, stratification, ice cover ......................................................................... 34
2.2.3 Currents, wave regime and sea level ........................................................................................ 35
2.2.4 Nutrients and oxygen .............................................................................................................. 37
2.2.5 Plankton ................................................................................................................................. 40
2.2.6 Benthos ................................................................................................................................... 41
2.2.7 Fish fauna ............................................................................................................................... 44
2.2.8 Wild birds ............................................................................................................................... 46
1. 2.2.9 Protected natural objects and Natura 2000 ..................................................................... 47
2.2.10 Marine mammals .................................................................................................................. 51
2.3 Pressures on and status of the natural environment ....................................................................... 53
2.3.1 Physical damage: siltation, smothering, elimination, sealing, changing the coastline ................ 54
2.3.2 Underwater noise .................................................................................................................... 57
2.3.3 Nutrient enrichment ................................................................................................................ 60
2.3.4 Inputs of organic matter.......................................................................................................... 63
2.3.5 Introduction of microbial pathogens to waterbodies ................................................................ 65
2.3.6 Contamination by hazardous substances ................................................................................. 67
2.3.7 Marine litter ........................................................................................................................... 68
2.3.8 Oil pollution from ships and its impact .................................................................................... 69
2.3.9 Selective extraction of species .................................................................................................. 72
2.3.10 Introduction of non-indigenous species .................................................................................. 73
2.3.11 Intentional or systematic release of solid substances into the marine environment ................. 74
2.3.12 Status of the natural environment ......................................................................................... 75
3 Strategic Environmental Assessment of the National Development Plan “Estonian Marine Policy
2012−2020” Draft Report, 2015
3. OBJECTIVE, METHOD AND SCOPE OF THE STRATEGIC ENVIROMENTAL ASSESSMENT . 78
4. COMPLIANCE ANALYSIS OR RELATIONS OF THE DEVELOPMENT PLAN WITH OTHER STRATEGIC DOCUMENTS ................................................................................................................. 80
4.1 Regional and European Union documents ..................................................................................... 80
4.2 National documents of Estonia ...................................................................................................... 84
Priority 1: Improving knowledge transfer and innovation in the agricultural and forestry sector and rural areas ................................................................................................................................................ 93
Priority 2: Improving the viability of agricultural holdings and the competitiveness of all agricultural forms in all areas and promoting innovative agricultural technologies and sustainable forest management ......... 93
Priority 3: Promoting the organisation of food chain in agriculture, including the processing and marketing of agricultural products, animal welfare, and risk management ............................................................. 93
Priority 4: Restoring, preserving and improving agricultural and forestry ecosystems ............................. 93
Priority 5: Promoting resource efficiency and supporting the transition to low-CO2 emission and climate resilient economy in agriculture and food and forestry sectors .............................................................. 94
Priority 6: Promoting social inclusion, poverty reduction and the rural economic development ................ 94
5. ANALYSIS OF EXTERNAL IMPACTS OR ENVIRONMENTAL IMPACTS PRESUMED TO OCCUR IN RELATION WITH The IMPLEMENTATION OF THE DEVELOPMENT PLAN AND MITIGATION MEASURES (PROPOSALS) ....................................................................................... 101
5.1 Analysis of the impact of implementation of the “Estonian Marine Policy 2012−−−−2020” development
plan .................................................................................................................................................. 101
5.2 Summaries of area-specific impact analysis and proposals ........................................................... 122
5.2.1 Impact on seawater quality and physical indicators of the marine environment .................... 122
5.2.2 Impact on marine biota and habitats (including impact on protected nature objects) ............ 126
5.2.3 Impact on air quality (including outdoor noise) and climate change ...................................... 128
5.2.4 Impact on sustainable use of natural resources and resources ............................................... 130
5.2.5 Impact on human well-being and health (including outdoor noise) ........................................ 131
5.2.6 Impact on sea-related business (including fisheries, aquaculture, tourism etc.) ...................... 132
5.2.7 Impact on marine transport and ports (including navigational safety and security, marine rescue) ........................................................................................................................................... 133
5.2.8 Impact on marine cultural heritage ....................................................................................... 133
5.2.9 Cumulative impacts and cross-border impact ....................................................................... 134
6. DESCRIPTION OF MONITORING REQUIREMENTS AND FOLLOW-UP ASSESSMENT ......... 137
6.1 Monitoring of natural environment ............................................................................................. 137
6.2 Monitoring of the objectives (including socio-economical) of the development plan ..................... 139
7. OVERVIEW OF THE SEA PROCESS AND ENCOUNTERED DIFFICULTIES ............................ 142
8. SUMMARY OF THE SEA RESULTS .............................................................................................. 144
8.1 OVERVIEW OF THE CURRENT SITUATION, PROBLEMS AND PRESSURES .................... 144
8.1.1 Overview of socio-economic environment and problems ........................................................ 144
8.1.2 Overview of natural environment .......................................................................................... 149
8.1.3 Pressures on and status of the natural environment .............................................................. 156
4 Strategic Environmental Assessment of the National Development Plan “Estonian Marine Policy
2012−2020” Draft Report, 2015
8.2 METHOD AND SCOPE OF THE SEA ....................................................................................... 157
8.3 IMPACT ASSESSMENT ............................................................................................................ 158
8.4 PROPOSALS .............................................................................................................................. 162
8.5 DESRIPTION OF MONITORING RQUIREMENTS AND FOLLOW-UP ASSESSMENT ........ 165
MAIN REFERENCED SOURCES ....................................................................................................... 166

5 Strategic Environmental Assessment of the National Development Plan “Estonian Marine Policy
2012−2020” Draft Report, 2015
INTRODUCTION The subject of this strategic environmental assessment (hereinafter SEA) is the national development plan “Estonian Marine Policy 2012–2020” (approved by the Government of the Republic with Order No. 342 of 2 August 2012). The development plan, approved by the Government of the Republic, is a cross-sector development plan that corporates strategic objectives and activities necessary to facilitate the development of the maritime sector. The policy document is supplemented by an implementation plan prepared for four years that describes in detail the measures, outputs, implementers and financial plan. The objective of preparing the development plan was to develop guidelines that integrate different maritime areas to further the maritime sector and realise Estonia`s potential in using and preserving marine resources to the maximum extent. On the one hand, a large part of Estonia`s economy depends on the maritime sector because ca 60% of Estonia`s export and import is conducted by sea. On the other hand, access to the sea enables earn a significant income from international carriage of goods, tourism and fisheries. This is possible only if the economic activity directly related to the sea is supported by efficient public sector services and legislative regulation, availability of qualified labour force, high level of skills and knowledge and cooperation between market participants. Implementation plans are prepared to execute the development plan. The current implementation plan is prepared for 2014–2016. The objective of the SEA is to analyse the activities planned in the development plan and its implementation plan and, if necessary, to make proposals for preparing a new implementation plan. The SEA is carried out in accordance with the Environmental Impact Assessment and Environmental Management System Act (RT I, 13.03.2014, 32). According to § 56 (8) of the Environmental Impact Assessment and
Environmental Management System Act (RT I, 01.09.2015, 12), the transitional provision will apply until 1 July 2018. Preparing of the development plan is initiated by the Government of the Republic that also approves the document and the authority that organises the preparation of the development plan is the Ministry of Economic Affairs and Communications. The SEA is prepared by Alkranel OÜ and Marine Systems Institute at Tallinn University of Technology. The members of the SEA working group:
• Alar Noorvee, SEA lead expert of OÜ Alkranel; • Taavi Liblik, senior researcher of Marine Systems Institute at Tallinn University of
Technology; • Natalja Kolesova, junior researcher of Marine Systems Institute at Tallinn University of
Technology; • Elar Põldvere, environmental specialist of OÜ Alkranel; • Tanel Esperk, environmental specialist of OÜ Alkranel; • Reet Needo, environmental specialist of OÜ Alkranel; • Veljo Kabin, environmental specialist of OÜ Alkranel; • Kai Künnis-Beres, researcher of Marine Systems Institute at Tallinn University of
Technology.

6 Strategic Environmental Assessment of the National Development Plan “Estonian Marine Policy
2012−2020” Draft Report, 2015
The public display of the draft SEA programme took place between 13.07–27.07.2015 and the public discussion was held on 27 July 2015. The SEA programme was approved by letter No. 11-2/15/5029-14 of 12 October 2015 of the Ministry of the Environment (Annex 2).
7 Strategic Environmental Assessment of the National Development Plan “Estonian Marine Policy
2012−2020” Draft Report, 2015
1. A SHORT OVERVIEW OF THE PRIORITIES, OBJECTIVES AND MEASURES OF THE MARINE POLICY
Five priorities along with their strategic objectives have been specified in the development plan of the “Estonian Marine Policy 2012–2020”. In order to fulfil the set objectives, measures and actions to achieve them are identified. A short overview of the objectives and measures of the development plan is presented. The full development plan is available on the home page of the Ministry of Economic Affairs and Communications (https://www.mkm.ee/sites/default/files/merenduspoliitika.pdf). PRIORITY 1 – The marine business environment is business friendly and internationally competitive. • Objective 1 – Estonian shipping is internationally competitive.
o Measure 1.1 – Creating equal competitive conditions with European states for
the Estonian shipping sector. • Objective 2 – Increased trade flows through Estonian ports.
o Measure 2.1 – Using the potential of marine collaborative networks.
o Measure 2.2 – Supporting the development of international maritime carriage
of goods.
o Measure 2.3 – Facilitating the development of ports` infrastructure. • Objective 3 – Increased number of passengers on international shipping lines.
o Measure 3.1 – Supporting the competitiveness of international carriage of
passengers. • Objective 4 – Estonian shipbuilding and repair operations are internationally competitive.
o Measure 4.1 – Increasing the competitiveness of shipbuilding and repair
(including designing).
o Measure 4.2 – Increasing the competitiveness of recreational craft building and repair.
PRIORITY 2 – Marine sector is secure, safe and the state of the marine environment has improved. • Objective 5 – The safety and security in vessel traffic and in ports has improved.
o Measure 5.1 – Performing hydrographic surveys.
o Measure 5.2 – Establishing and reconstructing waterways.

8 Strategic Environmental Assessment of the National Development Plan “Estonian Marine Policy
2012−2020” Draft Report, 2015
o Measure 5.3 – Collecting, processing and forwarding of navigational
information.
o Measure 5.4 – Development of navigational marks.
o Measure 5.5 – Improving the Vessel Traffic Service (VTS).
o Measure 5.6 – Improving the technical supervision and classification of ships.
o Measure 5.7 – Development of a common and sustainable monitoring system.
o Measure 5.8 – Improving the search and rescue field.
o Measure 5.9 – Ensuring safety and security in ports. • Objective 6 – The state of the marine environment has improved.
o Measure 6.1 – Improving the capability of the public sector to plan protection
of the marine environment, prevent environmental pollution and alleviate their consequences.
PRIORITY 3 – The actions of the public sector support marine development. • Objective 7 – The marine sector management and regulations are more effective.
o Measure 7.1 – Improving the efficiency of management of maritime sector by
the state.
o Measure 7.2 – Spatial planning of marine areas.
o Measure 7.3 – Amending marine-related legislation. PRIORITY 4 – Estonian marine education and research and development are up to date. Objective 8 – Estonian education system provides modern training in balanced
volume of specialists necessary for all fields of the marine sector.
o Measure 8.1 – Development and implementation of the marine education concept.
o Measure 8.2 – Promoting vocational education.
o Measure 8.3 – Promoting higher education.
o Measure 8.4 – Promoting continuing and hobby education.
• Objective 9 – The quantity and quality of Estonian marine research have increased.

9 Strategic Environmental Assessment of the National Development Plan “Estonian Marine Policy
2012−2020” Draft Report, 2015
o Measure 9.1 – Supporting marine-related research work.
PRIORITY 5 – The coastal living and visit environment are attractive, favouring marine tourism and local business development, the marine cultural heritage is carried forward. • Objective 10 – Marine tourism and marine and coastal business activities are developed.
o Measure 10.1 – Developing of small and fishing ports` infrastructure and
recreational craft tourism.
o Measure 10.2 – Improving the development of inland waterways. Objective 11 – The preservation of marine cultural heritage and traditions is
secured.
o Measure 11.1 – Preservation of marine cultural heritage and recognising maritime sector.

10 Strategic Environmental Assessment of the National Development Plan “Estonian Marine Policy
2012−2020” Draft Report, 2015
2. OVERVIEW OF THE CURRENT SITUATION, PROBLEMS AND PRESSURES
2.3 Overview of socio-economic environment and problems 2.3.1 Maritime industry related business environment For the purpose of this SEA report, the business environment includes various infrastructures (electricity, gas) and related business as well as the development of shipping, fishing, aquaculture, tourism and energy in the Baltic Sea area. The maritime industry plays an important role in the Estonian economy, because ca 60% of Estonian export and import operations are conducted by sea. Access to sea and location enables Estonia to earn an important income from international carriage of goods, tourism and fishing (Eesti merenduspoliitika 2012−2020, 2011). The cluster study of maritime industry shows that the sales revenue of maritime companies has gradually grown in 2004−2010 (Figure 2.17, TTÜ Eesti Mereakadeemia, 2015).
Figure 2.1. Sales revenue of Estonian maritime cluster in comparison to subclusters in 2004−2010 (TTÜ Eesti Mereakadeemia, 2015). Infrastructure Direct current connections with Finland (EstLink 1 and EstLink 2) have been established. In a longer perspective, it is possible to create a connection with Sweden and construct a third connection between Estonia and Finland that would ensure sale possibilities for the production of perspective offshore windfarms. In following years, a new alternating current high voltage connection with Latvia will be added, and, in a longer perspective, it is possible to make a connection with Latvia by a sea cable. Synchronisation of the power grids of the Baltic States
Shipping
Sa
les
inco
me
(b
illi
on
EE
K)
Port operations
Maritime services and
intermediate operations
Shipbuilding and repair
Peasure craft and
recreation
Building and maintenance
of waterways and water
structures
Fishing and processing.
Aquaculture
11 Strategic Environmental Assessment of the National Development Plan “Estonian Marine Policy
2012−2020” Draft Report, 2015
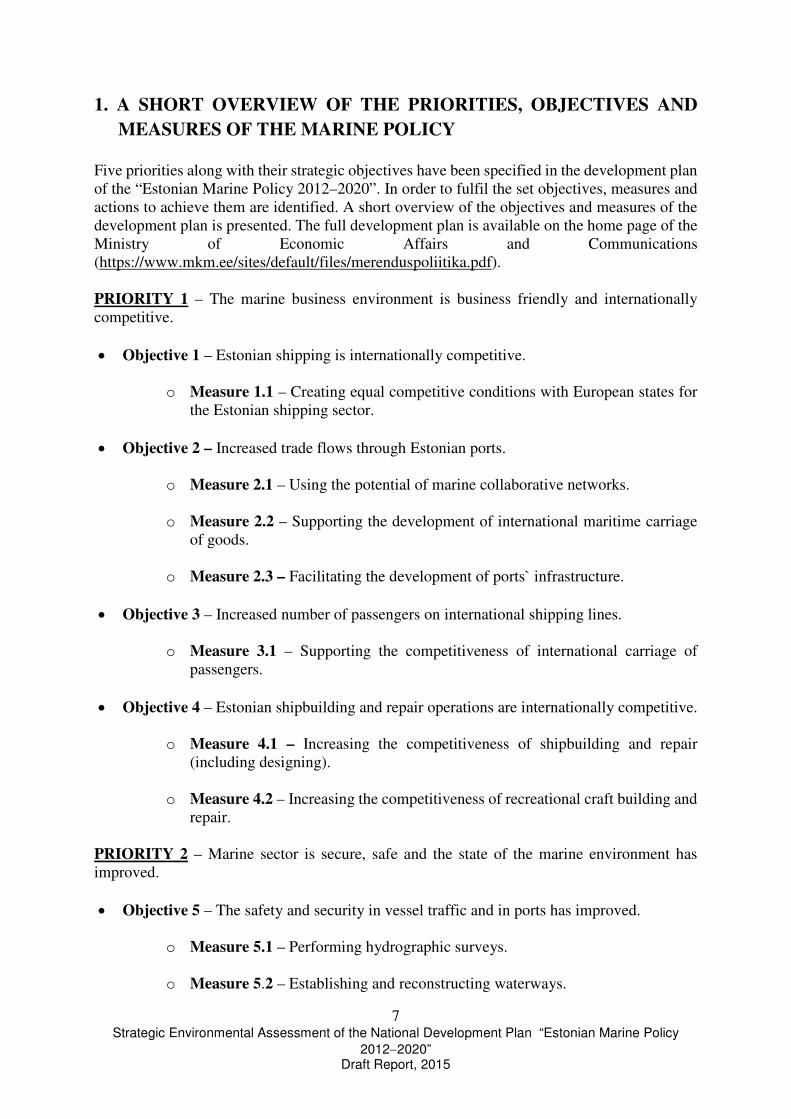
and the European Union is planned. As Estonia intends to join the synchronous area of Central Europe, grid connection with Russia must be better controlled. This requires converter stations to be built on the state border (National Spatial Plan “Estonia 2030+”). Transition to natural gas as the most clean fossil fuel requires the development of necessary infrastructure, i.e. liquefied gas (hereinafter LNG) terminals and bunkering stations in the SECA region, including the Baltic Sea ports. Currently, the number of LNG terminals is limited, the only terminals are near Stockholm and Klaipeda. Two LNG terminals are being planned to be built in Estonia in near future – in Paldiski on Pakri Penninsula and in Muuga Port. The plan is to connect Estonian gas transfer network in addition to the existing transfer networks to the Finnish gas market via Balticconnector (Figure 2.18). According to the programme of the environmental impacts assessment (2014) of the Balticconnector project, connecting Estonian and Finnish gas markets would create a more uniform and diverse natural gas network in the Baltic Sea region in future and thereby improve the security of natural gas supply for the Member States in the north-eastern part of the European Community. Open sea gas pipe would enable exchange of natural gas between Finland and Estonia and at the same time offers an opportunity to use Latvian underground gas storage facilities. The planned gas pipe could operate in both ways, enabling transfer of gas through Finland to Estonia and vice versa (Ramboll Eesti AS, 2014).
Figure 2.2. Gas pipes in the Gulf of Finland region (existing and planned) (Ramboll Eesti AS, 2014).
Exicting
Gas transfer network Compressor stations Gasum offices and equipment Nord Stream gas pipe
Planned: Network extension LNG terminal Balticconnector gas pipe from Paldiski to Inkoo Pipeline from Paldiski to Kiel Pipeline from Inkoo to Siuntio
12 Strategic Environmental Assessment of the National Development Plan “Estonian Marine Policy
2012−2020” Draft Report, 2015
Main problems of a LNG terminal construction in Estonia: • insufficient awareness work about the advantages and disadvantages of LNG use; • no legislation that regulates LNG operations (including bunkering); • excise policy that does not promote using of natural gas as fuel; • no support measures to facilitate using LNG on ships; • relatively small investing capacity of ship owners; • lack of experience in using LNG ship fuel.
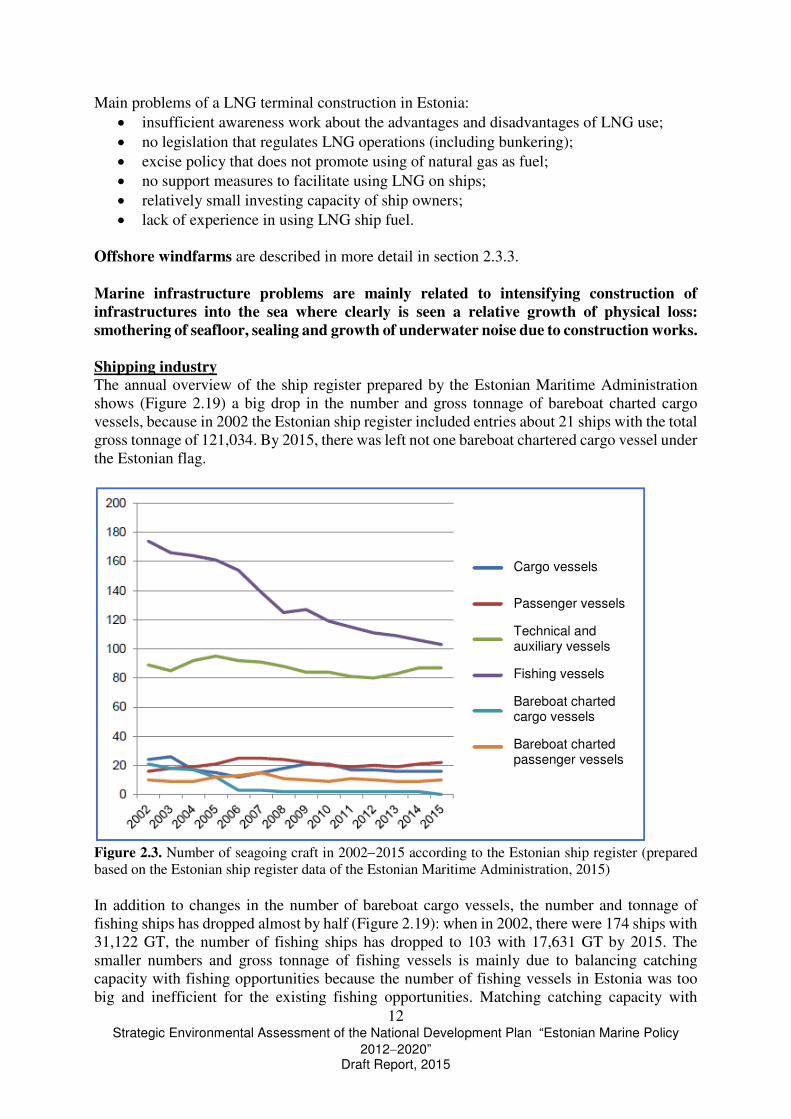
Offshore windfarms are described in more detail in section 2.3.3. Marine infrastructure problems are mainly related to intensifying construction of infrastructures into the sea where clearly is seen a relative growth of physical loss: smothering of seafloor, sealing and growth of underwater noise due to construction works. Shipping industry The annual overview of the ship register prepared by the Estonian Maritime Administration shows (Figure 2.19) a big drop in the number and gross tonnage of bareboat charted cargo vessels, because in 2002 the Estonian ship register included entries about 21 ships with the total gross tonnage of 121,034. By 2015, there was left not one bareboat chartered cargo vessel under the Estonian flag.
Figure 2.3. Number of seagoing craft in 2002−2015 according to the Estonian ship register (prepared based on the Estonian ship register data of the Estonian Maritime Administration, 2015) In addition to changes in the number of bareboat cargo vessels, the number and tonnage of fishing ships has dropped almost by half (Figure 2.19): when in 2002, there were 174 ships with 31,122 GT, the number of fishing ships has dropped to 103 with 17,631 GT by 2015. The smaller numbers and gross tonnage of fishing vessels is mainly due to balancing catching capacity with fishing opportunities because the number of fishing vessels in Estonia was too big and inefficient for the existing fishing opportunities. Matching catching capacity with
Cargo vessels
Passenger vessels
Technical and auxiliary vessels
Fishing vessels
Bareboat charted cargo vessels
Bareboat charted passenger vessels

13 Strategic Environmental Assessment of the National Development Plan “Estonian Marine Policy
2012−2020” Draft Report, 2015
fishing opportunities was supported with the financial resources of the European Fisheries Fund. The number of passenger ships that sail under the Estonian flag has been quite stable compared to the 2003 data. The gross tonnage has increased two and half times because old ships have been replaced, for the most part, with new ships. However, two new passenger ships do not sail under the Estonian flag any more. From 1 January 2015, all ships that sail in the Baltic Sea must use fuels with sulphur content < 0.1% or must be equipped with treatment facilities that ensure SOx content reduction to the required limit in exhaust gases. Currently, only a few LNG fuel ships sail on the Baltic Sea. Tallink as well as the Swedish company Rederi AB Gotland have made or intend to make contracts for the construction of one new ship that uses LNG as fuel. AS Tallinna Sadama has also contracted the building of four new LNG-ready (allowing transition to LNG fuel) passenger ferries for the shipping lines that connect Saaremaa and Hiiumaa. However, a very quick growth in the number of LNG-ships is not foreseen in near future, because facilities for supplying ships with LNG in ports, except for in Norway, are non-existent or limited. For example, in the Baltic Sea region there are operating terminals only near Stockholm and in Klaipeda. As Estonian shipping industry is part of the world and the Baltic Sea shipping industry, there are several influential factors and development barriers for shipping, of which the most important are listed below. National development barriers of shipping are
• non-existent uniform and strong maritime cluster; • low efficiency of targeted and systemic maritime policy implementation; • insufficient cooperation of the public and private sectors in developing the maritime
sector; • low competitiveness of the Estonian ship register that does not motivate ship owners
to bring ships under the Estonian flag. Global competition affects shipping industry very strongly, because companies have the right to register their ships to the registers of other countries (choosing of flag state). Such ships operate as subsidiaries registered in another country that are applied the rights and obligations, taxes etc. of the flag state. The ship owners of countries with higher tax rates and more costly labour register their ships in the registers of flag of convenience states and recruit the crew from countries which citizens do not pay taxes to their country on the earned income. To reduce such unequal competitive impacts, the European Union allows its Member States to support local shipping industry by implementing various measures, of which most important are tax incentives. It is important to provide Estonian shipping companies with equal competitive conditions at least with neighbouring countries. This means bringing into line of ship operating costs to those of competitors as well as improving administrative activities related to ship operating. The system should be established for a long term to ensure companies certainty so that they are ready to invest. The system must also take into account trawlers. According to “Maritime Sector Overview 2013”, the common water charge came into effect on

14 Strategic Environmental Assessment of the National Development Plan “Estonian Marine Policy
2012−2020” Draft Report, 2015
1 July 2013 due to the amendment of the Maritime Safety Act that ensures more uniform principles to stay in competition with neighbouring countries. Shipbuilding and repair According to the commercial register, altogether 155 companies operated in the field of building ship and floating structures and repair of ships and boats in Estonia in 2010. However, there are only four large shipbuilding companies that employ most of the employees (Eesti merenduspoliitika 2012−2020, 2011). As in case of ports, in shipbuilding we have to discuss separately recreational craft building where ca 30 small and medium-sized companies are involved that generate the total turnover of ca 140 million euro. These companies are usually based on local capital and build and develop ships as sub-contractors, but manufacture also their own products (yachts, small commercial boats, fishing boats, wooden boats etc.) and their products are mainly exported to Nordic countries and other European countries (Eesti merenduspoliitika 2012−2020, 2011). There are three weaknesses that limit the development of the shipbuilding sector: lack of qualified labour, no infrastructure to build and repair large ships year around and limited investing capacity. The state can support entrepreneurs through cooperation that targets renovation of the state-owned fleet. As the competitive edge of Estonian companies lies mainly in building special and more complex ships, using technological updates and providing flexibility in fulfilling orders, they have to offer new and innovative solutions. However, entering the market with a new product is complicated, because potential buyers need certainty that these products function. During the renovation of the state`s fleet, it is possible to take into account the new solutions offered by our entrepreneurs that would give them an opportunity to demonstrate the operational reliability of their products and give a reference for potential foreign clients (Eesti merenduspoliitika 2012−2020, 2011). Tourism The main resource of the Estonian marine tourism is the nature that has not been influenced very much by human activity, offers varied landscapes, diversity of species and a long coastline with over 1,500 islands and inlets. The main activities in developing marine tourism are
• an integral development of marine tourism products and services and linking them with other Nordic countries tourism routes;
• turning Tallinn into a starting and destination point of the Baltic Sea cruise ship routes and lengthening the stay time of cruise ships in Tallinn by developing necessary tourism products and services;
• extending international ship travel routes to other Estonian coastal areas and island (e.g. Kunda, Sillamäe, Saaremaa);
• promotion of awareness in neighbouring markets about marine tourism products and services offered on the Estonian coast and islands and about local recreational opportunities (Eesti riiklik turismiarengukava 2014−2020, 2013).
Marine tourism can be divided into two broad categories: passengers of international lines and cruise ships that come to Estonia mainly for destinations that are not related to the sea and recreational craft passengers that visit Estonia`s coast and small harbours for sightseeing and sea-related and coast-related activities. The importance of tourism in Estonian economy is not

15 Strategic Environmental Assessment of the National Development Plan “Estonian Marine Policy
2012−2020” Draft Report, 2015
limited to the carriage services, but also includes money that tourists leave in Estonia to pay for products and services to accommodation, catering and other companies and retailers (Eesti merenduspoliitika 2012−2020, 2011). The Baltic Sea cruises usually begin in England, Denmark, Sweden or Germany. According to Statistics Estonia, in 2011, 294 cruise ships carrying 436,181 passengers visited Estonia, which was a 11% growth compared to 2010 (Eesti merenduspoliitika 2012−2020, 2011). According to the “Maritime Sector Overview 2013”, the number of international passengers that passed through Tallinn Port grew year-on-year by about 400,000 people or 4.5% in 2013 to the record high 9.2 million passengers. The number of cruise ship passengers grew to a record high 530,000 passengers. The market of ship passengers from Finland, the main country of inbound tourism, is saturated and although the number of passengers has grown in recent years, the number of overnight stays is smaller than five years ago. After repeated visits, there are no attractions, products or services that would motivate potential visitors to come to Estonia again. The average stay period of foreign tourists is very short (two nights) and the portion of one-day-visitors is high, which is why income per a tourist is relatively low. This shows that there is a need to extend the selection of tourism services or improve promotional activities. There is still room for development on how to shape the image of Estonia as an attractive country of destination and break down negative prejudices (Eesti merenduspoliitika 2012−2020, 2011). AS Pärnu Sadam started to reconstruct the Pärnu city centre quay in 2015. Pärnu River is also dredged to develop capacity to receive cruise ships in Pärnu. Recreational craft tourism has highest potential to increase the number of tourists visiting Estonia. In summer, about 200,000 yachts sail on the Baltic Sea and the total number of international visitors is estimated to be 2 million people (Eesti merenduspoliitika 2012−2020, 2011). In the context of the Marine Policy, it is important to ensure the competitive edge of companies that are involved in carriage of passengers so that they are able to offer clients attractive price and good service. Currently, there are only 24 harbours in Estonia that offer services compliant with the relevant requirements. A weakness concerning recreational craft tourists is their lack of knowledge about the services offered in small harbours (Eesti merenduspoliitika 2012−2020, 2011). In addition to tourism, the sea is also used for various recreational purposes – sporting and relaxing on the beach and on the sea. According to the Health Board, there were altogether 27 public bathing beaches in counties bordering the sea in 2011. Sailing is a sport that has a growing number of people involved in it in Estonia. The Estonian Yachting Union has 32 sailing organisation with the total of almost thousand members. People sail year around, in summer on yachts and sailboats and in winter on iceboats (TÜ Eesti Mereinstituut, 2012). According to the Estonian National Tourism Development Plan for 2014−−−−2020 (2013), the routes of international shipping lines are overly concentrated around Tallinn and it is necessary to extend them to other coastal regions and islands (e.g. Kunda, Sillamäe, Saaremaa). In addition, to develop marine tourism, it is necessary to improve the awareness of neighbouring markets about the marine tourism products and services offered on the Estonian coast and islands and about the local recreational opportunities.

16 Strategic Environmental Assessment of the National Development Plan “Estonian Marine Policy
2012−2020” Draft Report, 2015
Fisheries Fishing activities on the Baltic Sea are trawl fishing and coastal fishing. The Fishing Act allows coastal fishing up to 20 m isobath, except for the flounder fishing that is sometimes done up to 30 m deep sea in summer. According to the Government of the Republic Regulation No. 144 Fishing Rules of 9 May 2003, trawling is allowed only in the marine areas that are deeper than 20 meters. A regulation of the European Commission specifies every year the fishing quota of the EU for the Member States on the Baltic Sea. The quota allocated to Estonia is divided between trawling companies on the historic fishing right. The national Baltic herring quota is allocated between trawl fishing and coastal fishing, 70% and 30%, respectively. Fishing is done in the fishing squares shown on Figure 2.20 (SA SEI Tallinn, 2012).
Figure 2.4. The Baltic Sea fishing regions (SA SEI Tallinn, 2012). According to the data of Statistics Estonia, deep-sea fishing on the Baltic Sea in 2000–2010 accounted for 75–90% of the total fishing activity on the Baltic Sea. The most caught species are the Baltic herring and the sprats and the portion of these fish in the total catch numbers exceeds 95%. In addition to the Baltic herring and the sprat, the perch, the cod and the flounder are caught from the Baltic Sea (altogether 14% of the catch). The proportion of other fish species in the catch is marginal. No significant changes have occurred in the absolute catch number – altogether 60,000 to 85,000 tons of different fish was caught from the Baltic Sea in 2000–2010 (SA SEI Tallinn, 2012). In 2012, 29 companies were active in Estonia in trawl fishing. As of the end of 2011, ca 215 employees worked on the Baltic Sea trawlers (Eesti kalanduse strateegia 2014−2020, 2013). The main coastal fishing regions are Pärnu Bay, Väinameri and the Gulf of Finland. Many different species are caught, of which economically more important are the perch, the Baltic herring, the smelt, the zander, the flounder, and the eel. The garfish and the sea trout are also important species, the salmon and the pike are caught in smaller numbers (SA SEI Tallinn, 2012). As of 2011, there were 1,530 coastal fishermen and 247 fishermen that fish on coastal and inland waters (Eesti kalanduse strateegia 2014−2020, 2013).

17 Strategic Environmental Assessment of the National Development Plan “Estonian Marine Policy
2012−2020” Draft Report, 2015
The volume of recreational fishing compared to trawl fishing is marginal. In Estonia, there are many recreational fishermen: in 2010 about 292,000 people were involved in recreational fishing activities (270,000 – 317,000, Eesti kalanduse strateegia 2014−2020, 2013). The main raw material of Estonian fish processing companies are local fish species, the Baltic herring and the sprat, and for the filleting companies fresh water fish, the perch and the pike-perch. In 2011, 22% of Estonian total production (fishing and aquaculture) of fish and fish products remained in the country for consumption and 78% was exported (Eesti kalanduse strateegia 2014−2020, 2013). A very important pressure in the fisheries sector is selective extraction of species as well as input of organic matter into the sea. These topics have been discussed in detail in section 2.2. A weakness of fisheries (e.g. in the Gulf of Riga) is high intensity of fishing, which main cause is a high limit number of fishing gear. It is necessary to find a balance between fishing opportunities and the existing stocks. Illegal fishing is also a problem on the Baltic Sea (Eesti kalanduse strateegia 2014−−−−2020, 2013). Aquaculture The production and sales volumes of Estonian aquaculture products have significantly reduced regardless of major investments made during the last decade. In 2011 and 2012, the aquaculture products` sales volume was lower than 400 tons. Export of Estonian aquaculture products has been relatively modest. The main article has been the eel that is sold to a Holland processing undertaking. Sturgeons and crayfish have also been exported in small amounts. The main opportunity to increase export is to farm species that suit to Estonian farming conditions and have a high demand abroad, such as the eel, the crayfish, the sturgeon, the whitefish and perspective new species, and development work to support this activity. Export is the only target for most of these species, because Estonian market will remain too small to allow effective production (Eesti vesiviljeluse arengustrateegia 2014−2020). Fish and crayfish are farmed in Estonian inland waterbodies based on recirculation. Pound-based farming has not been practiced in Estonia. In Estonia, offshore aquaculture practice includes some individual cases. In the opinion of experts, no appropriate competence in this field exists in Estonia. Although there are suitable sites in the sea, they are few. Farming in pounds makes this type of aquaculture more competitive, because of lower energy consumption and smaller capital costs. The common opinion of the representatives of this sector is that pound farming in the sea is an option that must be studied and tested in Estonian conditions (Eesti vesiviljeluse arengustrateegia 2014−2020). Currently, there are some seawater-based fish farms. The above is the reason why aquaculture cannot be considered as linked to the sea and a field that provides economic income from sea (TÜ Eesti Mereinstituut, 2012). However, there is a potential to develop aquaculture-related business in the same areas as offshore windfarms (Jaanuska, 2015). To develop offshore aquaculture, the objective is set to map the regions that are suitable for offshore aquaculture (Figure 2.21), test them and, if suitable, make investments into production. Offshore aquaculture requires taking into consideration currents, depth, ice cover, channels, nature protection areas, dumping, military objects, fishing, spawning, breeding and nesting
18 Strategic Environmental Assessment of the National Development Plan “Estonian Marine Policy
2012−2020” Draft Report, 2015
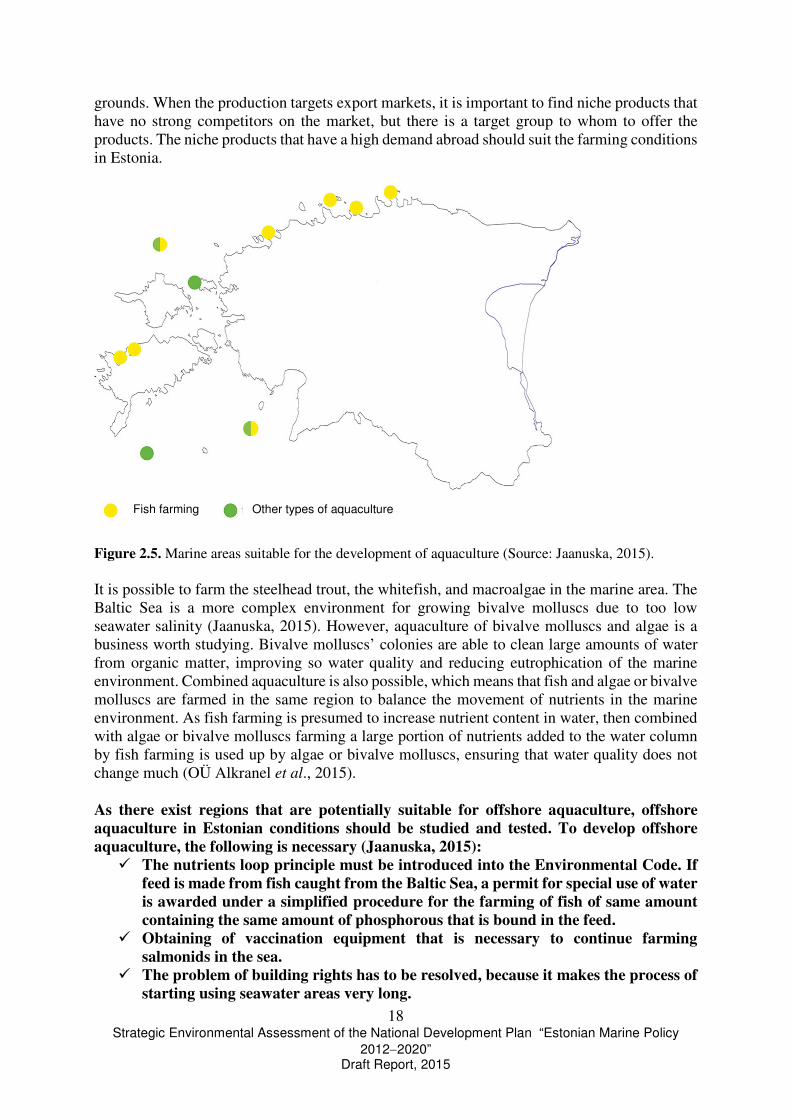
grounds. When the production targets export markets, it is important to find niche products that have no strong competitors on the market, but there is a target group to whom to offer the products. The niche products that have a high demand abroad should suit the farming conditions in Estonia.
Figure 2.5. Marine areas suitable for the development of aquaculture (Source: Jaanuska, 2015). It is possible to farm the steelhead trout, the whitefish, and macroalgae in the marine area. The Baltic Sea is a more complex environment for growing bivalve molluscs due to too low seawater salinity (Jaanuska, 2015). However, aquaculture of bivalve molluscs and algae is a business worth studying. Bivalve molluscs’ colonies are able to clean large amounts of water from organic matter, improving so water quality and reducing eutrophication of the marine environment. Combined aquaculture is also possible, which means that fish and algae or bivalve molluscs are farmed in the same region to balance the movement of nutrients in the marine environment. As fish farming is presumed to increase nutrient content in water, then combined with algae or bivalve molluscs farming a large portion of nutrients added to the water column by fish farming is used up by algae or bivalve molluscs, ensuring that water quality does not change much (OÜ Alkranel et al., 2015). As there exist regions that are potentially suitable for offshore aquaculture, offshore aquaculture in Estonian conditions should be studied and tested. To develop offshore aquaculture, the following is necessary (Jaanuska, 2015):
� The nutrients loop principle must be introduced into the Environmental Code. If feed is made from fish caught from the Baltic Sea, a permit for special use of water is awarded under a simplified procedure for the farming of fish of same amount containing the same amount of phosphorous that is bound in the feed.
� Obtaining of vaccination equipment that is necessary to continue farming salmonids in the sea.
� The problem of building rights has to be resolved, because it makes the process of starting using seawater areas very long.
Fish farming Other types of aquaculture
19 Strategic Environmental Assessment of the National Development Plan “Estonian Marine Policy
2012−2020” Draft Report, 2015
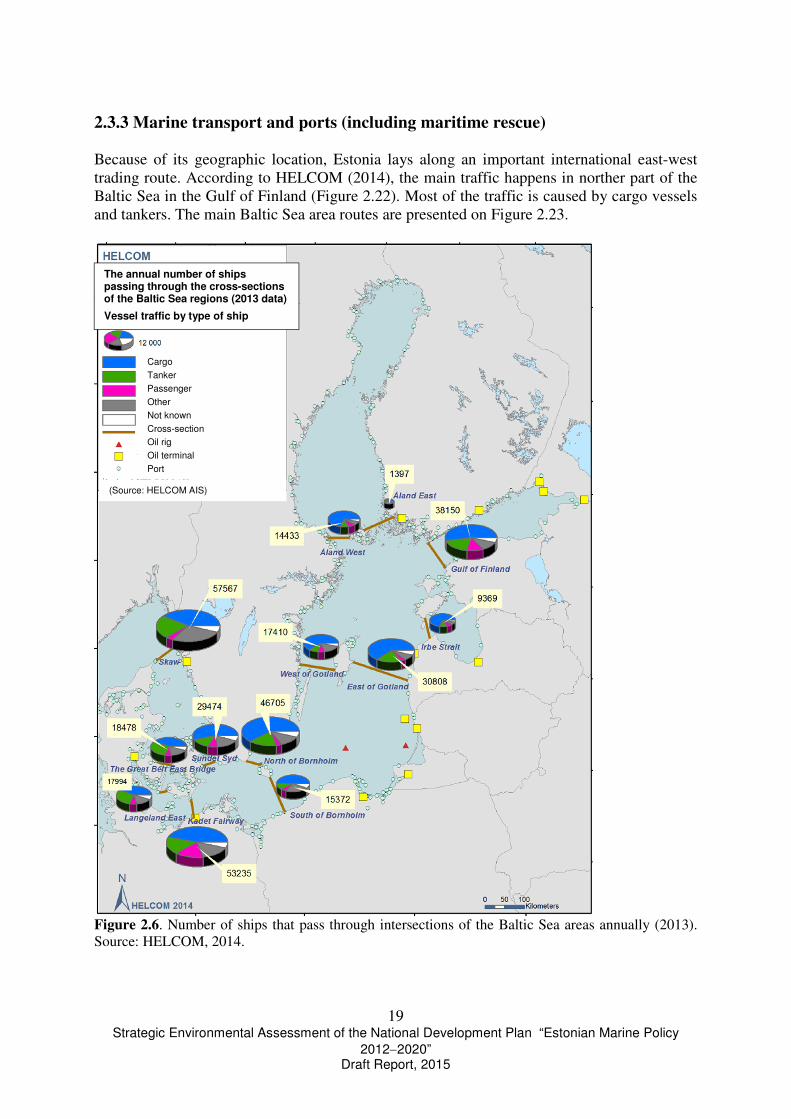
2.3.3 Marine transport and ports (including maritime rescue) Because of its geographic location, Estonia lays along an important international east-west trading route. According to HELCOM (2014), the main traffic happens in norther part of the Baltic Sea in the Gulf of Finland (Figure 2.22). Most of the traffic is caused by cargo vessels and tankers. The main Baltic Sea area routes are presented on Figure 2.23.
Figure 2.6. Number of ships that pass through intersections of the Baltic Sea areas annually (2013). Source: HELCOM, 2014.
The annual number of ships passing through the cross-sections of the Baltic Sea regions (2013 data)
Vessel traffic by type of ship
(Source: HELCOM AIS)
Cargo
Tanker
Passenger
Other
Not known
Cross-section
Oil rig
Oil terminal
Port
20 Strategic Environmental Assessment of the National Development Plan “Estonian Marine Policy
2012−2020” Draft Report, 2015
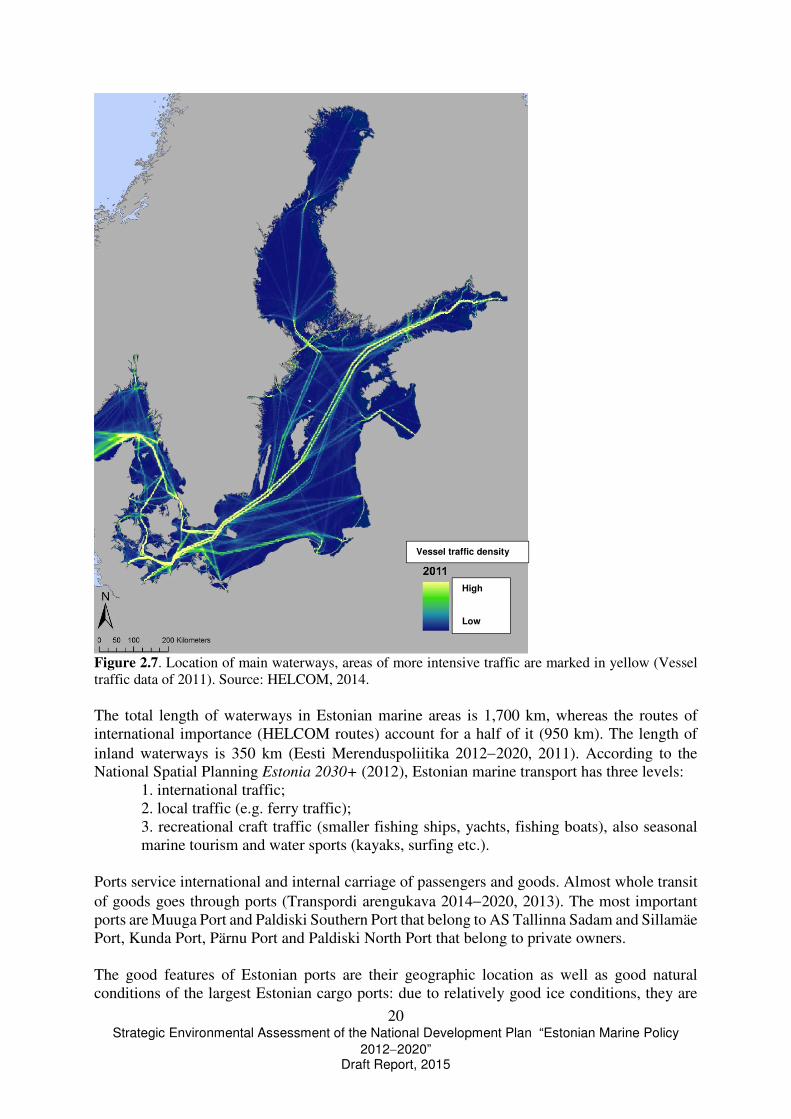
Figure 2.7. Location of main waterways, areas of more intensive traffic are marked in yellow (Vessel traffic data of 2011). Source: HELCOM, 2014. The total length of waterways in Estonian marine areas is 1,700 km, whereas the routes of international importance (HELCOM routes) account for a half of it (950 km). The length of inland waterways is 350 km (Eesti Merenduspoliitika 2012−2020, 2011). According to the National Spatial Planning Estonia 2030+ (2012), Estonian marine transport has three levels:
1. international traffic; 2. local traffic (e.g. ferry traffic); 3. recreational craft traffic (smaller fishing ships, yachts, fishing boats), also seasonal marine tourism and water sports (kayaks, surfing etc.).
Ports service international and internal carriage of passengers and goods. Almost whole transit of goods goes through ports (Transpordi arengukava 2014−2020, 2013). The most important ports are Muuga Port and Paldiski Southern Port that belong to AS Tallinna Sadam and Sillamäe Port, Kunda Port, Pärnu Port and Paldiski North Port that belong to private owners. The good features of Estonian ports are their geographic location as well as good natural conditions of the largest Estonian cargo ports: due to relatively good ice conditions, they are
Vessel traffic density
High
Low
21 Strategic Environmental Assessment of the National Development Plan “Estonian Marine Policy
2012−2020” Draft Report, 2015
better navigable than many other Gulf of Finland ports. The depth of ports is sufficient for even receiving larger (100,000 − 125,000 dwt) ships. Muuga Port is able to service even larger ships that can pass the Danish straits. Besides, the larger ports have all necessary infrastructure and connections with railway and road networks. The latter is especially important in the functioning of an integral transport chain. However, the market share of Estonian ports has dropped on the eastern coast of the Baltic Sea (including Poland and Russia) in 10 years from 18% to 10% (AS PwC, 2014). The reasons for these changes are different, starting with relations with Russia (including slow Estonian-Russian border, Russia`s preference for own ports) to the competition with other Baltic countries` ports and problems between ports and local authorities but also insufficient marketing of Estonian transport corridor at the international level. Major progress has been made in the latter during recent years, e.g. launch of Estonian Shortsea Shipping Centre (SPC Estonia) in 2012 or the activity of the logistics cluster on target markets. Estonian ports have a strong leading position in terms of passenger carriage in the Baltics (AS PwC, 2014). The main passenger carriage route is between Tallinn-Helsinki. For example, the number of international passengers grew in 2013 year-on-year by approximately 400,000 people or 4.5% to the record high 9.2 million passengers. The drivers of this growth were the increased number of shipping line travellers on the largest Tallinn-Helsinki route as well as record high number of cruise ship passengers that reached approximately 530,000 passengers (Majandus- ja Kommunikatsiooniministeerium, 2014). Besides large ports, small and fishing harbours play an important role not only on the local level but also internationally. The development of sailing and recreational tourism depends primarily on the establishment of a network of small harbours and financing their investments and development of diverse coastal tourism products in their neighbourhood. A plan for establishing a network of small harbours for 2014−2020 was prepared in 2014 by the Ministry of Economic Affairs and Communications (approved in April 2014). The plan focuses on the efficient implementation of Estonian recreational craft tourism and it establishes a network of harbours which distance from each other is up to 30 nautical miles and which development the state supports. According to the concept, the network of Estonian small harbours contains 63 larger harbours that have development potential (Majandus- ja Kommunikatsiooniministeerium, 2014). The Estonian Baltic Sea trawlers discharged fish to 17 landing points in Estonia in 2012. The largest amounts of fish were discharged in Dirhami, Veere, Miiduranna, Westmeri, Virtsu, Meeruse, Lehtma and Mõntu harbours. Most of the problems that most of the fishing harbours servicing trawlers have are poor condition of roads that lead to the quay and harbour and water supply and utility systems in the harbours. At the same time, washing equipment and ice machines, with which not all trawler harbours are equipped, are important. Fish from coastal fishing activities was discharged in 477 landing points close to the coast and inland water bodies in 2012. The harbours and landing points are generally in poor technical order and do not meet the requirements of the Ports Act and marine safety conditions. The quays and technical equipment used for landing and initial processing of fish are obsolete. The buildings where to store fish or keep fishing gear are dilapidated or there are not such buildings at all. There are many harbours with no electricity and water supply systems. With the aid of the European Fisheries Fund, it was started to renovate fishing harbours in 2010. By the end of 2015 it is
22 Strategic Environmental Assessment of the National Development Plan “Estonian Marine Policy
2012−2020” Draft Report, 2015
planned to renovate 60 fishing ports and landing points (Eesti kalanduse strateegia 2014−2020, 2013). The navigable inland water bodies in Estonia are usually shallow and consequently are suitable primarily for recreational craft. The number of moorings in harbours is usually small, the way in and basins narrow and shallow. The public sector has very little interest in the development of inland waterbodies, because there is no clear vision about their potential. This has resulted in a weak cooperation between public, private and third sector. The most burning strategic issue regarding the development of inland waterbodies is how to open them up to the Gulf of Finland. Narva falls and the facilities of the hydropower plant that are in Narva city do not allow traffic from the Gulf of Finland to Lake Peipsi by any waterborne vessel. Connection with the Gulf of Finland would significantly increase the number of tourists on inland water bodies and accelerate thereby local economy (Eesti Merenduspoliitika 2012−2020, 2011). Search and rescue operations of people in distress at sea under Estonia`s responsibility and on Lake Peipsi, Lake Lämmi and Lake Pihkva are carried out by the Police and Border Guard Board. Maritime rescue is ensured with the readiness of small units at coastal border points. Voluntary marine rescue is well-developed through organisations that form MTÜ Eesti Vabatahtlike Mere- ja Järvepääste. For improved organisation of maritime rescue operations, the Riigikogu adopted in 2012 amendments to the legislation that regulate the general principles, competence, organisation of work, training, approving, benefits and securities, requirements and releasing from the voluntary marine rescuer status of the voluntary marine rescuers. The Police and Border Guard Board launched a base course of maritime rescue in 2012 (Majandus- ja Kommunikatsiooniministeerium, 2013). In 2013, a contract was made for the establishment of a new ultrashort wave maritime communication network. The range of the new network compared to the old one is much better, because of two additional support stations in Suuremõisa in Hiiumaa and in Pärnu. In addition to the marine area A1, which is also the area of responsibility of Estonian maritime rescue, the navigable inland water bodies, such as Narva reservoir and Narva River and Lake Peipsi and Lake Lämmijärv, were covered by the end of 2014 (Majandus- ja Kommunikatsiooniministeerium, 2014). As the Baltic Sea is an ecologically easily threatened marine area and a pollution-sensitive ecosystem and also a region with intensive traffic, efforts must be continued to improve navigational safety and security in the region. It is also important to continue improving maritime rescue capacity (including, for example, updating of the relevant equipment). From the socio-economic point of view, it is important to address the issue of harbours (including small and fishing harbours) and development of their infrastructure. 2.1.3 Natural resources (mineral resources, wind) and using thereof
The mineral resources in the Estonian marine areas are sand and sea mud, wind and wave energy potential and algae in the marine area could be considered natural resources. The largest deposits of mineral resources in the marine area that have been registered are located west and northwest of Hiiumaa where are Hiiumadal and Kõpu sand deposits. Furthermore, an 34 million m3 of building sand resources have been estimated to lie north of Kõpu peninsula. The largest amounts in recent years were excavated in Naissaare deposit where about 1.8 million m3 sand was extracted in 2008−2010. Ihasalu and Kuradimuna sand deposits are close to Tallinn. Letipea deposit lies north of Kunda which is estimated too hold 2 million
23 Strategic Environmental Assessment of the National Development Plan “Estonian Marine Policy
2012−2020” Draft Report, 2015
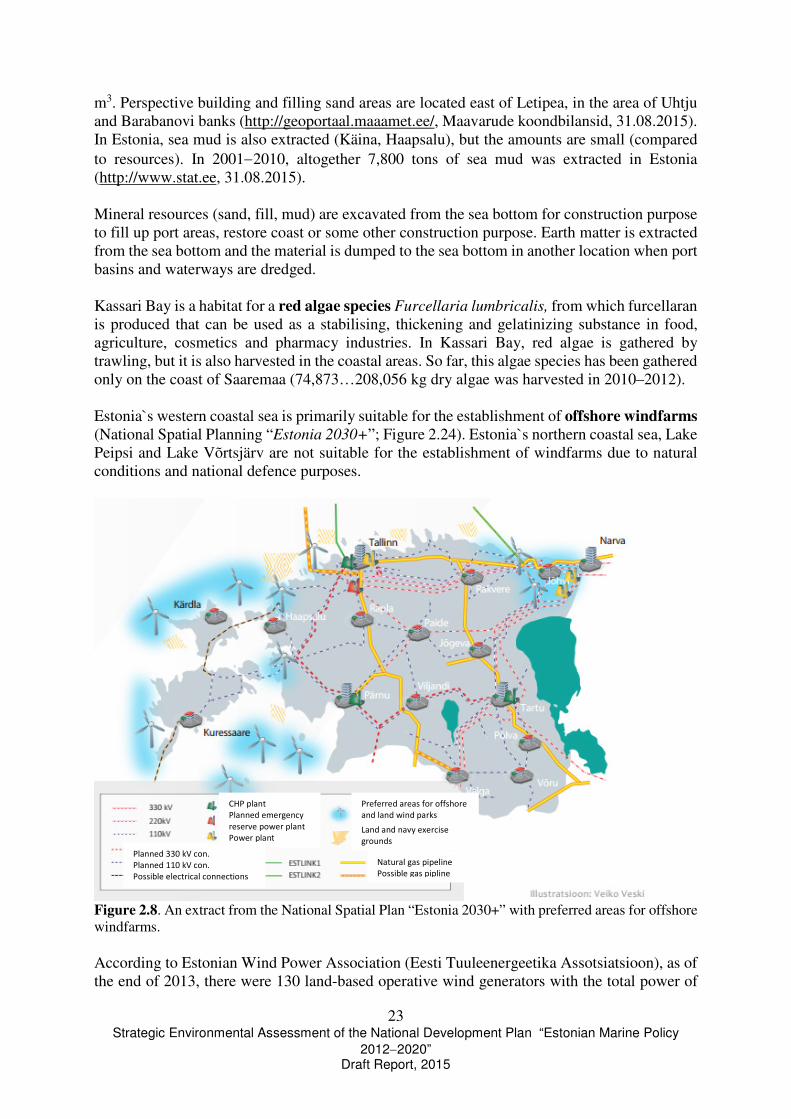
m3. Perspective building and filling sand areas are located east of Letipea, in the area of Uhtju and Barabanovi banks (http://geoportaal.maaamet.ee/, Maavarude koondbilansid, 31.08.2015). In Estonia, sea mud is also extracted (Käina, Haapsalu), but the amounts are small (compared to resources). In 2001−2010, altogether 7,800 tons of sea mud was extracted in Estonia (http://www.stat.ee, 31.08.2015). Mineral resources (sand, fill, mud) are excavated from the sea bottom for construction purpose to fill up port areas, restore coast or some other construction purpose. Earth matter is extracted from the sea bottom and the material is dumped to the sea bottom in another location when port basins and waterways are dredged. Kassari Bay is a habitat for a red algae species Furcellaria lumbricalis, from which furcellaran is produced that can be used as a stabilising, thickening and gelatinizing substance in food, agriculture, cosmetics and pharmacy industries. In Kassari Bay, red algae is gathered by trawling, but it is also harvested in the coastal areas. So far, this algae species has been gathered only on the coast of Saaremaa (74,873…208,056 kg dry algae was harvested in 2010–2012). Estonia`s western coastal sea is primarily suitable for the establishment of offshore windfarms (National Spatial Planning “Estonia 2030+”; Figure 2.24). Estonia`s northern coastal sea, Lake Peipsi and Lake Võrtsjärv are not suitable for the establishment of windfarms due to natural conditions and national defence purposes.
Figure 2.8. An extract from the National Spatial Plan “Estonia 2030+” with preferred areas for offshore windfarms. According to Estonian Wind Power Association (Eesti Tuuleenergeetika Assotsiatsioon), as of the end of 2013, there were 130 land-based operative wind generators with the total power of
Planned 330 kV con.
Planned 110 kV con.
Possible electrical connections
CHP plant
Planned emergency
reserve power plant
Power plant
Preferred areas for offshore
and land wind parks
Land and navy exercise
grounds
Natural gas pipeline
Possible gas pipline

24 Strategic Environmental Assessment of the National Development Plan “Estonian Marine Policy
2012−2020” Draft Report, 2015
279,90 MW in Estonia. Most of these wind generators are located in Saaremaa, western Estonia and Viru County coastal areas, the windiest locations in Estonia (Hiiu maakonnaga piirneva mereala maakonnaplaneering, 2014). Currently, there are no wind generators and windfarms in the marine areas. Although no marine areas are planned to be used for wind energy development in the Wind
energy thematic plan of Lääne County plan (2013) and the Wind energy thematic plan of Saare
County plan (2013), the principle locations of transmission lines (Figure 2.25) are marked and an option to join the Latvian power grid is included as a potential transmission line in the “Wind
energy thematic plan of Pärnu County plan” (2013).
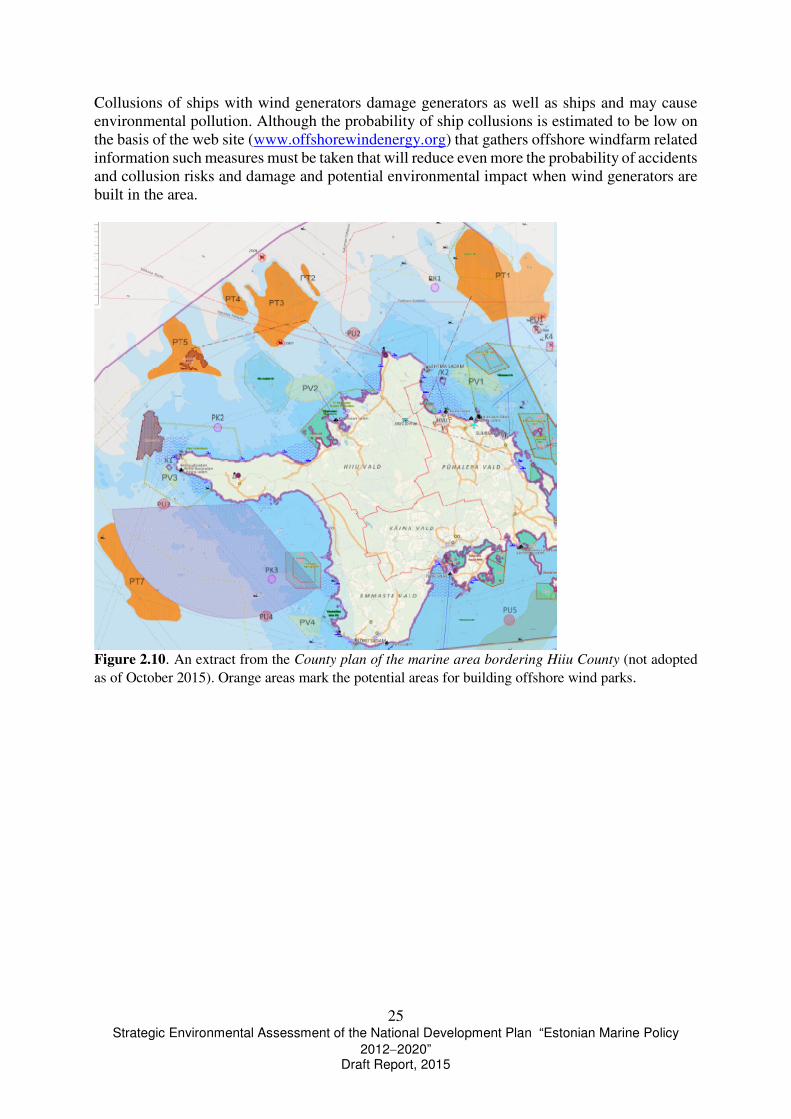
Figure 2.9. An extract of the “Wind energy thematic plan of Pärnu County plan” (2013) where the orange line shows the potential location of a transmission line across the marine area. Potential areas (Figure 2.26) for the construction of windfarms that are at least 12 km from the coast are shown in the County plan of the marine area bordering Hiiu County (not adopted). There is a plan to establish a connection between Hiiumaa and dry land over the Vormsi Island, which would improve supply certainty, because this way a circular supply system is created. It is also possible to connect larger new consumers in Hiiumaa or improve the connecting options for the existing consumers.
Potential areas (Figure 2.27) for the construction of windfarms that are at least 10 km from the coast are shown in the County plan of the marine area bordering Pärnu County (not adopted). According to the Estonian Energy Management Development Plan up to 2018, the production volume of offshore windfarms is planned to be 200 MW in 2016–2017 and 500 MW in 2018–2025. However, for 2030, Estonia`s offshore wind energy resource potential was estimated at 1550 MW (the relevant yearly production 5,839 GWh) for the erection of offshore windfarms (Eesti Arengufond, 2013). The Estonian Renewable Energy Action plan up to 2020 specifies as an action supporting offshore windfarm establishment with investment aid upon finding tariff free financing sources.
25 Strategic Environmental Assessment of the National Development Plan “Estonian Marine Policy
2012−2020” Draft Report, 2015
Collusions of ships with wind generators damage generators as well as ships and may cause environmental pollution. Although the probability of ship collusions is estimated to be low on the basis of the web site (www.offshorewindenergy.org) that gathers offshore windfarm related information such measures must be taken that will reduce even more the probability of accidents and collusion risks and damage and potential environmental impact when wind generators are built in the area.
Figure 2.10. An extract from the County plan of the marine area bordering Hiiu County (not adopted as of October 2015). Orange areas mark the potential areas for building offshore wind parks.

26 Strategic Environmental Assessment of the National Development Plan “Estonian Marine Policy
2012−2020” Draft Report, 2015
Figure 2.11. An extract from the County plan of the marine area bordering Pärnu County (not adopted as of October 2015). Lilac areas mark the potential areas for building offshore wind parks. The potential of wave energy in Estonian coastal waters has been studied in a Masters thesis of Tallinn University of Technology (Tallinnna Tehnikaülikool) (Eelsalu, 2013). The thesis shows that wave energy potential exists in the entire Baltic Sea. The result of the work is that the theoretical wave energy total capacity in Estonia`s open sea par of the Baltic Sea is 700 MW. A central problem for using wave energy is seasonal ice cover of the Baltic Sea. There are several ongoing projects that study the possibility to produce electricity for local use from wave energy in the icing sea (for example, Interreg IVA programme project WESA; www.wesa.ax). Nevertheless, it can be said that this energy producing method will be used in future, if only in a limited way. There are several sea-based natural resources that are used or can be potentially used. It is important to find a balance between using natural resources and related potential environmental impacts. 2.1.4 Marine cultural heritage and traditional coastal lifestyle
Estonia has a rich sea-related cultural heritage be it cultural objects in the sea or the traditional coastal lifestyle. There are numerous wrecks that have been designated as heritage protection objects in the Estonian waters. However, there are a lot of such wrecks in the sea that have not been entered into the list of cultural objects because the processing of wrecks is in progress or it has not been possible to conduct studies to classify the wrecks as cultural objects. A positive aspect is that a separate wreck register has been established by the national register of cultural monuments.

27 Strategic Environmental Assessment of the National Development Plan “Estonian Marine Policy
2012−2020” Draft Report, 2015
In addition to wrecks, cultural objects are also sea related buildings and facilities on the coast, such as lighthouses. Nowadays, the importance of lighthouses as a navigational aid is gradually diminishing, but they have an important historic value and tourist attraction potential. This rises the problem how to conserve historically valuable lighthouses and other navigational equipment for future generations, because the authorities that are responsible for ensuring safe navigation cannot be given the task to conserve historic property. Former coastal military buildings characteristic to certain historical periods (Soviet times as well as earlier periods) in Estonia can be considered cultural property (e.g. Käsmu Maritime museum is in a border point building that originates from the time of Czar rule (Lahemaa rahvuspargi kaitsekorralduskava 2016−2025 tööversioon, May 2015). Estonia has a long coastline with varied coastal landscape and many accesses to the sea. Beautiful nature, traditional coastal villages with interesting history and cultural heritage (including harbour sites, boat landings, boat sheds etc.) and experienced fishermen that carry the tradition of coastal fishing are characteristic of the coastal living environment. Different cultures and communities (the Old Believers, the Seto, the Russians, the Estonians) make different coastal areas unique (Eesti Merenduspoliitika 2012−2020, 2011). However, the coastal villages have low population density, decreasing and ageing population, few jobs and insufficient infrastructure. During the past century, the coastal lifestyle has suffered drastic changes for historic reasons. The coastal fishing tradition is fading away, the work traditions and handicraft skills related to coastal life are fading away, and coastal landscapes have grown over with shrubs or are under strong construction pressure. Along with the fading traditional coastal lifestyle, also memories about the former life on the coast are forgotten. However, there are still people around that remember the life in the coastal areas in the 20th century, but their memories need to be studied and preserved. In coastal villages, there is unused potential for developing tourism services and other small businesses and creating a high-quality living environment (Eesti kalanduse strateegia 2014−2020, 2013). With the finances of the European Fisheries Fund, renovation of small harbours and landing points, processing of fish products and agar-agar and direct marketing, development of fishing related tourism and enlivening of coastal villages, diversification of fishermen activities in other times than during fishing season and training has been supported in recent years. Maritime and coastal lifestyle heritage should be kept alive and made visible to people and accessible to all interested. Although these activities are mainly focused on the coastal areas, it must be also taken into account that maritime image has to be improved among inland habitants by promoting the opportunities about sea access and coastal tourism possibilities. 2.1.5 Maritime education and research and development activity
Maritime education As maritime subject is an interdisciplinary field, maritime education is provided by various educational institutions. Maritime education is mostly offered at Estonian Maritime Academy of Tallinn University of Technology (TTÜ Eesti Mereakadeemia) that provides professional higher education and Master`s level studies. The institution also offers continual vocational training for maritime specialists. Vocational education is given at Estonian Maritime School (Eesti Merekool). Education is provided in Tallinn (vocational training and professional higher

28 Strategic Environmental Assessment of the National Development Plan “Estonian Marine Policy
2012−2020” Draft Report, 2015
education and continual vocational training), in Pärnu (continual vocational training) and in Tartu (inland navigation vocational training). In cooperation with Orissaare Gümnaasium (upper secondary school) and Kuressaare Täiskasvanute Gümnaasium (upper secondary school for adult) vocational training is offered to the students of these schools in Saaremaa. In cooperation with Kuressaare College of Tallinn University of Technology (Tallinna Tehnikaülikooli Kuressaare Kolledž) recreational craft builders are taught in Saaremaa. Certain maritime fields are taught at Tallinn University of Technology, Tallinn University of Applied Sciences, Tallinn University and Estonian University of Life Sciences. Vocational training related to maritime affairs is also offered at Kuressaare Vocational School (recreational craft building), Hiiumaa Vocational School (small harbour specialist) and Tallinn Transport School (logistic) (Eesti merenduspoliitika 2012−2020, 2011). In Estonia, maritime science and education development concept must be created that would integrate the existing maritime science and education potential and would efficiently allocate the existing resources. By strengthening existing competence centres and developing field-related modules, a structured curriculum system should be created to ensure an opportunity to get education at every level from vocational education to research-based Doctoral studies. Among other things, the problem that only 30% of the places allocated to the Maritime Academy and Maritime School can be provided vocational education (Eesti merenduspoliitika 2012−2020, 2011). The educational institutions must organise, coordinate and support learning abroad in such maritime educational fields and levels which education in Estonia is not feasible to develop due to small demand but there is a certain need on the Estonian labour market for such specialists. The increase of maritime competence of authorities should be supported also (Eesti merenduspoliitika 2012−2020, 2011). Currently, there is a serious deficiency of ship`s officers in the EU and rating of EU citizens. On the one hand, the reason is increased in international carriage of goods; on the other hand, decreased interest towards the profession of seaman in the EU Member States. In Estonia, there is excess of seamen with good qualification, but the national shipping industry has been decreased from the beginning of the 1990s. This has created a situation where we export our labour force to other EU Member States (Eesti merenduspoliitika 2012−2020, 2011). Marine monitoring and development activity Within the Estonian national environmental monitoring programme, marine monitoring is conducted that includes monitoring and distant monitoring of the coastal sea, high seas and sea coasts. The general objective of monitoring is to detect the impact made by human activity on the Baltic Sea and determine its scope in the context of natural changes, including giving assessment of efficiency of quantitative and qualitative measures taken and gathering background data necessary for adjusting and amending protection measures. The monitored parameters are content of nutrients in seawater, phytoplankton and marine plankton spatial and temporal distribution, changes in benthic species, content of hazardous substances in marine organisms etc. (seire.keskkonnainfo.ee). In addition to sea monitoring within the framework of the national environmental monitoring programme also marine biota (e.g. fish fauna, seals, sea islands breeding birds etc.) is monitored within the nature diversity and landscape monitoring sub-programme.
29 Strategic Environmental Assessment of the National Development Plan “Estonian Marine Policy
2012−2020” Draft Report, 2015
Sea is also studied with one-time specific projects. BONUS EEIG (BONUS for the Baltic Sea
science – network of funding agencies) has been established for the organisation of scientific research of the Baltic Sea in cooperation with the EU and the countries surrounding the Baltic Sea which main objective is to coordinate and support sea research activities in the Baltic Sea region (Eesti merenduspoliitika 2012–2020, 2011). The European Union has supported the decision to take measures for the establishment of a monitoring system with a better resolution to connect the existing monitoring and observation systems that are used for ensuring safe navigation and security, monitoring of the marine biota and quality of water, determining the status of marine environment, assessing the efficiency of measures implemented for the protection of the marine environment, detecting and eliminating marine pollution, fishing control, protecting external borders and other law enforcement activities (Eesti merenduspoliitika 2012−2020, 2011). Marine monitoring requires common coordinated activity because currently the tasks are divided between five different ministries. The Police and Border Guard Board under the Ministry of Interior is responsible for protecting the sea border and ensuring general protection of public order in the Estonian marine areas, but also searching and rescuing people in distress in the Estonia`s area of responsibility and detecting, localizing and liquidating marine pollution. The Estonian Maritime Administration is responsible for safe and secure traffic in Estonian marine areas. Estonian Navy performs national defence tasks in the Estonian marine areas that affect navigation safety (including mine clearance, shooting exercises etc.). The task of the Environmental Inspectorate is to control the marine environment protection and fishing rules in the Estonian marine areas. The National Heritage Board (Muinsuskaitseamet) under the Ministry of Culture organises protection and supervision over underwater monuments. The Ministry of the Environment organises national monitoring of the environment. Currently, the entire marine monitoring system does not give the entire picture for the users of different authorities because there is not a uniform information exchange system between the authorities (Eesti merenduspoliitika 2012−2020, 2011). Because the marine environment and maritime industry are important, it is necessary to continue providing quality marine education and facilitate scientific research and continue with marine monitoring. 2.1.6 Air quality, including traffic noise in the air environment Air quality Exhausts from marine transport deteriorate air quality and bring into the environment undesirable nutrients (Kalli et al., 2013). It has been found that CO2, NOX, SO2 and PM2.5
emissions originating from the traffic on European waters accounts for 10−20% of the marine transport emissions of the entire world. CO2-emissions from both local and international ships that visit European (EU-27) ports account for up to 30% (EEA, 2013). In 2009, in the European SECA (see explanation below) the main marine transport generated emissions were caused by container and RoPax ships that emitted, for example, 43% of SOx emissions caused by the vessel traffic in the region. The other sources of emissions are general cargo vessels, chemicals tankers and ro-ro ships (Kalli et al., 2013). Research conducted in the North Sea has shown that ca 89% marine transport related emissions occur up to 50 nautical miles from the coast and ca 97% up to 100 nautical miles from the coast.
30 Strategic Environmental Assessment of the National Development Plan “Estonian Marine Policy
2012−2020” Draft Report, 2015
Globally, the relevant indicators are ca 70% of emissions up to 400 km from the coast (EEA, 2013). It has been found that in the neighbourhood of the European SECA larger ports (including Tallinn) are high PM2,5 concentrations (per square kilometre) that exceed even the relevant concentrations in the most intensive traffic regions (Johansson et al., 2013). However, recent air quality studies conducted in the neighbourhood of Tallinn, Helsinki and Turu ports within the framework of the SNOOP project (Kousa et al., 2013) show that air pollution indicators of Tallinn were lower compared to Helsinki and Turu cities. This is due also to the better location of the port in Tallinn. The same study (Kousa et al., 2013) has come to the conclusion that although air pollution generated by vessel traffic and related activities in the ports has an impact on human health, it is much smaller compared to air pollution generated by city traffic. The main problem pollutant is superfine solid particles PM2.5 (Kalli et al., 2013). The main air quality problems of other Estonian ports are related to Muuga Port and Sillamäe Port (Eesti Keskkonnauuringute Keskus, 2012). The air quality problem in these areas is not related to traffic, but the goods handled at these ports (primarily smell problems). Both ports are located near densely populated areas and in a region where air quality is influenced significantly also by industrial companies. Pollution from marine transport is regulated by the International Marine Organisation (IMO) convention (Regulations for the Prevention of Air Pollution from Ships) MARPOL 73/78 Annex VI. Until 2008, the convention allowed to use ship fuels with sulphur content 4.5% in all marine regions, except for established sulphur emission control areas or SECAs, where the maximum sulphur content was not allowed to exceed 1.5%. As emissions from ships have significantly increased the acidification problem that haunts the Northern Europe, IMO has designated the Baltic Sea, the North Sea and La Manche as SECAs in the EU (Euroopa Komisjon, 2011). As a result of international call to implement additional measures in order to reduce the emissions caused by marine transport, the parties to the IMO convention reviewed MARPOL Annex VI at the end of 2008. As a result of the review, the content of sulphur in fuels used on all seas shall be gradually reduced to 0.5% from 2020 and in SECAs to 0.1% from January 2015. Provisions which purpose is to ensure compliance with the requirements are technologically neutral and the requirements may be fulfilled by reduction of emissions with alternative methods, such as exhaust gas cleaning systems, or using alternative clean fuels, such as liquefied gas (LNG) (Euroopa Komisjon, 2011). According to Johansson et al. (2013), the restriction on sulphur content during 2009−2011 significantly reduced marine transport generated SOx-and PM2,5-emissions. SOx-emissions have reduced ca 33% and PM2,5-emissions ca 20%. Because of the requirement to reduce the sulphur content of ship fuel, SOx-emissions and PM2,5-emissions will continue to reduce. However, the requirements regarding marine traffic generated nitrogen oxides (NOx) apply only on taking into exploitation of new ships. Consequently, NOx caused air pollution emitted by marine transport is reduced at the same pace as fleets are renewed (Kalli et al., 2013). As regards CO2-emissions, Kalli and others came to a conclusion in their study (2013) that if the European Commission will not implement new measures it is not realistic to achieve a reduction of CO2-emissions to 40% of the 2005 level. One potential measure is to use cleaner fuels, e.g. liquefied natural gas (LNG).

31 Strategic Environmental Assessment of the National Development Plan “Estonian Marine Policy
2012−2020” Draft Report, 2015
Exhaust gas emissions generated by marine transport are significant because they deteriorate air quality and bring undesirable nutrients to the environment. Of the exhaust gases that are released into air, SO2 causes acidification and NOx eutrophication. Therefore, it is important to deal with reduction of air pollution. Vessel traffic noise in the air environment Because ships that sail along waterways that are far away, the level of noise caused by ships may be considered insignificant compared to the noise that reaches the water environment and affects the water biota (see section 2.2.2). Noise caused by ships that transfers via air will be important primarily in the region of ports for the people that live in the region. Larger and historical ports are usually located in cities or in densely populated areas or close-by. Even if a port was initially planned outside the city centre, the pressure to develop areas along the coast as residential and recreational areas, which happens also in areas close to ports. Usually noise caused by activities in ports can be considered local, which scope of influence is some hundred metres from the port area (Mustonen, 2013). However, in cases where ports are located in a city, port generated noise will become important, and this especially in co-influence with other noise sources in the city (street traffic, industrial buildings, etc.). There are several sources of noise in a port and their existence and location depends on the specific port. Usually, noise generated in a cargo port is considered stronger compared to noise caused in a passenger port. However, passenger ports are usually located in the city centre, which is why they have to deal with the residents that are not satisfied with the port-generated noise. Noise may be caused in ports by vehicles operating in the port, vehicles that enter or exit the territory of the port, railway, ships that moor in the port etc. (Mustonen, 2013). It is hard to control noise generated in ports because of many factors, for example, extensive port areas in the open air, acoustic reflective surfaces (including closeness to water), noise sources with different noise emissions (including tone, impulses) that are located at different heights etc. (Mustonen, 2013). Regardless, there are certain measures that can be taken to alleviate noise. For example, in case of large ports, it is possible to plan noisy activities as far as possible outside of urban environment, impose speed limits on vehicles that drive on the port`s territory, use less noisy machines, ensure electricity supply connections from shore to ships, construction of noise barriers etc. The need to use the mentioned measures depends on the particular port and the specific noise situation. When improving noise situation, measures that help avoid causing of noise are preferred, followed by noise alleviating measures (e.g. control of speed). In Estonia, according to the Health Board (Annex 1 – an opinion issued for the SEA programme) there have been complaints of residents about noise from the port territory in addition to Tallinn port also in Muuga, Miiduranna and Pärnu port areas. In order to assess and improve noise situation, relevant measurements and modelling of the level of noise are conducted based on which noise alleviating measures are developed. In Estonia, noise studies are conducted when new ports are built, when the existing ports are expanded or when the current situation is mapped. Noise generated by ship traffic that travels through air is important in terms of human wellbeing and health primarily for the people that live in port regions. Consequently, it is especially important to pay attention to the noise topic when ports are developed.
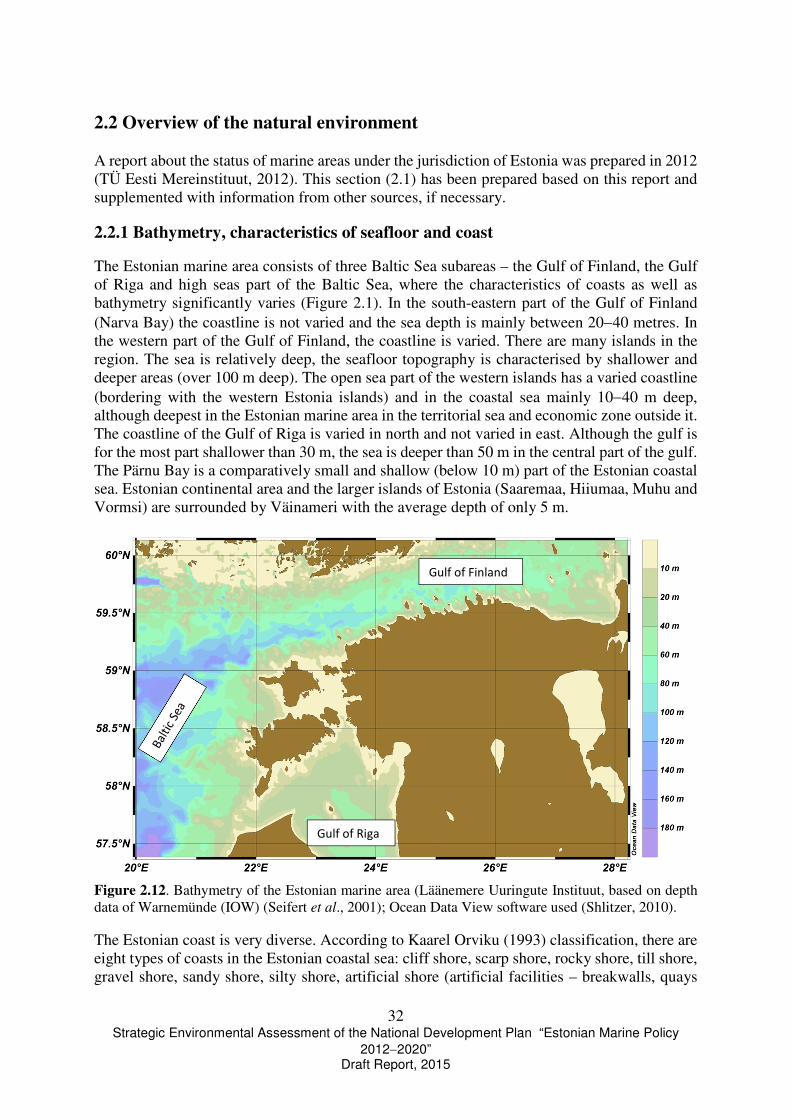
32 Strategic Environmental Assessment of the National Development Plan “Estonian Marine Policy
2012−2020” Draft Report, 2015
2.2 Overview of the natural environment A report about the status of marine areas under the jurisdiction of Estonia was prepared in 2012 (TÜ Eesti Mereinstituut, 2012). This section (2.1) has been prepared based on this report and supplemented with information from other sources, if necessary.
2.2.1 Bathymetry, characteristics of seafloor and coast
The Estonian marine area consists of three Baltic Sea subareas – the Gulf of Finland, the Gulf of Riga and high seas part of the Baltic Sea, where the characteristics of coasts as well as bathymetry significantly varies (Figure 2.1). In the south-eastern part of the Gulf of Finland (Narva Bay) the coastline is not varied and the sea depth is mainly between 20−40 metres. In the western part of the Gulf of Finland, the coastline is varied. There are many islands in the region. The sea is relatively deep, the seafloor topography is characterised by shallower and deeper areas (over 100 m deep). The open sea part of the western islands has a varied coastline (bordering with the western Estonia islands) and in the coastal sea mainly 10−40 m deep, although deepest in the Estonian marine area in the territorial sea and economic zone outside it. The coastline of the Gulf of Riga is varied in north and not varied in east. Although the gulf is for the most part shallower than 30 m, the sea is deeper than 50 m in the central part of the gulf. The Pärnu Bay is a comparatively small and shallow (below 10 m) part of the Estonian coastal sea. Estonian continental area and the larger islands of Estonia (Saaremaa, Hiiumaa, Muhu and Vormsi) are surrounded by Väinameri with the average depth of only 5 m.
Figure 2.12. Bathymetry of the Estonian marine area (Läänemere Uuringute Instituut, based on depth data of Warnemünde (IOW) (Seifert et al., 2001); Ocean Data View software used (Shlitzer, 2010). The Estonian coast is very diverse. According to Kaarel Orviku (1993) classification, there are eight types of coasts in the Estonian coastal sea: cliff shore, scarp shore, rocky shore, till shore, gravel shore, sandy shore, silty shore, artificial shore (artificial facilities – breakwalls, quays
Gulf of Finland
Gulf of Riga

33 Strategic Environmental Assessment of the National Development Plan “Estonian Marine Policy
2012−2020” Draft Report, 2015
and protective walls). It is important to ensure that anthropogenic processes do not influence significantly the proportion of various coastal types in the Estonian coastal sea. Coasts in the Estonian coastal sea are in very different stages of development. There are coastal zones that have active, maturing and matured or dead coasts (Orviku, 1993). The fast-developing coasts are usually exposed to waves and active coastal processes occur there constantly. On maturing coasts, changes occur only during high water stages and strong storms. In dead coastal zones, waves do not cause usually any changes any more. Construction of hydrotechnical structures usually poses a problem in areas with active coastal processes. When compiling maps that cover the entire Baltic Sea, e.g. during the EMODnet geological pilot project (Figure 2.2) and Interreg project BALANCE, mainly existing archive data from earlier studies have been used to characterise the seafloor of the Estonian marine area. Based on the analysis conducted during the EMODnet project and the used classification, mostly muddy sediments are characteristic of the Estonian marine area. Moraine, sand and coarse-grained sediments can also be found (shingles). Bedrock or mixed sediment areas are less frequent.
Figure 2.13. Seabed substrate of the Estonian marine and neighbouring areas based on the data of EMODnet pilot project (source: http://onegeology-europe.brgm.fr/geoportal/viewer.jsp; archive data has been used for the Estonian marine area). Categories: green – mud to sandy mud; light yellow – sand to muddy sand; brown – coarse-grained sediment; lilac – mixed sediment; dark yellow – till; red – bedrock. The map was published by the Estonian Marine Institute of Tartu University (TÜ Eesti Mereinstituut 2012). Most frequent seafloor reliefs in the Estonian marine area outside coastal sea are muddy or clayey plains and valleys. In the western part of the Gulf of Finland and in the northern part of the high seas part of the Baltic Sea are plains with hard seafloor. In the shallower part of the Gulf of Riga, Väinameri and offshore bordering Hiiumaa and Saaremaa, are plains with coarse
34 Strategic Environmental Assessment of the National Development Plan “Estonian Marine Policy
2012−2020” Draft Report, 2015
gravel. Coarse gravel, sandy and clayey plains alternate in the shallower part of the Gulf of Finland. 2.2.2 Temperature, salinity, stratification, ice cover
Temperature and salinity define mostly the characteristics of a region`s ecosystem, including species composition. The temperature and salinity fields in the Baltic Sea are highly variable both in time and space, which is caused by complex topography, strong horizontal and vertical gradients and major atmospheric variability at different temporal scales, i.e. long-term trends, year-on-year changes, seasonal cycle and synoptic variability. It is possible to determine the proportion of fresh water that originates from mainland based on seawater salinity which in turn determines the natural content of nutrients. Salinity is also one of the factors that regulates the species composition of the marine biota and limits the use of particular species as indicators of the environmental condition. There are strong horizontal and vertical salinity gradients in the Estonian coastal sea. The coastal sea with salinity lower than 5.0 g/kg of the medium surface layer covers an area from the mouth of River Narva to the area near the mouth of River Purtse and the Pärnu Bay. Usually there is a three layer (in summer) and a two layer (winter) temperature and salinity vertical structure in sufficiently deep (> 60−80 m) parts of the sea. Seasonal mixed warm and less salty upper layer is usually 10−30 m thick. Under the upper mixed layer, there is a seasonal temperature and salinity jump that separates the upper layer from the colder medium layer that forms in winter. There is a salinity jump at 60−100 m under the medium layer and, below that, a warmer (5−6 °C) and saltier water originating from the North Sea that on its way from the Danish straits to the Estonian marine areas has mixed with the water of the medium layer. Several sources (e.g. Mackenzie and Schiedek, 2012) have pointed out a significant rise in the temperature of the surface layer in the Baltic Sea during the past century. It has been found that in later years (1990−2008) the warming of Estonian coastal sea has been especially rapid, around 0.6−1 °C decade (Lehmann et al. 2011). For the same period (end of the 1980s and start of this century), it has been found that the bottom layer of the Gulf of Finland has become warmer and saltier (Liblik and Lips, 2011). The variability of synoptic temporal scales depends on advection, mesoscale processes and intensity of vertical mixing. The largest synoptic scale changes in salinity of the upper layer are accompanied by advection and mesoscale processes. Upwelling events are frequently the cause of local high salinity levels of the surface layer in the Gulf of Finland and offshore Baltic Sea. Cold water transported to the upper layer during upwelling is usually saltier. However, winds that hinder estuarial circulation (from west) and stimulate it (from east) play also a role in influencing the upper layer. In the first case saltier water is transported from the open sea part of the Baltic Sea and in the second case less salty water from the eastern part of the gulf to the surface layer of the Gulf of Finland. Density and stratification of seawater depend mainly on the variability of temperature and salinity described above. If we study the hypsographic curve of the Estonian marine areas, it shows that around 20% of the Estonian marine area is so shallow that it should be mixed from the surface to the bottom most of time, 50% is temporarily stratified and around 30% of the marine area is deeper than 60 m that allows formation of the halocline, i.e. there is a high probability that in this area the water column is stratified all year around. Hence, Väinameri and the Pärnu Bay are constantly mixed marine areas, the Gulf of Riga and the south-eastern part of the Gulf of Finland are temporarily stratified and the water column in the western part

35 Strategic Environmental Assessment of the National Development Plan “Estonian Marine Policy
2012−2020” Draft Report, 2015
of the Gulf of Finland and offshore Baltic Sea is constantly stratified for the most part. The most significant change in the stratification patterns that have occurred in recent decades is in the bottom layer where water has been much denser after the middle of the 1990s. As the temperature of the surface layer has increased in recent years, changes can be expected in the upper pycnocline stratification. Upwellings weaken stratification as does hindering of estuarial circulation. Stimulating estuarial circulation in the Gulf of Finland increases stratification. In the Gulf of Riga stratification depends mostly on the temperature and spread of the less salty surface layer because the waters of the deep layer of the Baltic Sea do not reach this area due to relatively shallow Irbe strait. Vertical mixing generated by wind that does not allow stratification to last long plays an important role in shallower marine areas. Ice cover on the Baltic Sea may be very different every year. In shallow and half-closed bays, ice may cause hypoxia. Abundance of ice is mainly dependent on winter harshness that in turn depends on the atmospheric circulation. If the airflow from the west that carries warmer and more humid air from the North Atlantic is stronger, the winter is softer. In addition, local ice conditions depend on other variables, such as the wind regime or amount of precipitation. Lighter ice conditions in the Estonian marine area exist in offshore Baltic Sea and more difficult ice conditions in Väinameri, the Pärnu Bay and the Narva Bay. Monitoring results of the past hundred years show that the annual maximum ice cover and the ice cover duration on the Baltic Sea has decreased (The BACC II Author Team, 2015). Ice is an important factor that influences vessel traffic, processes that occur in ports and on the coast. Difficult ice conditions increase the frequency of shipping accidents. Thick ice cover and/or ice pressure caused by a strong wind may leave ships icebound. It is also speculated that the recent changes in the ice climate of the Baltic Sea may be partly caused by the increased intensity of marine transport (The BACC II Author Team, 2015). 2.2.3 Currents, wave regime and sea level Characteristic current velocity in the surface layer of the Estonian marine area is 10−20 cm s-1. At the same time, currents are very changeable and depend largely on local wind. Volatility is dominated by an inert period, a period related to self-oscillation of the Baltic Sea and mesoscale processes (synoptic scale). The maximum current velocities that exceed 1 m s-1 have been registered in straits (e.g. Suur väin strait) and along the coast (e.g. in the Gulf of Finland) in case of strong jet currents that occur from time to time. As during summer months the marine area is vertically stratified, the vertical distribution of currents is also characterised by stratification. It is important to note that in the deeper layers of the sea (including close to the seafloor) there may be currents with velocity of 40−50 cm s-1. For example, the Marine Systems Institute at Tallinn University of Technology has measured the maximum current velocity of the demersal layer to be 43 cm s-1 in the Gulf of Finland in 2010−2011. The Gulf of Finland is directly connected to offshore Baltic Sea. There are no straits and thresholds that would restrict the movement of under-halocline water to the Gulf of Finland. In the surface layer of the Gulf of Finland, water motion is on an average cyclonic. As characteristic of stratified estuaries, inflow from offshore Baltic Sea to the gulf dominates in demersal layers (deeper water layers) and outflow from the gulf in upper water layers. Strong south-western winds can temporarily reverse this circulation scheme, i.e. outflow dominates in deeper layers and inflow prevails in the upper layer. In recent years, the structure of simulated currents in the Gulf of Finland for different periods has been analysed with various numerical
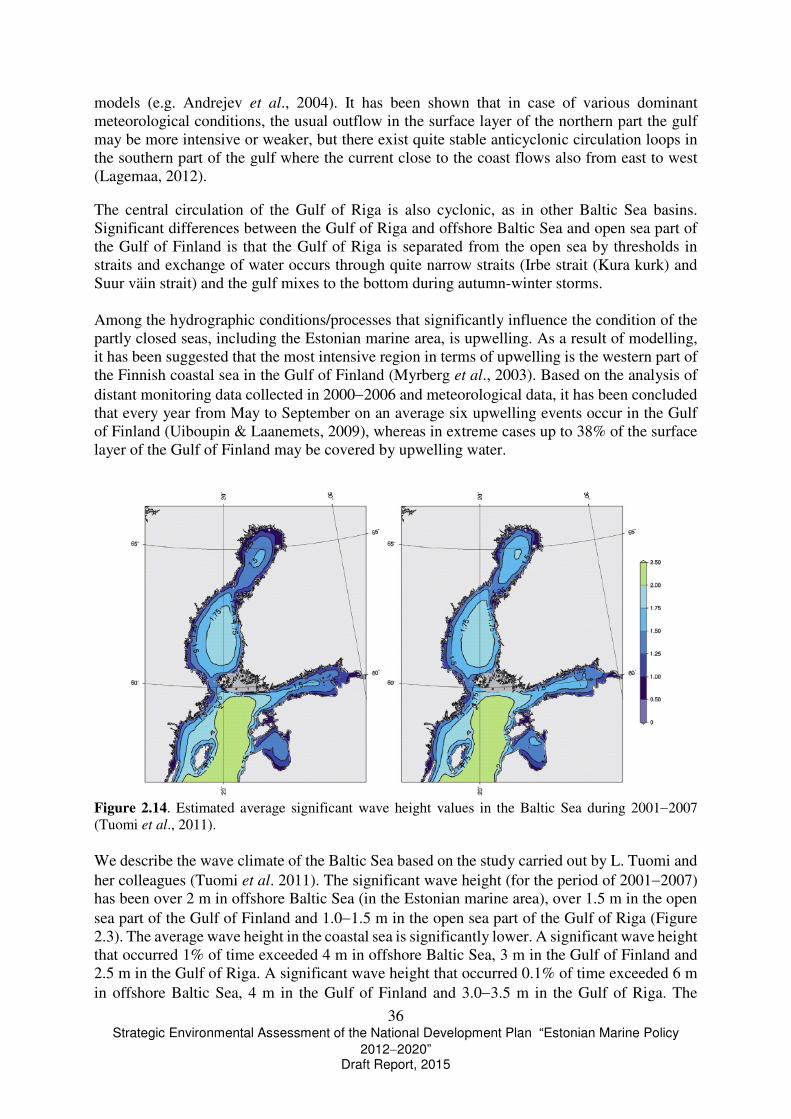
36 Strategic Environmental Assessment of the National Development Plan “Estonian Marine Policy
2012−2020” Draft Report, 2015
models (e.g. Andrejev et al., 2004). It has been shown that in case of various dominant meteorological conditions, the usual outflow in the surface layer of the northern part the gulf may be more intensive or weaker, but there exist quite stable anticyclonic circulation loops in the southern part of the gulf where the current close to the coast flows also from east to west (Lagemaa, 2012). The central circulation of the Gulf of Riga is also cyclonic, as in other Baltic Sea basins. Significant differences between the Gulf of Riga and offshore Baltic Sea and open sea part of the Gulf of Finland is that the Gulf of Riga is separated from the open sea by thresholds in straits and exchange of water occurs through quite narrow straits (Irbe strait (Kura kurk) and Suur väin strait) and the gulf mixes to the bottom during autumn-winter storms. Among the hydrographic conditions/processes that significantly influence the condition of the partly closed seas, including the Estonian marine area, is upwelling. As a result of modelling, it has been suggested that the most intensive region in terms of upwelling is the western part of the Finnish coastal sea in the Gulf of Finland (Myrberg et al., 2003). Based on the analysis of distant monitoring data collected in 2000−2006 and meteorological data, it has been concluded that every year from May to September on an average six upwelling events occur in the Gulf of Finland (Uiboupin & Laanemets, 2009), whereas in extreme cases up to 38% of the surface layer of the Gulf of Finland may be covered by upwelling water.
Figure 2.14. Estimated average significant wave height values in the Baltic Sea during 2001−2007 (Tuomi et al., 2011). We describe the wave climate of the Baltic Sea based on the study carried out by L. Tuomi and her colleagues (Tuomi et al. 2011). The significant wave height (for the period of 2001−2007) has been over 2 m in offshore Baltic Sea (in the Estonian marine area), over 1.5 m in the open sea part of the Gulf of Finland and 1.0−1.5 m in the open sea part of the Gulf of Riga (Figure 2.3). The average wave height in the coastal sea is significantly lower. A significant wave height that occurred 1% of time exceeded 4 m in offshore Baltic Sea, 3 m in the Gulf of Finland and 2.5 m in the Gulf of Riga. A significant wave height that occurred 0.1% of time exceeded 6 m in offshore Baltic Sea, 4 m in the Gulf of Finland and 3.0−3.5 m in the Gulf of Riga. The
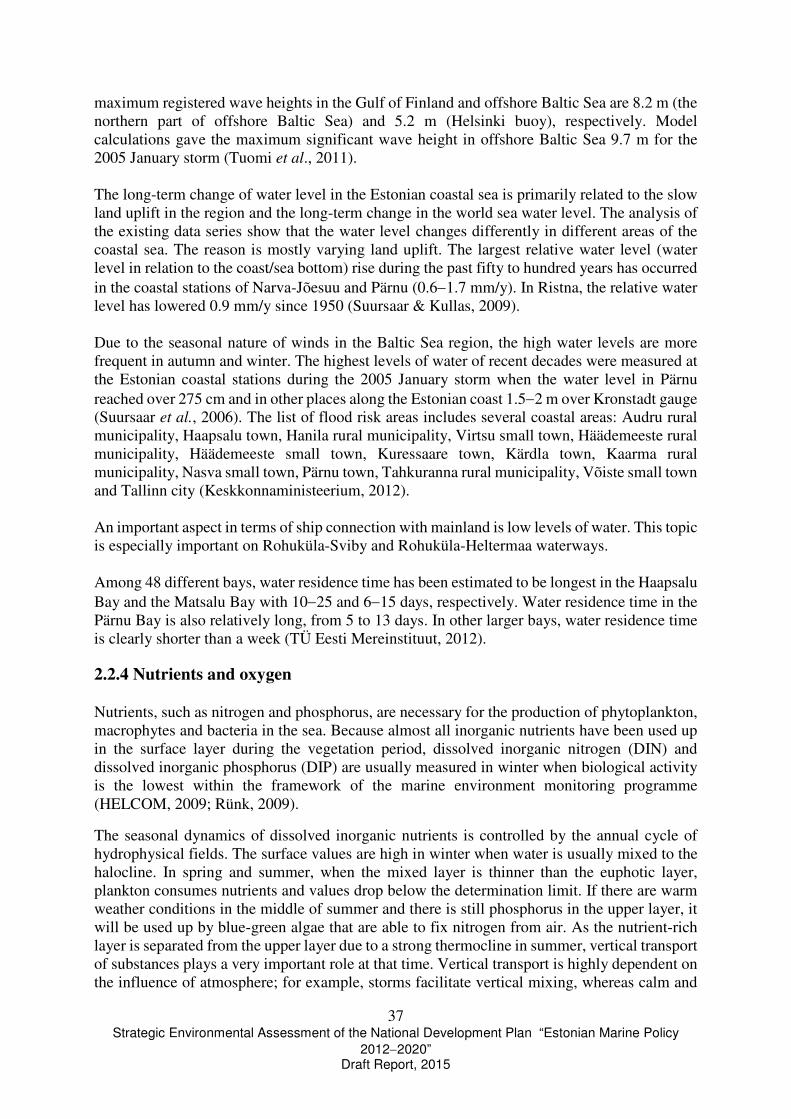
37 Strategic Environmental Assessment of the National Development Plan “Estonian Marine Policy
2012−2020” Draft Report, 2015
maximum registered wave heights in the Gulf of Finland and offshore Baltic Sea are 8.2 m (the northern part of offshore Baltic Sea) and 5.2 m (Helsinki buoy), respectively. Model calculations gave the maximum significant wave height in offshore Baltic Sea 9.7 m for the 2005 January storm (Tuomi et al., 2011). The long-term change of water level in the Estonian coastal sea is primarily related to the slow land uplift in the region and the long-term change in the world sea water level. The analysis of the existing data series show that the water level changes differently in different areas of the coastal sea. The reason is mostly varying land uplift. The largest relative water level (water level in relation to the coast/sea bottom) rise during the past fifty to hundred years has occurred in the coastal stations of Narva-Jõesuu and Pärnu (0.6−1.7 mm/y). In Ristna, the relative water level has lowered 0.9 mm/y since 1950 (Suursaar & Kullas, 2009). Due to the seasonal nature of winds in the Baltic Sea region, the high water levels are more frequent in autumn and winter. The highest levels of water of recent decades were measured at the Estonian coastal stations during the 2005 January storm when the water level in Pärnu reached over 275 cm and in other places along the Estonian coast 1.5−2 m over Kronstadt gauge (Suursaar et al., 2006). The list of flood risk areas includes several coastal areas: Audru rural municipality, Haapsalu town, Hanila rural municipality, Virtsu small town, Häädemeeste rural municipality, Häädemeeste small town, Kuressaare town, Kärdla town, Kaarma rural municipality, Nasva small town, Pärnu town, Tahkuranna rural municipality, Võiste small town and Tallinn city (Keskkonnaministeerium, 2012). An important aspect in terms of ship connection with mainland is low levels of water. This topic is especially important on Rohuküla-Sviby and Rohuküla-Heltermaa waterways. Among 48 different bays, water residence time has been estimated to be longest in the Haapsalu Bay and the Matsalu Bay with 10−25 and 6−15 days, respectively. Water residence time in the Pärnu Bay is also relatively long, from 5 to 13 days. In other larger bays, water residence time is clearly shorter than a week (TÜ Eesti Mereinstituut, 2012).
2.2.4 Nutrients and oxygen
Nutrients, such as nitrogen and phosphorus, are necessary for the production of phytoplankton, macrophytes and bacteria in the sea. Because almost all inorganic nutrients have been used up in the surface layer during the vegetation period, dissolved inorganic nitrogen (DIN) and dissolved inorganic phosphorus (DIP) are usually measured in winter when biological activity is the lowest within the framework of the marine environment monitoring programme (HELCOM, 2009; Rünk, 2009).
The seasonal dynamics of dissolved inorganic nutrients is controlled by the annual cycle of hydrophysical fields. The surface values are high in winter when water is usually mixed to the halocline. In spring and summer, when the mixed layer is thinner than the euphotic layer, plankton consumes nutrients and values drop below the determination limit. If there are warm weather conditions in the middle of summer and there is still phosphorus in the upper layer, it will be used up by blue-green algae that are able to fix nitrogen from air. As the nutrient-rich layer is separated from the upper layer due to a strong thermocline in summer, vertical transport of substances plays a very important role at that time. Vertical transport is highly dependent on the influence of atmosphere; for example, storms facilitate vertical mixing, whereas calm and

38 Strategic Environmental Assessment of the National Development Plan “Estonian Marine Policy
2012−2020” Draft Report, 2015
sunny weather strengthens stratification even more. Upwelling is an important mechanism for vertical transport of nutrients. The amount of phosphate-phosphorus transported to the surface layer of the sea during an upwelling event that took place in August 2006 was measured around 500 tons by actual measuring (Lips et al., 2009) and model calculations (Laanemets et al., 2011), which is approximately equal to the monthly riverine load to the Gulf of Finland (HELCOM, 2004). A significant amount of nutrients is transported to the Estonian marine areas from neighbouring marine areas. Nutrients are carried to the Gulf of Finland from offshore Baltic Sea. This transport is more intensive when estuarial circulation is stronger, i.e. with eastern winds. In autumn and winter, vertical transport of nutrients to the upper layer is caused by thermal and wind-driven mixing. As the Gulf of Riga is separated from the rest of the sea with a relatively shallow Irbe strait, very nutrient-rich water under the halocline does not flow there from offshore Baltic Sea.
Long-term changes in nutrients are related to nutrient inputs to and outputs from atmosphere, rivers, neighbouring areas and sediments, and consumption. The long-term winter nutrient time series of the surface layer of the Gulf of Finland is very varied. The reason for this variability in not often clear. As regards nitrogen, somewhat lower values have been registered in recent years. As for phosphorous, the values have been bigger recently. It is likely that the increase in the content of phosphorous in the Gulf of Finland is not directly related to the growth of inflow from rivers and pollution sources. Higher values have occurred in the Gulf of Finland after the large inflows from the North Sea to the Baltic Sea in 1993 and 2003 (Lilover and Stips, 2008). These large inflows raised the halocline and increased stratification in offshore Baltic Sea as well as in the western part of the Gulf of Finland. As the halocline determines also nutrient clines, the inflowing water due to estuarial circulation has been richer in nutrients from the middle of the 1990s. This under-halocline water contains also less oxygen. Oxygen deficiency causes releasing of phosphorous from sediments. Hence, the higher values of phosphorus of recent years are probably related to the large inflow of the North Sea water that has caused an increased stratification and raised the halocline. The reason behind the great variability between annual time series is probably insufficient data, at least partly. Recent measuring experiments show that winter nutrient contents are relatively varied. This may be caused by temporary loss of stratification events, advection, upwelling, short-time production in the upper layer and other circumstances. The rest nutrient cycles of recent years in the Estonian marine areas have been described based on the work of the Estonian Marine Institute of Tartu University (2012). The time series of the Haapsalu Bay nutrient concentration data series are incomplete, the difference in concentrations in Eeslaht Bay and Tagalaht Bay is large and data deviation is significant because of the small depth of the gulf. After commencement of regular monitoring of the Haapsalu Bay, the average concentrations of the total phosphorous have shown a constant growth tendency in the Haapsalu Bay As in coastal waters, the average total phosphorus in offshore Baltic Sea has been growing. The total nitrogen content has been relatively stable in 1993−2003, although the trend has been growing in recent years. However, deficient data for the period of 2000−2004 and possible seasonal influence on the visits to stations in different times in different years must be taken into account. From the commencement of monitoring (1993), it has been detected that the decrease in the total phosphorus concentrations has stopped in the Pärnu Bay. The total nitrogen summer-time concentrations have not changed in this water body during the entire monitoring period.
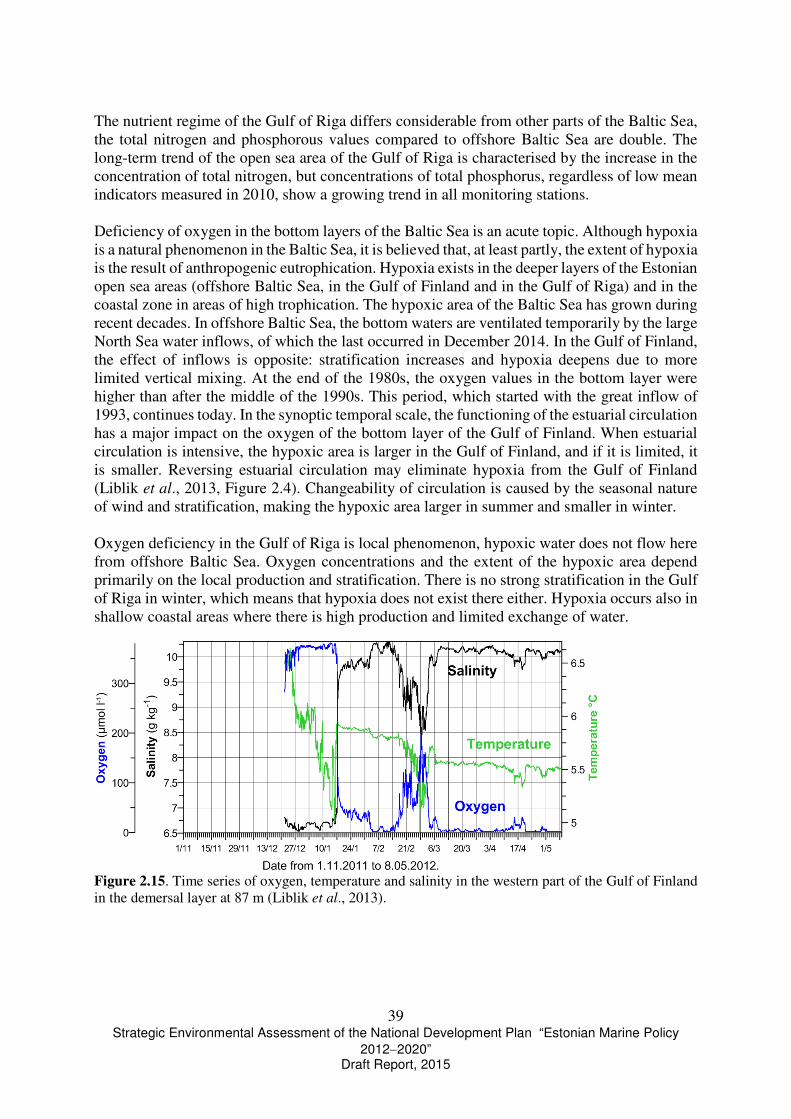
39 Strategic Environmental Assessment of the National Development Plan “Estonian Marine Policy
2012−2020” Draft Report, 2015
The nutrient regime of the Gulf of Riga differs considerable from other parts of the Baltic Sea, the total nitrogen and phosphorous values compared to offshore Baltic Sea are double. The long-term trend of the open sea area of the Gulf of Riga is characterised by the increase in the concentration of total nitrogen, but concentrations of total phosphorus, regardless of low mean indicators measured in 2010, show a growing trend in all monitoring stations. Deficiency of oxygen in the bottom layers of the Baltic Sea is an acute topic. Although hypoxia is a natural phenomenon in the Baltic Sea, it is believed that, at least partly, the extent of hypoxia is the result of anthropogenic eutrophication. Hypoxia exists in the deeper layers of the Estonian open sea areas (offshore Baltic Sea, in the Gulf of Finland and in the Gulf of Riga) and in the coastal zone in areas of high trophication. The hypoxic area of the Baltic Sea has grown during recent decades. In offshore Baltic Sea, the bottom waters are ventilated temporarily by the large North Sea water inflows, of which the last occurred in December 2014. In the Gulf of Finland, the effect of inflows is opposite: stratification increases and hypoxia deepens due to more limited vertical mixing. At the end of the 1980s, the oxygen values in the bottom layer were higher than after the middle of the 1990s. This period, which started with the great inflow of 1993, continues today. In the synoptic temporal scale, the functioning of the estuarial circulation has a major impact on the oxygen of the bottom layer of the Gulf of Finland. When estuarial circulation is intensive, the hypoxic area is larger in the Gulf of Finland, and if it is limited, it is smaller. Reversing estuarial circulation may eliminate hypoxia from the Gulf of Finland (Liblik et al., 2013, Figure 2.4). Changeability of circulation is caused by the seasonal nature of wind and stratification, making the hypoxic area larger in summer and smaller in winter. Oxygen deficiency in the Gulf of Riga is local phenomenon, hypoxic water does not flow here from offshore Baltic Sea. Oxygen concentrations and the extent of the hypoxic area depend primarily on the local production and stratification. There is no strong stratification in the Gulf of Riga in winter, which means that hypoxia does not exist there either. Hypoxia occurs also in shallow coastal areas where there is high production and limited exchange of water.
Figure 2.15. Time series of oxygen, temperature and salinity in the western part of the Gulf of Finland in the demersal layer at 87 m (Liblik et al., 2013).

40 Strategic Environmental Assessment of the National Development Plan “Estonian Marine Policy
2012−2020” Draft Report, 2015
2.2.5 Plankton
Phytoplankton The most important factor that influences phytoplankton is enrichment of the marine environment with nutrients, or eutrophication. The increase of nutrient concentrations in seawater causes intensive algae blooms or growth of phytoplankton biomass. Phytoplankton is characterised by seasonal dynamics. In the Baltic Sea, algae blooms usually occur in spring and summer and the timing and length of these blooms depend on the region as well as the particular year. While cold-water diatoms and dinoflagellates dominate in spring blooms, summer blooms may be caused by different groups of algae, of which the most widespread are green-blue algae or cyanobacteria (Jaanus et al., 2007). In autumn, the largest contribution may come from green-blue algae and dinoflagellates (TÜ Eesti Mereinstituut, 2011). Weather conditions play the most important role in the plankton dynamics in a short-time perspective. Long-term changes are more or less related to the nutrient inflows from mainland and air. As regards water, nutrient loading or nutrients accumulated into sediments must be taken into account. To assess the status of the marine environment, phytoplankton quantitative parameters are preferred, i.e. biomass calculated by cells per volume and seawater chlorophyll a content. These parameters are the basis of the assessment method that relays on Estonian coastal sea phytoplankton. Indicators that are based on the species composition are being developed. For the open sea, in most countries surrounding the Baltic Sea, including Estonia, the assessment system has not yet been developed. According to the HELCOM (2009b) thematic report, the most eutrophic open sea areas, such as the Gulf of Finland and the Gulf of Riga and the northern part of the Baltic Sea, are adjacent to the Estonian coastal waters. According to the HELCOM method that uses chlorophyll a as the indicator, 80–100% of the Gulf of Riga and the Gulf of Finland and the northern part of the coastal waters and the open sea areas of the Baltic Sea get a poor or very poor ecological status score. Based on the results of operative and general monitoring of the Estonian coastal waters and the assessment system established in Estonia, most of the coastal waters are in poor condition. An exception is the most eastern and western waters, i.e. the Narva Bay and Kihelkonna Bay, which condition is classified as good based on phytoplankton. Of the Estonian coastal waters, the Haapsalu Bay is in the worst ecological state. Zooplankton Zooplankton is an important link in the marine food chain, because juvenile fish stages feed on it. Some important commercial fish feed on zooplankton throughout their whole life. Both sea and fresh water species are represented in the zooplankton communities (TÜ Eesti Mereinstituut, 2011). In the coastal sea and surface layers of the open sea (in summer above the thermocline) a large part of zooplankton community contains marine origin copepods, sometimes also rotifers, and in summer the number of cladocerans is relatively high (TÜ Eesti Mereinstituut, 2011).

41 Strategic Environmental Assessment of the National Development Plan “Estonian Marine Policy
2012−2020” Draft Report, 2015
In the deeper water layers (below the thermocline in summer), but also below the halocline (if the oxygen conditions are favourable), a significant part of the zooplankton communities is formed by large species like Arctic origin Limnocalanus macrurus and marine origin Pseudocalanus acuspes. The range and abundance of the latter is limited due to low salinity and L. macrurus population development depends mostly on the thermal regime of water. According to the marine environment assessment of 2012, the proportion of these species has greatly decreased and the proportion of brackish water species has increased (e.g. Acartia spp. and E. affinis) (TÜ Eesti Mereinstituut, 2012). The zooplankton communities are very varying and respond quickly to changes (e.g. water salinity and climate change) in the ambient environment. Relatively recently it has been proved that there are links between some zooplankton species and phosphorus and nitrogen concentrations of seawater (Põllumäe and Kotta, 2007; Põllumäe et al., 2009). Based on the existing studies, some zooplankton species respond to eutrophication of seawater (Põllumäe and Kotta, 2007; Põllumäe et al., 2009). Currently, there are no indicators that help to assess the marine environment condition based on zooplankton in the Baltic Sea.
2.2.6 Benthos Phytobenthos The Baltic Sea brackish water is an extremely complicated environment for sea plants because of varied salinity conditions, different coast types and substrates and other environmental conditions, which is also the reason for relatively low diversity of the Baltic Sea phytobenthos. The number of macrophyte species, such as macroalgae, phanerophytes, charophytes and bryophytes is 531 in the entire Baltic Sea and 187 in the Gulf of Finland. These numbers are smaller for the Estonian coastal waters. Nowadays, altogether up to 60 species of macroalgae and about 20 mainly vascular plant species that are of fresh water origin can be found in the coastal waters of the western Estonia archipelago (Martin, 2000). The benthos of the Gulf of Finland in the Estonian coastal sea is even less diverse. In the Estonian coastal sea, the depth of the phytobenthos range is considered to be 20–25 m; however, red algae communities exhibiting a relatively high biomass have been described 35–40 m deep in Hiiumaa marine area.
In the Estonian coastal sea, plants grow 5–6 m deep on the soft seabed. The deepest areas are usually inhabited by charophyte communities. Phanerophytes dominate at depths lower than 1 m. Mixed communities of various fresh water phanerophytes inhabit areas influenced by fresh water inflows, whereas in more open areas can be found Zostera marina pastures. Usually three well-developed plant zones can be identified on hard-substrate seabeds. There is a green-blue algae zone in the deepest zone which depth is determined by the fluctuation of water level. Mostly annual but fast-growing green-blue algae grow here. Communities with dominating perennial species can be found below the fluctuating water level zone. Most widespread key species in this depth zone is the bladder wrack (Fucus vesiculosus), which zones create living conditions for a large amount of other species. The bladder wrack communities are most diverse and represented in almost everywhere in our coastal sea (Figure 2.5). The most eastern limit of the bladder wrack communities range is the Letipea cape in the Gulf of Finland. The bladder wrack communities exist on hard seabed in Väinameri and the Gulf of Riga.
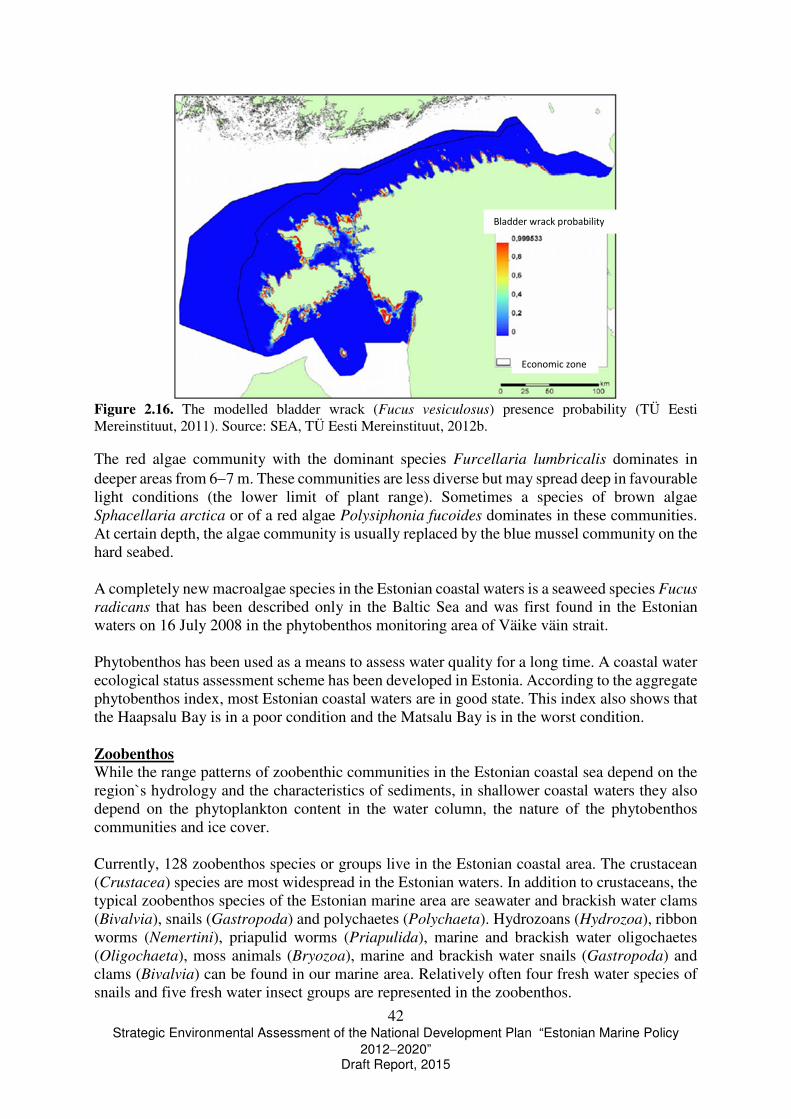
42 Strategic Environmental Assessment of the National Development Plan “Estonian Marine Policy
2012−2020” Draft Report, 2015
Figure 2.16. The modelled bladder wrack (Fucus vesiculosus) presence probability (TÜ Eesti Mereinstituut, 2011). Source: SEA, TÜ Eesti Mereinstituut, 2012b.
The red algae community with the dominant species Furcellaria lumbricalis dominates in deeper areas from 6−7 m. These communities are less diverse but may spread deep in favourable light conditions (the lower limit of plant range). Sometimes a species of brown algae Sphacellaria arctica or of a red algae Polysiphonia fucoides dominates in these communities. At certain depth, the algae community is usually replaced by the blue mussel community on the hard seabed. A completely new macroalgae species in the Estonian coastal waters is a seaweed species Fucus
radicans that has been described only in the Baltic Sea and was first found in the Estonian waters on 16 July 2008 in the phytobenthos monitoring area of Väike väin strait. Phytobenthos has been used as a means to assess water quality for a long time. A coastal water ecological status assessment scheme has been developed in Estonia. According to the aggregate phytobenthos index, most Estonian coastal waters are in good state. This index also shows that the Haapsalu Bay is in a poor condition and the Matsalu Bay is in the worst condition. Zoobenthos While the range patterns of zoobenthic communities in the Estonian coastal sea depend on the region`s hydrology and the characteristics of sediments, in shallower coastal waters they also depend on the phytoplankton content in the water column, the nature of the phytobenthos communities and ice cover. Currently, 128 zoobenthos species or groups live in the Estonian coastal area. The crustacean (Crustacea) species are most widespread in the Estonian waters. In addition to crustaceans, the typical zoobenthos species of the Estonian marine area are seawater and brackish water clams (Bivalvia), snails (Gastropoda) and polychaetes (Polychaeta). Hydrozoans (Hydrozoa), ribbon worms (Nemertini), priapulid worms (Priapulida), marine and brackish water oligochaetes (Oligochaeta), moss animals (Bryozoa), marine and brackish water snails (Gastropoda) and clams (Bivalvia) can be found in our marine area. Relatively often four fresh water species of snails and five fresh water insect groups are represented in the zoobenthos.
Economic zone
Bladder wrack probability

43 Strategic Environmental Assessment of the National Development Plan “Estonian Marine Policy
2012−2020” Draft Report, 2015
Above the halocline, the range of benthic communities is determined by three main factors – salinity, depth and type of seabed. Local factors are competition between species and, lately, human impact. The clam colonies are characteristic to hard seabed areas, and depending on seawater salinity, the dominant species therein may be the bay mussel Mytilus trossulus (saltier sea) or the zebra mussel Dreissena polymorpha (less saline water). The clam species that bury into sediments (the sand gaper (Mya arenaria) and the Baltic clam (Macoma balthica)) dominate in soft seabed areas. Macoma balthica is one of the key species of the Baltic Sea zoobenthos because of its range and great biomass. Detritivores or animals that feed on detritus live usually in areas with muddy and clayey seabed and active sedimentation of organic sediments. Detritivores are the ragworm Hediste
diversicolor and Monoporeia affinis. Under the halocline, the range of zoobenthic communities is usually determined by oxygen conditions. In good oxygen conditions, such marine areas are usually inhabited by a diverse community where mainly dominate crustaceans Monoporeia affinis and Pontoporeia femorata, seldom the Baltic clam (Macoma balthica). In poorer oxygen conditions, only Bylgides sarsi (worm) can be found in such communities, because large invertebrates die in oxygen deficiency conditions. A separate group is herbivores that mainly inhabit the phytobenthic zone. The characteristic large invertebrates in the Estonian coastal sea flora zone are Idotea (I. balthica, I. chelipes), Gammarus, the freshwater snails, the river nerite (Theodoxus fluviatilis) and Radix balthica. To assess water quality in waters using the zoobenthos, Estonian Marine Institute of Tartu University has developed the zoobenthos community index ZKI, the hard bottoms index KPI and the habitat diversity index of phytobenthic zone FDI. The environmental condition of the waters calculated by the values of these indexes was good for the entire Estonian coastal sea in 2008–2010.
Pressures The main pressures that influence the condition of the benthos are marine environment eutrophication, invasion of non-indigenous species and oxygen deficiency in deep sea. Due to eutrophication of the Baltic Sea, the state of the zoobenthos has greatly changed during recent decades. The direct result of the eutrophication process is loss of benthic biodiversity, dominance of species that are less demanding regarding environmental quality and the growth of total zoobenthos biomass. The growth of total zoobenthos biomass is directly related to the improved food base of the zoobenthos due to the increasing amounts of organic matter contained in sediments during the eutrophication process. Following a decrease in water transparency, several phytobenthic species were lost, causing also a loss of several zoobenthic species that prefer plants. The condition of the zoobenthos has been gradually improving in the Estonian marine area in this century. Restoration of plant communities has increased the diversity of the zoobenthos

44 Strategic Environmental Assessment of the National Development Plan “Estonian Marine Policy
2012−2020” Draft Report, 2015
related to the phytobenthos in the Estonian coastal sea. An improvement of the condition of the zoobenthos has been detected also in the marine areas without flora due to a greater biological diversity of communities and the total biomass decrease. In the marine area under the halocline, the composition of the zoobenthos is influenced by the oxygen regime in the demersal water. For the most part, the oxygen regime is influenced by the amount of saline water inflows to the Baltic Sea, although the extent of oxygen deficiency is also related to the general eutrophication of the sea. Poor oxygen conditions cause loss of the zoobenthos. More intensive vessel traffic has brought many new species into the Baltic Sea in recent decades, of which most are invertebrates with an active pelagic larva stage. Much fewer new plant species have been registered. These species have mostly stayed in the saltier areas of the Baltic Sea. However, if current tendencies continue, it is not an impossible scenario that new plant species spread to the northern and eastern part of the Baltic Sea and non-indigenous species invade into the Estonian coastal waters.
2.2.7 Fish fauna Highly migratory species The only catadromous species in the Estonian waters is the eel. The eel feeds on water invertebrates and fish and goes to the Sargasso Sea to spawn (Pihu & Turovski, 2003). The stock of the European eel is at low levels and eel fishing is not sustainable. In 1938, an annual total catch of eels in the Estonian waters exceeded 500 tons, whereas in 2010 the catch of eels was 3.5 tons in the Estonian coastal sea. The reason given is small number of spawners (Dekker, 2003) which indicates overfishing in the entire range of the species. The abundance of eels is negatively influenced by dams that have been built on the eel migration rivers causing late migration or mortality (Bruijs and Durif, 2009). The representatives of anadromous species are the salmon and the sea trout. They spawn in rivers and spend their adulthood in the sea. Salmon catches from the Estonian waters during 1981−2010 shows a decreasing trend. The number of allowed size salmon in the Estonian coastal sea depends on the catch of salmon originating from Estonia outside our economic zone. According to prognoses, the catches will remain on the same level in near future (Kesler et al., 2011). Sea trout catches during 1999–2010 have shown a slight growing trend. However, salmon and sea trout catches include also introduced fish. An important factor that causes reduction in the numbers of anadromous species is dams on spawning rivers that restrict access to their spawning grounds. The reproductive success is influenced by the water level on the spawning rivers during the autumn and winter period. The abundance of wild fish is low and the fishing mortality rate can be considered moderate (Saat et al., 2011). ICES has suggested that, for example, wild salmon should not be caught at all in the Gulf of Finland and the catch limitations on salmonids should be very stringent (ICES, 2011). The size of the stocks of salmonids in the Baltic Sea is not assessed. Coastal sea fish The coastal sea fish group includes marine species, such as viviparous eelpout, sea stickleback, broadnosed pipefish, straightnose pipefish, rock gunnel, lesser sand eel, great sand eel, black goby, sand goby, common goby, two-spotted goby, and longspined bullhead. Also fish that inhabit the Estonian part of the Baltic Sea (whitefish, vendace, northern pike, roach, common
45 Strategic Environmental Assessment of the National Development Plan “Estonian Marine Policy
2012−2020” Draft Report, 2015
rudd, ide, chub, tench, common bream, white bream, crucian carp, Prussian carp, common carp, three-spined stickleback, European perch, zander, ruffe, bullhead etc.) of freshwater origin and semi-migrating fish (European smelt, vimba bream, sichel) can be classified as belonging to the group of coastal sea fish. Most species of the other functional groups are represented in the coastal sea. The number of large species is relatively small and their fishing pressure is moderate, but still very different by species (Saat et al., 2011). An exception is non-indigenous species Prussian carp and round goby that are strongly extending their range (Eschbaum et al., 2011; Ojaveer et al., 2011). The factors that reduce the abundance are fishing mortality rate, pressure by great cormorants, hydrometeorological factors as well as overgrown spawning grounds (Saat et al., 2011; Vetemaa et al., 2010). Although there are less data on small size species, the pressures are the same (fishing pressure is random). Demersal fish species These are species which range extends outwards of the shallow coastal area. The European flounder and the Atlantic cod are the main species in the Estonian waters that are of commercial interest. The commercial stock of the Atlantic cod in the Estonian waters is still low and directed fishing activities for that stock are not economically feasible (Saat et al., 2011). For the Atlantic cod, a pressure in the eastern part of the Baltic Sea is primarily hydrological processes, such as water exchange with the North Sea, but also other factors that influence salinity and oxygen content of the Baltic Sea water that are important for the Atlantic cod reproductive success in the Baltic Sea (HELCOM, 2006). In the Estonian waters, the European flounder is able to spawn in less saline areas near the coast (Ojaveer and Drevs, 2003), but their reproductive success is higher following an inflow of salty water. The monitoring data show that the stock of the European flounder has decreased in all the largest areas of the Estonian coastal sea, although the fishing mortality rate can be considered moderate. The reason for the decline of resources is deteriorating flounder spawns (Saat et al., 2011). With the current fishing mortality rate, no change is expected to occur in following years. The abundance of other species that belong into this group (common seasnail, shorthorn sculpin, lumpsucker, European plaice, turbot, fourhorn sculpin etc.) is different in the Estonian waters, where the turbot and the shorthorn sculpin are most abundant. Pelagic species The Baltic herring and the sprat are the typical small size pelagic species in the Estonian waters. Spring Baltic herring abundance in the Gulf of Riga is still high (although showing a decreasing trend), but low in other sea areas. Autumn Baltic herring is still in deep depression. The Baltic herring stock in the Estonia`s economic zone can be considered relatively good. The fishing mortality rate is high for both species (Raid et al., 2011; Saat et al., 2011). ICES considers the intensity of exploitation of the Baltic herring stocks in offshore Baltic Sea and in the Gulf of Finland not to be in agreement with the sustainable yield (ICES, 2011b). Taking into account the above, one of the main pressures on small size pelagic fish is the fishing mortality rate, which will continue to be true also in future, influencing the biomass and the structure of the population (selective gear). In addition to fishing industry, the abundance is also influenced by the composition and abundance of zooplankton and hydrological conditions (HELCOM, 2006). An abundant species in the pelagic zone besides the Baltic herring and the sprat is the three-spined stickleback. Sometimes there may be random visitors (e.g. the European anchovy). The garfish is abundant in the Estonian waters seasonally. The abundance of the garfish is fluctuating, depending mainly on the natural and fishing mortality rate outside

46 Strategic Environmental Assessment of the National Development Plan “Estonian Marine Policy
2012−2020” Draft Report, 2015
the Baltic Sea, but also on the temperature of surface water during the spawning period (Ojaveer & Järv, 2003). Cyclostomes There are two species in the Estonian waters: the European river lamprey and the sea lamprey, of these the latter occurs very seldom. Adult European river lampreys that inhabit the coastal sea have a parasitic lifestyle. The fish spawn in rivers once in their life. The abundance is stable. The condition of the European river lamprey is significantly better than in the rest of Europe. They are the target of commercial fishing activities during spawning migration in rivers and their fishing mortality rate is probably relatively high (Saat et al., 2011). As the fishing mortality rate as well as the natural pressure on the fish populations can be considered high, then according to the fish fauna parameters, good environmental status has not been achieved. Pressures The main pressures are the fishing mortality rate, destruction of and deteriorating conditions of habitats and spawning grounds and hydrometeorological conditions. 2.2.8 Wild birds
Most bird species in the north-western Europe, including the Estonian marine area, are migratory birds, and consequently the range and abundance of these species is mostly influenced by the factors outside Estonia. The reason for the changes in abundance may be the nesting conditions in Siberian tundra areas, influences at stops during migration or in wintering grounds in Western Europe or Africa. The number of species gathering in Estonia in winter is influenced by soft winters that occur more often after 1990, which is why more birds winter in the Estonian waters. Winter abundance of birds decreases because of massive mortality due to severe cold or diseases (Durinck et al., 1994, Skov et al., 2011). Over 40 bird species nest in the Estonian coastal areas and on islets, of which many gather into nesting colonies. Even more birds gather outside nesting period to form moulting sites. Seabirds` moulting colonies are located on open sea shoals (common scoter, common eider) as well as in the coastal sea (common goldeneye, dabbling ducks, mute swan, greylag goose etc.). The autumn migration of birds from Arctic nesting grounds begins already in the middle of summer and lasts until the end of October. A remarkable congregation of sea birds happens in spring (spring migration) after melting of ice when in addition to our wintering birds other species that have wintered elsewhere fatten themselves here, such as long-tailed ducks, scoters, swans, geese and black geese that are headed to nest in the tundra. Estonia has joined the Bonn convention and the Agreement on the Conservation of African-Eurasian Migratory Waterbirds (AEWA) (2008), the international framework agreements that deal with migratory species. In practice, an important shift has happened due to the HELICOM Convention on the Protection of the Marine Environment of the Baltic Sea Area. The trends discovered during the work performed for the initial assessment of the Estonian marine areas (TÜ Eesti Mereinstituut, 2012) show great changes in the numbers of wintering waterbirds during recent 15–20 years. Especially large decrease has occurred in the abundance of Arctic waterbirds that winter on the open sea, such as the divers, the long-tailed duck, the
47 Strategic Environmental Assessment of the National Development Plan “Estonian Marine Policy
2012−2020” Draft Report, 2015
common eider, the common scoter and the velvet scoter, and of coastal sea species the Steller's eider. The most important reason behind the decreased numbers is probably reproductive failure in Arctic nesting areas. During the autumn migration observation conducted on the Põõsaspea cape in Estonia in 2009, it was discovered that the percentage of young birds of the mentioned species is extremely small: the common scoter – 1%, the long-tailed duck 3%, the velvet scoter 6%, and the red-throated diver 8.5% (Ellermaa et al., 2010). An important component in assessing the Estonian marine area status is the diverse breeding bird species on islets and in the coastal areas. Altogether 42 waterbird and shorebird species nest in Estonia, of which 19 almost entirely on islands. Breeding birds like wintering birds are stationary for a long time, which means that they are greatly influenced by local pressures. Adding other bird species that nest in colonies (all the seagull species and the sterna, the tufted duck, the great crested grebe) as indicator species of MSFD to the common eider, the Sandwich tern and the cormorant should be considered to (Rattiste, 2006). Pressures The main pressures on birds are eutrophication, by-catching and oil pollution. The current information about the range and abundance of waterbirds in Estonia could be considered good (breeding birds, coastal sea non-nesting period flocks) to satisfactory (open sea non-nesting period flocks) as a whole. Seabird research in the economic zone can be assessed as non-satisfactory, because it has not yet commenced. In the Baltic Sea, oil pollution is the greatest risk to wintering birds, especially for long-tailed ducks, scoters and divers that gather on open sea shoals (Larsson & Tydén, 2005). Birds get caught into fishing nets mainly during their migration or wintering period, when they gather into large flocks and feed on fish that are caught at the same time. Eutrophication is also an important pressure that birds may respond to. Eutrophication may cause opposite changes in functional bird groups. For example, increased concentrations of dissolved nitrogen substances (DIN) cause a growth in the number of sea ducks that feed on molluscs, whereas reduction in the number of birds that feed on plants. 2.2.9 Protected natural objects and Natura 2000 Protected natural objects According to § 4 of the Nature Conservation Act, the protected natural objects in Estonia are protected areas, limited-conservation areas, protected species and fossils, species` protection sites, individual protected natural objects and natural objects protected at the local government level. Protected areas are areas maintained in a state unaltered by human activity or used subject to special requirements where the natural environment is preserved, protected, restored, researched or introduced. This category includes national parks, nature conservation areas and landscape conservation areas.
As of 31 December 2014, there was altogether 3,895 protected nature objects in Estonia. According to the EELIS database (19.09.15), in Estonia there are

48 Strategic Environmental Assessment of the National Development Plan “Estonian Marine Policy
2012−2020” Draft Report, 2015
• 343 limited-conservation areas, of which 57 cover a part of the sea. In the Estonian waters, the largest limited-conservation areas are Väinameri (Hiiu, Saare, Läänemaa), Pärnu Bay and Kura kurk limited-conservation areas.
• 149 nature conservation areas, of which 23 cover a part of the sea; • 149 landscape conservation areas, of which 31 cover a part of the sea; • 5 national parks, of which 3 cover a part of the sea (Vilsandi, Matsalu and Lahemaa) • 1,380 species protection sites, of which 11 cover a part of the sea.
Protected species fall into three protection categories. According to the Nature Conservation
Act, in the protected category I belong species that are rare, in danger of disappearance that are located within restricted areas or whose population is thinly scattered over a more extensive range. In conditions where extinction in Estonian wild is likely if the adverse impact of the danger factors continue. Species that are in danger due to their small or reducing populations and whose range in Estonia is reducing due to overexploitation, destruction or damaging of habitats belong to category II. Species whose population is endangered by the destruction or damaging of habitats and has been reduced to a point where they are believed to move into the endangered category if the causal factors continue operating belong to III category. It is prohibited to disclose the specific location of the habitats of specimens of species in the protected categories I and II in the media. In Estonia, protected animal species of marine mammals are the grey seal (category III) and the ringed seal (category II). To protect gathering and reproduction area of these species, species` protection sites have been established in the Estonian marine area. The harbour porpoise belongs to protected category III, but in the Estonian water this species is very scarce. The white-tailed eagle that feeds on fish and waterbirds belongs to protected category I. Eurasian bitterns, tundra swans, whooper swans, greater scaups, Steller's eiders, smews, little gulls, lesser black-backed gulls, razorbills and black guillemots are waterbirds that belong to protected waterbirds category II. Fish that belong to protected category III are the European sea sturgeon, the spined loach, the bullhead. Waterbirds that belong to protected category III are red-throated divers, little grebes, red-necked grebes, barnacle geese, red-breasted geese, common shelducks, velvet scoters.
Natura 2000 areas Natura 2000 is a network of protected areas of the European Union which objective is to ensure protection of rare or endangered birds, animals and plants and their habitats and sites. The Natura-network was established in 1992 and it consists of bird areas that are established to protect species included in Annex I of the EU Birds Directive and nature areas that are established to protect habitat types included in Annex I and species included in Annex II of the Nature Directive.
Natura 2000 areas in Estonia were selected by the time of accession of Estonia to the European Union in 2004. Of Estonian Natura 2000 areas, 89 nature and bird areas include also a sea part (Figure 2.6). Of these, 26 are bird areas that include a sea part with an area of approximately 6,500 km2 and 63 nature areas that include a sea part with an area of approximately 3,900 km2. The largest of Natura areas are Lahemaa and Väinameri nature and bird areas and Pärnu Bay and Kura kurk bird areas (EELIS: Keskkonnaagentuur, 15.09.15). There are also nature areas do not cover a sea part, but which border goes along the coastline and where many valuable continental habitat types are located. Such nature areas are, for example, Tahkuna, Aseri, Päite, Laulasmaa, Udria and other nature areas.
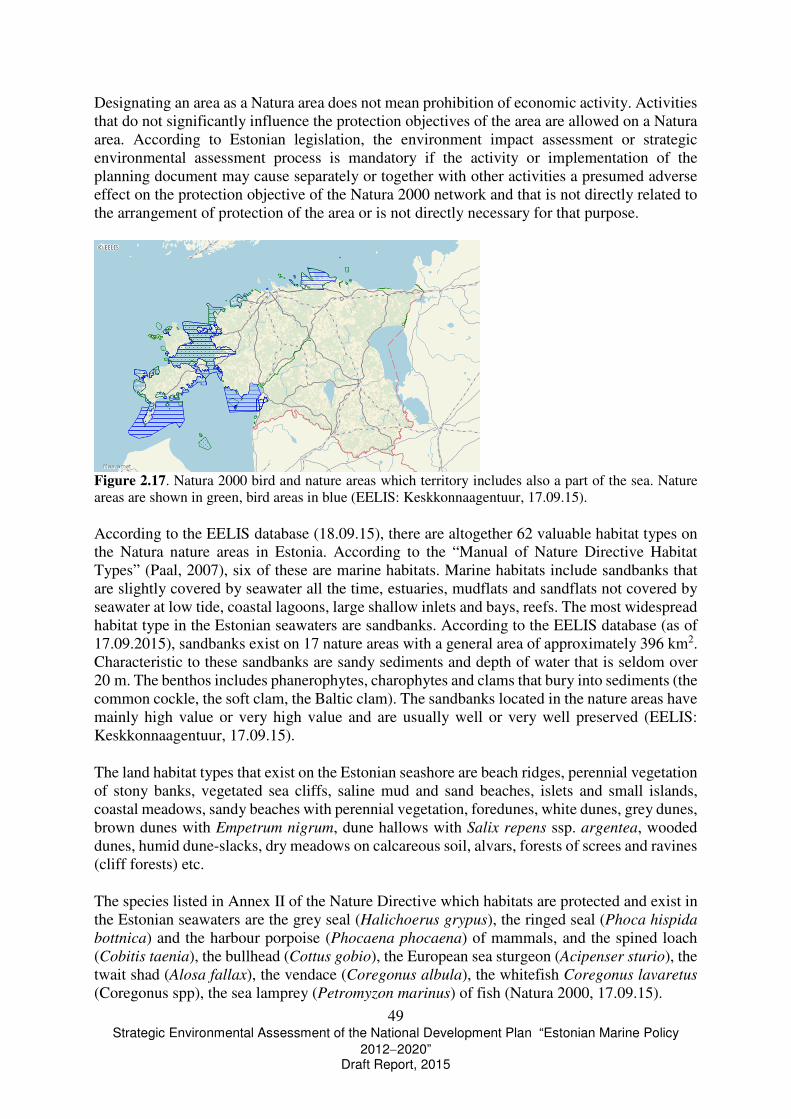
49 Strategic Environmental Assessment of the National Development Plan “Estonian Marine Policy
2012−2020” Draft Report, 2015
Designating an area as a Natura area does not mean prohibition of economic activity. Activities that do not significantly influence the protection objectives of the area are allowed on a Natura area. According to Estonian legislation, the environment impact assessment or strategic environmental assessment process is mandatory if the activity or implementation of the planning document may cause separately or together with other activities a presumed adverse effect on the protection objective of the Natura 2000 network and that is not directly related to the arrangement of protection of the area or is not directly necessary for that purpose.
Figure 2.17. Natura 2000 bird and nature areas which territory includes also a part of the sea. Nature areas are shown in green, bird areas in blue (EELIS: Keskkonnaagentuur, 17.09.15).
According to the EELIS database (18.09.15), there are altogether 62 valuable habitat types on the Natura nature areas in Estonia. According to the “Manual of Nature Directive Habitat Types” (Paal, 2007), six of these are marine habitats. Marine habitats include sandbanks that are slightly covered by seawater all the time, estuaries, mudflats and sandflats not covered by seawater at low tide, coastal lagoons, large shallow inlets and bays, reefs. The most widespread habitat type in the Estonian seawaters are sandbanks. According to the EELIS database (as of 17.09.2015), sandbanks exist on 17 nature areas with a general area of approximately 396 km2. Characteristic to these sandbanks are sandy sediments and depth of water that is seldom over 20 m. The benthos includes phanerophytes, charophytes and clams that bury into sediments (the common cockle, the soft clam, the Baltic clam). The sandbanks located in the nature areas have mainly high value or very high value and are usually well or very well preserved (EELIS: Keskkonnaagentuur, 17.09.15).
The land habitat types that exist on the Estonian seashore are beach ridges, perennial vegetation of stony banks, vegetated sea cliffs, saline mud and sand beaches, islets and small islands, coastal meadows, sandy beaches with perennial vegetation, foredunes, white dunes, grey dunes, brown dunes with Empetrum nigrum, dune hallows with Salix repens ssp. argentea, wooded dunes, humid dune-slacks, dry meadows on calcareous soil, alvars, forests of screes and ravines (cliff forests) etc.
The species listed in Annex II of the Nature Directive which habitats are protected and exist in the Estonian seawaters are the grey seal (Halichoerus grypus), the ringed seal (Phoca hispida
bottnica) and the harbour porpoise (Phocaena phocaena) of mammals, and the spined loach (Cobitis taenia), the bullhead (Cottus gobio), the European sea sturgeon (Acipenser sturio), the twait shad (Alosa fallax), the vendace (Coregonus albula), the whitefish Coregonus lavaretus (Coregonus spp), the sea lamprey (Petromyzon marinus) of fish (Natura 2000, 17.09.15).

50 Strategic Environmental Assessment of the National Development Plan “Estonian Marine Policy
2012−2020” Draft Report, 2015
Of species represented in Estonia 65 species belong to Annex I of the Bird Directive, in addition also migratory species and other species of local importance. Estonia has to take into consideration about 90 species when selecting bird areas. (Natura 2000, 16.09.15) Species at the sea that also feed there and which habitats are protected on the Estonian bird areas are, for example, Eurasian wigeon (Anas penelope), mallard (Anas platyrhynchos), greater scaup (Aythya marila), Eurasian bittern (Botaurus stellaris), common goldeneye (Bucephala
clangula), black guillemot (Cepphus grylle), long-tailed duck (Clangula hyemalis), Bewick's swan (Cygnus columbianus bewickii), whooper swan (Cygnus cygnus), mute swan (Cygnus
olor), white-tailed eagle (Haliaeetus albicilla), common gull (Larus canus), lesser black-backed gull (Larus fuscus), velvet scoter (Melanitta fusca), common merganser (Mergus
merganser), common eider (Somateria mollissima), Eurasian wigeon (Anas penelope), mallard (Anas platyrhynchos) etc.
In Estonia, all nature and bird areas that cover a part of the sea are located in the territorial sea. There are no Natura areas in the economic zone. In 2007–2011, the project “Implementation of Natura 2000 in Estonian marine areas – site selection, designation and protection measures − ESTMAR” was carried out together with Estonian Marine Institute of Tartu University. At the same time, other open sea banks research projects were conducted, e.g. inventory taking of the Gretagrund (2008–2009) and Krassgrund (2009–2010) biota that was led by Estonian Fund for Nature (Eestimaa Looduse Fond) and Environmental Board (Keskkonnaamet) project “Avifauna on north-western and western Estonia open sea shoals during non-breeding period” (2009) financed by Environmental Investment Centre (Keskkonnainvesteeringute Keskus) (Balti Keskkonnafoorum, 2011). During the projects, an inventory of the marine habitats and biota of Estonian shoals was taken and the assessments of more valuable marine areas was conducted based on the analysed information that is the basis for the establishment of new Natura areas. In 2014, a new project “Inventory and development of monitoring programme for nature values in Estonian marine areas (NEMA)” was launched. The objective of the project is to fill in the gaps in the current body of knowledge and understanding of marine habitats and distribution of endangered species. The activities of the project are focused on the development of the favourable status criteria of the marine habitat types of the Nature Directive and identification of their precise range in Estonia`s territorial sea and economic zone (Estonian Marine Institute of Tartu University web page: http://www.sea.ee/valisosalusega-projektid/nema, 18.09.15).
Risk factors The main risk factors of marine habitat types are construction works on the particular marine area, such as construction of ports and wind farms and establishing waterways, but also excavation of mineral resources, marine pollution and eutrophication of the marine environment, and also overgrowing and drainage (Keskkonnaamet, 2009, 2011, 2012). The main pressures on the ringed seal and the grey seal are disturbance by humans, poor state of fish stocks, being killed in fishnets (Keskkonnaamet, 2011; Eesti Mereinstituut, 2012). Land habitats may be endangered by poor management or lack thereof; for example, suspension of grazing or no grazing that may result in overgrowing (Keskkonnaamet 2011b, 2012b). Oil pollution, ship and motor boat traffic, disturbing during breeding period, changes in food base threaten aquatic birds in bird areas (Keskkonnaamet, 2009, 2012). Deficiencies The Natura areas that are currently located in the Estonian marine area include only the territorial sea. There are no Natura areas in the economic zone.

51 Strategic Environmental Assessment of the National Development Plan “Estonian Marine Policy
2012−2020” Draft Report, 2015
In Estonia, various data sources are available about protected natural objects, including habitat types and species in the Natura areas. It is often the case that valuable data on habitats and biota (range, area, status, risk factors etc.) are included in different reports prepared during various projects carried out in Estonia, but the Estonian official database EELIS (Estonian Nature Information System) does not include these data. Valuable and important scattered data makes it difficult for nature experts to work and slows down their progress. 2.2.10 Marine mammals
There are three endemic species of marine mammals in the Estonian coastal waters: the grey seal (Halichoerus grypus), the ringed seal (Phoca hispida) and the harbour porpoise (Phocoena
phocoena). At the beginning of the 20th century, these species were common everywhere in the Baltic Sea and in the Estonian waters. In the Baltic Sea, there were up to 80,000–100,000 grey seals and the number of ringed seals exceeded even 200,000 (Harding etc. 1999). Currently, the abundance of these species has dropped to 25% and 4% of their historic abundance, respectively. No specific data is available on the harbour porpoise. Probably, the species was not that abundant in the Estonian waters. Grey seal This is a very migratory species whose range is primarily linked to habitats. The range of the species during their breeding period is dependent on the presence of ice during that period (February–March). The main breeding grounds are located on the western and southern coast of Saaremaa, the eastern and central part of the Gulf of Finland, and more seldom in the northern coastal waters of Hiiumaa in normal and milder than average winters. The data on Figure 2.7 show ca 8% annual increase in their abundance up to 2008. When comparing the Estonian data with the dynamics of the general numbers of the Baltic Sea, a similar deceleration of the growth trend is revealed, exhibiting a drop from eight per cent to a few per cent in a year.
Figure 2.18. Grey seal abundance trend in 1999–2011 (TÜ Eesti Mereinstituut, 2012).
Year

52 Strategic Environmental Assessment of the National Development Plan “Estonian Marine Policy
2012−2020” Draft Report, 2015
The status of the population of the Baltic Sea grey seal population that inhabits the Estonian coast has constantly improved over recent decades. The increase of their abundance is one of the indicators. According to the criteria of the International Union for Conservation of Nature (IUCN), the grey seal is in the least concern category. However, the species requires constant monitoring to avoid decline of the population`s status. The health state of animals has not been studied in Estonia. According to the data of Swedish researchers (Bergman, 2007), the Baltic Sea grey seal population has decreased fat layer thickness which is one of the low body condition indicators. The direct reasons are unknown. Fertility of female animals has also improved over two decades. The frequency of uterus pathologies has decreased and the percentage of reproductive females in population has increased. This is mainly associated with the decrease of environmental poisons (Bergman, 2007, Bredhult et al., 2008). The continued problem is a high prevalence of colonic ulcers (Bergman, 2007) in the Baltic Sea population, which indicates immune and hormonal system deficiency. The prevalence of colonic ulcers may be caused also by environmental poisons (Sørmo et al., 2003, 2005). The cause for human-induced mortality is primarily by-catching, which extent is also unknown. It is estimated that the number may be up to two hundred animals a year in Estonia, of which most are young animals. Due to a great decline in abundance, hunting of grey seals was prohibited in Estonia in 1972 (Keskkonnaamet, 06.09.2015). In Estonia, legal sealing was allowed in 2015, whereas in Finland and Sweden hunting has been allowed for years and this in concert with by-catching may be the reason for the deceleration in the growth of abundance. Of natural factors, the abundance growth is influenced negatively by partial reproductive failure in warm winters. If there is not sufficient amounts of ice, grey seals give birth on land, where in high density conditions up to 50% of born pups die. If they give birth on the ice surface or in case of low population concentration, their mortality rate is up to 5% (Jüssi et al., 2008). Ringed seal In Estonia, ringed seals live mainly in Väinameri and the Gulf of Riga, and in smaller numbers in the Gulf of Finland. The known resting grounds are in Väinameri and on banks near the coast in the northern part of the Gulf of Riga. There are very few data about ringed seal abundance in the Gulf of Finland. According to the assessment of Russian researchers, there are less than 100 ringed seals and the population is in a critical state (Verevkin, 2011). The population of the Gulf of Riga migrates regularly between the resting ground in Väinameri (spring and autumn) and the feeding grounds of the Gulf of Riga (summer). The breeding grounds are mainly in Pärnu Bay and in the northern part of the Gulf of Riga. The range during the breeding period depends on the existence of suitable ice types. The abundance of ringed seals in the Estonian waters is estimated to be ca 1,000 animals (monitoring data of 2007–2008). In Estonia, no positive trend has been registered after the first counting that took place in 1994–1996. This indicates problems with animal fertility, repeated unsuccessful births in winters with small amounts of ice and possible by-catching in fishing gear.
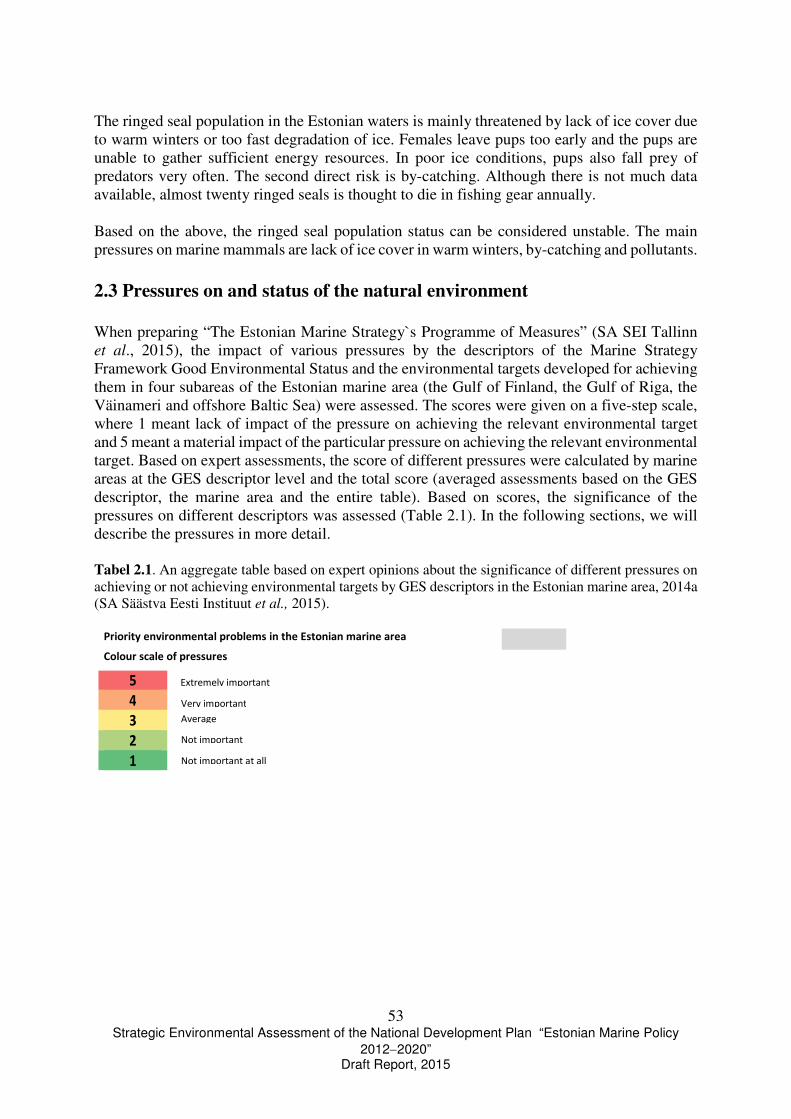
53 Strategic Environmental Assessment of the National Development Plan “Estonian Marine Policy
2012−2020” Draft Report, 2015
The ringed seal population in the Estonian waters is mainly threatened by lack of ice cover due to warm winters or too fast degradation of ice. Females leave pups too early and the pups are unable to gather sufficient energy resources. In poor ice conditions, pups also fall prey of predators very often. The second direct risk is by-catching. Although there is not much data available, almost twenty ringed seals is thought to die in fishing gear annually. Based on the above, the ringed seal population status can be considered unstable. The main pressures on marine mammals are lack of ice cover in warm winters, by-catching and pollutants.
2.3 Pressures on and status of the natural environment When preparing “The Estonian Marine Strategy`s Programme of Measures” (SA SEI Tallinn et al., 2015), the impact of various pressures by the descriptors of the Marine Strategy Framework Good Environmental Status and the environmental targets developed for achieving them in four subareas of the Estonian marine area (the Gulf of Finland, the Gulf of Riga, the Väinameri and offshore Baltic Sea) were assessed. The scores were given on a five-step scale, where 1 meant lack of impact of the pressure on achieving the relevant environmental target and 5 meant a material impact of the particular pressure on achieving the relevant environmental target. Based on expert assessments, the score of different pressures were calculated by marine areas at the GES descriptor level and the total score (averaged assessments based on the GES descriptor, the marine area and the entire table). Based on scores, the significance of the pressures on different descriptors was assessed (Table 2.1). In the following sections, we will describe the pressures in more detail. Tabel 2.1. An aggregate table based on expert opinions about the significance of different pressures on achieving or not achieving environmental targets by GES descriptors in the Estonian marine area, 2014a (SA Säästva Eesti Instituut et al., 2015).
Eesti mereala keskkonnaprobleemide prioritiseerimine
Värviskaala surveteguritele
5 ülioluline
4 väga oluline
3 keskmine
2 vähe oluline
1 ei ole üldse oluline
Extremely important
Very important
Average
Not important
Not important at all
Priority environmental problems in the Estonian marine area
Colour scale of pressures

54 Strategic Environmental Assessment of the National Development Plan “Estonian Marine Policy
2012−2020” Draft Report, 2015
2.3.1 Physical damage: siltation, smothering, elimination, sealing, changing the coastline
Table 2 of Annex III of the Marine Strategy Framework Directive highlights changes in siltation processes as an important pressure. The mentioned changes in the marine area sedimentation processes may be caused by several human activities, including changes in water motion, changes in the trophic level of the marine area, but also varying climatic conditions that bring precipitation and therefore also increase inflow of freshwater. The expert group of the initial assessment of the Estonian marine areas (TÜ Eesti Mereinstituut, 2012) did not find any data that would help assess or describe the extent of this pressure in the Estonian marine area. In the Estonian marine area, building hydrotechnical constructions and dumping operations can be considered a type of smothering during which the dredged material is dumped into the sea. In Estonia, official dumping sites are used (Figure 2.8), where usually the material gathered during dredging is disposed of. In recent years, the environmental impact assessments have often suggested to avoid dumping in very shallow areas, for example, in Väinameri. So the material that has been gathered during dredging of Kuivastu, Virtsu and Heltermaa ports have been transported out of Väinameri. The impact of smothering depends on the amount of dumped material, its integration and the hydrodynamic characteristics of the dumping site. The greatest impact of smothering operations occurs when the work is carried out because of suspended particulates that form in the water column and cause decline of light conditions and the benthos is buried under the dumped ground. The content of nutrients may also somewhat increase, but to assess the extent of its specific impact on the production requires additional research. Several dumping sites in use are located much deeper than the euphotic zone which means that there is no phytobenthos. However, suspended particulates may drift with currents from the dumping area to shallower waters. Restoration of the benthos is presumed to take 2−3 years. For example,

55 Strategic Environmental Assessment of the National Development Plan “Estonian Marine Policy
2012−2020” Draft Report, 2015
regardless of repeated dumping operations in Aksi dumping site, monitoring has revealed that dumping operations have not damaged the region`s benthic communities (TÜ Eesti Mereinstituut, 2011). Consequently, dumping operations have had a negative environmental impact, but it is reversible. The impact of establishing hydrotechnical buildings is permanent, because instead of natural seabed quays, breakwalls (Pärnu), walls (Kuressaare) and other structures are constructed. However, taking into account the length of Estonia`s coastline, the ratio of man-made coastal zones is not very large. The largest artificial costal zones are ports in Tallinn region and in Muuga and the dyke of Väike väin strait.
Figure 2.19. Dumping sites in the Estonian marine area. The map has been prepared by Anu Heinsaar, a chief specialist of the cartography department of the Estonian Maritime Administration, 2015. Man-made hydrotechnical structures that have been erected in the coastal zone (shore protection installations, wave breakers, breakwalls, boat landings, sea cables etc.) can change (seal) the conditions of currents and waves and movement of sediments. In several segments of the Estonian coastal zone, water motion is restricted and accumulation of sediments has intensified. The situation is usually opposite on the other side of the obstacle where due to deficit of sedimentation abrasion processes have intensified. Blocking of movement of sediments due to human activity usually occur when obstacles are built in the coastal zone (breakwalls in ports and estuaries). In recent decade, the coastline has most changed in the neighbourhood of the largest ports (Paldiski South and North Port, Muuga, Toila etc.). Sediments pile up in the region of breakwaters that have been built in estuaries. Significant amount of sediments has accumulated behind the breakwalls constructed in the mouths of River Pärnu and River Narva. The sea bottom is also sealed by dredging ground from port basins and waterways. Usually the impact on the coastal processes is greatest in dynamic regions with intensive transport of sediments where repeated dredging is required because of clogging of waterways. Such harbours are, for example, Lehtma, Nasva and Naissaare harbours. The impact of hydrotechnical structures on currents and waves is usually local and does not have an extensive
DUMPING GROUNDS
Soil dumping
Soil dumping (prrevious)
Explosives dumping ground
Explosives dumping ground (sunken mines)
Explosives dumping ground (previous)
Wrecks drowing area)
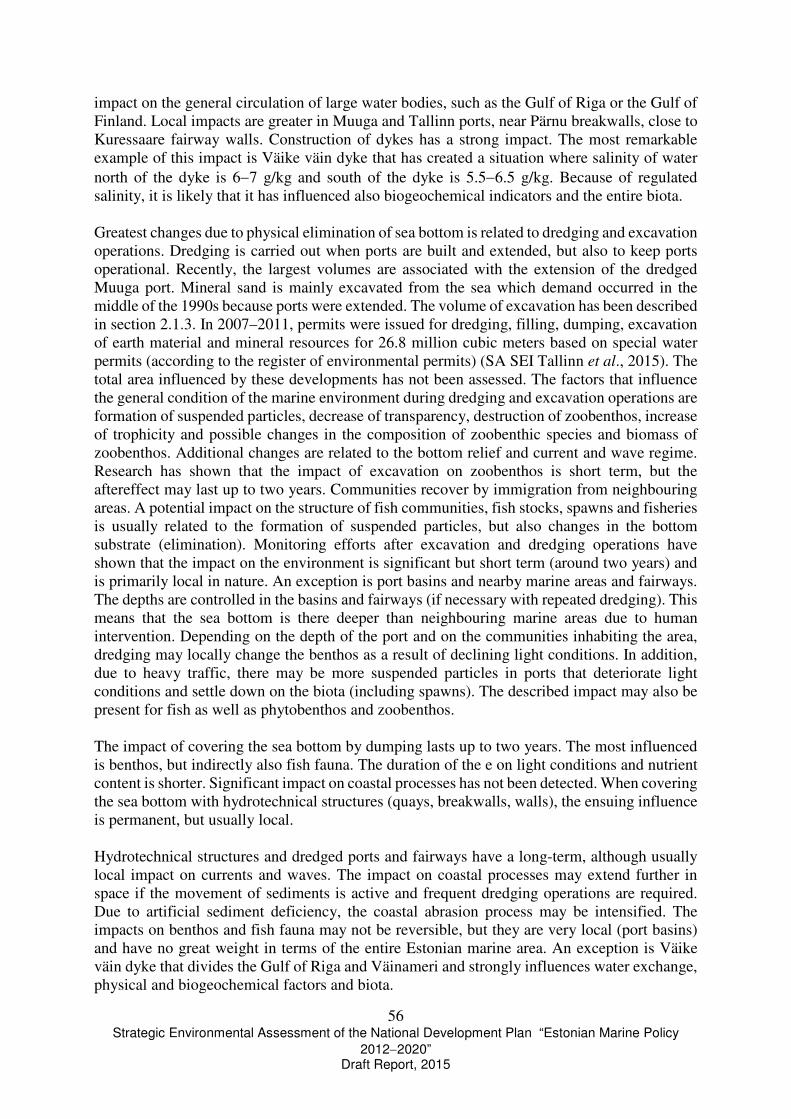
56 Strategic Environmental Assessment of the National Development Plan “Estonian Marine Policy
2012−2020” Draft Report, 2015
impact on the general circulation of large water bodies, such as the Gulf of Riga or the Gulf of Finland. Local impacts are greater in Muuga and Tallinn ports, near Pärnu breakwalls, close to Kuressaare fairway walls. Construction of dykes has a strong impact. The most remarkable example of this impact is Väike väin dyke that has created a situation where salinity of water north of the dyke is 6−7 g/kg and south of the dyke is 5.5−6.5 g/kg. Because of regulated salinity, it is likely that it has influenced also biogeochemical indicators and the entire biota. Greatest changes due to physical elimination of sea bottom is related to dredging and excavation operations. Dredging is carried out when ports are built and extended, but also to keep ports operational. Recently, the largest volumes are associated with the extension of the dredged Muuga port. Mineral sand is mainly excavated from the sea which demand occurred in the middle of the 1990s because ports were extended. The volume of excavation has been described in section 2.1.3. In 2007–2011, permits were issued for dredging, filling, dumping, excavation of earth material and mineral resources for 26.8 million cubic meters based on special water permits (according to the register of environmental permits) (SA SEI Tallinn et al., 2015). The total area influenced by these developments has not been assessed. The factors that influence the general condition of the marine environment during dredging and excavation operations are formation of suspended particles, decrease of transparency, destruction of zoobenthos, increase of trophicity and possible changes in the composition of zoobenthic species and biomass of zoobenthos. Additional changes are related to the bottom relief and current and wave regime. Research has shown that the impact of excavation on zoobenthos is short term, but the aftereffect may last up to two years. Communities recover by immigration from neighbouring areas. A potential impact on the structure of fish communities, fish stocks, spawns and fisheries is usually related to the formation of suspended particles, but also changes in the bottom substrate (elimination). Monitoring efforts after excavation and dredging operations have shown that the impact on the environment is significant but short term (around two years) and is primarily local in nature. An exception is port basins and nearby marine areas and fairways. The depths are controlled in the basins and fairways (if necessary with repeated dredging). This means that the sea bottom is there deeper than neighbouring marine areas due to human intervention. Depending on the depth of the port and on the communities inhabiting the area, dredging may locally change the benthos as a result of declining light conditions. In addition, due to heavy traffic, there may be more suspended particles in ports that deteriorate light conditions and settle down on the biota (including spawns). The described impact may also be present for fish as well as phytobenthos and zoobenthos. The impact of covering the sea bottom by dumping lasts up to two years. The most influenced is benthos, but indirectly also fish fauna. The duration of the e on light conditions and nutrient content is shorter. Significant impact on coastal processes has not been detected. When covering the sea bottom with hydrotechnical structures (quays, breakwalls, walls), the ensuing influence is permanent, but usually local. Hydrotechnical structures and dredged ports and fairways have a long-term, although usually local impact on currents and waves. The impact on coastal processes may extend further in space if the movement of sediments is active and frequent dredging operations are required. Due to artificial sediment deficiency, the coastal abrasion process may be intensified. The impacts on benthos and fish fauna may not be reversible, but they are very local (port basins) and have no great weight in terms of the entire Estonian marine area. An exception is Väike väin dyke that divides the Gulf of Riga and Väinameri and strongly influences water exchange, physical and biogeochemical factors and biota.

57 Strategic Environmental Assessment of the National Development Plan “Estonian Marine Policy
2012−2020” Draft Report, 2015
Dredging and excavation can have material impacts on the coastal processes, water column light field, distribution of nutrients, plankton, benthos and fish fauna. The impact on the biota is estimated to last up to two years. 2.3.2 Underwater noise Many marine organisms, including most marine mammals and many fish species use sounds for various purposes, such as for communication, finding a partner, searching for prey, avoiding predators and risks and navigation. Depending on the intensity and frequency of the sound generated by the source of noise and the distance between the source of noise and the receiver this sound may potentially influence marine organisms in different ways. Underwater noise as a pressure is suggested to be assessed using two indicators: (1) temporal and spatial distribution of strong, low and middle frequency short-time sounds; (2) constant low frequency noise.
In the impact assessments of underwater noise, human activities that generate sounds at frequencies that coincide with the hearing range of marine organisms are important. An exception is very strong sounds in which case the peak sound pressure is more important than frequency (OSPAR, 2009).
The main source of constant low frequency noise is vessel traffic, including sonars. The main strong short-term anthropogenic sound sources is pile-driving during construction works and explosions, including explosive ordnance disposal or shooting exercises.
Currently, there are no monitoring data about underwater noise in the Estonia marine area that would allow to assess the anthropogenic noise impact in this marine environment. No information has been gathered in Estonia about pile-driving when ports are being built. The volume and distribution of sound caused during these works has not been measured. No requirements have been imposed in Estonia on the measurement of underwater noise. Recently, an underwater noise study in the Baltic Sea was launched. The objective of the EU environmental projects financing facility LIFE+ project “Baltic Sea Information on the Acoustic Soundscape (BIAS)” is to measure anthropogenic and natural underwater noise in the Baltic Sea in different seasons during 2014–2016. The data is gathered by 40 measuring stations that are installed in the sea and the plan is to compile a soundscape map for the entire sea (GASUM et al., 2015).
Indirectly, the potential impact of noise can be assessed by the distribution of sound sources. The sources of short-time strong sounds are mainly related to the construction of ports and explosion works. A constant low frequency sound is mainly related to traffic, but also dredging operations. There are no operational wind farms in the Estonian marine area.
HELCOM has compiled maps on possible distribution of sound caused by traffic and water sports (HELCOM, 2010; Figure 2.9). The premise of the assessment of the traffic noise level is its dependence on the intensity of traffic (only those with Automatic Identification System have been taken into account). The highest noise level based on the intensity of traffic in Estonia are the Tallinn Bay and the Muuga Bay regions. Underwater noise is higher than the background also in the Paldiski Bay and along Rohuküla-Heltermaa and Virtsu-Kuivastu waterways. In the open sea, the highest noise level is present in the waterway region that leads from the open sea
58 Strategic Environmental Assessment of the National Development Plan “Estonian Marine Policy
2012−2020” Draft Report, 2015
of the Baltic Sea to the Gulf of Finland ports, especially when it crosses the Tallinn-Helsinki shipping line.
Figure 2.20. Shipping intensity on the Baltic Sea, HELCOM AIS data from 2008 (HELCOM, 2010). Watersports-related underwater noise assessment is based on the premise that it depends on the existing facilities and density of human population. It has also been assumed that most activities take place near harbours. There are no published data about noise measurements related to watersports in the Estonian coastal sea. According to the assessment of HELCOM, the area most disturbed by water sports generated noise would be the Tallinn Bay region, followed by the Pärnu Bay. Explosions to create waterways have been used earlier (for example, Rohuküla-Heltermaa waterway). Mine clearance operations in the Estonian waters have been carried out since 1994.
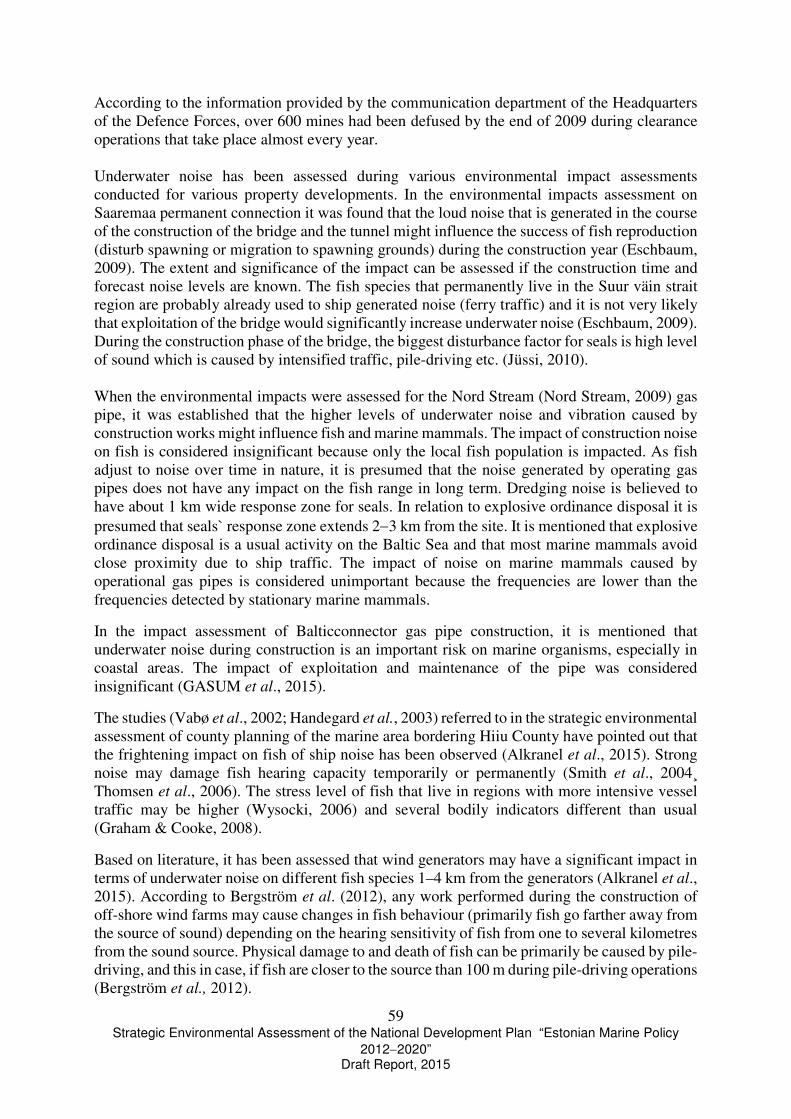
59 Strategic Environmental Assessment of the National Development Plan “Estonian Marine Policy
2012−2020” Draft Report, 2015
According to the information provided by the communication department of the Headquarters of the Defence Forces, over 600 mines had been defused by the end of 2009 during clearance operations that take place almost every year. Underwater noise has been assessed during various environmental impact assessments conducted for various property developments. In the environmental impacts assessment on Saaremaa permanent connection it was found that the loud noise that is generated in the course of the construction of the bridge and the tunnel might influence the success of fish reproduction (disturb spawning or migration to spawning grounds) during the construction year (Eschbaum, 2009). The extent and significance of the impact can be assessed if the construction time and forecast noise levels are known. The fish species that permanently live in the Suur väin strait region are probably already used to ship generated noise (ferry traffic) and it is not very likely that exploitation of the bridge would significantly increase underwater noise (Eschbaum, 2009). During the construction phase of the bridge, the biggest disturbance factor for seals is high level of sound which is caused by intensified traffic, pile-driving etc. (Jüssi, 2010). When the environmental impacts were assessed for the Nord Stream (Nord Stream, 2009) gas pipe, it was established that the higher levels of underwater noise and vibration caused by construction works might influence fish and marine mammals. The impact of construction noise on fish is considered insignificant because only the local fish population is impacted. As fish adjust to noise over time in nature, it is presumed that the noise generated by operating gas pipes does not have any impact on the fish range in long term. Dredging noise is believed to have about 1 km wide response zone for seals. In relation to explosive ordinance disposal it is presumed that seals` response zone extends 2−3 km from the site. It is mentioned that explosive ordinance disposal is a usual activity on the Baltic Sea and that most marine mammals avoid close proximity due to ship traffic. The impact of noise on marine mammals caused by operational gas pipes is considered unimportant because the frequencies are lower than the frequencies detected by stationary marine mammals.
In the impact assessment of Balticconnector gas pipe construction, it is mentioned that underwater noise during construction is an important risk on marine organisms, especially in coastal areas. The impact of exploitation and maintenance of the pipe was considered insignificant (GASUM et al., 2015).
The studies (Vabø et al., 2002; Handegard et al., 2003) referred to in the strategic environmental assessment of county planning of the marine area bordering Hiiu County have pointed out that the frightening impact on fish of ship noise has been observed (Alkranel et al., 2015). Strong noise may damage fish hearing capacity temporarily or permanently (Smith et al., 2004¸ Thomsen et al., 2006). The stress level of fish that live in regions with more intensive vessel traffic may be higher (Wysocki, 2006) and several bodily indicators different than usual (Graham & Cooke, 2008).
Based on literature, it has been assessed that wind generators may have a significant impact in terms of underwater noise on different fish species 1–4 km from the generators (Alkranel et al., 2015). According to Bergström et al. (2012), any work performed during the construction of off-shore wind farms may cause changes in fish behaviour (primarily fish go farther away from the source of sound) depending on the hearing sensitivity of fish from one to several kilometres from the sound source. Physical damage to and death of fish can be primarily be caused by pile-driving, and this in case, if fish are closer to the source than 100 m during pile-driving operations (Bergström et al., 2012).

60 Strategic Environmental Assessment of the National Development Plan “Estonian Marine Policy
2012−2020” Draft Report, 2015
A study of echo sounding of harbour porpoise conducted on a construction site in the open sea of the North Sea has shown that harbour porpoise response zone to pile-driving noise exceeded 20 km (Tougaard et al., 2009). Tougaard et al. (2009b) considered unlikely, based on the measurements of underwater noise caused by different wind turbines (in Denmark and Sweden) during their usual operation, that the noise would exceed the dangerous level for harbour seals or harbour porpoises at any distance from the turbines and that the noise could mask the acoustic communication of seals or harbour porpoises.
The local fish fauna may be influenced by noise caused by shooting exercises. The strength of the impact is hard to determine because there is relatively little research on this topic. Noise created by ships and hydrotechnical and explosion operations has a negative impact on fish fauna and marine mammals. Currently, there is no data to determine the quantitative impact for the entire Estonian marine area. Outdoor noise propagation has been described in section 2.1.6. 2.3.3 Nutrient enrichment The Baltic Sea that lays between developed industrial and agricultural countries is a sea with one of the greatest pollution loads. Nutrient and organic substance inputs into the Baltic Sea originate from many local sources and from diffuse pollution sources. Limited water exchange with the global sea causes accumulation of these compounds in the Baltic Sea. From the 1970s, enrichment with nutrients and organic substances of the sea has been a growing problem. The development strategy “Estonian Environmental Strategy up to 2030” considers enrichment of seawater with nutrients and organic compounds one of the main problems that causes eutrophication and undesirable condition of the Estonian coastal sea. In order to achieve and maintain a good condition of the coastal sea, it is necessary to reduce the amount of nutrient and organic substance inputs originating from economic activity into the sea that may decline the ecological condition of the coastal sea; ensure sufficient treatment of wastewater inputs to the sea; ensure collection of wastewater (including sewage) from ships in ports and ensure strict following of established restrictions. Nitrogen and phosphorous compounds or biogenic compounds are nutrients that limit plant growth. When these compounds, organic or inorganic, are released into a body of water, the primal production of the waterbody will increase, which in turn increases sedimentation process of organic substance. Combined with added nutrients and organic substance, the composition of flora and fauna is changed. All these changes that are caused by added nutrients is called eutrophication of a waterbody. The inputs of nitrogen and phosphorous into the Baltic Sea from rivers and point sources has reduced in the past two decades (joonis 2.21).
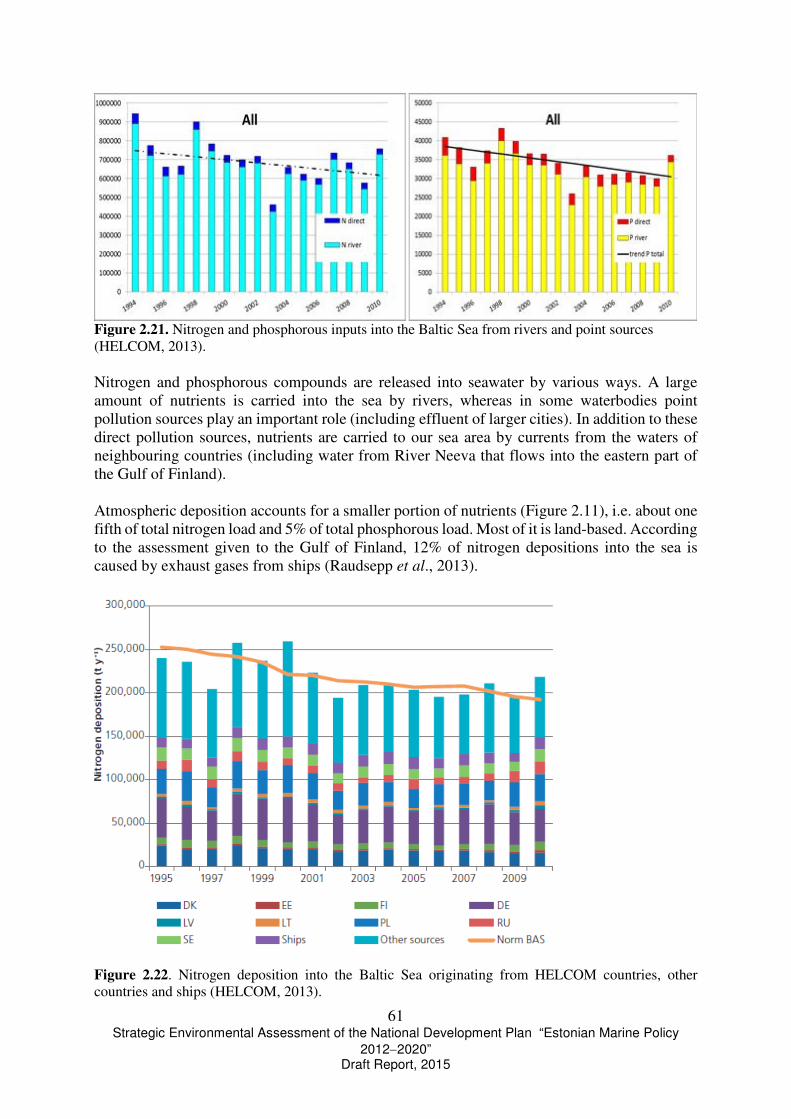
61 Strategic Environmental Assessment of the National Development Plan “Estonian Marine Policy
2012−2020” Draft Report, 2015
Figure 2.21. Nitrogen and phosphorous inputs into the Baltic Sea from rivers and point sources (HELCOM, 2013). Nitrogen and phosphorous compounds are released into seawater by various ways. A large amount of nutrients is carried into the sea by rivers, whereas in some waterbodies point pollution sources play an important role (including effluent of larger cities). In addition to these direct pollution sources, nutrients are carried to our sea area by currents from the waters of neighbouring countries (including water from River Neeva that flows into the eastern part of the Gulf of Finland). Atmospheric deposition accounts for a smaller portion of nutrients (Figure 2.11), i.e. about one fifth of total nitrogen load and 5% of total phosphorous load. Most of it is land-based. According to the assessment given to the Gulf of Finland, 12% of nitrogen depositions into the sea is caused by exhaust gases from ships (Raudsepp et al., 2013).
Figure 2.22. Nitrogen deposition into the Baltic Sea originating from HELCOM countries, other countries and ships (HELCOM, 2013).

62 Strategic Environmental Assessment of the National Development Plan “Estonian Marine Policy
2012−2020” Draft Report, 2015
Based on the data of national environmental monitoring, the point sources of pollution in Estonia during 1992−2004 showed a decreasing trend. The decrease was especially steep in 1992−1994. The decrease of the pollution load in the beginning of the 1990s was, for the most part, caused by the reduced production activity. The further decrease in pollution is related to updating of production, construction and renovation of treatment plants and improved legislative drafting and increased pollution charges. However, the trend of nitrogen and phosphorous compounds in the rivers that flow into the Estonian coastal sea has been slightly decreasing in 1992−2004 (TÜ Eesti Mereinstituut, 2012). In the overview of HELCOM (2013) about the pollution load of the Baltic Sea, there are presented trends of nutrient loads originating from the Member States` rivers and point sources (Figures 2.12 and 2.13). Although there is no reliable trend for 1994−2010 on nitrogen originating from Estonia, the phosphorus input has decreased. As regards our neighbouring countries, a statistically negative nitrogen input trend is characteristic to Sweden and Latvia, whereas there is no reliable trends for Finland and Russia. As for phosphorous, Finland and Sweden had a negative trend, whereas no reliable trend is available for Russia, and Latvia had a positive trend.
Figure 2.23 Estonia`s nitrogen input from rivers and point pollution sources (HELCOM, 2013).

63 Strategic Environmental Assessment of the National Development Plan “Estonian Marine Policy
2012−2020” Draft Report, 2015
Figure 2.24. Estonia`s phosphorous input from rivers and point pollution sources (HELCOM, 2013). There is no reliable trends about both nutrient inputs into the Gulf of Finland by every waterbody. The nitrogen trend of the Gulf of Riga is unreliable and there is a positive phosphorous trend. Based on the existing data, it is difficult to assess how large amounts of nutrients may be input into the Estonian coastal sea without causing major and not reversible changes in the biota. On the one hand, the strength of impacts is related to the amount of input nutrients into the sea; on the other hand, the water exchange of the waterbody. Increased water exchange of a waterbody increases the solution effect of pollutants and the impact of nutrients on the marine environment decreases (TÜ Eesti Mereinstituut, 2012). As discharged nitrogen and phosphorus-rich substances is the main cause of eutrophication of the Estonian coastal sea, the status assessment of the existing marine environment (TÜ Eesti Mereinstituut, 2012) clearly shows that input nutrient amounts are too large for the Estonian coastal sea and the status is assessed to be unsatisfactory based on this indicator. 2.3.4 Inputs of organic matter Mineral nutrients and organic matter inputs into the sea as all other bodies of surface water mainly come from dry land. Organic matter is input into the sea mainly by flowing waterbodies (rivers, streams, effluent inlets, stormwater that washes the ground), whereas input by atmospheric deposition is usually small and generally insignificant. At the same time, the primary production of organic matter occurs in the sea by planktonic and benthic algae and plants that grow in shallow waters close to the coast (reed etc.). The rest of the marine biota lives on the organic matter synthesised in the sea (autothonic) and input into the sea (allothonic) from outside, such as bacteria, microzooplankton, mesozooplankton and macrozooplankton, benthic organisms, fish, marine mammals and birds. Human activities cause not only an input of inorganic nitrogen and phosphorous, but also organic substances into the sea. The most important anthropogenic organic pollution sources are inlets of untreated or poorly treated effluents, in certain cases stormwater that flows into the sea and activities that cause soil erosion (construction, dredging, dumping). Organic pollution originating from ships (wastewater, litter) is little. Nutrient and organic substance enrichment of seawater is one of the most widespread results of human activity that influences seas nowadays. Nutrients and organic substances are input into the Baltic Sea from various local sources. Diffuse pollution has also to be taken into account. Limited exchange of water with the global sea causes accumulation of these compounds in the Baltic Sea. From the 1970s, enrichment with nutrients and organic substances of seawater has been a growing problem (TÜ Eesti Mereinstituut, 2012). The consequence of input of excess nitrogen and phosphorous into the Baltic Sea of anthropogenic cause is excessive and unlimited growth of algae and production of organic substance (algae mass) that exceeds the self-cleaning capacity of the sea which leads to accelerated eutrophication of the Baltic Sea. Excessive primary production changes significantly the conditions of the sea as a living environment, because transparency of water decreases, stratification of the water column due to temperature intensifies, organic sediments

64 Strategic Environmental Assessment of the National Development Plan “Estonian Marine Policy
2012−2020” Draft Report, 2015
accumulate, oxygen in demersal water is used up by degradation process of algae remnants, toxic intermediates (sulphur hydrogen, ammonia) are emitted when decomposition of organic substances is incomplete due to oxygen deficit. Siltation on the sea bottom leads to oxygen deficit which causes loss of habitats suitable for benthos. This all leads to the decline of biodiversity of marine biota, decrease or destruction of more valuable commercial fish populations and general reduction of seawater quality. An excess of organic substances may directly disturb human life in areas directly neighbouring the sea; for example, the sea with excessive decomposing organic substances smells. The above listed changes influence also the use of sea by people for recreational purposes. In order to better contribute to the improvement of the state of the Baltic Sea, the Estonian Environmental Strategy to 2030 (http://www.keskkonnainfo.ee/failid/viited/strateegia30.pdf) has acknowledged that enrichment of seawater with nutrients and organic substance is one of the main problems that causes undesirable eutrophication of the Estonian coastal water. To achieve and maintain good coastal water condition of the Baltic Sea that has been set down as one of the targets of the Water Policy Framework Directive, it is necessary to reduce significantly the amount of nutrients and organic substances that are input into the sea due to the economic activity, ensure sufficient treatment of wastewater inputs into the sea, receipt of waste (including sewage) generated on ships in ports and strict fulfilment of established restrictions. If the above are not ensured, the target of good state of coastal water is not achievable. The amount of organic inputs are not directly measured by monitoring programmes. The content of organic substance in water is often measured by biochemical oxygen demand (BHT5 and BHT7). As organic substance in mainly input into the Estonian coastal water through rivers and point pollution sources, measuring of organic pollution (load) is primarily conducted within the framework of riverwater quality monitoring programme that was introduced in Estonia in 1992. The hydrochemical monitoring of rivers is included in the national environmental monitoring programme since 1994. The sampling points of rivers` hydrochemical monitoring have been chosen so as to determine the outflow of pollutants from rivers into the sea or larger lakes, the condition of background and changes and the extent of diffuse pollution due to intensive agriculture. Sampling is conducted, depending on the objective, 6 to 12 (24) times a year. Within the framework of the river hydrochemical monitoring, water samples are tested for quality indicators as well as biological oxygen demand (BHT7), permanganate oxygen demand (PHT) or water chemical oxygen demand (COD) (TÜ Eesti Mereinstituut, 2012). The content of organic substance in seawater (Estonian coastal sea) has been detected using distant monitoring methods. Although development of algorithms suitable for the Baltic Sea is in progress, it is possible to see the spatial pattern of organic substance (yellow substance) and its temporal variability based on archived raw pictures of the satellites MODIS and MERIS taken on cloud-free days and on the final product maps. Although yellow substance is generated in oceans during phytoplankton decomposition, its presence in the coastal sea is mainly related to an inflow from land. This is why the concentrations of the yellow substance are great in rivers` influence areas, for example in Pärnu Bay and the delta of River Neeva (TÜ Eesti Mereinstituut, 2012). In the Baltic Sea, a good correlation between the yellow substance and contents of organic substance has been observed (Kowalczuk et al., 2010). Therefore, distance monitoring has a great potential in assessing the content of dissolved organic substance in seawater and introduction of this methodology to monitor and assess the condition of the coastal sea should be considered in future.

65 Strategic Environmental Assessment of the National Development Plan “Estonian Marine Policy
2012−2020” Draft Report, 2015
The load of organic substance can also be assessed by the content of organic substance in sea sediments, which is a much more stable indicator than the content of organic substance in seawater. Potentially, it is possible to assess the amount of organic substance discharges in a region based on the content of organic substance sediments, but this indicator has not yet been included into the monitoring programmes. According to studies conducted for research purpose, in most gaps, larger contents of organic substance has been found. The contents of organic substance are also great in Tallinn Bay, Paldiski Bay, Haapsalu Bay and in the north-eastern part of the Gulf of Riga. The condition of these researched areas, based on organic substance, can be clearly considered non-satisfactory (TÜ Eesti Mereinstituut, 2012). In most other Estonian coastal waters, the condition of the marine environment can be assessed as satisfactory based on organic substance content. Only some researched areas, mostly in western Estonia, where the average organic substance contents of sediments is below 2% can be given a good score based on this indicator. As changes in the organic substance content is not measured within the framework of marine environment monitoring, the trends of this indicator are unknown (TÜ Eesti Mereinstituut, 2012). The impact of organic pollution on marine biota has been assessed by comparing the abundance of species and cumulative curves of biomass (Weston, 1990; Kotta & Kotta, 1997). Occurrence of oxygen deficit in deeper sea areas causes shifting of the biota range maximums towards shallower marine areas (Kotta et al., 2008). The condition of the Estonian coastal waters based on the input of organic substance and contents of organic substance is not good in most areas. Hence, it is necessary to limit not only inputs of nutrients but also organic substance into the coastal sea. It is also reasonable to improve monitoring to enable more precise detection of organic substance. 2.3.5 Introduction of microbial pathogens to waterbodies The microbiological quality of the Estonian coastal water is influenced by point pollution sources (effluent inputs and stormwater outlets), diffuse pollution (washed and stormwaters from land) and faecal pollution from ships (inputs of untreated or partly treated sewage to the sea, pollution from ports). In Estonia, there are altogether 42 urban communities with pollution load over 2,000 human equivalents (ie). There are 22 urban communities with human equivalents of 2,000−10,000 and 20 with over 10,000 human equivalents, of which adjacent to the sea are Tallinn, Kohtla-Järve, Pärnu, Narva, Kuressaare, Maardu, Sillamäe, and Haapsalu. About 900,000 people live in these 42 urban communities, where 94% of residents use the public water supply service and 92% have connections to the public sewerage system. The number of residents that have access to the public water and sewerage system is largest in Tallinn. In Estonia, wastewater is treated in larger communities using either biological (level II treatment) or biological-chemical method (level III treatment). It is not allowed to treat wastewater solely by mechanical method (level I treatment) any more. 40% of wastewater that requires treatment is also produced in Tallinn (TÜ Eesti Mereinstituut, 2012). The requirements for treatment of wastewater and directing effluent to a waterbody or ground and measures for supervision of fulfilment of the requirements have been set down by Regulation of the Government of the Republic of 29 November 2012 No. 99 “Requirements for treatment of wastewater and directing effluent and rainwater to receiving water body, the
66 Strategic Environmental Assessment of the National Development Plan “Estonian Marine Policy
2012−2020” Draft Report, 2015
limits of effluent and rainwater pollution indicators and measures to supervise fulfilment of the requirements1” (RT I, 13.06.2013, 13). The pollution indicators of effluent directed to a waterbody must meet the limit values set down in Annex 1 of the Regulation. Stormwater forms mainly on asphalt surfaces and comes from rain and melting water that gathers on roofs and ground drainage water. Pathogenic microorganisms may get into stormwater as part of water washed from streets and residential districts, especially from hospital territories. Contaminated stormwater flows must be treated before directing them to a receiving waterbody so that not to deteriorate its condition. Stormwater flows may be directed from a combined sewerage system during a rain in accordance with regulation No. 99 through overflows together with wastewater one to four at least. Significant microbiological contamination originates from ports and ships. Tallinn is becoming a more popular passenger terminal and a stopover for cruise ships. Tallinn has become the second destination after St. Petersburg among the ports visited by cruise ships sailing on the Baltic Sea. Cruise ships that travel all over the world are usually in South America, Caribbean sea, Panama channel or Asia in winter, in the Mediterranean Sea in spring and recently more often in the Baltic Sea in summer. For example, ships of the operators of the world`s largest cruise ship corporation Carnival, such as P&O Princess Cruises, Costa Cruises, Cunard Line, Seabourn Cruises etc. ships, but also ships like Royal Caribbean International & Celebrity Cruises, Crystal Cruises, Regent Seven Seas, Norwegian Cruise Line that belongs to the Star Group and others have visited Tallinn ports from 2010. In 2010, the listed cruise ships visited Tallinn Port altogether 286 times. In 2010, altogether 7,723 ships, of which 287 were cruise ships and passenger ships, visited the ports that are part of AS Tallinna Sadam (Muuga Port, Paljassaare Port, Vanasadam, Paldiski South Port, Saaremaa Port). In 2010, the amount of wastewater received from ships was 9,465 m3, which is a relatively small amount compared to the number of ships and passengers that had visited the ports (TÜ Eesti Mereinstituut, 2012). Discharge of wastewater (effluent) from ships to sea is regulated by the Alaska convention that does not specify nitrogen, phosphorous and bacteria content in effluent. The requirements of the Alaska convention are not sufficient for the Baltic Sea. The amount of wastewater that may include pathogenic microbes produced on ships depend on the number of people and days on sea. The largest amount of faecal wastewater with unknown microbe content is generated on large cruise ships. The regular passenger lines usually give faecal waters over to the port every day. Cruise ships that carry thousands of passengers spend usually a week or more on sea, which means that large amounts of sewage is produced on ships that have not been disposed of in Estonian ports and they are disposed of, after some treatment, by putting them directly into the sea, mainly into international waters (Hänninen & Sassi 2009). As not all cruise ships are equipped with a wastewater treatment system, and even on ships that have treatment systems, the elimination of nitrogen and phosphorous from the effluent dumped into sea is insufficient, if we take into account the size and condition of the Baltic Sea. As wastewater is not disinfected before dumping into the sea, it contains also a large amount of microorganisms, of which some may be pathogens (Hänninen & Sassi, 2009). According to the port charges procedure of AS Tallinna Sadam that was established in 2012, up to 7 m3 wastewater is received per one ship on account of the waste charge. Any amounts exceeding this amount are charged additionally for actual received amounts and in accordance with the price list of the relevant waste treatment company (Green Marine AS, Maxitrans OÜ,
67 Strategic Environmental Assessment of the National Development Plan “Estonian Marine Policy
2012−2020” Draft Report, 2015
Rarn-Sells AS). The waste charge is paid per gross tonnage (GT) of a ship for every visit, whereas the waste charges are lowest for passenger ships (0,010 EUR per GT unit) and highest for cruise ships (0,022 EUR per GT unit; Port fees…). The main obstacle for international cruise ships to disposing of wastewater in ports have been non-compliant wastewater reception equipment and relatively high service charges. Microbiological quality of coastal water. In 2006, a new Bathing Water Directive 2006/7/EC was adopted to ensure concordance with other Community legislation on water, primarily the directive establishing a framework for Community action in the field of water policy. Directive 76/160/EEC was repealed with effect from 31 December 2014 by the new directive 2006/7/EC. The Member States were to transpose the Directive to their national law by March 2008, but the Member States were given time for complete implementation until 2015. The new requirements change the assessment and supervision of bathing waters considerably. The new directive specifies new requirements on water quality, monitoring, classification and assessment and informing of people. Until 2007 bathing water was tested for coliform bacteria and faecal coliform bacteria as microbiological indicators and physical-chemical indicators (pH, transparency and presence of mineral oils) in accordance with the Government of Republic Regulation of 25 July 2000 No. 247 “Health protection requirements for bathing beaches and bathing water” (RT I 2000, 64, 407). From 2008, only two microbiological indicators − enterococcus and Escherichia coli counts − are monitored in bathing water (in accordance with the Government of the Republic Regulation No. 74 “Requirements for bathing water and bathing areas1” of 3 April 2008 (RT I, 29.08.2011, 6). The quality of bathing water is checked during the bathing season from 1 June to 31 August in all public and in some non-official bathing areas. Presence of pathogenic bacteria and count is not analysed during the routine bathing water monitoring. Additional analyses on pathogenic microbes are conducted, if necessary, if the count of the indicator bacteria exceeds significantly allowed limit concentrations. Effluent and coastal waters are not tested for the count of pathogenic bacteria or viruses (analyses are made in exceptional cases, by the request of the Environmental Board, if there is a threat to groundwater (TÜ Eesti Mereinstituut, 2012). Consequently, the most significant source of pathogenic bacteria in Estonia is the fast-growing cruise ship operating sector and still insufficient organisation of wastewater (sewerage) treatment originating from cruise ships. As cruise ships discharge partly treated sewerage mainly into international waters, it does not have a direct impact on the microbiological quality of the Estonian coastal waters. As the bathing season in Estonia is relatively short, the sea temperature cool and usually healthy people go bathing, the microbiological load on waters is local and small and possible pathogens load unlikely (TÜ Eesti Mereinstituut, 2012).
2.3.6 Contamination by hazardous substances An overview of the situation concerning hazardous substances and contamination by these substances in the Estonian marine areas has been given by O. Roots, M. Simm and E. Realo in the initial assessment of the Estonian marine areas status (TÜ Eesti Mereinstituut, 2012). It was found that the status of the Estonian marine areas in terms of hazardous substances could be assessed as good. Only some analyses for some substances exceed unofficial limits in fish, such
68 Strategic Environmental Assessment of the National Development Plan “Estonian Marine Policy
2012−2020” Draft Report, 2015
as heavy metals (Cd, Pb), organotin compounds, hexachlorobenzene. Concentrations of several compounds (Hg, pesticides, PCB) were lower that the target value or the limit of the particular analytical determination of the used method. The issue of radioactive substances is especially topical in the Baltic Sea region due to the Chernobyl nuclear plant disaster (1986) that turned the Baltic Sea into the most contaminated sea with artificial radioactive substances in the world. However, seawater and biota in the Estonian marine area were only slightly contaminated. During the next decades, the general status of the sea has improved. According to the continuous monitoring data, there is a clear decreasing trend of content of radioactive substances in seawater and biota and a decreasing trend of radiation doses of habitants from assessments (TÜ Eesti Mereinstituut, 2012). HELCOM (2010b) has assessed the status of marine areas in terms of hazardous substances as a whole. The general assessments of the Gulf of Finland and the Gulf of Riga give predominantly the status “average” to these areas, but the score “poor” has also been given. A positive aspect is that the concentrations of most hazardous substances are declining in the Baltic Sea marine environment.
Estonian Marine Institute of Tartu University (2015) has come to the conclusion in the monitoring report on hazardous substances in the Estonian coastal sea that the content of hazardous substances in organisms is not usually in conflict with the main objective of EU norms regarding environmental quality, i.e. the content of hazardous substances must not significantly increase over time.
The content of hazardous substances and their substance groups tested in Estonian rivers that flow to the Baltic Sea fell in most cases under the analytical determination limits of the particular analyses methods or did not exceed established environmental quality limit values. The results of research into synthetic compounds and biologically active substances have shown relatively low concentrations, which usually are below the set danger levels. The best is known about the situation of heavy metals regarding non-synthetic hazardous substances and compounds. The Ministry of the Environment requested a study to be conducted in 2010 to research the presence of 52 hazardous substances in 19 water-monitoring stations (of these, 18 surface water bodies). In some researched locations cadmium, nickel and tin contents that exceeded determination limits were found (TÜ Eesti Mereinstituut, 2012).
Hazardous substances are deposited into the Baltic Sea also from the atmosphere. Emissions of dioxin as well as heavy metals to the atmosphere have significantly decreased in recent decades in the Baltic Sea region (TÜ Eesti Mereinstituut, 2012).
The status of the Estonian marine area in terms of hazardous substances is average and poor according to HELCOM (2010b) data. However, the contents of hazardous substances is not generally in conflict with the main objective of environmental quality specified in the EU norms – the contents of hazardous substances must not significantly increase over time . A positive indicator is that the concentrations of hazardous substances in the Baltic Sea marine environment are decreasing. A decreasing trend is also seen in the contents of radioactive substances, although the indicator has not yet dropped to the level before the Chernobyl nuclear power plant disaster. 2.3.7 Marine litter
69 Strategic Environmental Assessment of the National Development Plan “Estonian Marine Policy
2012−2020” Draft Report, 2015
Every year, millions of tons of waste find their way into the global sea. Marine litter has not been considered a very important topic in the context of the Baltic Sea, the reason being that there are no data on marine litter amounts in this region. The project MARLIN (http://www.projectmarlin.eu/, 13.08.2015) that includes all regions adjacent to the Baltic Sea was launched in 2011 with the objective to give an initial and more specific overview about marine litter in the Baltic Sea region. During the project, the amount and contents of litter on the beaches of Sweden, Finland, Estonia and Latvia (altogether 23 beaches, both in cities and rural areas) were monitored and assessments were made about the total amounts of marine litter that reaches the Baltic. The project was conducted following the method developed during the UN Environmental Programme in 2009. The final report of the project was presented in 2013, which has been used as the source for the following summary. The results of the projects showed that plastic accounts for a large part of litter (ca 62%) on beaches. Particular plastic products (e.g. caps, packages etc.) as well as partly decomposed and therefore unidentifiable pieces of plastic products have been found. Other marine litter materials are metal, glass etc. The most common type of litter found on the beaches is cigarette buts. During the project, it was found that there was more litter on urban beaches than on rural beaches which is directly related to littering by beach-goers and litter ending up at beaches from city ditches, rainwater systems etc. Litter (e.g. ropes, fishing gear etc.) on rural area beaches is expectedly sea-based (shipping, water tourism etc.). It was concluded that 80% of litter that is carried to the sea is land-based (including litter carried by rivers, non-compliant waste management in households etc.) and 20% of litter is from sea-based sources. However, the amount of seabed litter in the Baltic Sea was twice as high as in the North Sea which was confirmed by surveys conducted in 2012. This may be the result of lack of strong surface currents and tidal water in the Baltic Sea, which is why litter from sea-based sources may not reach the coast but settle onto the seafloor. A positive aspect is that in accordance with HELCOM requirements, the waste reception conditions have been improved in ports. Furthermore, in 2015, HELCOM prepared a regional marine litter action plan that focuses on the possibilities of reducing marine litter. As the largest part of marine litter is generated on land and it can be presumed that using plastic (including packaging) continues to increase in future, it is important to focus on improving the awareness of people about marine litter and compliant handling of waste. 2.3.8 Oil pollution from ships and its impact
Waterborne traffic in the Estonian marine areas is intensive. Traffic is especially intensive on the Gulf of Finland that is formed by the west-east transit traffic on the open sea of the Baltic Sea and on the Gulf of Finland. About 40,000 ships that have an AIS transponder enter and leave the Gulf of Finland annually. About 10,000 ships go through the Irbe strait that connects the Gulf of Riga to the open sea every year (HELCOM, 2014). The number of ships that sail through Väinameri is significantly smaller − about three hundred ships (Ramboll Eesti AS, 2007). In this region, more important is recreational craft traffic, and according to Ramboll Eesti AS (2007) estimated 1,500−2,000 recreational craft enter Väinameri in a year.

70 Strategic Environmental Assessment of the National Development Plan “Estonian Marine Policy
2012−2020” Draft Report, 2015
There is a high risk of ship accidents on the marine areas with intensive traffic. The most frequent reason of accidents is the so-called human factor, e.g. in 2013, people played a role in half of ship accidents that happened on the Baltic Sea and ended in pollution (HELCOM 2014). The accidents on the Baltic Sea during 2004−2013 were mostly related to collusions and running aground of ship. However, almost half of accidents are related to cargo vessels and in ca 5% cases pollution has ensued. In 1997−2006, 42 ship collisions happened on the Gulf of Finland (Kujala et al., 2013), which is four such accidents in a year on an average. Most of known collusion incidents occurred due to ice conditions. The largest collision risk area near the Estonian marine area is the region between Tallinn and Helsinki where intercity passenger ship traffic meets the east-west route of cargo vessels and tankers (Kujala et al., 2013). In the Estonian marine areas, the region with the most frequent accidents with tankers is the neighbouring area of Tallinn and Muuga (HELCOM, 2014). In the “Emergency risk analysis – extensive coastal pollution” conducted by Environmental Board in 2013, the following conclusion was made: “Due to the fact that during the past 15 years three coastal pollution incidents that qualify as accidents have happened and taking into account that Estonia`s capacity to prevent or eliminate marine pollution does not meet yet HELCOM suggestions (in addition to insufficient pollution control capacity, an important factor is weather that does not often allow to perform operations on the sea), in most cases marine pollution causes also coastal pollution. Hence, the probability of coastal pollution can be assessed as high as the probability of an extensive marine pollution. Consequently, the highest environmental pollution risk in our marine areas is the risk of leakage of oil products into the sea due to ship accidents. In addition to oil products that leak into the sea due to accidents, many smaller oil spills are found in the Baltic Sea every year. These spills are small individually, because they are usually smaller than 1 m3, but altogether they are an important pressure on the Baltic Sea environment. The sources of pollution are usually leaking wrecks and ships travelling on the Baltic Sea that intentionally or unintentionally leak/dump oil products (e.g. polluted bilge water) into the sea. During the past two decades, the number of oil spills detected in the sea has been decreasing, regardless of the fact that the length of monitoring flights has increased as has the traffic load on the Baltic Sea. In the first half of the 1990s, about 400−600 oil spills per 3,000 flight hours were discovered in the Baltic Sea in a year. In 2013, 130 oil spills (of which 18 originated from the same wreck) were detected during 4,317 flight hours. The dynamics of oil spill detection is well described by PF (Pollution per Flight) index that shows the number of detected spills per a flight hour (HELCOM, 2014b, Figure 2.14). In the analysis of the HELCOM project BRISK it was found that the impact of various measures (double-bottom tankers, various navigational aids) reduce significantly the risks that come from the growth of waterborne traffic (Admiral Danish Fleet HQ, National Operations, Maritime Environment, 2011).
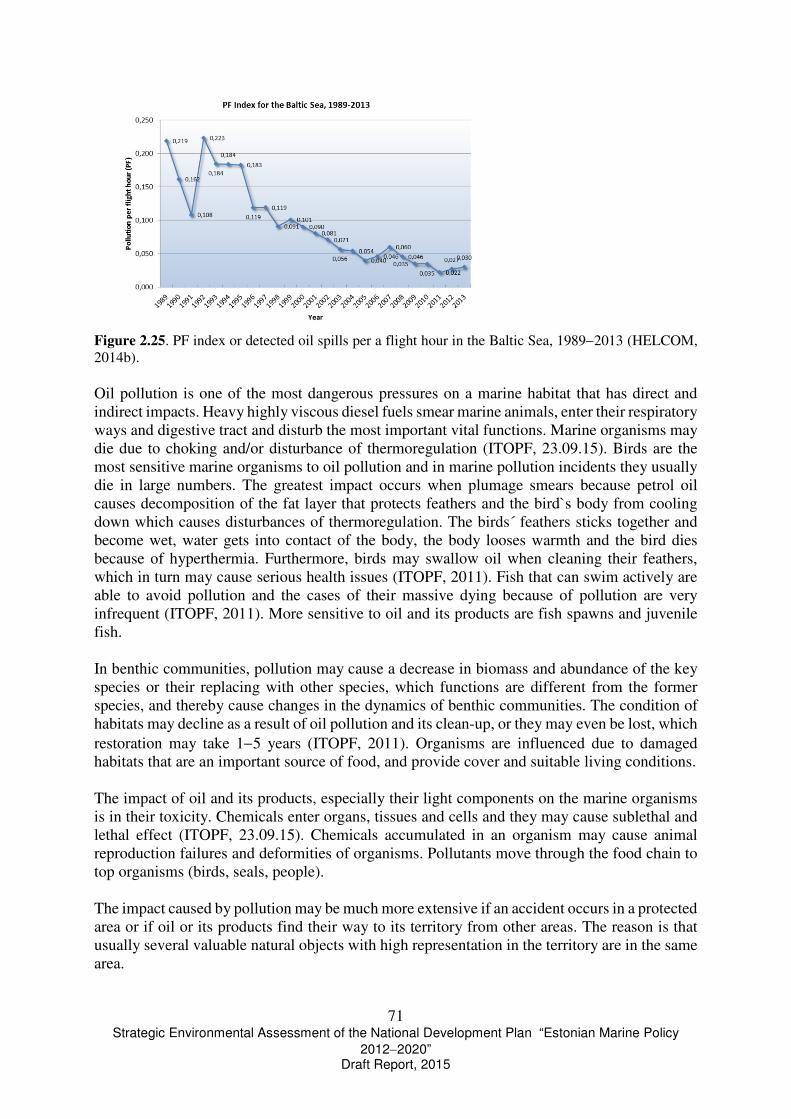
71 Strategic Environmental Assessment of the National Development Plan “Estonian Marine Policy
2012−2020” Draft Report, 2015
Figure 2.25. PF index or detected oil spills per a flight hour in the Baltic Sea, 1989−2013 (HELCOM, 2014b). Oil pollution is one of the most dangerous pressures on a marine habitat that has direct and indirect impacts. Heavy highly viscous diesel fuels smear marine animals, enter their respiratory ways and digestive tract and disturb the most important vital functions. Marine organisms may die due to choking and/or disturbance of thermoregulation (ITOPF, 23.09.15). Birds are the most sensitive marine organisms to oil pollution and in marine pollution incidents they usually die in large numbers. The greatest impact occurs when plumage smears because petrol oil causes decomposition of the fat layer that protects feathers and the bird`s body from cooling down which causes disturbances of thermoregulation. The birds´ feathers sticks together and become wet, water gets into contact of the body, the body looses warmth and the bird dies because of hyperthermia. Furthermore, birds may swallow oil when cleaning their feathers, which in turn may cause serious health issues (ITOPF, 2011). Fish that can swim actively are able to avoid pollution and the cases of their massive dying because of pollution are very infrequent (ITOPF, 2011). More sensitive to oil and its products are fish spawns and juvenile fish. In benthic communities, pollution may cause a decrease in biomass and abundance of the key species or their replacing with other species, which functions are different from the former species, and thereby cause changes in the dynamics of benthic communities. The condition of habitats may decline as a result of oil pollution and its clean-up, or they may even be lost, which restoration may take 1−5 years (ITOPF, 2011). Organisms are influenced due to damaged habitats that are an important source of food, and provide cover and suitable living conditions. The impact of oil and its products, especially their light components on the marine organisms is in their toxicity. Chemicals enter organs, tissues and cells and they may cause sublethal and lethal effect (ITOPF, 23.09.15). Chemicals accumulated in an organism may cause animal reproduction failures and deformities of organisms. Pollutants move through the food chain to top organisms (birds, seals, people). The impact caused by pollution may be much more extensive if an accident occurs in a protected area or if oil or its products find their way to its territory from other areas. The reason is that usually several valuable natural objects with high representation in the territory are in the same area.
72 Strategic Environmental Assessment of the National Development Plan “Estonian Marine Policy
2012−2020” Draft Report, 2015
There have been several ship accidents in Estonia that caused leakage of several tons of oil and its products into the sea, although most of them did not cause serious environmental problems. The largest environmental pollution happened at the end of January 2006 on the north-western coast of Estonia and the person that caused it has remained unidentified. During the clean-up operations, 10 tons of heavy fuel oil was collected but the amount that was leaked into the sea is not exactly known. Because of this pollution incident, thousands of birds died in north-western Estonia (Eesti Looduse Fond, 2007). No significant negative impact to benthic communities was found (Herküll & Kotta, 2012). Due to intensive waterborne traffic and significant and extensive impact of oil pollution on the marine environment, oil products leaked into the sea due to ship accidents is the largest environmental pollution risk in our marine area.
2.3.9 Selective extraction of species The summary has been compiled based on the overview prepared by A. Albert and H. Ojaveer included in the “Initial Assessment of Environmental Status of the Estonian marine area” (2012). The catch volumes are described in chapter 2.3.1. Commercial fishing in the Estonian waters takes the form of either deep-sea fishing or coastal fishing. The sprat and the Baltic herring that are caught by trawls are the target species on the open sea. The main co-catch species is the European smelt, sometimes also the salmon and the sea trout. Other co-catch species are the sticklebacks, the eelpout and the scorpion fish. In the coastal sea, the main gear used is entangling nets and traps that are classified as passive gear. The largest numbers of the Baltic herring are fished during coastal fishing activities. In the Gulf of Finland, flounders, perches, whitefishs, European smelts, sea trouts and garfish are caught in addition to the Baltic herring. The cod (0.1 t in 2007; 2.1 t in 2010; 3.3 t in 2014) and a non-native species Atlantic gobies (0.1 t in 2007; 1.1 t in 2010; 11.2 t in 2014) catches have increased in the region (Maaeluministeerium, 2015). The most caught fish species in the Gulf of Riga are the Baltic herring, the perch, the garfish, the roach, the flounder, the goldfish, the vimba bream, the pike, the whitefish, the European smelt and the European eel. On the western coast of Saaremaa and Hiiumaa, the flounder is the most caught species. The Baltic herring, the roach, the perch, the sea trout, the ide, the whitefish and the pike are also harvested. In this region, the cod is also caught in small amounts. The most caught fish in Väinameri is the Baltic herring, followed by the garfish, the perch, the goldfish, the roach, the flounder, the pike etc. The largest catches of recreational fishing are caught by entangling nets, but the catches are much smaller compared to commercial fishing. Longlines, hooks and spinning are also used for fishing. The most caught species by recreational fishing are the flounder and the perch. The salmon, the sea trout, the whitefish and the round goby official recreational catches are comparable to commercial fishing. When passive gear (entangling nets, traps) is used, co-catch includes both undersized target and non-target species or individuals that have just reached maturity. Seals and birds, especially diving ducks, entangle in fishing nets. Most vulnerable are birds during their migration and wintering period when they gather into flocks in intensive fishing areas. Based on data collected

73 Strategic Environmental Assessment of the National Development Plan “Estonian Marine Policy
2012−2020” Draft Report, 2015
in 2005–2008 by fishermen, about 5,000 birds died in the Gulf of Finland annually, of which 78% are long-tailed ducks (Žydelis et al., 2009). The largest number of seals die in traps in areas with high fishing pressure (Vetemaa & Piirsalu, 2011). Of marine mammals, harbour porpoises may be in Estonian waters, although according to the existing data, no harbour porpoises were caught in fishing gear in 2004–2010 (Sirp & Klaas, 2011).
For many fish species, the fishing mortality rate is very high. Birds and marine mammals also die due to fishing activities. Selective catching of species is an important pressure on the marine environment.
2.3.10 Introduction of non-indigenous species Non-indigenous species are species that have spread to habitats with the help of people whereto due to natural obstacles they cannot spread themselves and that are able to live and reproduce in the new environment. Non-indigenous species can invade a sea by many different ways, such as floating vessels, aquaculture, fishing, recreation, waterways and aquarium and live fish trade. Introduction of non-indigenous species into the ocean and especially into the coastal sea may cause serious impacts on the environment, economy and human health (e.g. cholera bacteria). In 2012, 118 non-indigenous species were found in the Baltic Sea, of which 90 is estimated to have been introduced to the marine ecosystem. The number of non-indigenous species in the southern coast of the Gulf of Finland, in the Estonian coastal sea, was 26, and 14–17 in the western coastal sea (Figure 2.15) (Ojaveer et al., 2011; Rolke et al., 2013).
Figure 2.26. The total number of non-indigenous species in the coastal and offshore Baltic Sea in 2012. (Rolke et al., 2013). In the Baltic Sea, shipping poses the greatest invasion risk. The ballast water of ships plays the primary role in introducing non-indigenous species. Invasive species may spread also by
74 Strategic Environmental Assessment of the National Development Plan “Estonian Marine Policy
2012−2020” Draft Report, 2015
attaching themselves to ship hulls. In recent decades, waterborne traffic on the Baltic Sea has intensified, therefore the invasion risk of non-indigenous species has grown. An important role in the introduction of non-indigenous species are cargo vessels, which percentage in marine transport is about 50% according to HELCOM (2010) report. The largest primary invasion risk area in Estonia is the Tallinn region (primarily Muuga Bay) where is one of the largest Baltic Sea ports. Another important invasion route goes along waterways. In the Baltic Sea context notice worthy are the waterways that link different river systems (TÜ Eesti Mereinstituut, 2012). The impact spectrum of non-indigenous species is wide. They may influence nature at the level of gene, species, community, biotope and ecosystem. Non-indigenous species may through habitat and food competition change reproduction and growth speed of local species, their range and location and abundance in populations. They may also cause changes in the biodiversity of benthos, thereby influence also food webs and change the condition of habitats causing their siltation, accumulation of bottom sediments, overgrowing etc. Non-indigenous species may also be parasites and infectious agents (Ojaveer et al., 2011). Shipping is the most important entryway for non-indigenous species through ship ballast water and by attaching to ship hulls in the Baltic Sea.
2.3.11 Intentional or systematic release of solid substances into the marine environment
H. Ojaveer has made an overview of systematic introduction of solid substances into the environment in the report prepared about the Estonian marine areas status in 2012 (TÜ Eesti Mereinstituut, 2012). The overview is referenced below. When discussing the topic of systematic introduction of solid substances into the environment, three different human activities must be taken into account. Although disposal into the sea of garbage from ships is not permitted, food wastes may be discharged into the sea within 12 nautical miles from the nearest land. This has been specified in the International Convention for the Prevention of Pollution by Ships MARPOL 73/78. The convention was adopted in 1973 and supplemented with a protocol in 1978. Estonia joined MARPOL 73/78 Convention in 1992 and its Annexes I−V in 2007. There is no published data about the specific nature and volumes of the relevant garbage regarding Estonia and the Baltic Sea. Another important topic because of its scope and influence is related to port facilities and energy carriers. The development of port facilities on the coast includes dredging and widening of the channel but also activities that are related to the construction and extension of quays. We have described these activities in the physical damage section (2.2.1). Recently, installation of different energy carriers (cables, pipes) and/or energy generators (wind turbines) in the sea has intensified which means that during the construction works the bottom sediments may be relocated and the base of the energy carriers may be filled up with suitable construction material. Depending on the energy carrier, such operations may be performed in the coastal sea as well as deeper high seas. Windfarms are planned to be erected in the coastal sea of north-western Estonia. To install wind generators in the sea, a basement must be
75 Strategic Environmental Assessment of the National Development Plan “Estonian Marine Policy
2012−2020” Draft Report, 2015
constructed first. Generally, there are three basement types: concrete gravity foundation, steal pile foundation and steal tripod. Construction of concrete gravity foundation (area 175 m2 and mass 1,000 tons) requires extensive construction works that entail elimination of mud and flattening of sea bottom. In any case, an electric cable has to be installed onto the sea bottom regardless of the foundation type. During these operations, sea sediments are relocated (Hendrikson & Ko OÜ, 2011). This all means a significant impact on the region and possibly major relocation of sea sediments and using of concrete to build the foundation (Järvik, 2011). When using gravity foundation, the foundation is placed onto the sea bottom and the direct impact on the habitat is caused by sealing off the area which size is equal to the cross-sectional area of the foundation. In this case the sea bottom is not physically damaged (OÜ Alkranel et
al., 2015). No known data has been published on the amount and nature of food wastes. A potential significant impact on the character of sea bottom may be caused by erecting wind generators. 2.3.12 Status of the natural environment To describe the status of the marine environment, we use qualitative descriptors to determine good environmental status (Annex I of the Marine Strategy Framework Directive):
1. Biological diversity is maintained. The quality and occurrence of habitats and the distribution and abundance of species are in line with prevailing physiographic, geographic and climatic conditions.
2. Non-indigenous species introduced by human activities are at levels that do not adversely alter the ecosystems.
3. Populations of all commercially exploited fish and shellfish are within safe biological limits, exhibiting a population age and size distribution that is indicative of a healthy stock.
4. All elements of the marine food webs, to the extent that they are known, occur at normal abundance and diversity and levels capable of ensuring the long-term abundance of the species and the retention of their full reproductive capacity.
5. Human-induced eutrophication is minimised, especially adverse effects thereof, such as losses in biodiversity, ecosystem degradation, harmful algae blooms and oxygen deficiency in bottom waters.
6. Sea-floor integrity is at a level that ensures that the structure and functions of the ecosystems are safeguarded and benthic ecosystems, in particular, are not adversely affected.
7. Permanent alteration of hydrographical conditions does not adversely affect marine ecosystems.
8. Concentrations contaminants are at levels not giving rise to pollution effects. 9. Contaminants in fish and other seafood for human consumption do not exceed levels
established by Community legislation or other relevant standards. 10. Properties and quantities of marine litter do not cause harm to the coastal and marine
environment. 11. Introduction of energy, including underwater noise, is at levels that do not adversely
affect the marine environment. Each descriptor has a set of indicators that show whether GES has been achieved according to the relevant indicator. Indicators of good environmental status by descriptors are presented in
76 Strategic Environmental Assessment of the National Development Plan “Estonian Marine Policy
2012−2020” Draft Report, 2015
the work “The set of Estonian marine area good environmental status indicators and environmental targets” (TÜ Eesti Mereinstituut, 2012b). In Estonia, the marine monitoring programme was prepared in 2014, during which suggestions were made for updating good environmental status indicators and environmental targets established in 2012. For the first descriptor, good environmental status has been achieved according to 20 indicators and eight indicators need improving. Good environmental status has not been achieved for the following indicators:
• The ringed seal range; • The ringed seal distribution type; • Predatory fish abundance index in monitoring catches.
According to one indicator (percentage of non-indigenous species in the community of large demersal invertebrates) of the second descriptor, GES has been achieved. GES has not been achieved for the following indicators:
• Abundance of pelagic non-indigenous invertebrates; • Biomass of non-indigenous large demersal invertebrate species; • Percentage of non-indigenous species in the biomass of zooplankton community; • Level of biocontamination.
According to one indicator (the length of perch (Perca fluviatilis) upon reaching maturity) of the third descriptor, GES has been achieved. GES has not been achieved according to the following indicators:
• The Baltic herring (Clupea harengus membras) fishing mortality rate; • The sprat (Sprattus sprattus balticus) fishing mortality rate; • Yield index of non-indigenous species in monitoring net catches; • Smolt (Salmo salar) abundance compared to the maximum natural potential
abundance; • Abundance index of mature perch (Perca fluviatilis) in monitoring catches; • Abundance index of large perch (Perca fluviatilis; TL > 250 mm) in monitoring
catches; • The perch (Perca fluviatilis) sizes 95% percentile in monitoring catches.
According to two indicators (average maximum length of all fish species in monitoring catches and trophicity index of fish communities) of the fourth descriptor, GES has been achieved and one indicator requires improving. GES has not been achieved for the following indicators:
• Abundance of smolt (Salmo salar) compared to maximum potential natural abundance;
• Abundance index of large perch (Perca fluviatilis; TL>250 mm) in monitoring catches;
• Ratio of maxillopodans biomass to the biomass of all mesozooplankton; • Abundance index of predatory fish in monitoring catches.
According to four indicators of the fifth descriptor, GES has been achieved and two indicators require improving. GES has not been achieved according to the following indicators:
• Total nitrogen concentration in seawater in summer;

77 Strategic Environmental Assessment of the National Development Plan “Estonian Marine Policy
2012−2020” Draft Report, 2015
• Total phosphorous concentration in seawater in summer; • Content of chlorophyll a in seawater in summer; • Phytoplankton biomass in summer; • Transparency of seawater in summer according to the Secchi disk.
According to four indicators of the sixth descriptor, GES has been achieved and four indicators require improving. GES has been achieved according to most indicators of the eight and ninth descriptors. Figure 2.16 gives a summary of achieving GES by GES descriptors and indicators of the MSFD in the Estonian marine area. The results of the inventory of the indicators show clearly that there is a need to develop the monitoring efforts and work out indicators for descriptor 7 (Effect of permanent alteration of hydrographical conditions), 10 (Marine litter) and 11 (Energy and noise). The expert group was unable to present immediately usable indicators for these descriptors. Assessments were not given due to insufficient data as well as lack of indicators that could be used for the Estonian marine area.
Figure 2.27. Achieving of GES by MSFD descriptors and indicators in the Estonian marine area. The indicator codes match the codes used in the indicator document sheets included in the annex of the report (TÜ Eesti Mereinstituut, 2012b). Good environmental status of the natural environment of the Estonian marine areas has been achieved only by few descriptors. For five descriptors, at least three indicators show that good environmental status has not been achieved. For three descriptors, there does not exist any indicators applicable for the Estonian marine areas.
GES has been achieved for this indicator
GES has not been achieved for this indicator
An indicator exists but needs amending
No indicator in Estonia

3. OBJECTIVE, METHOD AND SCOPE OF THE STRATEGIC ENVIROMENTAL ASSESSMENT
According to the Environmental Impact Assessment and Environmental Management System Act § 2 (2), the purpose of strategic environmental assessment is to: 1) contribute to the integration of environmental considerations into the preparation and adoption of strategic planning documents; 2) provide for a high level of protection of the environment; 3) promote sustainable development. Assessment of impacts of strategic choices that are the basis of the strategic environmental assessment give relevant information on what will happen after the decision has been made to the authority that has to adopt the strategic development document prior to making the decision. The purpose of an impact assessment is to give the author of the strategic development document information about the environmental impact that will occur when the measures are implemented. The national development plan “Estonian Marine Policy 2012–2020” has been approved by the Government of the Republic Order No. 342 of 2 August 2012. According to section 3 of the national development plan “Estonian Marine Policy 2012−2020”, implementation plans are prepared to fulfil the development plan. The current implementation plan is prepared for 2014−2016. Hence, preparing of an implementation plan for the new period will begin in near future. Furthermore, in section 3 of the development plan it is stated: “In 2015, the need to amend the development plan will be reviewed and, if necessary, the plan shall be updated by the end of 2016”. One of the objectives of this SEA is to analyse the actions planned in the development plan “Estonian Marine Policy 2012−2020” and its implementation plan and, if necessary, make suggestions for a new implementation plan to be prepared. The strategic environmental assessment is conducted in compliance with the Environmental Impact Assessment and Environmental Management System Act (under the version that was in effect until 30 June 2015) and current relevant guidance materials. The SEA is based on the principle that significant impacts, both negative and positive, that are likely to occur due to the implementation of the strategic development document are assessed. An environmental impact is materially negative if it may presumably exceed the environmental capacity of the place of business, cause irreversible changes in the environment or risk human health and well-being, cultural heritage or property. An environmental impact is materially positive if it will decrease the presumed significant load on the environment (e.g. reduces environmental pollution or exploitation of resources) or measures are ensured that help maintain or improve the status of natural areas, improve human health and well-being and maintain cultural heritage or property. Two main methods are used when preparing the SEA: compliance analysis and external impacts analysis. Compliance analysis is an assessment of objectives and measures of the development plan to determine whether the development plan is in agreement with the relevant objectives set down by other relevant strategic documents (compliance of the objectives of the development plan with the objectives set in the European Union policy as well as compatibility of the development plan with other relevant national strategic documents in Estonia). External impacts analysis is an approach during which the planned activities are compared against a set of external impacts. During the external effects analysis, it is analysed which areas

79 Strategic Environmental Assessment of the National Development Plan “Estonian Marine Policy 2012−2020”
Draft Report, 2015.
of the natural, economic and social environment and to what extent are influenced by the measures/activities planned for the achievement of the objectives and, if necessary, proposals are made for improving the implementation plan of the development plan concerning environmental aspects. Also, if necessary, alternative options are proposed or additional measures to mitigate negative impacts and proposals to amplify positive impacts are made. The assessments given during the SEA process are generally short term and long term. During the external impacts analysis, the impacts are primarily assessed qualitatively (descriptively) in various nature and socio-economic environments. Based on the SEA programme (Annex 1), the presumed impacts associated with the implementation of the development plan “Estonian Marine Policy 2012−2020” are assessed in the following sections:
1. On the natural environment (including water environment, atmosphere, seafloor and coasts):
o Impact on marine biota and habitats (including impact on the protected nature objects and protection objectives of Natura 2000 areas and the integrity of the areas);
o Impact on seawater quality and physical indicators of the marine environment (including underwater noise);
o Impact on air quality and climate change; o Impact on the sustainable use of natural resources and resources.
2. On the socio-economic environment:
o Impact on human well-being and health (including outdoor noise); o Impact on marine business environment (including fisheries, aquaculture,
tourism etc.); o Impact on marine transport and ports (including navigation safety and security); o Impact on marine cultural heritage.
As SEA is conducted based on the principle of the strategic development document level of precision, impacts will also be assessed on a more general level than in case of a detailed plan or activity permit; however, no additional studies will be conducted during the SEA process. When giving assessments, the existing monitoring, statistics and research data are used. The scope of the impacted area addressed during the SEA process is different depending on the respective field. Generally, the area of impact stretches from the coast to the border of Estonia`s economic zone, except for cross-border impact and inland waterways.

80 Strategic Environmental Assessment of the National Development Plan “Estonian Marine Policy 2012−2020”
Draft Report, 2015.
4. COMPLIANCE ANALYSIS OR RELATIONS OF THE DEVELOPMENT PLAN WITH OTHER STRATEGIC DOCUMENTS
In this section, the most important documents related to the development plan have been described and a compliance analysis has been conducted to determine whether the development plan is in compliance with the objectives set in these documents. As the National programme
for 2004–2014 for the reduction of phenol emissions input to water has expired by now, this document has not been discussed in this section (it was mentioned in the SEA programme).
4.1 Regional and European Union documents HELCOM Baltic Sea Action Plan to 2021 The Baltic Sea Action Plan to 2021 was approved at the meeting of HELCOM ministers on 15 November 2007. The vision of HELCOM is to ensure a healthy Baltic Sea environment, with diverse biological components functioning in balance, resulting in good environmental/ecological status and supporting a wide range of sustainable human economic and social activities. The Action Plan includes six goals (Table 4.1). In order to implement the Baltic Sea Action Plan, an implementation plan for 2012–2015 has been prepared in Estonia. Table 4.1. Interlinkage of the development plan of the Marine Policy with the goals of HELCOM Baltic Sea Action Plan
Objectives Interlinkage with the new objectives of the Marine Policy development plan
1. Baltic Sea unaffected by eutrophication
• Objective 6 – The state of the marine environment has improved.
Implementation of the Marine Strategy`s programme of measures in the framework of measure 6.1 – Improving the capability of the
public sector to plan protection of the marine environment,
prevent environmental pollution and alleviate their consequences helps to achieve the objective.
• Objective 9 – The quantity and quality of Estonian marine research have increased.
Implementation of measure 9.1 – Supporting marine-related
research work helps to achieve the objective. 2. Baltic Sea undisturbed by hazardous substances
• Objective 6 – The state of the marine environment has improved.
Implementation of the Marine Strategy`s programme of measures in the framework of measure 6.1 – Improving the capability of the
public sector to plan protection of the marine environment,
prevent environmental pollution and alleviate their consequences helps to achieve the objective.
• Objective 9 – The quantity and quality of Estonian marine research have increased.
Implementation of measure 9.1 – Supporting marine-related
research work helps to achieve the objective. 3. Favourable status of Baltic Sea biodiversity
• Objective 6 – The state of the marine environment has improved.
Implementation of the Marine Strategy`s programme of measures in the framework of measure 6.1 – Improving the capability of the
public sector to plan protection of the marine environment,
prevent environmental pollution and alleviate their consequences helps achieve the objective.
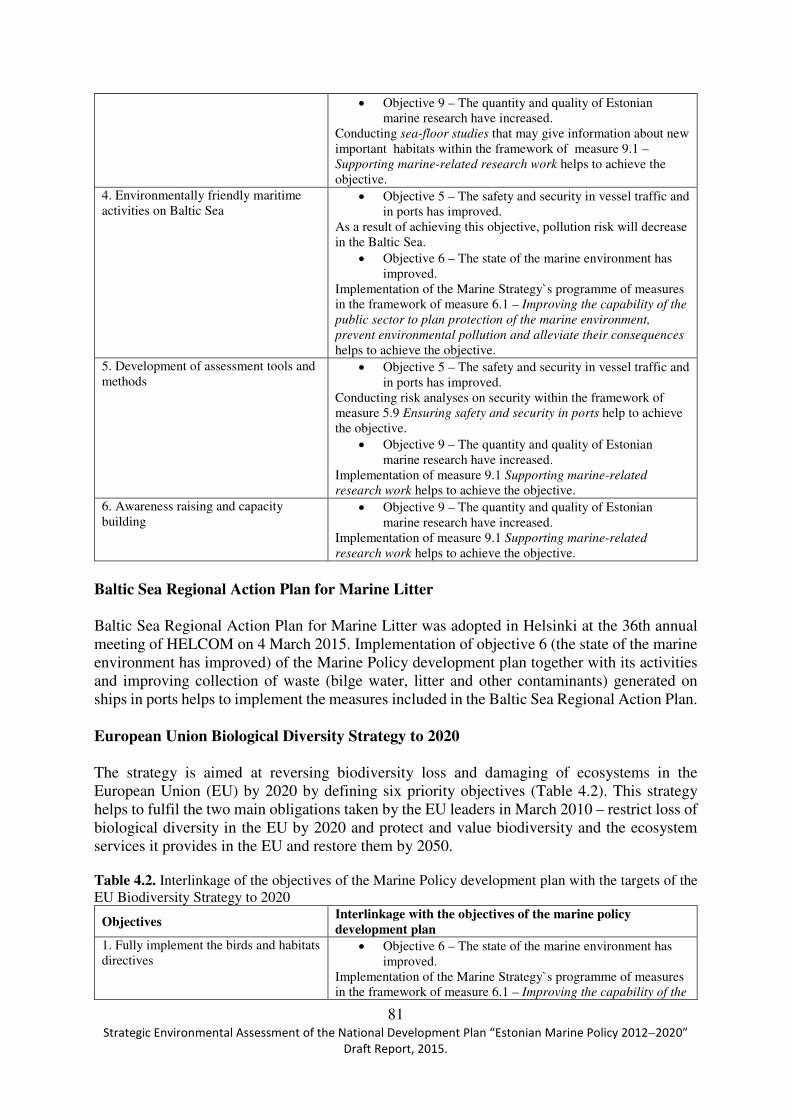
81 Strategic Environmental Assessment of the National Development Plan “Estonian Marine Policy 2012−2020”
Draft Report, 2015.
• Objective 9 – The quantity and quality of Estonian marine research have increased.
Conducting sea-floor studies that may give information about new important habitats within the framework of measure 9.1 – Supporting marine-related research work helps to achieve the objective.
4. Environmentally friendly maritime activities on Baltic Sea
• Objective 5 – The safety and security in vessel traffic and in ports has improved.
As a result of achieving this objective, pollution risk will decrease in the Baltic Sea.
• Objective 6 – The state of the marine environment has improved.
Implementation of the Marine Strategy`s programme of measures in the framework of measure 6.1 – Improving the capability of the
public sector to plan protection of the marine environment,
prevent environmental pollution and alleviate their consequences helps to achieve the objective.
5. Development of assessment tools and methods
• Objective 5 – The safety and security in vessel traffic and in ports has improved.
Conducting risk analyses on security within the framework of measure 5.9 Ensuring safety and security in ports help to achieve the objective.
• Objective 9 – The quantity and quality of Estonian marine research have increased.
Implementation of measure 9.1 Supporting marine-related
research work helps to achieve the objective. 6. Awareness raising and capacity building
• Objective 9 – The quantity and quality of Estonian marine research have increased.
Implementation of measure 9.1 Supporting marine-related
research work helps to achieve the objective.
Baltic Sea Regional Action Plan for Marine Litter Baltic Sea Regional Action Plan for Marine Litter was adopted in Helsinki at the 36th annual meeting of HELCOM on 4 March 2015. Implementation of objective 6 (the state of the marine environment has improved) of the Marine Policy development plan together with its activities and improving collection of waste (bilge water, litter and other contaminants) generated on ships in ports helps to implement the measures included in the Baltic Sea Regional Action Plan. European Union Biological Diversity Strategy to 2020 The strategy is aimed at reversing biodiversity loss and damaging of ecosystems in the European Union (EU) by 2020 by defining six priority objectives (Table 4.2). This strategy helps to fulfil the two main obligations taken by the EU leaders in March 2010 – restrict loss of biological diversity in the EU by 2020 and protect and value biodiversity and the ecosystem services it provides in the EU and restore them by 2050. Table 4.2. Interlinkage of the objectives of the Marine Policy development plan with the targets of the EU Biodiversity Strategy to 2020
Objectives Interlinkage with the objectives of the marine policy development plan
1. Fully implement the birds and habitats directives
• Objective 6 – The state of the marine environment has improved.
Implementation of the Marine Strategy`s programme of measures in the framework of measure 6.1 – Improving the capability of the

82 Strategic Environmental Assessment of the National Development Plan “Estonian Marine Policy 2012−2020”
Draft Report, 2015.
Objectives Interlinkage with the objectives of the marine policy development plan public sector to plan protection of the marine environment,
prevent environmental pollution and alleviate their consequences helps to achieve the objective.
2. Maintain and restore ecosystems and their services
• Objective 6 – The state of the marine environment has improved.
Implementation of the Marine Strategy`s programme of measures in the framework of measure 6.1 – Improving the capability of the
public sector to plan protection of the marine environment,
prevent environmental pollution and alleviate their consequences helps to achieve the objective.
• Objective 5 – The safety and security in vessel traffic and in ports have improved
Measure 5.1. Performing hydrographic surveys; measure 5.3. Collecting, processing and forwarding of navigational
information; measure 5.4. Development of navigational marks; measure 5.5. Improving the Vessel Traffic Service (VTS); measure 5.6 Improving the technical supervision and classification of ships and measure 5.9 Ensuring safety and security in ports help to achieve the objective.
• Objective 9 – The quantity and quality of Estonian marine research have increased.
Implementation of measure 9.1 Supporting marine-related
research work helps to achieve the objective. 3. Increase the contribution of agriculture and forestry to maintaining and enhancing biodiversity
The objectives of the development plan have no direct link to the European Union Biological Diversity Strategy.
4. Ensure the sustainable use of fisheries resources
• Objective 6 – The state of the marine environment has improved.
Implementation of the Marine Strategy`s programme of measures in the framework of measure 6.1 – Improving the capability of the
public sector to plan protection of the marine environment,
prevent environmental pollution and alleviate their consequences helps to achieve the objective.
• Objective 9 – The quantity and quality of Estonian marine research have increased.
Implementation of measure 9.1 Supporting marine-related
research work helps to achieve the objective. 5. Combat invasive alien species • Objective 6 – The state of the marine environment has
improved. Implementation of the Marine Strategy`s programme of measures in the framework of measure 6.1 – Improving the capability of the
public sector to plan protection of the marine environment,
prevent environmental pollution and alleviate their consequences helps to achieve the objective.
6. Help avert global biodiversity loss • Objective 6 – The state of the marine environment has improved.
Implementation of the Marine Strategy`s programme of measures in the framework of measure 6.1 – Improving the capability of the
public sector to plan protection of the marine environment,
prevent environmental pollution and alleviate their consequences helps to achieve the objective.
• Objective 5 – The safety and security in vessel traffic and in ports has improved.
Measure 5.1. Performing hydrographic surveys; measure 5.3. Collecting, processing and forwarding navigational information; measure 5.4. Development of navigational marks; measure 5.5.
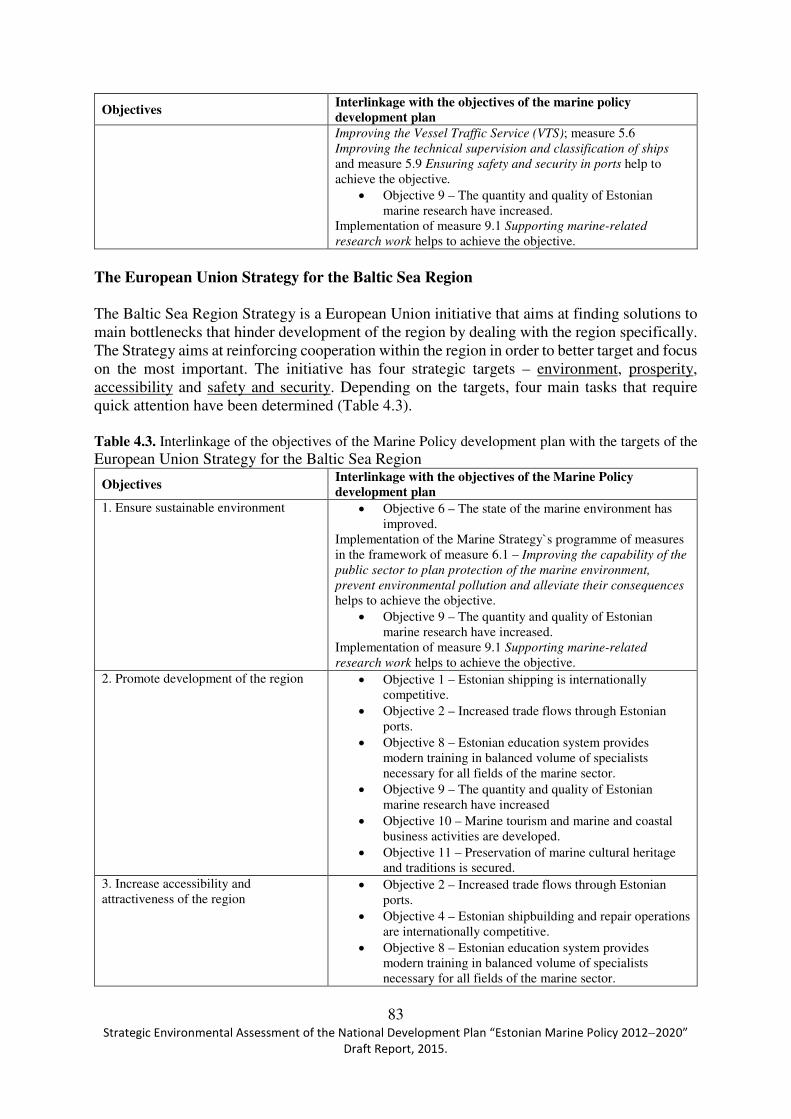
83 Strategic Environmental Assessment of the National Development Plan “Estonian Marine Policy 2012−2020”
Draft Report, 2015.
Objectives Interlinkage with the objectives of the marine policy development plan Improving the Vessel Traffic Service (VTS); measure 5.6 Improving the technical supervision and classification of ships and measure 5.9 Ensuring safety and security in ports help to achieve the objective.
• Objective 9 – The quantity and quality of Estonian marine research have increased.
Implementation of measure 9.1 Supporting marine-related
research work helps to achieve the objective.
The European Union Strategy for the Baltic Sea Region The Baltic Sea Region Strategy is a European Union initiative that aims at finding solutions to main bottlenecks that hinder development of the region by dealing with the region specifically. The Strategy aims at reinforcing cooperation within the region in order to better target and focus on the most important. The initiative has four strategic targets – environment, prosperity, accessibility and safety and security. Depending on the targets, four main tasks that require quick attention have been determined (Table 4.3). Table 4.3. Interlinkage of the objectives of the Marine Policy development plan with the targets of the European Union Strategy for the Baltic Sea Region
Objectives Interlinkage with the objectives of the Marine Policy development plan
1. Ensure sustainable environment • Objective 6 – The state of the marine environment has improved.
Implementation of the Marine Strategy`s programme of measures in the framework of measure 6.1 – Improving the capability of the
public sector to plan protection of the marine environment,
prevent environmental pollution and alleviate their consequences helps to achieve the objective.
• Objective 9 – The quantity and quality of Estonian marine research have increased.
Implementation of measure 9.1 Supporting marine-related
research work helps to achieve the objective. 2. Promote development of the region • Objective 1 – Estonian shipping is internationally
competitive. • Objective 2 – Increased trade flows through Estonian
ports. • Objective 8 – Estonian education system provides
modern training in balanced volume of specialists necessary for all fields of the marine sector.
• Objective 9 – The quantity and quality of Estonian marine research have increased
• Objective 10 – Marine tourism and marine and coastal business activities are developed.
• Objective 11 – Preservation of marine cultural heritage and traditions is secured.
3. Increase accessibility and attractiveness of the region
• Objective 2 – Increased trade flows through Estonian ports.
• Objective 4 – Estonian shipbuilding and repair operations are internationally competitive.
• Objective 8 – Estonian education system provides modern training in balanced volume of specialists necessary for all fields of the marine sector.

84 Strategic Environmental Assessment of the National Development Plan “Estonian Marine Policy 2012−2020”
Draft Report, 2015.
Objectives Interlinkage with the objectives of the Marine Policy development plan
• Objective 9 – The quantity and quality of Estonian marine research have increased.
• Objective 10 – Marine tourism and marine and coastal business activities are developed.
• Objective 11 – Preservation of marine cultural heritage and traditions is secured.
4. Ensure safety and security of the region
• Objective 5 – The safety and security in vessel traffic and in ports has improved.
The objectives of the Marine Policy development plan are not in conflict with the objectives set in regional and European Union documents.
4.2 National documents of Estonia National Spatial Plan “Estonia 2030+” The National Spatial Plan “Estonia 2030+” is a strategic document aiming at achieving the expedient utilisation of space on the scale of Estonia as a whole. The National Spatial Plan is being prepared for the entire territory of the nation. The plan specifies as the main development objective ensuring that any settled location in Estonia is habitable. This requires a high-quality living environment, good, convenient mobility facilities and the supply of essential networks. The plan was adopted on 30 August 2012. The plan sets as objectives for 2030:
• Estonia is a nation with a cohesive spatial structure, a diverse living environment and has good links to the external world.
• Compact, high-quality centres (cities and towns) with urban space provide the residents in their daily activity space with services at good levels, job creating high added value and competitive education.
• Rural areas provide people with privacy of residence, the ability to cope regardless of external circumstances and a natural living environment.
• Low-density space functions when good mobility facilities are provided. • Estonia`s good links, in all directions, with the external world by air, across water and
overland improve the position of Estonia`s cities and towns in the international division of labour.
• A sustainable regional public transport system employing flexible and smart solutions for sparsely populated areas, providing a smooth flow of life in the areas of its impact and enables people to commute easily and conveniently between their places of residence and work and service and educational institutions.
• The availability of high-quality energy at acceptable prices ensures the development of entrepreneurship and facilities for living everywhere in Estonia.
• Estonia is open to the sea. The objectives of the Marine Policy development plan support directly and indirectly the objectives of the National Spatial Plan “Eesti 2030+”, i.e. Estonia is open to the sea, Estonia`s good links to the external world by air, sea and land improve the position of Estonian cities in

85 Strategic Environmental Assessment of the National Development Plan “Estonian Marine Policy 2012−2020”
Draft Report, 2015.
international labour distribution and rural areas offer privacy of residence and possibilities to cope independent of external situation and natural living environment. Estonian Environmental Strategy to 2030 The Estonian Environmental Strategy to 2030 is a strategy for developing the sphere of the environment which builds upon the principles of the National Strategy on Sustainable Development “Sustainable Estonia 21” and serves as the basis for the preparation and revision of all sector-specific development plans within the sphere of the environment that must follow the principles presented in the environmental strategy when preparing or amending these plans. The strategy was approved by the Riigikogu with its decision of 14 February 2007. 1. Sustainable use of natural resources and reduction of waste generation:
• Waste – By 2030, waste disposed to landfills will have decreased 30% and the harmfulness of waste generated will have been reduced significantly.
• Water – To achieve good condition of surface water (including coastal water) and groundwater, and to maintain the bodies of water whose conditions is good or very good.
• Mineral resources – Environmentally sustainable extraction of mineral resources which is sustainable in terms of water, landscapes and air, and efficient exploitation of mineral resources with minimum losses and waste.
• Forest – Balanced satisfaction of ecological, social, cultural and economic needs in the course of utilisation of forests in a very long perspective.
• Fish – To ensure good condition of fish populations, diversity of fish species and avoid the indirect negative impact of fishing on the ecosystem.
• Game – To ensure the diversity of the species of game and other game and the violability of populations.
• Soil and use of land – 1. Environmentally sustainable utilisation of soil; 2. Functionality and sustainable utilisation of natural and cultivated landscapes.
2. Preservation of the diversity of landscapes and biodiversity:
• Landscapes – Preservation of multifunctional and coherent landscapes. • Biodiversity – To ensure the existence of habitats and biotic communities necessary for
the preservation of viable populations of species. 3. Climate change mitigation and quality of ambient air:
• Energy – To produce energy in an amount that meets the consumption needs in Estonia and to develop diverse and sustainable production technologies based on different sources of energy, which do not impose a significant burden on the environment and which enable electricity to be produced for export.
• Energy consumption – To slow down and stabilise the consumption of energy, while ensuring that the needs of people are met, i.e. to ensure the preservation of the volume of primary energy while consumption grows.
• Protection of the ozone layer – Phase-out of artificial substances used in industry and households, which deplete the ozone layer.
• Transport – To develop an efficient, environmentally sustainable and comfortable public transport system, ensure safe soft traffic (render alternatives of using motor vehicles more comfortable) and develop a settlement and production structure that
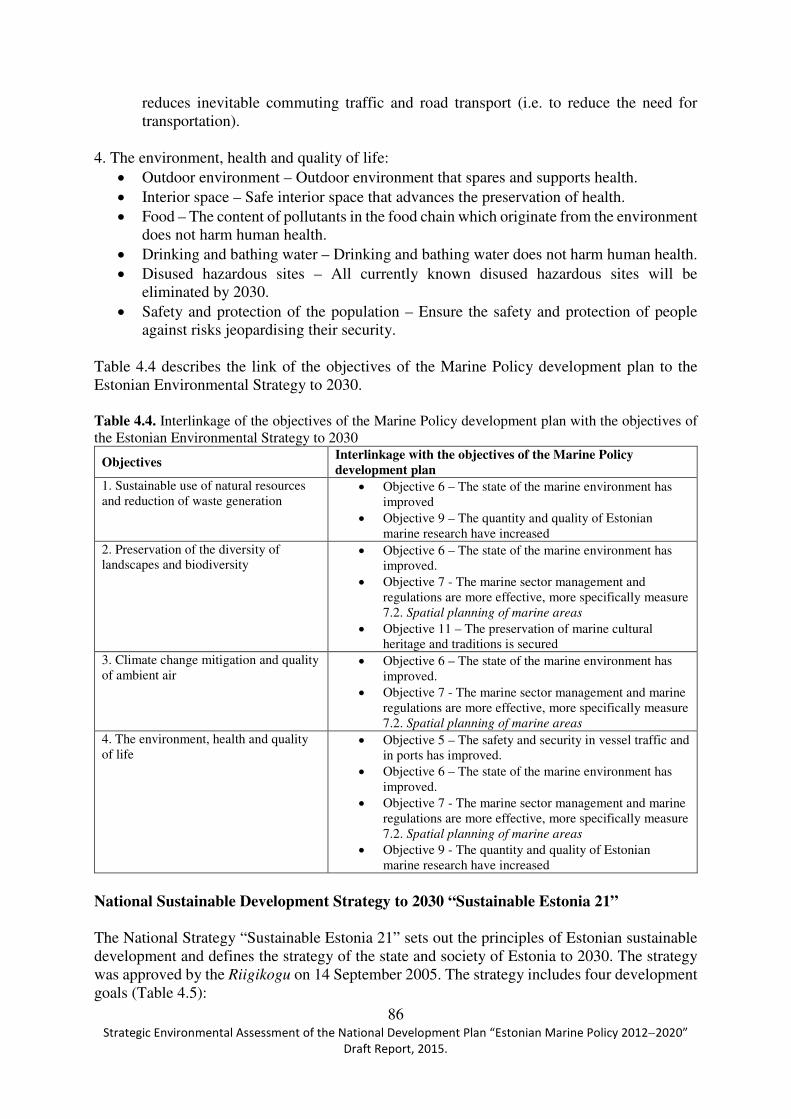
86 Strategic Environmental Assessment of the National Development Plan “Estonian Marine Policy 2012−2020”
Draft Report, 2015.
reduces inevitable commuting traffic and road transport (i.e. to reduce the need for transportation).
4. The environment, health and quality of life:
• Outdoor environment – Outdoor environment that spares and supports health. • Interior space – Safe interior space that advances the preservation of health. • Food – The content of pollutants in the food chain which originate from the environment
does not harm human health. • Drinking and bathing water – Drinking and bathing water does not harm human health. • Disused hazardous sites – All currently known disused hazardous sites will be
eliminated by 2030. • Safety and protection of the population – Ensure the safety and protection of people
against risks jeopardising their security. Table 4.4 describes the link of the objectives of the Marine Policy development plan to the Estonian Environmental Strategy to 2030. Table 4.4. Interlinkage of the objectives of the Marine Policy development plan with the objectives of the Estonian Environmental Strategy to 2030
Objectives Interlinkage with the objectives of the Marine Policy development plan
1. Sustainable use of natural resources and reduction of waste generation
• Objective 6 – The state of the marine environment has improved
• Objective 9 – The quantity and quality of Estonian marine research have increased
2. Preservation of the diversity of landscapes and biodiversity
• Objective 6 – The state of the marine environment has improved.
• Objective 7 - The marine sector management and regulations are more effective, more specifically measure 7.2. Spatial planning of marine areas
• Objective 11 – The preservation of marine cultural heritage and traditions is secured
3. Climate change mitigation and quality of ambient air
• Objective 6 – The state of the marine environment has improved.
• Objective 7 - The marine sector management and marine regulations are more effective, more specifically measure 7.2. Spatial planning of marine areas
4. The environment, health and quality of life
• Objective 5 – The safety and security in vessel traffic and in ports has improved.
• Objective 6 – The state of the marine environment has improved.
• Objective 7 - The marine sector management and marine regulations are more effective, more specifically measure 7.2. Spatial planning of marine areas
• Objective 9 - The quantity and quality of Estonian marine research have increased
National Sustainable Development Strategy to 2030 “Sustainable Estonia 21” The National Strategy “Sustainable Estonia 21” sets out the principles of Estonian sustainable development and defines the strategy of the state and society of Estonia to 2030. The strategy was approved by the Riigikogu on 14 September 2005. The strategy includes four development goals (Table 4.5):

87 Strategic Environmental Assessment of the National Development Plan “Estonian Marine Policy 2012−2020”
Draft Report, 2015.
• Viability of the Estonian cultural space; • Growth of welfare; • Coherent society; • Ecological balance that has three main components:
o Use of natural resources in ways and quantities that ensure ecological balance; o Reduction of pollution; o Preservation of biodiversity and natural areas.
Table 4.5. Interlinkage of the objectives of the Marine Policy development plan with the objectives of the National Sustainable Development Strategy to 2030 “Sustainable Estonia 21”
Objectives Interlinkage with the objectives of the Marine Policy development plan
Viability of the Estonian cultural space Objective 11 - The preservation of marine cultural heritage and traditions is secured
Growth of welfare Objective 1 - Estonian shipping is internationally competitive. Objective 2 - Increased trade flows through Estonian ports Objective 3 - Increased number of passengers on international shipping lines Objective 4 - Estonian shipbuilding and repair operations are internationally competitive. Objective 8 - Estonian education system provides modern training in balanced volume of specialists necessary for all fields of the marine sector. Objective 10 - Marine tourism and marine and coastal business activities are developed
Coherent society Objective 9 – The quantity and quality of Estonian marine research have increased Objective 11 - The preservation of marine cultural heritage and traditions is secured
Ecological balance Objective 5 - The safety and security in vessel traffic and in ports has improved Objective 6 – The state of the marine environment has improved. Objective 9 – The quantity and quality of Estonian marine research have increased.
Nature Conservation Development Plan until 2020 The Nature Conservation Development Plan is a strategic base document for the development of sectors related to the conservation and use of nature until 2020. The development plan has been approved by the Government of the Republic Order No. 332 of 26 July 2012. The strategic objectives of the development plan (interlinkage is described in Table 4.6):
1. People are familiar with, appreciate and conserve nature and know how to use their knowledge in their everyday life:
• Measure 1.1. Promoting nature education at all levels of education. • Measure 1.2. Effective dissemination of nature information. • Measure 1.3. Promoting and applying conservation science to achieve the objectives of
practical conservation management. • Measure 1.4. Management of sustainable nature tourism.

88 Strategic Environmental Assessment of the National Development Plan “Estonian Marine Policy 2012−2020”
Draft Report, 2015.
2. Conservation management to ensure the favourable conservation status of species and
habitats and the diversity of landscapes so that habitats function as a coherent ecological network:
• Measure 2.1. Ensuring the favourable conservation status of species. • Measure 2.2. Ensuring the favourable conservation status of habitats. • Measure 2.3. Ensuring landscape diversity. • Measure 2.4. Conservation management of natural objects. • Measure 2.5. Ensuring the availability of nature data and storing scientific collections. • Measure 2.6. International cooperation to conserve biodiversity. • Measure 2.7. Compensating for nature conservation restrictions and providing financial
support to conservation activities.
3. Long-term sustainability of natural resources, and the preconditions for this, are ensured and the principles of ecosystem approach are followed in the use of natural resources:
• Measure 3.1. Taking account of the value of ecosystem services in the use of the environment.
• Measure 3.2. Analysing the impacts of earth resources extraction causing the loss of biodiversity; developing and implementing mitigation measures.
• Measure 3.3. Analysing the impacts of renewable natural resources management causing the loss of biodiversity; developing and applying mitigation measures.
• Measure 3.4. Analysing and mitigating the negative impacts of transport. • Measure 3.5. Mitigating the negative impacts of climate change on biological diversity. • Measure 3.6. Ensuring biological safety. • Measure 3.7. Analysing the negative impacts of the use of renewable energy on
biodiversity; developing and applying mitigation measures. Table 4.6. Interlinkage of the objectives of the Marine Policy development plan with the objectives of the Nature Conservation Development Plan until 2020
Objectives Interlinkage with the objectives of the Marine Policy development plan
1. People are familiar with, appreciate and conserve nature and know how to use their knowledge in their daily lives
• Objective 6 – The state of the marine environment has improved.
Implementation of the Marine Strategy`s programme of measures in the framework of measure 6.1 – Improving the capability of the
public sector to plan protection of the marine environment,
prevent environmental pollution and alleviate their consequences helps to achieve the objective.
• Objective 9 – The quantity and quality of Estonian marine research have increased.
2. The favourable conservation status of species and habitats and diversity of landscapes in ensured and habitats are functioning as a coherent ecological network
• Objective 5 – The safety and security in vessel traffic and in ports have improved.
• Objective 6 – The state of the marine environment has improved.
Implementation of the Marine Strategy`s programme of measures in the framework of measure 6.1 – Improving the capability of the
public sector to plan protection of the marine environment,
prevent environmental pollution and alleviate their consequences helps to achieve the objective.
• Objective 7 - The marine sector management and marine regulations are more effective, more specifically measure 7.2. Spatial planning of marine areas

89 Strategic Environmental Assessment of the National Development Plan “Estonian Marine Policy 2012−2020”
Draft Report, 2015.
Objectives Interlinkage with the objectives of the Marine Policy development plan
• Objective 9 – The quantity and quality of Estonian marine research have increased.
• Objective 11 – The preservation of marine cultural heritage and traditions is secured.
3. Long-term sustainability of natural resources is ensured and the principles of the ecosystem approach are followed in the use of natural resources
• Objective 6 – The state of the marine environment has improved.
Implementation of the Marine Strategy`s programme of measures in the framework of measure 6.1 – Improving the capability of the
public sector to plan protection of the marine environment,
prevent environmental pollution and alleviate their consequences helps to achieve the objective. Activities Facilitating introduction
of environmentally sustainable fuels and technologies on ships
and Ensuring pollution control capacity in ports, developing and
implementing pollution control plans under measure 6.2 – Reducing the environmental load related to ships and ports also contribute to the fulfilment of the objective.
• Objective 7 - The marine sector management and marine regulations are more effective, more specifically measure 7.2. Spatial planning of marine areas.
• Objective 9 – The quantity and quality of Estonian marine research have increased.
Estonian Fisheries Strategy 2014–2020 Estonian Fisheries Strategy for 2014–2020 includes Estonia`s state of fish stock, coastal fishing, trawling, recreational fishing, distant water fishing, processing, marketing, as well as research and development activities. The main objective of the strategy is the sustainable development of Estonian fisheries industry as a branch of economy and increasing the competitiveness of the fish production in the domestic and foreign markets. The strategy was approved on 2 April 2013. The interlinkage with the objectives of the Marine Policy development plan with the objectives of the Estonian Fisheries Strategy for 2014–2020 is described in Table 4.7. Table 4.7. Interlinkage of the objectives of the Marine Policy development plan with the objectives of the Estonian Fisheries Strategy for 2014–2020
Objectives Interlinkage with the objectives of the marine policy development plan
1. Turn Estonia into an important logistics centre of Baltic herring and sprat intended for human consumption.
• Objective 1 – Estonian shipping is internationally competitive.
• Objective 2 – Increased trade flows through Estonian ports.
Implementation of measure 2.1 – Using the potential of marine
collaborative networks and 2.3 – Facilitating the development of
ports` infrastructure help to achieve the objective. 2. Popularise, develop and diversify recreational fishing and fishing tourism and branches of economy that offer services to it.
• Objective 10 – Marine tourism and marine and coastal business activities are developed.
3. Improve economic sustainability of coastal and inland waters fisheries.
• Objective 10 – Marine tourism and marine and coastal business activities are developed.
• Objective 11 – The preservation of marine cultural heritage and traditions is secured.
4. Ensuring opportunities to fish for Estonian companies and maintaining
• Objective 6 – The state of the marine environment has improved.

90 Strategic Environmental Assessment of the National Development Plan “Estonian Marine Policy 2012−2020”
Draft Report, 2015.
Objectives Interlinkage with the objectives of the marine policy development plan
balance between catching capacity and catching possibilities.
• Objective 9 – The quantity and quality of Estonian marine research have increased.
• Objective 10 – Marine tourism and marine and coastal business activities are developed.
• Objective 11 – The preservation of marine cultural heritage and traditions is secured.
5. Development of a favourable functional environment for fish processing, such as education, product development, utilisation of new environmentally sustainable technologies, innovation and marketing. Also increasing availability of fish and its consumption.
• Objective 8 – Estonian education system provides modern training in balanced volume of specialists necessary for all fields of the marine sector.
• Objective 9 – The quantity and quality of Estonian marine research have increased.
• Objective 10 – Marine tourism and marine and coastal business activities are developed.
6. Development of a favourable, sustainable and profitable operational environment for aquaculture.
• Objective 8 – Estonian education system provides modern training in balanced volume of specialists necessary for all fields of the marine sector.
• Objective 9 – The quantity and quality of Estonian marine research have increased.
• Objective 10 – Marine tourism and marine and coastal business activities are developed.
7. Achieving a balance between commercial and recreational fishing and optimal use of resources in the fisheries sector, improving efficiency of supervision and building fishing culture that adheres to requirements.
• Objective 7 – The marine sector management and marine regulations are more effective
• Objective 10 – Marine tourism and marine and coastal business activities are developed.
• Objective 11 – The preservation of marine cultural heritage and traditions is secured.
8. Development of cooperation between research, development and educational institutions and the sector that is measured by the monetary volume of development projects to the fisheries GDP.
• Objective 8 – Estonian education system provides modern training in balanced volume of specialists necessary for all fields of the marine sector.
• Objective 9 – The quantity and quality of Estonian marine research have increased.
National Waste Management Plan for 2014–2020 The National Waste Management Plan for 2014–2020 is a development document that includes the whole waste management sector and that describes the most important principles and measures of waste management development together with planned activities for the next seven years. The objective of the Waste Management Plan is to put in order and organise waste management systemically at all levels of the sector. The Waste Management Plan was approved on 13 June 2014. The plan has set strategic objectives (Table 4.8). The activity that is necessary for achieving every strategic goal has three measures. The waste management plan is implemented based on the implementation plan. 1. Prevent and reduce waste generation, including decreasing hazardousness of waste:
• Measure 1 – Promotion of prevention of waste generation and reduction of hazardousness of waste.
2. Recycling of waste or recover them for some other way at the maximum level

91 Strategic Environmental Assessment of the National Development Plan “Estonian Marine Policy 2012−2020”
Draft Report, 2015.
• Measure 2 – Promotion of waste collection and recovery and efficiency of waste reporting.
3. Reduction of waste originating environmental risk, by way of improving monitoring and supervision, among other efforts
• Measure 3 – Reduction of environmental risk originating from waste and improving efficiency of monitoring and supervision
Table 4.8. Interlinkage of the objectives of the Marine Policy development plan with the objectives of the National Waste Management Plan 2014–2020
Objectives Interlinkage with the objectives of the Marine Policy development plan
1. Prevent and reduce waste generation, including decreasing hazardousness of waste
• Objective 6 – The state of the marine environment has improved.
Measure 6.2 – Reducing the environmental load related to ships
and ports and its activity Improving collection of waste generated
on ships in ports that reduces harmfulness of waste help to achieve the objective. Also measure 6.1 – Improving the capability of the
public sector to plan protection of the marine environment, prevent
environmental pollution and alleviate their consequences and its activity – Developing and implementing the marine strategy through the implementation of the programme of measures help to achieve the objective.
2. Recycling of waste or recover them for some other way at the maximum level
The objectives of the Marine Policy development plan has no links to the objective of the Waste Management Plan, but there is an indirect link through measure 6.1 – Improving the capability of the
public sector to plan protection of the marine environment, prevent
environmental pollution and alleviate their consequences and its activity Developing and implementing the marine strategy through the implementation of the programme of measures.
3. Reduction of waste originating environmental risk, by way of improving monitoring and supervision, among other efforts
• Objective 6 – The state of the marine environment has improved.
Measure 6.2 – Reducing the environmental load related to ships
and ports and its activity Improving collection of waste generated
on ships in ports that reduces harmfulness of waste help acieve the objective. Also measure 6.1 – Improving the capability of the
public sector to plan protection of the marine environment, prevent
environmental pollution and alleviate their consequences and its activity – Developing and implementing the marine strategy through the implementation of the programme of measures help to achieve the objective.
National Tourism Development Plan for 2014–2020 National Tourism Development Plan for 2014–2020 is a document that focuses on the efficient implementation of Estonia`s tourism sector development potential, building on the prior achievements, taking into account the current situation and global trends. The main objective of the development plan is to ensure Estonia`s competitiveness and international attractiveness as a tourism destination. The development plan includes three sub-objectives. 1. Estonia is known as a travel destination, is well accessible and Estonia`s tourism products and services are competitive internationally
• Measure 1.1. Increasing awareness about Estonia as a travel destination, including promotion of internal tourism
• Measure 1.2. Management of tourism information

92 Strategic Environmental Assessment of the National Development Plan “Estonian Marine Policy 2012−2020”
Draft Report, 2015.
• Measure 1.3. Management of tourism products development • Measure 1.4. Monitoring of tourism development possibilities and development of
business environment 2. Estonia`s tourism attractions and events organised in Estonia are internationally interest evoking and create travel motivation
• Measure 2.1. Development of tourism attractions that are interesting in the international arena
• Measure 2.2. supporting of international events and participation in organisation of events
3. Estonia`s tourism destinations and their integral tourism products are competitive internationally
• Measure 3.1. Development of regional tourism products Table 4.9. Interlinkage of the objectives of the Marine Policy development plan with the objectives of the National Tourism Development Plan for 2014–2020
Objectives Interlinkage with the objectives of the Marine Policy development plan
1. Estonia is known as a travel destination, is well accessible and Estonia`s tourism products and services are competitive internationally
• Objective 3 – Increased number of passengers on international shipping lines.
Measure 3.1 – Supporting the competitiveness of international
carriage of passengers and its activity – Supporting opening of
possible new lines in international cooperation and receipt of
cruise ships in other ports besides Tallinn and Saaremaa ports that increase accessibility are designed to achieve the objective.
• Objective 10 – Marine tourism and marine and coastal business activities are developed.
Measures 10.1 – Developing of small and fishing ports`
infrastructure and recreational craft tourism and 10.2 – Improving
the development of inland waterways that help improve awareness of Estonia as a travel destination are designed to achieve the objective.
• Objective 11 – Preservation of marine cultural heritage and traditions is secured.
Measure 11.1 – Preservation of marine cultural heritage and
recognising maritime sector together with its activities that help maintain sights and organise events is designed to achieve the objective.
2. Estonia`s tourism attractions and events organised in Estonia are internationally interest evoking and create travel motivation
• Objective 10 – Marine tourism and marine and coastal business activities are developed.
Measures 10.1 – Developing of small and fishing ports`
infrastructure and recreational craft tourism and 10.2 – Improving
the development of inland waterways that help to develop interesting tourism attractions are designed to achieve the objective.
• Objective 11 – Preservation of marine cultural heritage and traditions is secured.
Measure 11.1 – Preservation of marine cultural heritage and
recognising maritime sector together with its activities that help to maintain sights and organise events is designed to achieve the objective.
3. Estonia`s tourism destinations and their integral tourism products are competitive internationally
• Objective 10 – Marine tourism and marine and coastal business activities are developed.
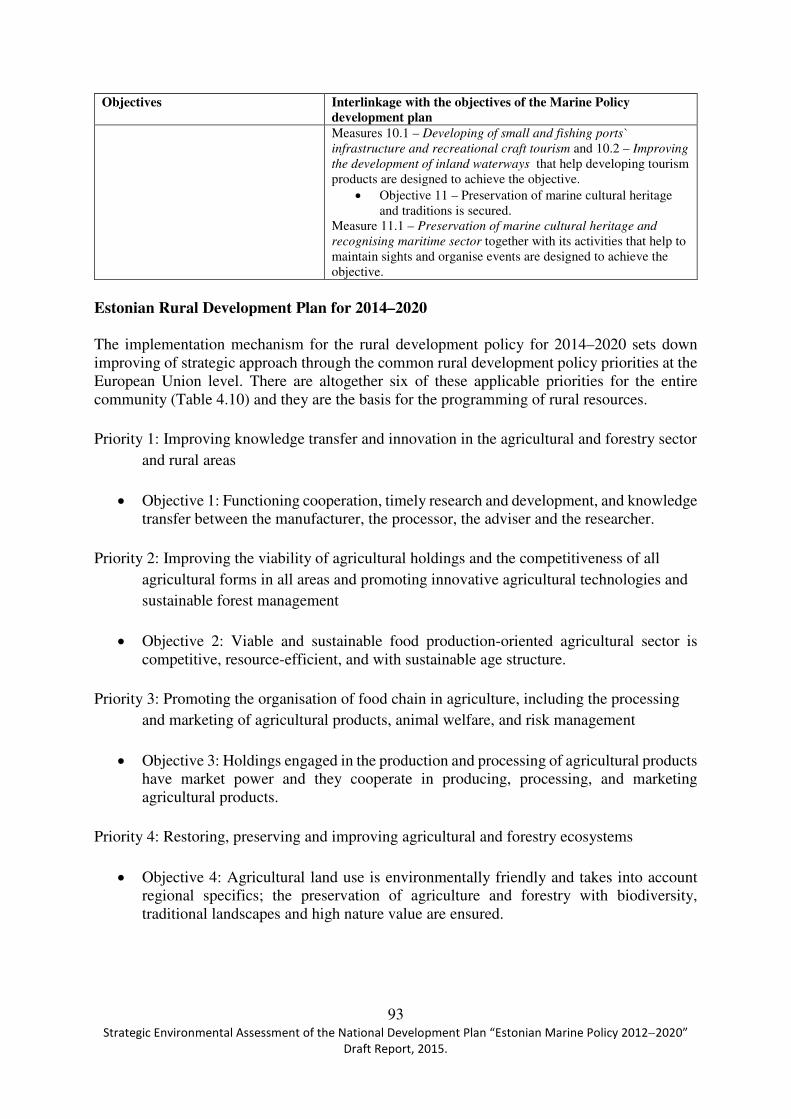
93 Strategic Environmental Assessment of the National Development Plan “Estonian Marine Policy 2012−2020”
Draft Report, 2015.
Objectives Interlinkage with the objectives of the Marine Policy development plan Measures 10.1 – Developing of small and fishing ports`
infrastructure and recreational craft tourism and 10.2 – Improving
the development of inland waterways that help developing tourism products are designed to achieve the objective.
• Objective 11 – Preservation of marine cultural heritage and traditions is secured.
Measure 11.1 – Preservation of marine cultural heritage and
recognising maritime sector together with its activities that help to maintain sights and organise events are designed to achieve the objective.
Estonian Rural Development Plan for 2014–2020 The implementation mechanism for the rural development policy for 2014–2020 sets down improving of strategic approach through the common rural development policy priorities at the European Union level. There are altogether six of these applicable priorities for the entire community (Table 4.10) and they are the basis for the programming of rural resources. Priority 1: Improving knowledge transfer and innovation in the agricultural and forestry sector
and rural areas
• Objective 1: Functioning cooperation, timely research and development, and knowledge transfer between the manufacturer, the processor, the adviser and the researcher.
Priority 2: Improving the viability of agricultural holdings and the competitiveness of all
agricultural forms in all areas and promoting innovative agricultural technologies and sustainable forest management
• Objective 2: Viable and sustainable food production-oriented agricultural sector is
competitive, resource-efficient, and with sustainable age structure. Priority 3: Promoting the organisation of food chain in agriculture, including the processing
and marketing of agricultural products, animal welfare, and risk management
• Objective 3: Holdings engaged in the production and processing of agricultural products have market power and they cooperate in producing, processing, and marketing agricultural products.
Priority 4: Restoring, preserving and improving agricultural and forestry ecosystems
• Objective 4: Agricultural land use is environmentally friendly and takes into account regional specifics; the preservation of agriculture and forestry with biodiversity, traditional landscapes and high nature value are ensured.
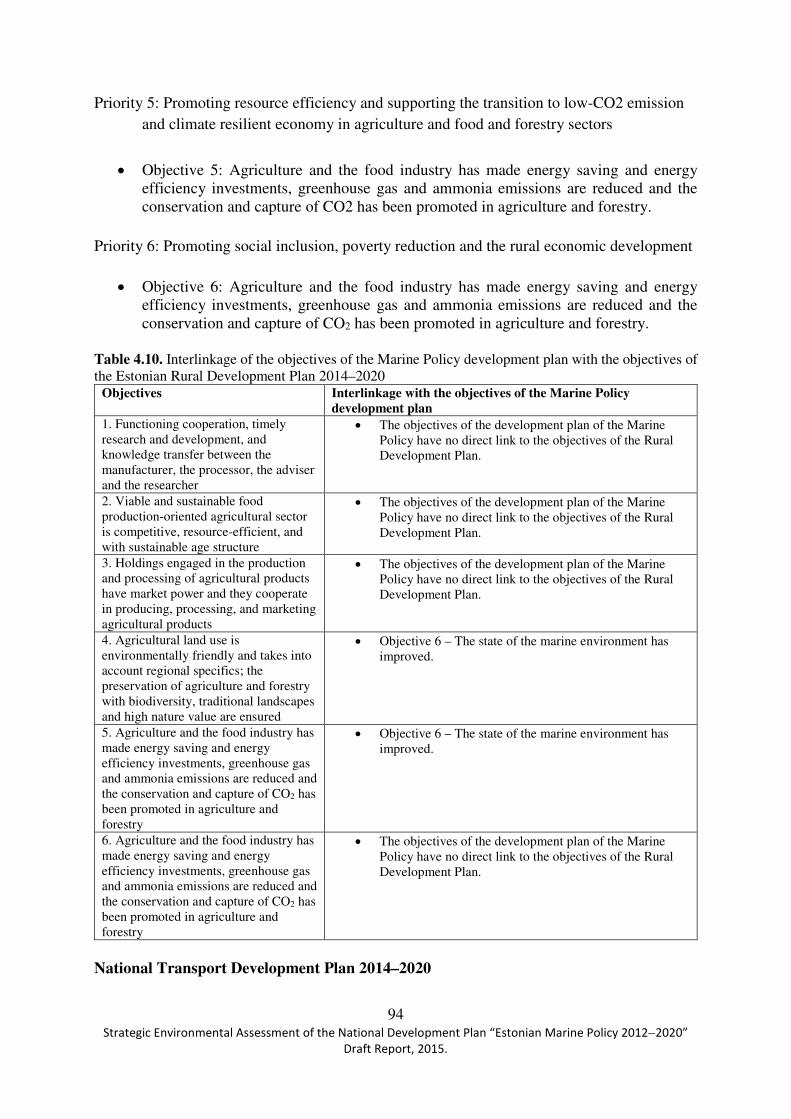
94 Strategic Environmental Assessment of the National Development Plan “Estonian Marine Policy 2012−2020”
Draft Report, 2015.
Priority 5: Promoting resource efficiency and supporting the transition to low-CO2 emission and climate resilient economy in agriculture and food and forestry sectors
• Objective 5: Agriculture and the food industry has made energy saving and energy efficiency investments, greenhouse gas and ammonia emissions are reduced and the conservation and capture of CO2 has been promoted in agriculture and forestry.
Priority 6: Promoting social inclusion, poverty reduction and the rural economic development
• Objective 6: Agriculture and the food industry has made energy saving and energy efficiency investments, greenhouse gas and ammonia emissions are reduced and the conservation and capture of CO2 has been promoted in agriculture and forestry.
Table 4.10. Interlinkage of the objectives of the Marine Policy development plan with the objectives of the Estonian Rural Development Plan 2014–2020
Objectives Interlinkage with the objectives of the Marine Policy development plan
1. Functioning cooperation, timely research and development, and knowledge transfer between the manufacturer, the processor, the adviser and the researcher
• The objectives of the development plan of the Marine Policy have no direct link to the objectives of the Rural Development Plan.
2. Viable and sustainable food production-oriented agricultural sector is competitive, resource-efficient, and with sustainable age structure
• The objectives of the development plan of the Marine Policy have no direct link to the objectives of the Rural Development Plan.
3. Holdings engaged in the production and processing of agricultural products have market power and they cooperate in producing, processing, and marketing agricultural products
• The objectives of the development plan of the Marine Policy have no direct link to the objectives of the Rural Development Plan.
4. Agricultural land use is environmentally friendly and takes into account regional specifics; the preservation of agriculture and forestry with biodiversity, traditional landscapes and high nature value are ensured
• Objective 6 – The state of the marine environment has improved.
5. Agriculture and the food industry has made energy saving and energy efficiency investments, greenhouse gas and ammonia emissions are reduced and the conservation and capture of CO2 has been promoted in agriculture and forestry
• Objective 6 – The state of the marine environment has improved.
6. Agriculture and the food industry has made energy saving and energy efficiency investments, greenhouse gas and ammonia emissions are reduced and the conservation and capture of CO2 has been promoted in agriculture and forestry
• The objectives of the development plan of the Marine Policy have no direct link to the objectives of the Rural Development Plan.
National Transport Development Plan 2014–2020
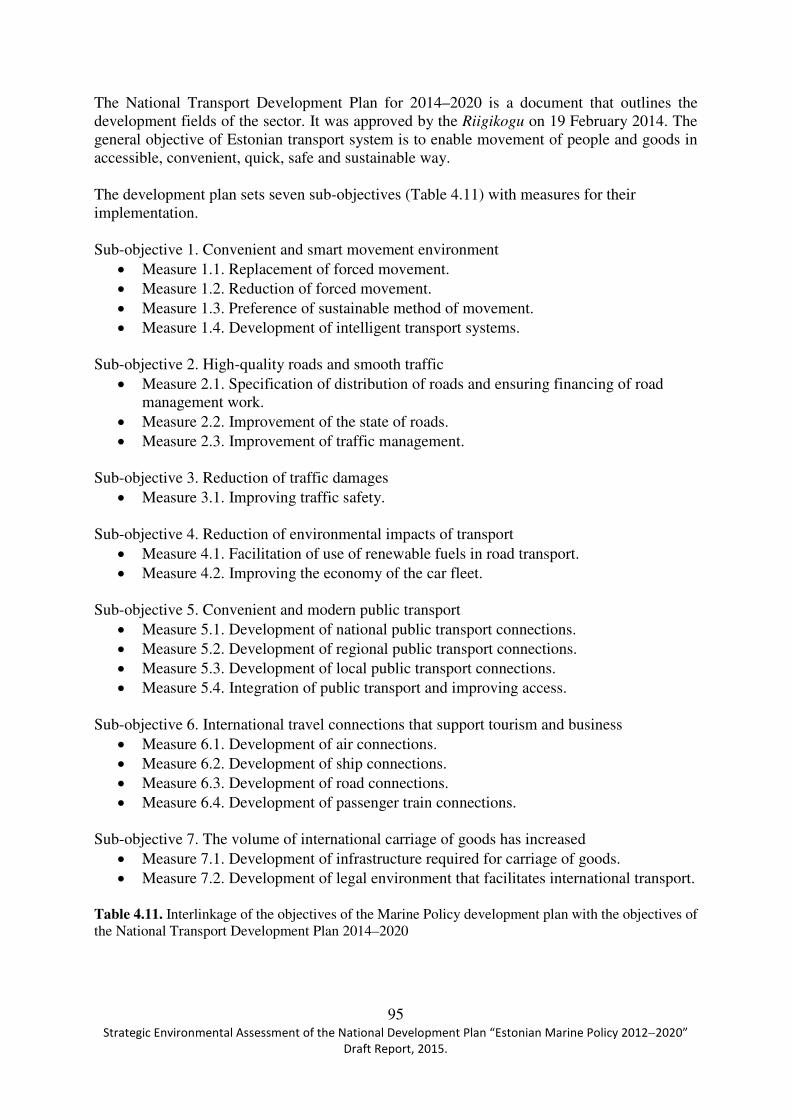
95 Strategic Environmental Assessment of the National Development Plan “Estonian Marine Policy 2012−2020”
Draft Report, 2015.
The National Transport Development Plan for 2014–2020 is a document that outlines the development fields of the sector. It was approved by the Riigikogu on 19 February 2014. The general objective of Estonian transport system is to enable movement of people and goods in accessible, convenient, quick, safe and sustainable way. The development plan sets seven sub-objectives (Table 4.11) with measures for their implementation. Sub-objective 1. Convenient and smart movement environment
• Measure 1.1. Replacement of forced movement. • Measure 1.2. Reduction of forced movement. • Measure 1.3. Preference of sustainable method of movement. • Measure 1.4. Development of intelligent transport systems.
Sub-objective 2. High-quality roads and smooth traffic
• Measure 2.1. Specification of distribution of roads and ensuring financing of road management work.
• Measure 2.2. Improvement of the state of roads. • Measure 2.3. Improvement of traffic management.
Sub-objective 3. Reduction of traffic damages
• Measure 3.1. Improving traffic safety. Sub-objective 4. Reduction of environmental impacts of transport
• Measure 4.1. Facilitation of use of renewable fuels in road transport. • Measure 4.2. Improving the economy of the car fleet.
Sub-objective 5. Convenient and modern public transport
• Measure 5.1. Development of national public transport connections. • Measure 5.2. Development of regional public transport connections. • Measure 5.3. Development of local public transport connections. • Measure 5.4. Integration of public transport and improving access.
Sub-objective 6. International travel connections that support tourism and business
• Measure 6.1. Development of air connections. • Measure 6.2. Development of ship connections. • Measure 6.3. Development of road connections. • Measure 6.4. Development of passenger train connections.
Sub-objective 7. The volume of international carriage of goods has increased
• Measure 7.1. Development of infrastructure required for carriage of goods. • Measure 7.2. Development of legal environment that facilitates international transport.
Table 4.11. Interlinkage of the objectives of the Marine Policy development plan with the objectives of the National Transport Development Plan 2014–2020

96 Strategic Environmental Assessment of the National Development Plan “Estonian Marine Policy 2012−2020”
Draft Report, 2015.
Objectives Interlinkage with the objectives of the Marine Policy development plan
1. Convenient and smart movement environment
The objectives of the development plan of the Marine Policy have no direct link to the objectives of the National Transport Development Plan.
2. High-quality roads and smooth traffic The objectives of the development plan of the Marine Policy have no direct link to the objectives of the National Transport Development Plan.
3. Reduction of traffic damages The objectives of the development plan of the Marine Policy have no direct link to the objectives of the National Transport Development Plan.
4. Reduction of environmental impacts of transport
The objectives of the development plan of the Marine Policy have no direct link to the objectives of the National Transport Development Plan.
5. Convenient and modern public transport
The objectives of the development plan of the Marine Policy have no direct link to the objectives of the National Transport Development Plan.
6. International travel connections that support tourism and business
• Objective 2 – Increased trade flows through Estonian ports.
Measure 2.1 – Using the potential of marine collaborative networks together with its activity – Development of the Estonia`s
concept of the Motorways of the Baltic Sea and implementation of
the action plan that help to create travel connections are designed to achieve the objective.
• Objective 3 – Increased number of passengers on international shipping lines.
Measure 3.1 – Supporting the competitiveness of international
carriage of passengers is designed to achieve the objective. 7. The volume of international carriage of goods has increased
• Objective 2 – Increased trade flows through Estonian ports.
Measures 2.1 – Using the potential of marine collaborative
networks, 2.2 – Supporting the development of international sea-
related carriage of goods and 2.3 – Facilitating the development of
ports` infrastructure are designed to achieve the objective.
Estonian Aquaculture Strategy 2014–2020 The vision of Estonian aquaculture sector to 2020 is to become the leader in the domestic market of aquaculture products and a successful exporter of species that are suitable for Estonian farming conditions and have a high foreign demand. Seven main directions and necessary key activities to achieve success are outlined in the development plan (Table 4.12): 1. To achieve higher productivity, competitive price and stable quality:
• Investments that strengthen competitiveness into technologies and solutions that improve efficiency and quality of production.
• Investments into prevention of fish and crayfish diseases and control of predators (wellbeing of fish and crayfish).
• Mapping of regions suitable for offshore aquaculture, testing and investments into production, if they are suitable.
• Investments into the establishment and expansion of farms for growing species that suit into Estonian conditions.
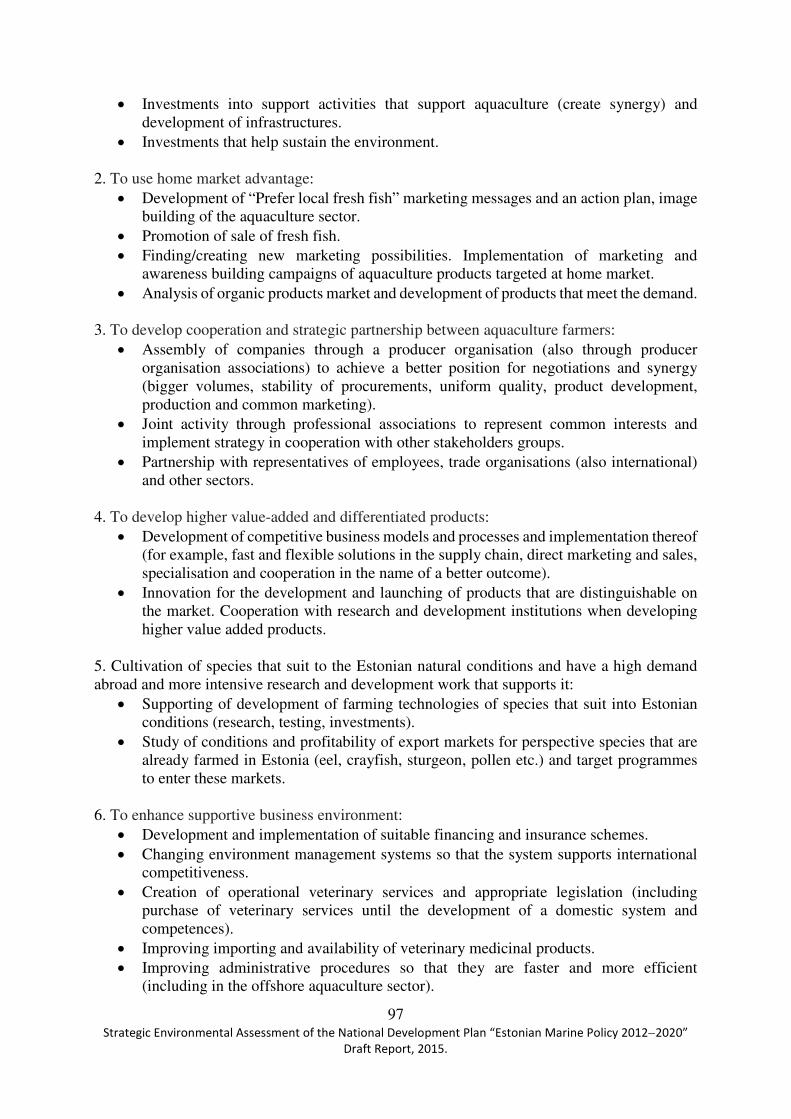
97 Strategic Environmental Assessment of the National Development Plan “Estonian Marine Policy 2012−2020”
Draft Report, 2015.
• Investments into support activities that support aquaculture (create synergy) and development of infrastructures.
• Investments that help sustain the environment. 2. To use home market advantage:
• Development of “Prefer local fresh fish” marketing messages and an action plan, image building of the aquaculture sector.
• Promotion of sale of fresh fish. • Finding/creating new marketing possibilities. Implementation of marketing and
awareness building campaigns of aquaculture products targeted at home market. • Analysis of organic products market and development of products that meet the demand.
3. To develop cooperation and strategic partnership between aquaculture farmers:
• Assembly of companies through a producer organisation (also through producer organisation associations) to achieve a better position for negotiations and synergy (bigger volumes, stability of procurements, uniform quality, product development, production and common marketing).
• Joint activity through professional associations to represent common interests and implement strategy in cooperation with other stakeholders groups.
• Partnership with representatives of employees, trade organisations (also international) and other sectors.
4. To develop higher value-added and differentiated products:
• Development of competitive business models and processes and implementation thereof (for example, fast and flexible solutions in the supply chain, direct marketing and sales, specialisation and cooperation in the name of a better outcome).
• Innovation for the development and launching of products that are distinguishable on the market. Cooperation with research and development institutions when developing higher value added products.
5. Cultivation of species that suit to the Estonian natural conditions and have a high demand abroad and more intensive research and development work that supports it:
• Supporting of development of farming technologies of species that suit into Estonian conditions (research, testing, investments).
• Study of conditions and profitability of export markets for perspective species that are already farmed in Estonia (eel, crayfish, sturgeon, pollen etc.) and target programmes to enter these markets.
6. To enhance supportive business environment:
• Development and implementation of suitable financing and insurance schemes. • Changing environment management systems so that the system supports international
competitiveness. • Creation of operational veterinary services and appropriate legislation (including
purchase of veterinary services until the development of a domestic system and competences).
• Improving importing and availability of veterinary medicinal products. • Improving administrative procedures so that they are faster and more efficient
(including in the offshore aquaculture sector).

98 Strategic Environmental Assessment of the National Development Plan “Estonian Marine Policy 2012−2020”
Draft Report, 2015.
• Development of nature damage compensation mechanisms and implementation thereof as in neighbouring countries.
• Development and implementation of measures that would restrict marketing of poor quality aquaculture products.
7. To acquire sector-specific and business knowledge and skills:
• Ensuring availability of specialised information and the best international practice, development of a consultancy system and training of skilled workers and creation of in-service system.
• Linking training, research and development work with the current and future needs of people involved in aquaculture.
• Strategy and business training of people already involved in aquaculture or those that begin their operations.
Table 4.12. Interlinkage of the objectives of the Marine Policy development plan with the objectives of the Estonian Aquaculture Development Strategy 2014–2020
Objectives Interlinkage with the objectives of the Marine Policy development plan
1. To achieve higher productivity, competitive price and stable quality
• Objective 7 – The marine sector management and regulations are more effective.
Measure 7.2 – Spatial planning of marine areas, which is designed to develop spatial planning of marine areas that help map areas suitable for aquaculture is designed to achieve the objective.
2. To use home market advantage The objectives of the development plan of the Marine Policy have no direct link to the objectives of the Estonian Aquaculture Developmental Strategy.
3. To develop cooperation and strategic partnership between aquaculture farmers
The objectives of the development plan of the Marine Policy have no direct link to the objectives of the Estonian Aquaculture Developmental Strategy
4. To develop higher value-added and differentiated products
The objectives of the development plan of the Marine Policy have no direct link to the objectives of the Estonian Aquaculture Developmental Strategy
5. Cultivation of species that suit to the Estonian natural conditions and have a high demand abroad and more intensive research and development work that supports it
• Objective 9 – The quantity and quality of Estonian marine research have increased.
6. To enhance supportive business environment
The objectives of the development plan of the Marine Policy have no direct link to the objectives of the Estonian Aquaculture Developmental Strategy.
7. To acquire sector-specific and business knowledge and skills
• Objective 8 – Estonian education system provides modern training in balanced volume of specialists necessary for all fields of the marine sector.
• Objective 9 – The quantity and quality of Estonian marine research have increased.
Recreational Fishing Development Plan for 2010–2013 (with the perspective until 2018) The Development Plan specifies for 2010–2013 (with the perspective until 2018) the development fields and preferred activity in recreational fishing. The strategic objective of the development plan is to popularise, simplify and diversify recreational fishing as a healthy activity to spend free time and sustainable use of the environment and increase thereby the
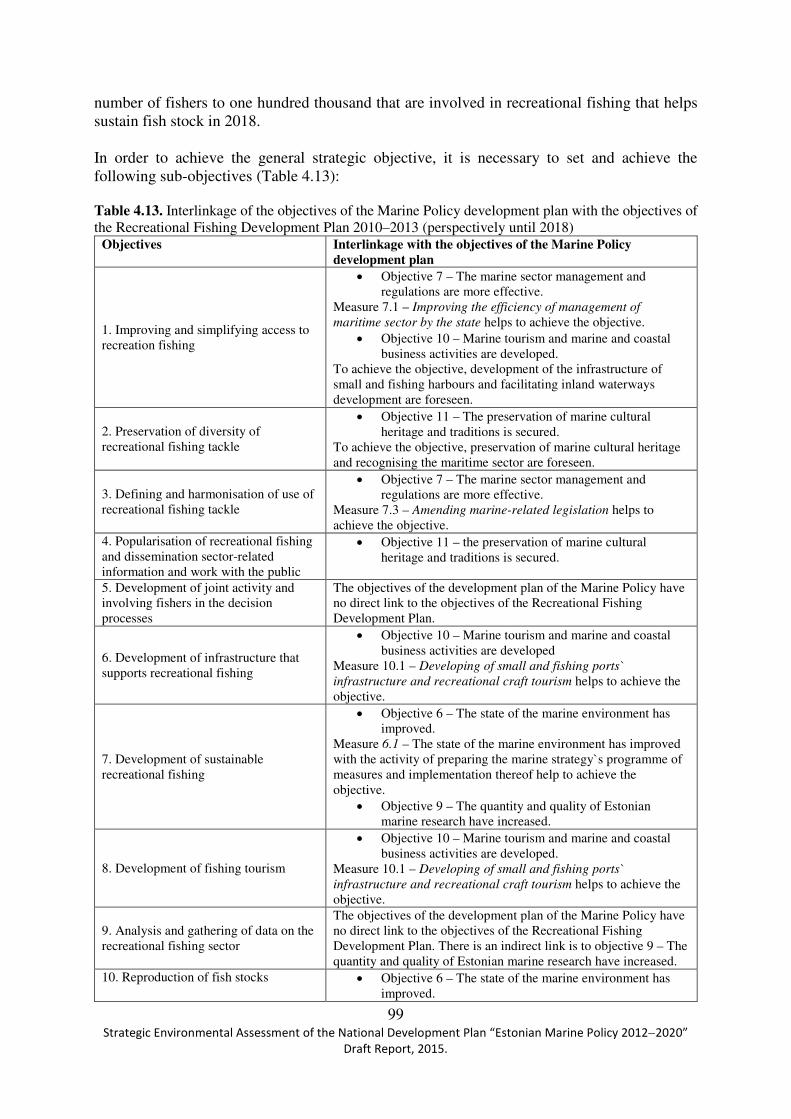
99 Strategic Environmental Assessment of the National Development Plan “Estonian Marine Policy 2012−2020”
Draft Report, 2015.
number of fishers to one hundred thousand that are involved in recreational fishing that helps sustain fish stock in 2018. In order to achieve the general strategic objective, it is necessary to set and achieve the following sub-objectives (Table 4.13): Table 4.13. Interlinkage of the objectives of the Marine Policy development plan with the objectives of the Recreational Fishing Development Plan 2010–2013 (perspectively until 2018)
Objectives Interlinkage with the objectives of the Marine Policy development plan
1. Improving and simplifying access to recreation fishing
• Objective 7 – The marine sector management and regulations are more effective.
Measure 7.1 – Improving the efficiency of management of
maritime sector by the state helps to achieve the objective. • Objective 10 – Marine tourism and marine and coastal
business activities are developed. To achieve the objective, development of the infrastructure of small and fishing harbours and facilitating inland waterways development are foreseen.
2. Preservation of diversity of recreational fishing tackle
• Objective 11 – The preservation of marine cultural heritage and traditions is secured.
To achieve the objective, preservation of marine cultural heritage and recognising the maritime sector are foreseen.
3. Defining and harmonisation of use of recreational fishing tackle
• Objective 7 – The marine sector management and regulations are more effective.
Measure 7.3 – Amending marine-related legislation helps to achieve the objective.
4. Popularisation of recreational fishing and dissemination sector-related information and work with the public
• Objective 11 – the preservation of marine cultural heritage and traditions is secured.
5. Development of joint activity and involving fishers in the decision processes
The objectives of the development plan of the Marine Policy have no direct link to the objectives of the Recreational Fishing Development Plan.
6. Development of infrastructure that supports recreational fishing
• Objective 10 – Marine tourism and marine and coastal business activities are developed
Measure 10.1 – Developing of small and fishing ports`
infrastructure and recreational craft tourism helps to achieve the objective.
7. Development of sustainable recreational fishing
• Objective 6 – The state of the marine environment has improved.
Measure 6.1 – The state of the marine environment has improved with the activity of preparing the marine strategy`s programme of measures and implementation thereof help to achieve the objective.
• Objective 9 – The quantity and quality of Estonian marine research have increased.
8. Development of fishing tourism
• Objective 10 – Marine tourism and marine and coastal business activities are developed.
Measure 10.1 – Developing of small and fishing ports`
infrastructure and recreational craft tourism helps to achieve the objective.
9. Analysis and gathering of data on the recreational fishing sector
The objectives of the development plan of the Marine Policy have no direct link to the objectives of the Recreational Fishing Development Plan. There is an indirect link is to objective 9 – The quantity and quality of Estonian marine research have increased.
10. Reproduction of fish stocks • Objective 6 – The state of the marine environment has improved.
100 Strategic Environmental Assessment of the National Development Plan “Estonian Marine Policy 2012−2020”
Draft Report, 2015.
Objectives Interlinkage with the objectives of the Marine Policy development plan Measure 6.1 – Improving the capability of the public sector to plan
protection of the marine environment, prevent environmental
pollution and alleviate their consequences with the activity of preparing the programme of measures and implementation thereof helps to achieve the objective.
County planning of the marine areas bordering Hiiu County (not adopted) The objective of the planning is to ensure fulfilment of the spatial development objectives of Hiiu County marine area through a participative planning process. The planning sets out various uses of the marine area and has determined the principles and directions of spatial development. The Marine Policy development plan set outs as one objective more efficient management of marine sector and legislative basis. One measure is spatial planning of marine areas. County planning of the marine areas bordering Pärnu County (not adopted) The objective of preparing the county planning of the marine area bordering Pärnu County is to determine during the public planning process the use of marine area bordering Pärnu County that takes into account all different interests in a balanced way. An important outcome of the marine area spatial planning is prevention or minimising conflicts of activities performed or planned to be performed at sea and the use of sea and the nature. The Marine Policy development plan set outs as one objective more efficient management of marine sector and legislative basis. One measure is spatial planning of marine areas. Water Management Plans for western Estonia, eastern Estonia and Koiva basins for 2015–2021 A water management plan is a strategic document that is prepared to plan measures for the protection and use of surface and groundwater. Objectives of a water management plan are set based on two principles:
• good status of water bodies must be maintained; • water bodies not in good condition must be brought into a good condition.
The general objective of the new water management period is to achieve by 2021 good condition of waterbodies that are not presently in the expected condition. Measure 6.1 – Improving the capability of the public sector to plan protection of the marine
environment, prevent environmental pollution and alleviate their consequences of the objective 6 – The state of the marine environment has improved includes as an activity developing of the Marine Strategy`s programme of measures which goal is to improve the marine area environmental status. The surface water and groundwater protection measures are included in the programme of measures of water management plans that help to improve and maintain the marine area environmental status. The objectives set in the Marine Policy development plan are not in conflict with the objectives set down in Estonian national documents.
101 Strategic Environmental Assessment of the National Development Plan “Estonian Marine Policy 2012−2020”
Draft Report, 2015.
5. ANALYSIS OF EXTERNAL IMPACTS OR ENVIRONMENTAL
IMPACTS PRESUMED TO OCCUR IN RELATION WITH The IMPLEMENTATION OF THE DEVELOPMENT PLAN AND MITIGATION MEASURES (PROPOSALS)
5.1 Analysis of the impact of implementation of the “Estonian Marine Policy 2012−−−−2020” development plan
This section analyses the area-specific impact during the implementation of “Estonian Marine Policy 2012−2020” development plan. Impacts are assessed by the objectives and measures of the development plan and a total score is given to the descriptive part. The following scale is used to give the total score: + positive impact; - negative impact; 0 no impact; ? impact is unclear or unknown. After the score given in Table 5.1, area-specific summaries of the impact assessment have been presented and, if necessary, suggestions/proposals have been made on measures/topics that should be taken into account when preparing the new implementation plan of the development plan.

Table 5.1. Assessment of impact on the natural environment of “Estonian Marine Policy 2012−2020” SEA area
Impact on marine biota and habitats (including impact on protected nature objects)
Impact on seawater quality and physical indicators of the marine environment
Impact on air quality and climate changes (including outdoor noise)
Impact on the sustainable use of natural resources and resources
No. Measure Description of impact S Description of impact S Description of impact S Description of impact S
1. Estonian
shipping is
internationally
competitive
Fulfilment of this objective has no direct impact. There may be a certain positive impact due to the reduction of accident risk when modern navigational systems are used in shipping.
0 Fulfilment of this objective has no direct impact. A certain positive impact is related to the acquisition of new and modern ships when necessary national support systems are implemented. This will hopefully lead to a reduction in the number of accidents and possible pollution risk.
0 The objective and measure are mostly related to improving the performance of various registers and systems that have no direct impact in this area. An indirect positive impact is expected when the support system for shipping companies is implemented that enables to acquire ships that use LNG and renew the fleet.
+ A certain positive impact is related to the implementation of national support systems necessary for the acquisition of new and modern ships.
+
1.1 Creating equal competitive conditions with the European states for the Estonian shipping sector
2. Increased trade
flows through
Estonian ports
Pressures (oil pollution, noise, air pollution) due to more intensive vessel traffic may cause a negative impact on marine habitats and biota. Pressures may cause deterioration of the status or loss of habitats, disturb animals/birds and even cause their death (in case of oil pollution). Eutrophication-sensitive demersal zoobenthos is replaced with more tolerant species. The risk of invasion of new non-indigenous species increases.
- Fulfilment of the objective and measures may have a negative impact. More intensive vessel traffic will increase the probability of ship accidents (oil pollution risk); noise; air pollution that in turn increases the amount of nitrogen introduced into water contributing thereby to eutrophication. Expanding of ports diminishes natural coastline and changes the local current and wave regime. In addition, water transparency and
- Upon implementation of the objective and measures, the amount of goods that pass through ports increases and so does vessel traffic. The mentioned activity causes a negative impact on air quality and changes the noise situation, especially in port areas. As there have been problems close to larger cargo ports concerning air quality (mainly unpleasant smell) and noise, the air quality and noise aspect needs to be taken into account when trade flows are increased and ports are expanded
-/?
Bigger cargo flows will inevitably increase use of ship fuel (oil as well as natural gas) that in turn will have a negative environmental impact in this area. Using the potential of maritime collaborative networks and supporting international carriage of goods helps optimise cargo transport and improves the provision of relevant services. Consequently, it is a positive measure in terms of saving resources.
-/+
2.1 Using the potential of the marine collaborative networks
2.2 Supporting the development of international sea-related carriage of goods
2.3 Facilitation of development of

103 Strategic Environmental Assessment of the National Development Plan “Estonian Marine Policy 2012−2020”
Draft Report, 2015.
SEA area
Impact on marine biota and habitats (including impact on protected nature objects)
Impact on seawater quality and physical indicators of the marine environment
Impact on air quality and climate changes (including outdoor noise)
Impact on the sustainable use of natural resources and resources
No. Measure Description of impact S Description of impact S Description of impact S Description of impact S
ports infrastructure
Expanding of ports may cause direct destruction of habitats and demersal zoobenthos or deterioration of their situation; reduction of perennial benthic flora distribution depth limit; disturbance of birds during construction work. Introduction of pollutants into water and deposition into sediments may cause animal health failures. However, not all mentioned impacts have to occur with increased vessel traffic if risk mitigation measures are applied. For example, during past two decades the number of oil spills discovered in the sea has decreased.
The impacts related to dredging of waterways are, for the most part, short-term and they do not influence the entire Estonian marine environment significantly.
distribution of nutrients are influenced during construction works. If the dredged sediments are not clean, hazardous substances may be introduced into the water column. However, not all mentioned impacts have to occur with increased vessel traffic if risk mitigation measures are applied. For example, during the past two decades the number of oil spills discovered in the sea has decreased. This result has been achieved although the length of monitoring flights have increased as has the vessel traffic load on the Baltic Sea. In the analysis of HELCOM`s project BRISK it has been found that the influence of various measures (double-bottoms of tankers, various navigational aids) reduce significantly the risks arising from the growth of vessel traffic.
and necessary measures must be taken. This helps minimise the effect. Introduction of cleaner ship fuels has an overall positive impact on air quality and climate. This is why introduction of cleaner fuels, e.g. LNG, must be facilitated. If LNG is used, SO2-emissions and PM-emissions will decrease ~ 100%, CO2-emissions by 25% and NOx-emissions by 90% compared to traditional fuels.
The growth of container transport and developing ports` infrastructure enables export and import goods more efficiently and faster than before, which has an indirect positive impact on the use of natural resources and resources.
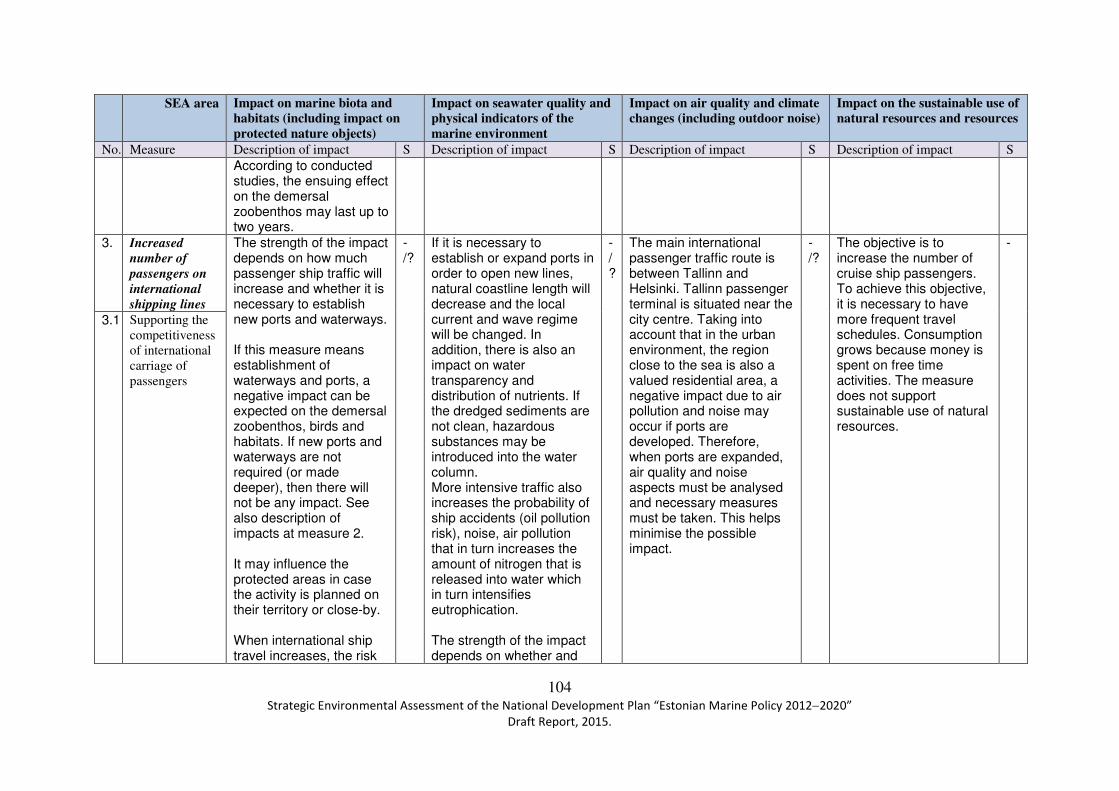
104 Strategic Environmental Assessment of the National Development Plan “Estonian Marine Policy 2012−2020”
Draft Report, 2015.
SEA area
Impact on marine biota and habitats (including impact on protected nature objects)
Impact on seawater quality and physical indicators of the marine environment
Impact on air quality and climate changes (including outdoor noise)
Impact on the sustainable use of natural resources and resources
No. Measure Description of impact S Description of impact S Description of impact S Description of impact S
According to conducted studies, the ensuing effect on the demersal zoobenthos may last up to two years.
3. Increased
number of
passengers on
international
shipping lines
The strength of the impact depends on how much passenger ship traffic will increase and whether it is necessary to establish new ports and waterways. If this measure means establishment of waterways and ports, a negative impact can be expected on the demersal zoobenthos, birds and habitats. If new ports and waterways are not required (or made deeper), then there will not be any impact. See also description of impacts at measure 2. It may influence the protected areas in case the activity is planned on their territory or close-by. When international ship travel increases, the risk
-/?
If it is necessary to establish or expand ports in order to open new lines, natural coastline length will decrease and the local current and wave regime will be changed. In addition, there is also an impact on water transparency and distribution of nutrients. If the dredged sediments are not clean, hazardous substances may be introduced into the water column. More intensive traffic also increases the probability of ship accidents (oil pollution risk), noise, air pollution that in turn increases the amount of nitrogen that is released into water which in turn intensifies eutrophication. The strength of the impact depends on whether and
-/?
The main international passenger traffic route is between Tallinn and Helsinki. Tallinn passenger terminal is situated near the city centre. Taking into account that in the urban environment, the region close to the sea is also a valued residential area, a negative impact due to air pollution and noise may occur if ports are developed. Therefore, when ports are expanded, air quality and noise aspects must be analysed and necessary measures must be taken. This helps minimise the possible impact.
-/?
The objective is to increase the number of cruise ship passengers. To achieve this objective, it is necessary to have more frequent travel schedules. Consumption grows because money is spent on free time activities. The measure does not support sustainable use of natural resources.
-
3.1 Supporting the competitiveness of international carriage of passengers
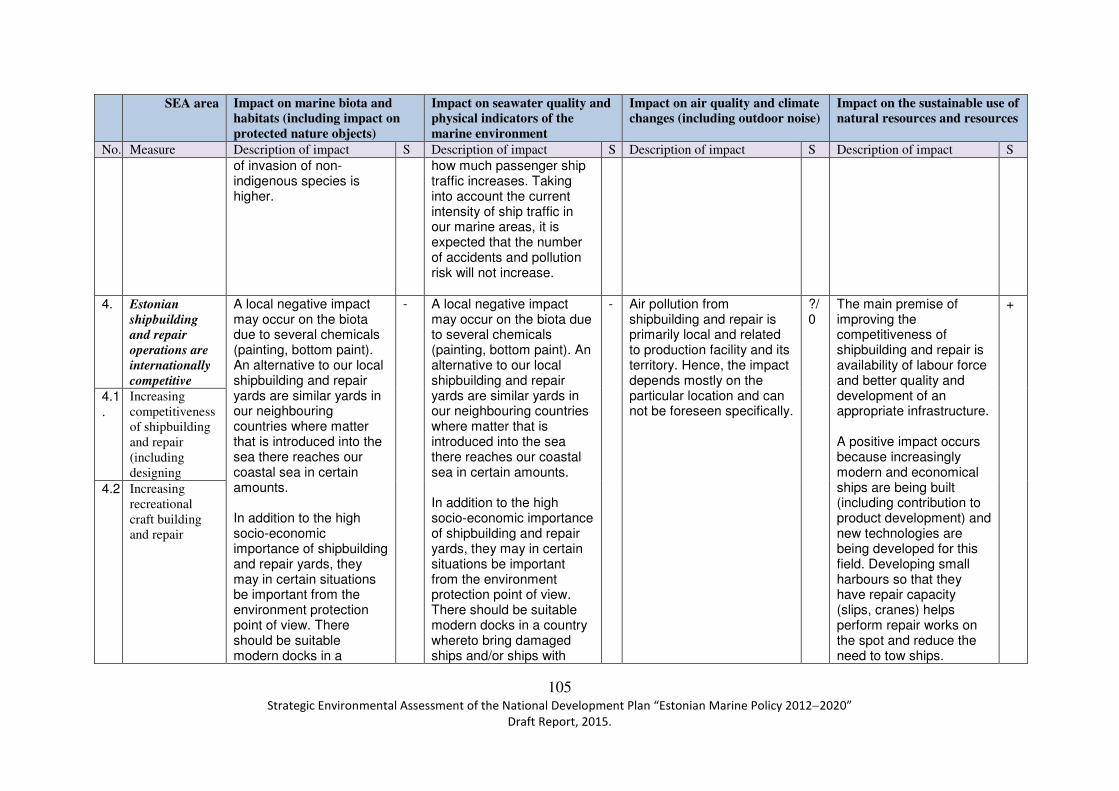
105 Strategic Environmental Assessment of the National Development Plan “Estonian Marine Policy 2012−2020”
Draft Report, 2015.
SEA area
Impact on marine biota and habitats (including impact on protected nature objects)
Impact on seawater quality and physical indicators of the marine environment
Impact on air quality and climate changes (including outdoor noise)
Impact on the sustainable use of natural resources and resources
No. Measure Description of impact S Description of impact S Description of impact S Description of impact S
of invasion of non-indigenous species is higher.
how much passenger ship traffic increases. Taking into account the current intensity of ship traffic in our marine areas, it is expected that the number of accidents and pollution risk will not increase.
4. Estonian
shipbuilding
and repair
operations are
internationally
competitive
A local negative impact may occur on the biota due to several chemicals (painting, bottom paint). An alternative to our local shipbuilding and repair yards are similar yards in our neighbouring countries where matter that is introduced into the sea there reaches our coastal sea in certain amounts. In addition to the high socio-economic importance of shipbuilding and repair yards, they may in certain situations be important from the environment protection point of view. There should be suitable modern docks in a
- A local negative impact may occur on the biota due to several chemicals (painting, bottom paint). An alternative to our local shipbuilding and repair yards are similar yards in our neighbouring countries where matter that is introduced into the sea there reaches our coastal sea in certain amounts. In addition to the high socio-economic importance of shipbuilding and repair yards, they may in certain situations be important from the environment protection point of view. There should be suitable modern docks in a country whereto bring damaged ships and/or ships with
- Air pollution from shipbuilding and repair is primarily local and related to production facility and its territory. Hence, the impact depends mostly on the particular location and can not be foreseen specifically.
?/0
The main premise of improving the competitiveness of shipbuilding and repair is availability of labour force and better quality and development of an appropriate infrastructure. A positive impact occurs because increasingly modern and economical ships are being built (including contribution to product development) and new technologies are being developed for this field. Developing small harbours so that they have repair capacity (slips, cranes) helps perform repair works on the spot and reduce the need to tow ships.
+
4.1.
Increasing competitiveness of shipbuilding and repair (including designing
4.2 Increasing recreational craft building and repair
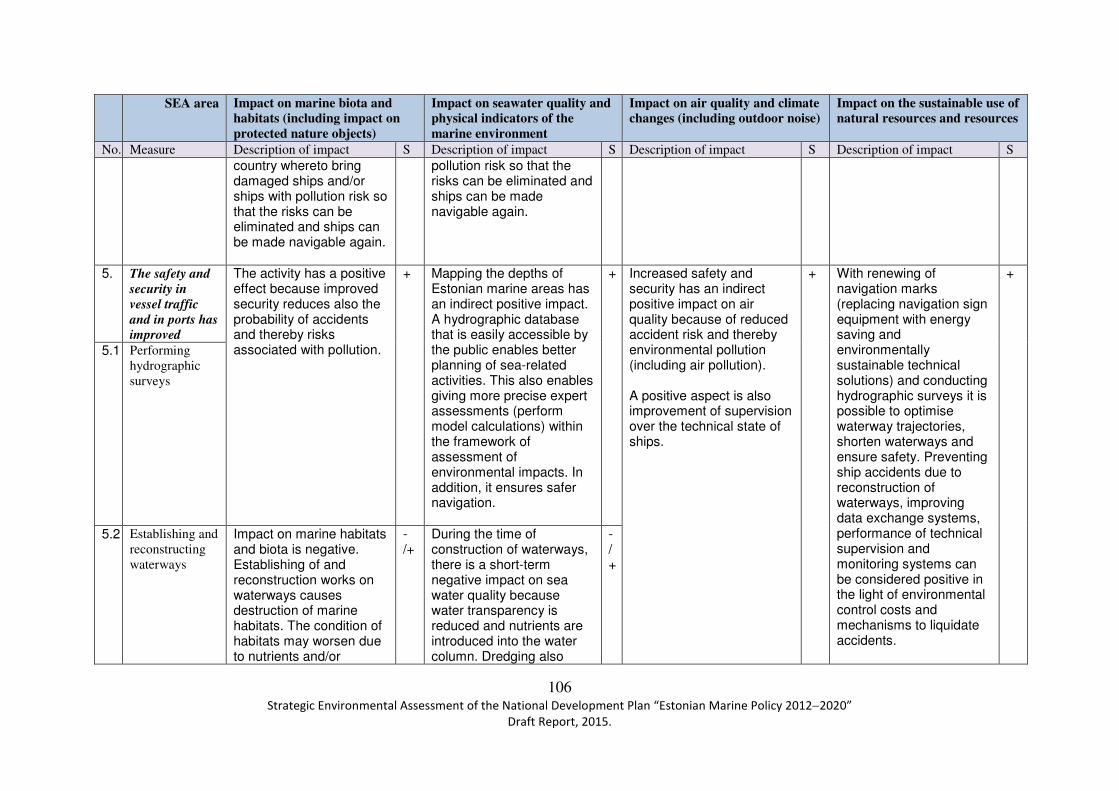
106 Strategic Environmental Assessment of the National Development Plan “Estonian Marine Policy 2012−2020”
Draft Report, 2015.
SEA area
Impact on marine biota and habitats (including impact on protected nature objects)
Impact on seawater quality and physical indicators of the marine environment
Impact on air quality and climate changes (including outdoor noise)
Impact on the sustainable use of natural resources and resources
No. Measure Description of impact S Description of impact S Description of impact S Description of impact S
country whereto bring damaged ships and/or ships with pollution risk so that the risks can be eliminated and ships can be made navigable again.
pollution risk so that the risks can be eliminated and ships can be made navigable again.
5. The safety and
security in
vessel traffic
and in ports has
improved
The activity has a positive effect because improved security reduces also the probability of accidents and thereby risks associated with pollution.
+ Mapping the depths of Estonian marine areas has an indirect positive impact. A hydrographic database that is easily accessible by the public enables better planning of sea-related activities. This also enables giving more precise expert assessments (perform model calculations) within the framework of assessment of environmental impacts. In addition, it ensures safer navigation.
+ Increased safety and security has an indirect positive impact on air quality because of reduced accident risk and thereby environmental pollution (including air pollution). A positive aspect is also improvement of supervision over the technical state of ships.
+ With renewing of navigation marks (replacing navigation sign equipment with energy saving and environmentally sustainable technical solutions) and conducting hydrographic surveys it is possible to optimise waterway trajectories, shorten waterways and ensure safety. Preventing ship accidents due to reconstruction of waterways, improving data exchange systems, performance of technical supervision and monitoring systems can be considered positive in the light of environmental control costs and mechanisms to liquidate accidents.
+
5.1 Performing hydrographic surveys
5.2 Establishing and reconstructing waterways
Impact on marine habitats and biota is negative. Establishing of and reconstruction works on waterways causes destruction of marine habitats. The condition of habitats may worsen due to nutrients and/or
-/+
During the time of construction of waterways, there is a short-term negative impact on sea water quality because water transparency is reduced and nutrients are introduced into the water column. Dredging also
-/+

107 Strategic Environmental Assessment of the National Development Plan “Estonian Marine Policy 2012−2020”
Draft Report, 2015.
SEA area
Impact on marine biota and habitats (including impact on protected nature objects)
Impact on seawater quality and physical indicators of the marine environment
Impact on air quality and climate changes (including outdoor noise)
Impact on the sustainable use of natural resources and resources
No. Measure Description of impact S Description of impact S Description of impact S Description of impact S
pollutants introduced into the water column. The depth limit of perennial demersal flora is decreasing. Noise caused by works, including underwater noise, may disturb sea birds and marine mammals. During winter, when the sea is covered with ice and it is necessary to keep waterways open, there may be an impact on the grey seal and the ringed seal that give birth on ice. Using waterways has a positive impact on water quality because marine traffic becomes safer and this decreases accident risk. Waterway dredging and reconstruction works have a stronger impact in shallower coastal sea because valuable habitat types and more diverse demersal communities can be found there.
changes the topography of the sea-floor and current and wave regime. There is a potential risk that hazardous substances may be released from the dredged sediments. Using waterways has a positive impact on water quality because marine traffic becomes safer and this decreases accident risk.
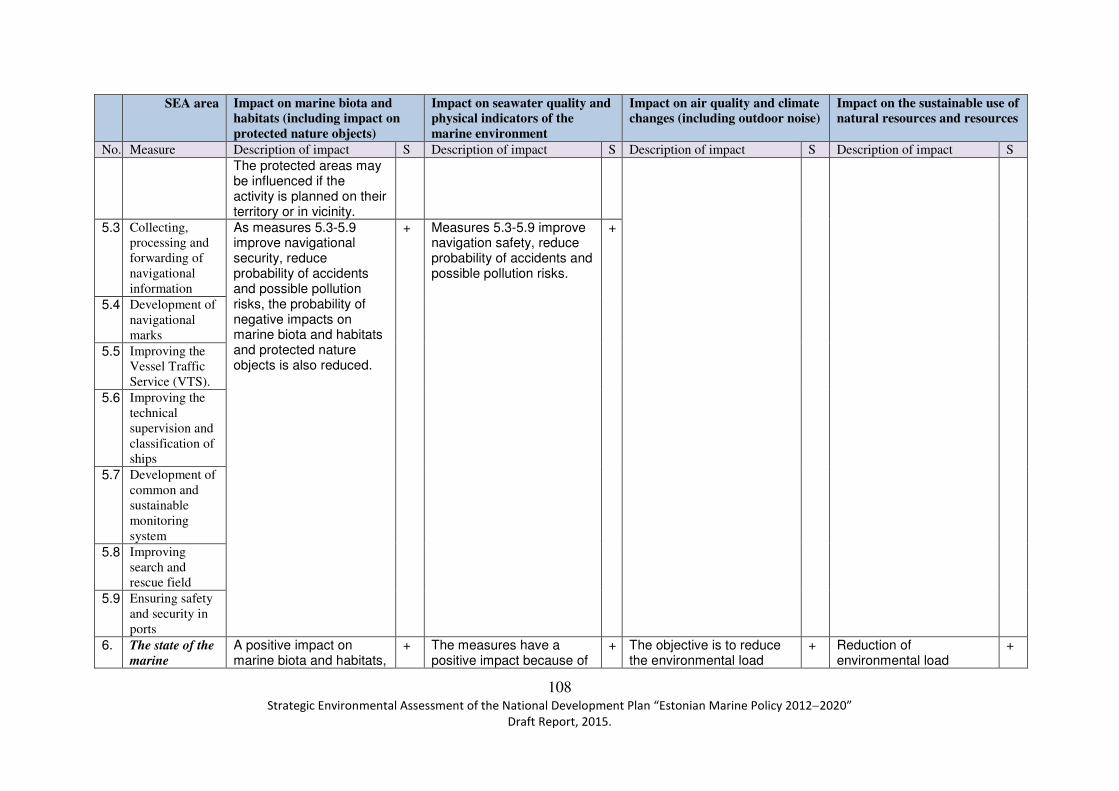
108 Strategic Environmental Assessment of the National Development Plan “Estonian Marine Policy 2012−2020”
Draft Report, 2015.
SEA area
Impact on marine biota and habitats (including impact on protected nature objects)
Impact on seawater quality and physical indicators of the marine environment
Impact on air quality and climate changes (including outdoor noise)
Impact on the sustainable use of natural resources and resources
No. Measure Description of impact S Description of impact S Description of impact S Description of impact S
The protected areas may be influenced if the activity is planned on their territory or in vicinity.
5.3 Collecting, processing and forwarding of navigational information
As measures 5.3-5.9 improve navigational security, reduce probability of accidents and possible pollution risks, the probability of negative impacts on marine biota and habitats and protected nature objects is also reduced.
+ Measures 5.3-5.9 improve navigation safety, reduce probability of accidents and possible pollution risks.
+
5.4 Development of navigational marks
5.5 Improving the Vessel Traffic Service (VTS).
5.6 Improving the technical supervision and classification of ships
5.7 Development of common and sustainable monitoring system
5.8 Improving search and rescue field
5.9 Ensuring safety and security in ports
6. The state of the
marine
A positive impact on marine biota and habitats,
+ The measures have a positive impact because of
+ The objective is to reduce the environmental load
+ Reduction of environmental load
+
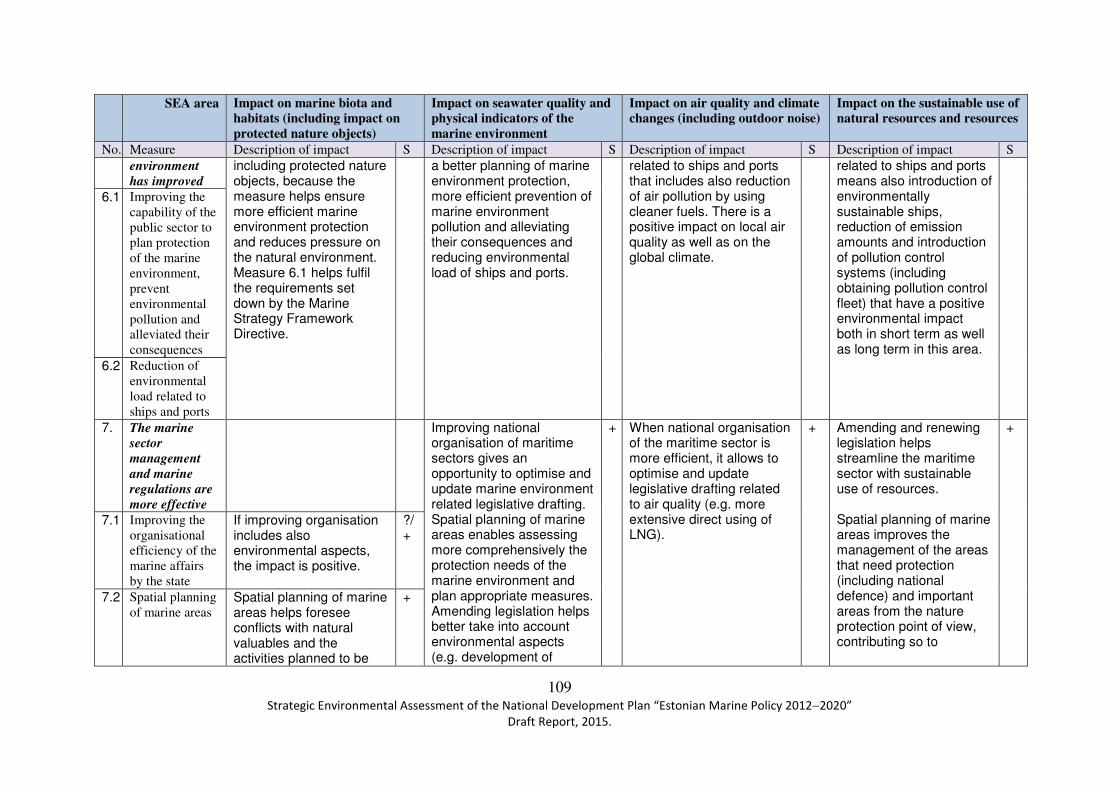
109 Strategic Environmental Assessment of the National Development Plan “Estonian Marine Policy 2012−2020”
Draft Report, 2015.
SEA area
Impact on marine biota and habitats (including impact on protected nature objects)
Impact on seawater quality and physical indicators of the marine environment
Impact on air quality and climate changes (including outdoor noise)
Impact on the sustainable use of natural resources and resources
No. Measure Description of impact S Description of impact S Description of impact S Description of impact S
environment
has improved
including protected nature objects, because the measure helps ensure more efficient marine environment protection and reduces pressure on the natural environment. Measure 6.1 helps fulfil the requirements set down by the Marine Strategy Framework Directive.
a better planning of marine environment protection, more efficient prevention of marine environment pollution and alleviating their consequences and reducing environmental load of ships and ports.
related to ships and ports that includes also reduction of air pollution by using cleaner fuels. There is a positive impact on local air quality as well as on the global climate.
related to ships and ports means also introduction of environmentally sustainable ships, reduction of emission amounts and introduction of pollution control systems (including obtaining pollution control fleet) that have a positive environmental impact both in short term as well as long term in this area.
6.1 Improving the capability of the public sector to plan protection of the marine environment, prevent environmental pollution and alleviated their consequences
6.2 Reduction of environmental load related to ships and ports
7. The marine
sector
management
and marine
regulations are
more effective
Improving national organisation of maritime sectors gives an opportunity to optimise and update marine environment related legislative drafting. Spatial planning of marine areas enables assessing more comprehensively the protection needs of the marine environment and plan appropriate measures. Amending legislation helps better take into account environmental aspects (e.g. development of
+ When national organisation of the maritime sector is more efficient, it allows to optimise and update legislative drafting related to air quality (e.g. more extensive direct using of LNG).
+ Amending and renewing legislation helps streamline the maritime sector with sustainable use of resources. Spatial planning of marine areas improves the management of the areas that need protection (including national defence) and important areas from the nature protection point of view, contributing so to
+
7.1 Improving the organisational efficiency of the marine affairs by the state
If improving organisation includes also environmental aspects, the impact is positive.
?/+
7.2 Spatial planning of marine areas
Spatial planning of marine areas helps foresee conflicts with natural valuables and the activities planned to be
+
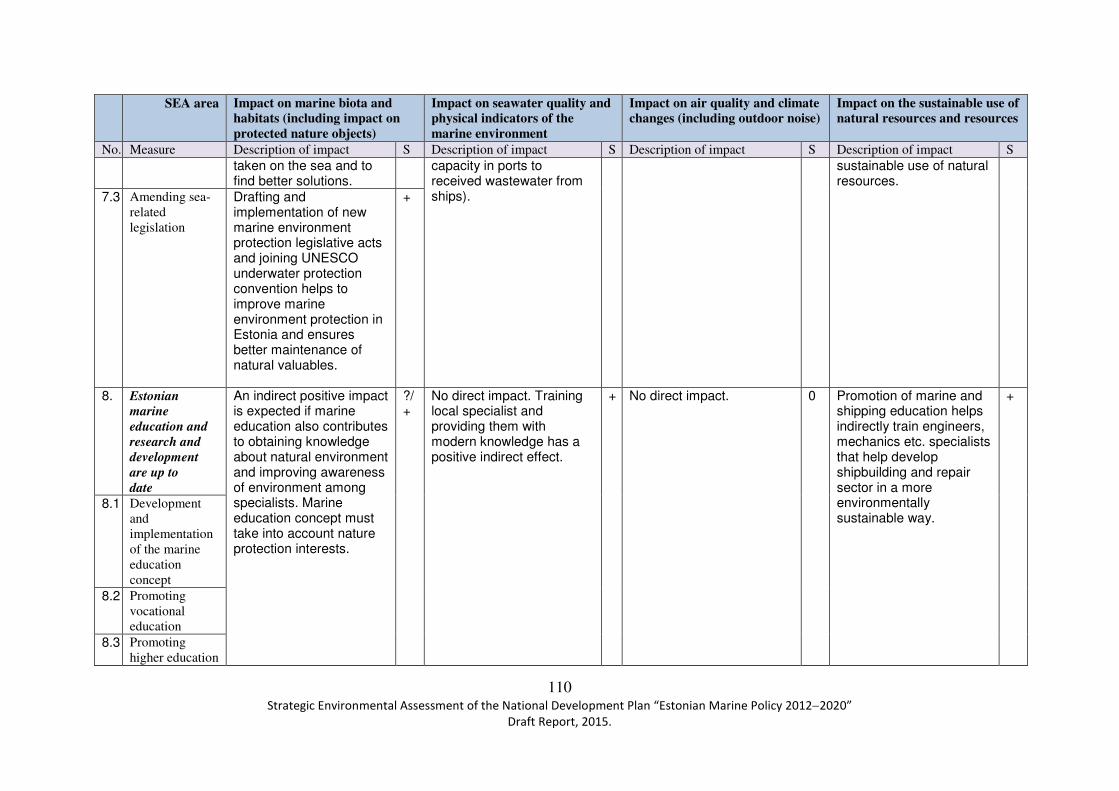
110 Strategic Environmental Assessment of the National Development Plan “Estonian Marine Policy 2012−2020”
Draft Report, 2015.
SEA area
Impact on marine biota and habitats (including impact on protected nature objects)
Impact on seawater quality and physical indicators of the marine environment
Impact on air quality and climate changes (including outdoor noise)
Impact on the sustainable use of natural resources and resources
No. Measure Description of impact S Description of impact S Description of impact S Description of impact S
taken on the sea and to find better solutions.
capacity in ports to received wastewater from ships).
sustainable use of natural resources.
7.3 Amending sea-related legislation
Drafting and implementation of new marine environment protection legislative acts and joining UNESCO underwater protection convention helps to improve marine environment protection in Estonia and ensures better maintenance of natural valuables.
+
8. Estonian
marine
education and
research and
development
are up to
date
An indirect positive impact is expected if marine education also contributes to obtaining knowledge about natural environment and improving awareness of environment among specialists. Marine education concept must take into account nature protection interests.
?/+
No direct impact. Training local specialist and providing them with modern knowledge has a positive indirect effect.
+ No direct impact. 0 Promotion of marine and shipping education helps indirectly train engineers, mechanics etc. specialists that help develop shipbuilding and repair sector in a more environmentally sustainable way.
+
8.1 Development and implementation of the marine education concept
8.2 Promoting vocational education
8.3 Promoting higher education

111 Strategic Environmental Assessment of the National Development Plan “Estonian Marine Policy 2012−2020”
Draft Report, 2015.
SEA area
Impact on marine biota and habitats (including impact on protected nature objects)
Impact on seawater quality and physical indicators of the marine environment
Impact on air quality and climate changes (including outdoor noise)
Impact on the sustainable use of natural resources and resources
No. Measure Description of impact S Description of impact S Description of impact S Description of impact S
8.4 Promoting continuing and hobby education
9. The quantity
and quality of
Estonian
marine
research have
increased
Research work on Estonian sea help better understand the processes in the sea and assess possible impacts on the natural environment when activities are planned to be undertaken in the marine areas and offer more efficient mitigation measures. Supporting research work helps facilitate finding better solutions to conflicts between the natural environment and maritime affairs. Natural environment sea-floor research work improve the existing body of knowledge, fill in gaps and help better preserve valuable natural objects and ensure their protection.
+ Implementation of the measure helps better understand the processes related to seawater quality and physical indicators. This helps assessing the impact of pressures on the marine environment and thereby more efficiently plan developments to be undertaken in the marine areas, monitoring and other activities.
+ Fulfilling the objective and implementing the measure helps to conduct studies on marine environment air quality and climate. It also creates prerequisites for developing cleaner and environmentally sustainable technologies and introducing them in the marine sector.
+ By supporting research work and through development it is possible to create systems, mechanisms, technologies that facilitate the use of natural resources based on sustainability principles which translates into a positive impact in this area.
+
9.1 Supporting marine-related research work
10. Marine tourism
and marine and
coastal business
activities are
developed
Construction of small harbours may have a negative impact on the demersal communities
-/?/+
There is a negative impact on seawater quality because small harbour water transparency decreases and nutrients
-/?/+
Yacht-related marine tourism causes an impact on air quality which is mainly local (in the vicinity of harbours) and seasonal
0 Establishment of the small harbour network will optimise stranding opportunities and help save fuel. However, it is
?

112 Strategic Environmental Assessment of the National Development Plan “Estonian Marine Policy 2012−2020”
Draft Report, 2015.
SEA area
Impact on marine biota and habitats (including impact on protected nature objects)
Impact on seawater quality and physical indicators of the marine environment
Impact on air quality and climate changes (including outdoor noise)
Impact on the sustainable use of natural resources and resources
No. Measure Description of impact S Description of impact S Description of impact S Description of impact S
10.1 Developing of small and fishing ports` infrastructure and recreational craft tourism
and habitats` quality. For more information about the impact occurring during construction works, please refer to measure 2. The impact on the protected areas may exist if an activity is planned on the territory of the particular area or in its vicinity. The strength of the impact depends on the nature of works and their extent. Developing recreational craft tourism may cause an increase in litter in the sea and on the coasts and thereby have a negative impact on habitats and biota. However, developing the existing obsolete small harbours may have also positive impacts and if the capacity to receive waste from ships is developed in the harbours, then littering of the sea by recreational craft may decrease. Also the risk of accident at the
are introduced into the water column during construction works. The topography of the sea-floor and current and wave regime are changed by dredging. The impact of using the infrastructure are related to underwater noise and pollution risk. If the capacity to receive waste and wastewater in harbours is developed, sea pollution may decrease.
in nature. The main impacts are related to possible noise disturbances that are generally short-term and therefore do not cause a significant impact.
not possible to foresee the extent of the impact.
10.2 Improving the development of inland waterways

113 Strategic Environmental Assessment of the National Development Plan “Estonian Marine Policy 2012−2020”
Draft Report, 2015.
SEA area
Impact on marine biota and habitats (including impact on protected nature objects)
Impact on seawater quality and physical indicators of the marine environment
Impact on air quality and climate changes (including outdoor noise)
Impact on the sustainable use of natural resources and resources
No. Measure Description of impact S Description of impact S Description of impact S Description of impact S
small harbours may decrease.
11. The
preservation of
marine cultural
heritage and
traditions is
secured
No direct impact. There may be an indirect positive impact due to valuing the maritime sector and marine environment.
0/+
There may be an indirect positive impact due to valuing the maritime sector and marine environment.
0/+
No impact. 0 Promoting, introducing and marketing of traditional lifestyles of people living on the coast is a positive aspect in this area.
+
11.1 Maintaining marine cultural heritage and valuing maritime sector.
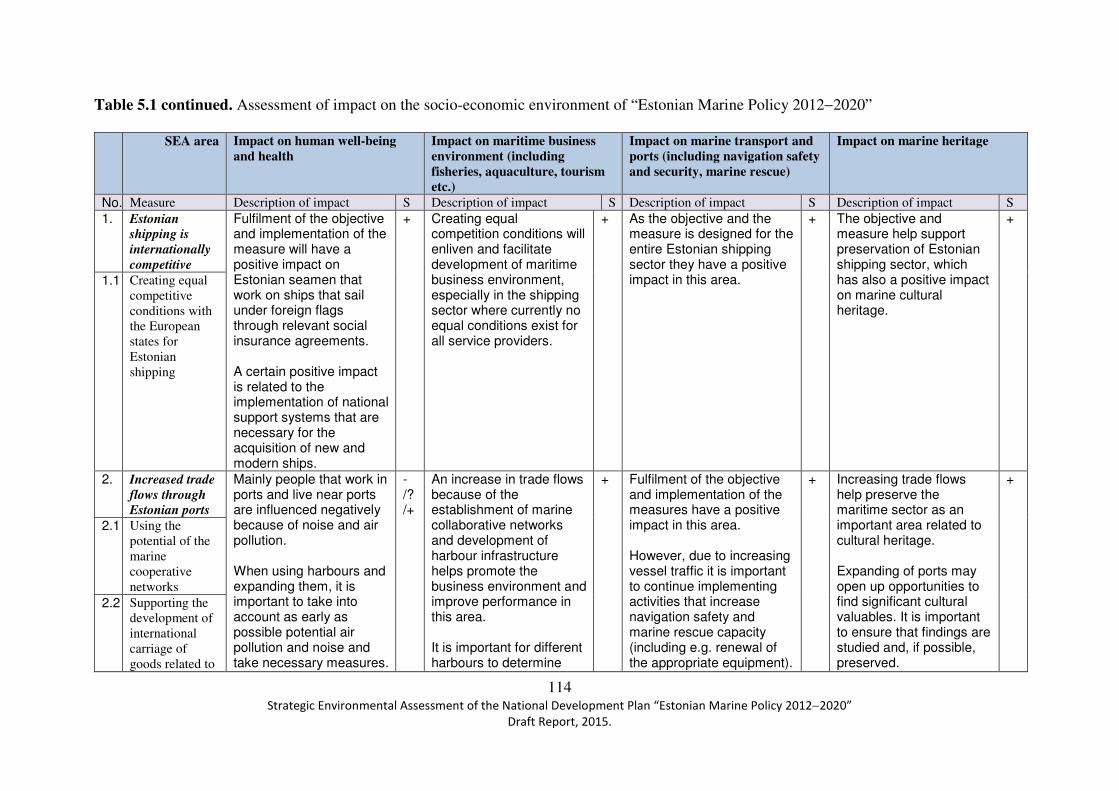
114 Strategic Environmental Assessment of the National Development Plan “Estonian Marine Policy 2012−2020”
Draft Report, 2015.
Table 5.1 continued. Assessment of impact on the socio-economic environment of “Estonian Marine Policy 2012−2020”
SEA area
Impact on human well-being and health
Impact on maritime business environment (including fisheries, aquaculture, tourism etc.)
Impact on marine transport and ports (including navigation safety and security, marine rescue)
Impact on marine heritage
No. Measure Description of impact S Description of impact S Description of impact S Description of impact S
1. Estonian
shipping is
internationally
competitive
Fulfilment of the objective and implementation of the measure will have a positive impact on Estonian seamen that work on ships that sail under foreign flags through relevant social insurance agreements. A certain positive impact is related to the implementation of national support systems that are necessary for the acquisition of new and modern ships.
+ Creating equal competition conditions will enliven and facilitate development of maritime business environment, especially in the shipping sector where currently no equal conditions exist for all service providers.
+ As the objective and the measure is designed for the entire Estonian shipping sector they have a positive impact in this area.
+ The objective and measure help support preservation of Estonian shipping sector, which has also a positive impact on marine cultural heritage.
+
1.1 Creating equal competitive conditions with the European states for Estonian shipping
2. Increased trade
flows through
Estonian ports
Mainly people that work in ports and live near ports are influenced negatively because of noise and air pollution. When using harbours and expanding them, it is important to take into account as early as possible potential air pollution and noise and take necessary measures.
-/?/+
An increase in trade flows because of the establishment of marine collaborative networks and development of harbour infrastructure helps promote the business environment and improve performance in this area. It is important for different harbours to determine
+
Fulfilment of the objective and implementation of the measures have a positive impact in this area. However, due to increasing vessel traffic it is important to continue implementing activities that increase navigation safety and marine rescue capacity (including e.g. renewal of the appropriate equipment).
+ Increasing trade flows help preserve the maritime sector as an important area related to cultural heritage. Expanding of ports may open up opportunities to find significant cultural valuables. It is important to ensure that findings are studied and, if possible, preserved.
+
2.1 Using the potential of the marine cooperative networks
2.2 Supporting the development of international carriage of goods related to
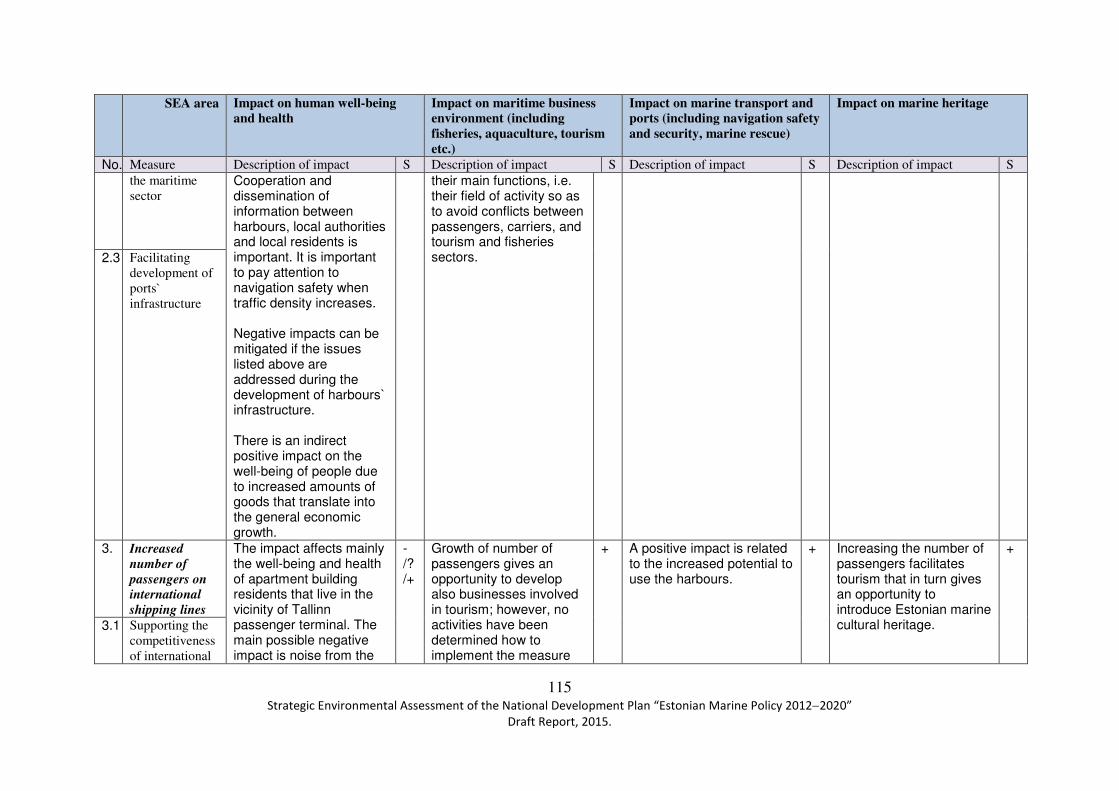
115 Strategic Environmental Assessment of the National Development Plan “Estonian Marine Policy 2012−2020”
Draft Report, 2015.
SEA area
Impact on human well-being and health
Impact on maritime business environment (including fisheries, aquaculture, tourism etc.)
Impact on marine transport and ports (including navigation safety and security, marine rescue)
Impact on marine heritage
No. Measure Description of impact S Description of impact S Description of impact S Description of impact S
the maritime sector
Cooperation and dissemination of information between harbours, local authorities and local residents is important. It is important to pay attention to navigation safety when traffic density increases. Negative impacts can be mitigated if the issues listed above are addressed during the development of harbours` infrastructure. There is an indirect positive impact on the well-being of people due to increased amounts of goods that translate into the general economic growth.
their main functions, i.e. their field of activity so as to avoid conflicts between passengers, carriers, and tourism and fisheries sectors. 2.3 Facilitating
development of ports` infrastructure
3. Increased
number of
passengers on
international
shipping lines
The impact affects mainly the well-being and health of apartment building residents that live in the vicinity of Tallinn passenger terminal. The main possible negative impact is noise from the
-/?/+
Growth of number of passengers gives an opportunity to develop also businesses involved in tourism; however, no activities have been determined how to implement the measure
+ A positive impact is related to the increased potential to use the harbours.
+ Increasing the number of passengers facilitates tourism that in turn gives an opportunity to introduce Estonian marine cultural heritage.
+
3.1 Supporting the competitiveness of international

116 Strategic Environmental Assessment of the National Development Plan “Estonian Marine Policy 2012−2020”
Draft Report, 2015.
SEA area
Impact on human well-being and health
Impact on maritime business environment (including fisheries, aquaculture, tourism etc.)
Impact on marine transport and ports (including navigation safety and security, marine rescue)
Impact on marine heritage
No. Measure Description of impact S Description of impact S Description of impact S Description of impact S
carriage of passengers
port in combination with street traffic noise. Increased possible noise level during port development must be assessed and, if necessary, mitigation measures must be taken. In addition to Tallinn passenger terminal, it is important to note that also the town centre quay is reconstructed in Pärnu to improve the capacity to receive cruise ships. There is an indirect positive impact on people`s well-being due to increased number of passengers through general economic growth.
that could help improve information dissemination to tourism service providers on land and marine tourists. For sure, it is necessary to disseminate information on local sights, accommodation, catering etc. more extensively to cruise ship as well as recreational craft tourists. It is necessary to improve information dissemination about accessibility of services so that passengers and tourists know where to stop and which sights to visit etc.
4. Estonian
shipbuilding
and repair
operations are
internationally
competitive
The impact is mainly related to air pollution and noise caused by production or repair. These are mainly small businesses. No significant impact due to following
0/+
The measures that help to make shipbuilding and repair more competitive have a positive impact which is achieved by developing the collaborative network and small harbours by adding
+ The impact is positive because new and modern craft are taken into use.
+ The impact is positive because maintaining historical businesses in Estonia is supported.
+
4.1.
Increasing competitiveness

117 Strategic Environmental Assessment of the National Development Plan “Estonian Marine Policy 2012−2020”
Draft Report, 2015.
SEA area
Impact on human well-being and health
Impact on maritime business environment (including fisheries, aquaculture, tourism etc.)
Impact on marine transport and ports (including navigation safety and security, marine rescue)
Impact on marine heritage
No. Measure Description of impact S Description of impact S Description of impact S Description of impact S
of shipbuilding and repair (including designing)
health protection standards is not foreseen. There is an indirect impact on the well-being of people through the general economic growth.
them capacity to provide repair works and obtaining necessary production equipment. Additional jobs will be created due to the development of shipbuilding sector.
4.2 Increasing recreational craft building and repair
5. The safety and
security in
vessel traffic
and in ports has
improved
A positive impact is related to the general increase in safety and security. It is also important that implementing measures 5.7 and 5.8 has a direct positive impact on human health because the functioning of marine search and rescue is improved.
+ Performing hydrographic surveys, renovation of navigation marks and establishing the relevant database, improving technical supervision and improving ship traffic servicing contribute to safer waterways and optimal passage. When new icebreakers are obtained, the waterways will be open for a longer period and this facilitates bigger goods and passenger flows during winter.
+
A positive impact in the area when the objective is fulfilled and all measures are implemented.
+ Hydrographic surveys and establishment and reconstruction of waterways will primarily have a positive impact. When the mentioned measure is implemented, it is possible to better map the sea-floor and obtain information about underwater cultural valuables in the sea (e.g. wrecks). It is important to cooperate with the National Heritage Board on how to study and conserve findings.
+
5.1 Performing hydrographic surveys
5.2 Creating and reconstruction of waterways
5.3 Collection, processing and forwarding of navigational information
5.4 Development of navigational marks
5.5 Improving the Vessel Traffic Service (VTS).
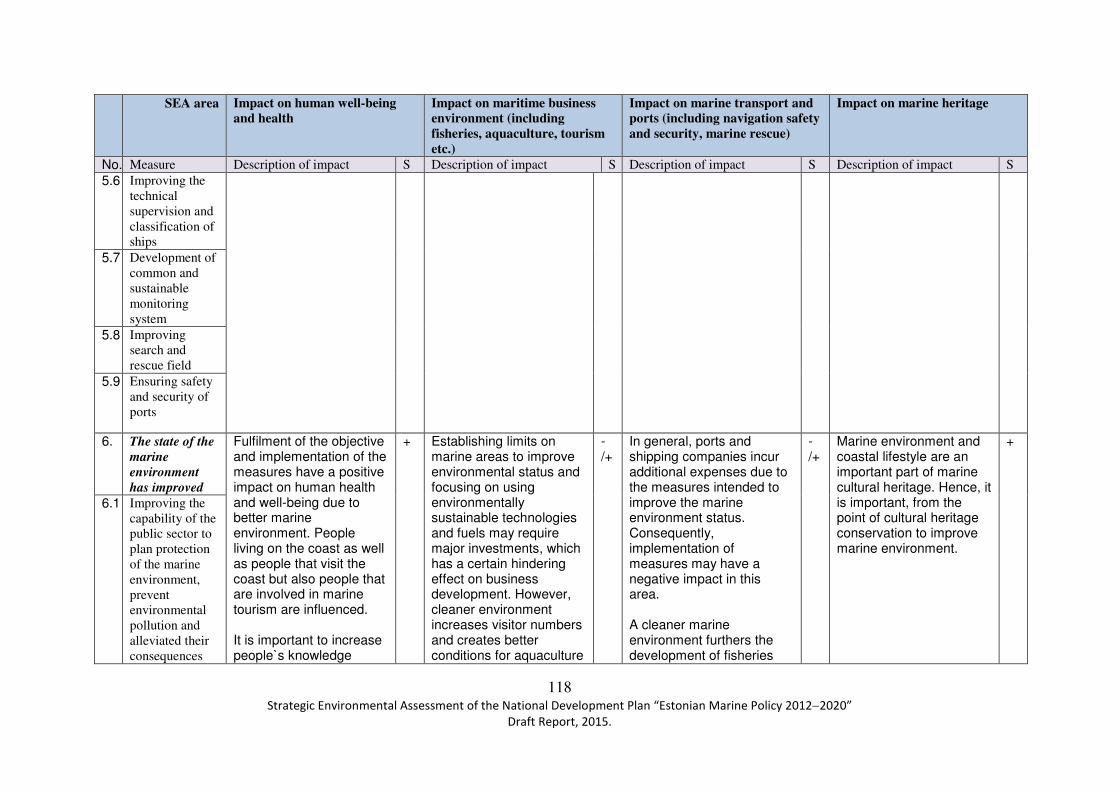
118 Strategic Environmental Assessment of the National Development Plan “Estonian Marine Policy 2012−2020”
Draft Report, 2015.
SEA area
Impact on human well-being and health
Impact on maritime business environment (including fisheries, aquaculture, tourism etc.)
Impact on marine transport and ports (including navigation safety and security, marine rescue)
Impact on marine heritage
No. Measure Description of impact S Description of impact S Description of impact S Description of impact S
5.6 Improving the technical supervision and classification of ships
5.7 Development of common and sustainable monitoring system
5.8 Improving search and rescue field
5.9 Ensuring safety and security of ports
6. The state of the
marine
environment
has improved
Fulfilment of the objective and implementation of the measures have a positive impact on human health and well-being due to better marine environment. People living on the coast as well as people that visit the coast but also people that are involved in marine tourism are influenced. It is important to increase people`s knowledge
+ Establishing limits on marine areas to improve environmental status and focusing on using environmentally sustainable technologies and fuels may require major investments, which has a certain hindering effect on business development. However, cleaner environment increases visitor numbers and creates better conditions for aquaculture
-/+
In general, ports and shipping companies incur additional expenses due to the measures intended to improve the marine environment status. Consequently, implementation of measures may have a negative impact in this area. A cleaner marine environment furthers the development of fisheries
-/+
Marine environment and coastal lifestyle are an important part of marine cultural heritage. Hence, it is important, from the point of cultural heritage conservation to improve marine environment.
+
6.1 Improving the capability of the public sector to plan protection of the marine environment, prevent environmental pollution and alleviated their consequences

119 Strategic Environmental Assessment of the National Development Plan “Estonian Marine Policy 2012−2020”
Draft Report, 2015.
SEA area
Impact on human well-being and health
Impact on maritime business environment (including fisheries, aquaculture, tourism etc.)
Impact on marine transport and ports (including navigation safety and security, marine rescue)
Impact on marine heritage
No. Measure Description of impact S Description of impact S Description of impact S Description of impact S
6.2 Reduction of environmental load related to ships and ports
about how humans influence marine environment status and what everybody can do to improve marine environment status. One topic is reducing litter that is introduced into the sea from the coast (including beaches).
in the marine areas. In addition, it ensures that quotas are applied on fish stocks that ensures long- term sustainability of fisheries as a business sector.
and tourism etc. that in turn improves the development potential of ports. Hence, in long term the impact may be considered positive.
7. The marine
sector
management
and marine
regulations are
more effective
By improving the national organisation of maritime sector, it is possible to optimise and update legal drafting concerning air quality and noise. However, it is possible through marine area spatial planning to take into account the wishes of various interest groups and thereby improve their well-being.
+ Improving legal background gives business owners certainty to act in the relevant area and improves competitiveness by supporting the development of this area.
+ Fulfilment of the objective and implementation of measures harmonise and update legal drafting concerning marine transport and ports. It is possible to map and set objectives for the development of this area through spatial planning.
+ A systematic legal drafting makes it possible to take into account cultural heritage aspects. Spatial planning helps to map objects related to cultural heritage and specify conditions to protect and conserve them.
+
7.1 Improving the efficiency of organisation of the marine affairs by the state
7.2 Spatial planning of marine areas
7.3 Amending the marine-related legislation
Estonian
marine
education and
research and

120 Strategic Environmental Assessment of the National Development Plan “Estonian Marine Policy 2012−2020”
Draft Report, 2015.
SEA area
Impact on human well-being and health
Impact on maritime business environment (including fisheries, aquaculture, tourism etc.)
Impact on marine transport and ports (including navigation safety and security, marine rescue)
Impact on marine heritage
No. Measure Description of impact S Description of impact S Description of impact S Description of impact S
development
are up to
date 8. Development
and implementation of the marine education concept
No direct impact. There is an indirect impact on human well-being through expanding of educational opportunities and also through potential economic growth that comes from the development of marine education.
0/+
Promotion of marine education supports returning to the labour market of competent technicians, mechanics, engineers, seamen etc. This contributes to the development of fisheries, shipping, shipbuilding and repair business as a whole.
+ Fulfilment of the objective and implementation of the measures have a positive impact because of growing a qualified labour force.
+ Continued marine education helps maintain and preserve the lifestyle related to the sea and thereby marine cultural heritage.
+
8.1 Promoting vocational education
8.2 Promoting higher education
8.3 Promoting continuing and hobby education
8.4 The quantity
and quality of
Estonian
marine
research have
increased 9. Supporting
marine-related research work
Development and implementation of cleaner and environmentally sustainable technologies in the marine sector has a positive impact on human health and well-being, e.g. using technologies that
+ Research work development contributes to introduction of better and modern technologies in shipping and marine sectors, having a positive environmental impact.
+ Development of marine research and technologies help introduce modern technologies that enable decelerate worsening of marine environment status.
+ Conducting research and performing research work helps better understand and preserve everything related to marine cultural heritage.
+
9.1 Marine tourism
and marine and
coastal business
activities are
developed
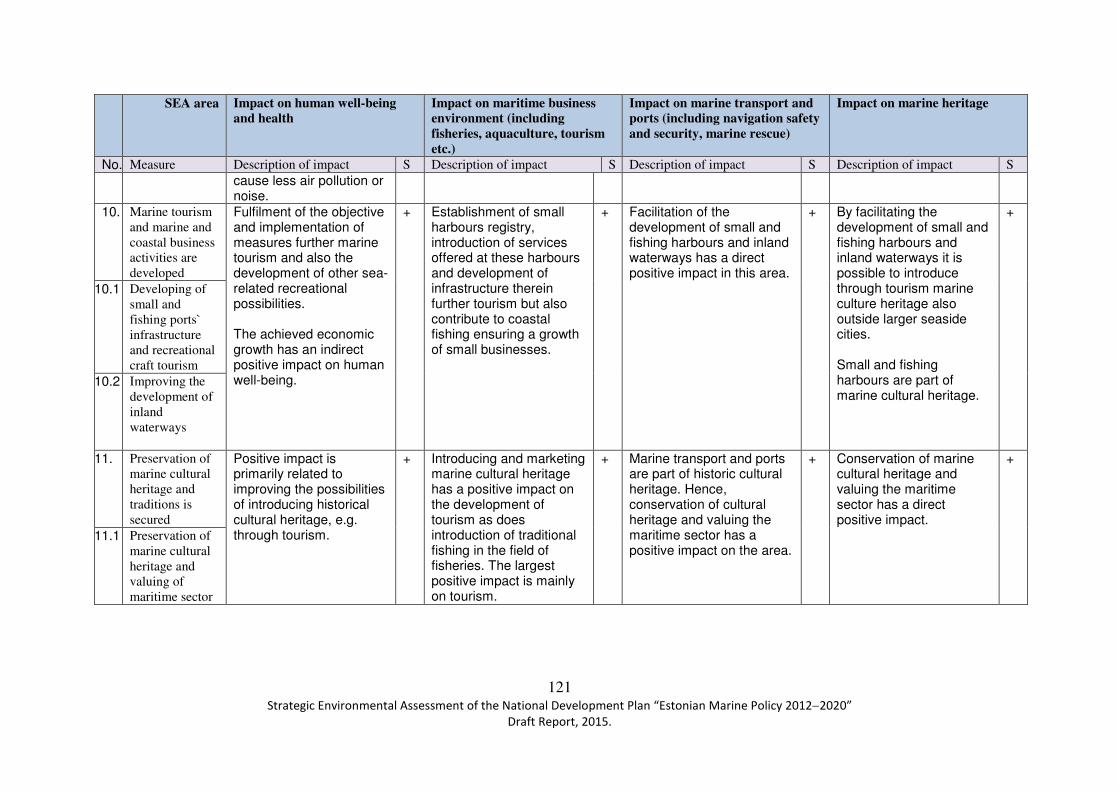
121 Strategic Environmental Assessment of the National Development Plan “Estonian Marine Policy 2012−2020”
Draft Report, 2015.
SEA area
Impact on human well-being and health
Impact on maritime business environment (including fisheries, aquaculture, tourism etc.)
Impact on marine transport and ports (including navigation safety and security, marine rescue)
Impact on marine heritage
No. Measure Description of impact S Description of impact S Description of impact S Description of impact S
cause less air pollution or noise.
10. Marine tourism and marine and coastal business activities are developed
Fulfilment of the objective and implementation of measures further marine tourism and also the development of other sea-related recreational possibilities. The achieved economic growth has an indirect positive impact on human well-being.
+ Establishment of small harbours registry, introduction of services offered at these harbours and development of infrastructure therein further tourism but also contribute to coastal fishing ensuring a growth of small businesses.
+ Facilitation of the development of small and fishing harbours and inland waterways has a direct positive impact in this area.
+ By facilitating the development of small and fishing harbours and inland waterways it is possible to introduce through tourism marine culture heritage also outside larger seaside cities. Small and fishing harbours are part of marine cultural heritage.
+
10.1 Developing of small and fishing ports` infrastructure and recreational craft tourism
10.2 Improving the development of inland waterways
11. Preservation of marine cultural heritage and traditions is secured
Positive impact is primarily related to improving the possibilities of introducing historical cultural heritage, e.g. through tourism.
+ Introducing and marketing marine cultural heritage has a positive impact on the development of tourism as does introduction of traditional fishing in the field of fisheries. The largest positive impact is mainly on tourism.
+ Marine transport and ports are part of historic cultural heritage. Hence, conservation of cultural heritage and valuing the maritime sector has a positive impact on the area.
+ Conservation of marine cultural heritage and valuing the maritime sector has a direct positive impact.
+
11.1 Preservation of marine cultural heritage and valuing of maritime sector

5.2 Summaries of area-specific impact analysis and proposals
5.2.1 Impact on seawater quality and physical indicators of the marine environment
Safer vessel traffic and related infrastructure and promoting of environmental management have positive impacts on seawater quality and physical indicators. Negative impacts are related to expanding of ports and dredging waterways and more intensive sea transport. However, dredging of waterways is often necessary to ensure navigation safety regardless of the number of ships that travel along the particular waterway. If various organisational measures are implemented (for example, more extensive use of LNG as ship fuel, development of ports` capacity to receive waste and wastewater etc.) then regardless of more intensive vessel traffic, the impacts on seawater quality and physical indicators may not increase (except for underwater noise). Measure 5.1 (performing hydrographic surveys), measures 5.3−5.9 (various measures that improve navigation safety), the measures of objective 6 (the state of the marine environment has improved), the measures of objective 7 (the marine sector management and marine regulations are more effective) and the measure of objective 9 (the quantity and quality of Estonian marine research have increased) have a positive impact. The measures of objective 2 (increased trade flows through Estonian ports), the measures of objective 3 (increased number of passengers on international shipping lines) and measure 10.1 (developing of small and fishing ports` infrastructure and recreational craft tourism) may have a negative effect. The negative impact that may be expected from measure 10.1 that is related to recreational craft and small harbours is significantly smaller than when the two above mentioned objectives are implemented. If suitable organisational measures are implemented, negative impacts can be mitigated. Implementation of objective 1 (Estonian shipping is internationally competitive) and objective 8 (development and implementation of marine education concept) has a positive impact. Implementation of objective 4 may have a local negative impact due to several chemicals (painting, bottom paint). Objective 11 (preservation of marine cultural heritage and traditions is secured) does not have a significant impact. An indirect positive impact may occur from recognising the maritime sector and marine environment. Implementation of measure 5.2 (establishing and reconstructing waterways) has both a negative and a positive impact. The negative effect occurs during the establishment/dredging of waterways. More intensive marine transport in sensitive areas (Väinameri) during the exploitation of waterways may be considered to have a negative impact. However, the general impact of the measure is positive. Vessel traffic is made more systematic and safer and the waterway schemes are updated which decreases the probability of accidents. The measures of objective 5 (the safety and security in vessel traffic and in ports has improved), 6 (the state of the marine environment has improved), 7 (the marine sector management and marine regulations are more effective) and 9 (the quantity and quality of Estonian marine research have increased) have an overall positive effect. We will now
123 Strategic Environmental Assessment of the National Development Plan “Estonian Marine Policy 2012−2020”
Draft Report, 2015.
review the impacts on seawater quality and physical indicators when the rest of the development plan is implemented by components and pressures that influence them:
• Bathymetry, nature of sea-floor and coast and influences (stilting, covering, smothering, removal, changing coastline). Physical damage (covering, removing) is caused during dredging and dumping works. When ports are constructed or expanded, the portion of natural coast in Estonian coastal sea is reduced, transport of sediments may be blocked and coastline may be changed. During the development of ports, there may be a need to use sand deposits, i.e. removal of seafloor. Taking into account the amount of sand resources in the existing deposits, there is no need to open new deposits. Taking into account the area of Estonian marine areas and the length of the coastline, there is no grounds to believe that the implementation of the Marine Policy would cause significant irreversible negative changes in the bathymetry and nature of the coast of Estonian marine areas. Although the overall impact on Estonian marine area is not significant, local negative impacts of developments may be significant. To have a better overview of excavation, dredging and dumping operations in the Estonian marine area, it is proposed to establish a relevant database. Currently there exists an information system of environmental permits but it does not allow making larger inquiries which means that currently there does not exist a comprehensive overview how the mentioned human activities influence the distribution, bathymetry and sea-floor relief of the Estonian marine areas. At the same time, there is no comprehensive quantitative assessment of the impact of these works on water quality and ecology. Väike väin dyke is hydraulic engineering that has the biggest environmental impact in Estonian marine areas. This structure divides the water mass and biota of the Gulf of Riga from Väinameri. Estonian Marine Institute of Tartu University (2009) has not suggested making openings in the dyke as a measure to improve the coastal sea status. However, the study has not either presented a negative environmental impact that would be caused by making these openings. There will be long-term positive environmental impacts on the marine environment, especially on local water exchange and fish migration. Hence, the expert group does not see any reason why making openings in the dyke should not be considered. Particularly taking into account the fact that the local authorities are very interested in it.
• Temperature, salinity, stratification, ice cover. The listed characteristics are very important for the ecological system of our marine areas. There are only minimal impacts on temperature, distribution of salinity and stratification that are local in nature and are insignificant compared to natural variations. The impacts are related to influencing bathymetry and the nature of sea-floor and coast. The growth of vessel traffic has an impact on ice cover. The extent of this impact needs to be determined. Based on the existing information, there is no reason to believe that the growth of vessel traffic would significantly change ice situation in our area, especially if the Maritime Administration continues to suspend ship traffic in the area of Väinameri and Kihnu strait as it has done every winter.
• Hydrodynamics. An impact on water level, waves and currents is related to the influence on bathymetry and the nature of sea-floor and coast. The negative impact is not significant for the entire Estonian marine area. However, local negative impact of developments may be significant. A positive impact may occur if openings are made into the Väike väin dyke thereby reducing the blocking effect of this artificial structure on water and nutrient exchange and ecological components of the sea. The extent of the impact should be studied with the current and substance distribution model that is verified by the measurements in Väike väin. Then the effect on the

124 Strategic Environmental Assessment of the National Development Plan “Estonian Marine Policy 2012−2020”
Draft Report, 2015.
ecological components can be assessed. The last similar study in Väike väin (TÜ Eesti Mereinstituut, 2009) has presented a conclusion that making openings will not have a significant impact on environmental status. However, the same study notes that it would improve water exchange close to the dyke where water exchange is currently weak. The study also reveals that current velocity will increase to some extent near the dyke and there will be a positive impact on fish migration.
• Nutrients (and enrichment with nutrients) and oxygen. Nutrients are released from sediments that are introduced into the water column during dredging or excavation operations. Based on the previous monitoring data (e.g. Muuga Port marine monitoring), there is no grounds to believe that the balance of nutrients and oxygen distribution in Estonian marine area would be significantly influenced when the development plan is implemented. Local negative impacts may be significant, especially if the volume of dredging is extensive or it it is done in very shallow and/or closed marine areas. Therefore, the suggestion is to continue the tradition envolved during the environmental impact assessment process that dumping operations are not performed in shallow areas close to the coast. An exception is regions with active sediment transport where it is reasonable to put the dredged material on the coast or near cost to reduce sediment deficit caused by dredging. In addition to dredging operations, the growth of nitrogen atmospheric deposition due to increased traffic and wastewater from ships influences eutrophication. However, there are measures presented in the marine strategy`s programme of measures that address these problems.
• Underwater noise. Underwater noise is caused by developing of ports and increased vessel traffic. Implementation of the development plan increases anthropogenic noise in the Estonian marine area. However, it is not possible to assess currently the significance of its negative impact on the entire natural environment of the marine area. Adding underwater noise monitoring to the national monitoring programme should be considered. When preparing the monitoring programme, the results of LIFE+ project “Baltic Sea Information on the Acoustic Soundscape” (BIAS) could be used as the basis.
• Hazardous substances (except oil pollution from ships). There may be a certain local negative impact when during developing of ports the dredged soil is polluted (oil products, heavy metals). Such cases are not frequent in Estonian ports, consequently the negative impact on the Estonian marine area as a whole is not significant. It is possible to minimise local negative impacts with mitigation measures because hazardous substances are usually determined during the environmental impact assessment phase. In Estonian marine areas, there is no operative radionuclides monitoring and water samples are taken only once a year to test radionuclides. As there are nuclear power plants on the coast of Estonia`s neighbouring countries, it is suggested to install in the Gulf of Finland at least one autonomous device that sends real-time radioactivity data.
• Marine litter; intentional or systematic introduction of solid substances into the marine environment. There is a certain risk of a negative impact due to more intensive vessel traffic but is has been mitigated by objectives 6 and 7. There are also several mitigation measures presented in the marine strategy`s programme of measures.
• Oil pollution from ships. Increased vessel traffic volumes cause an increased risk of accidents and ensuing pollution. Vessel traffic increases on the entire Baltic Sea. It has been forecast that by 2030 the number of ships sailing on the Baltic Sea will double (compared to 2010) and the amount of oil products carried increases 64% (WWF Baltic
125 Strategic Environmental Assessment of the National Development Plan “Estonian Marine Policy 2012−2020”
Draft Report, 2015.
Ecoregion Programme, 2010). The risks caused by the growth of traffic are primarily mitigated by objectives 5−−−−7 of the development plan. In the marine areas close to Estonian coast, traffic will be more intensive, especially in the entryways of larger ports and the designed waterways. However, designing of waterways helps make traffic more systematic and safer. A significant vessel traffic growth has been forecast for Väinameri if the project to dredge the waterway there is realised. If the waterway is opened to ships with draught up to 5.5 meters, vessel traffic in this area will increase four times, or up to 1,100 ships in a year (Ramboll Eesti AS, 2008). In the referenced environmental impact assessment is has been found that because this area is a sensitive marine area, transport of solid or liquid chemicals, including oil products (transit), on the reconstructed waterway is not acceptable from the nature conservation aspect. A detailed environmental impact assessment has been prepared on the relevant waterway because extensive dredging works were planned during the reconstruction, which is a significant environmental impact activity according to the Environmental
Impact Assessment and Environmental Management System Act. It is important to note that the construction of waterways (marking) without dredging > 10,000 m3 is not currently deemed to be an activity with a significant environmental impact according to Estonian legislation. It is suggested to classify establishment of a waterway as an activity with a significant environmental impact. Establishment of ports is considered an activity with a significant environmental impact if the port is intended to service ships with displacement over 1,350 tons. The same limit could be used as a critical value of environmental impact when waterways are constructed.
In order to increase the positive impacts and alleviate negative impacts of the Estonian Marine Policy on seawater quality and physical indicators, the expert group makes a proposal to add the following activities to the measures of objective 6 in the implementation plan for the new period:
• Currently dredging and dumping works are reviewed one by one from the environmental aspect, but knowledge about the total impact and extent of the pressure on the marine environment of these works is insufficient. Therefore, it is proposed to establish a common database of on the water excavation and dredging and dumping operations. This database would give a whole picture of the works that modify the coast and sea-floor that are carried out in the Estonian marine area and it could be used for spatial planning, environmental impact assessments of property developments and monitoring. The database should include information about presumed volume of dredging (dumping) (in the special use of water permit application phase), the actual dredged volume (will be clear after the works are completed), integration of sediments and content of hazardous substances in sediments. If the works have been monitored, the database should include references to monitoring reports.
• We suggest to maintain the tradition (that has evolved during environmental impact assessment process) of no dredging works in shallow close-to coast regions. For that purpose, the distribution of dumping grounds in the Estonian coastal sea should be reviewed (Figure 2.19, 2.3.1) and, if necessary, changed. An exception is regions with active sediment transport where it may be reasonable to put dredged material on the coast or near the coast to reduce sediment deficit (the relevant proposal may be made by the environmental impact assessment expert group). Estonia has to take an inventory of dumping grounds according to the London convention.
• It is proposed to add underwater noise monitoring to the national monitoring programme. Currently there is no assessment of the negative effect caused by this

126 Strategic Environmental Assessment of the National Development Plan “Estonian Marine Policy 2012−2020”
Draft Report, 2015.
pressure in Estonian marine areas. The results of LIFE+ project “Baltic Sea Information on Acoustic Soundscape” (BIAS) can be taken as the basis when preparing the monitoring programme.
• We suggest to classify establishment of waterways intended for ships with displacement >1,350 tons as an activity of significant environmental impact. According to current legislation, establishment of waterways (if at least 10,000 m3 is not dredged) is not considered an activity having a significant environmental impact which requires carrying out the environmental impact assessment. When establishing waterways, the environmental protection aspects should be taken into account and their impact could be assessed in marine areas spatial planning.
• As there are nuclear power plants on the coast of Estonia`s neighbouring countries, it is suggested to install in the Gulf of Finland at least one autonomous measuring device that sends real-time radioactivity data. This could be integrated into the first Baltic Sea offshore autonomous monitoring station close to Keri Island.
• The largest environmental impact caused by a hydraulic engineering in Estonian marine areas is Väike väin dyke. The impact of this structure can be mitigated if openings are made into the dyke. This would reduce the blocking effect of this artificial structure on water and substance exchange and ecological components of the sea. The extent of the impact should be studied prior with current and substance distribution models that are verified by monitoring data from Väike väin. Then the impact on the ecological components can be assessed. The local residents are also interested in putting openings in the dyke. We suggest to analyse the possible impact on the marine environment of making openings in Väike väin dyke.
5.2.2 Impact on marine biota and habitats (including impact on protected nature objects)
Implementation of measures 2.2 (supporting the development of international carriage of goods related to the marine affairs), 2.3 (facilitating the development of ports infrastructure), 3.1 (supporting the competitiveness of international carriage of passengers), 5.2 (creating and reconstructing waterways), 10.1 (developing of small and fishing ports` infrastructure and recreational craft tourism) may have a negative impact on habitats and marine biota, including protected nature objects (also Natura 2000). The main negative impact is related to the construction works of ports and waterways and more intesive vessel traffic. The main risks are dredging operations, deterioration of water quality (reduced water transparency, suspended solids, introduction of organic substances and pollutants into water), noise, risk of oil pollution and invasion of non-indigenous species. Dredging of waterways and ports cause direct damage to the sea-floor and habitats and communities that can be found there. Deterioration of water quality may damage habitat condition, cause replacement of species sensitive to eutrophication with more tolerant species and loss of diversity, damage fish spawns and reduce the depth limit of demersal flora etc. Deterioration of water transparency influences also birds that have to dive after food. Pollutants that have been released into water may damage the condition of the biota. Pollutants may get to the top organisms of the food chain (grey seal, ringed seal, white-tailed eagle) and cause them health problems.

127 Strategic Environmental Assessment of the National Development Plan “Estonian Marine Policy 2012−2020”
Draft Report, 2015.
Outdoor noise caused by construction works is a dangerous pressure on birds during their nesting period because it may cause them to leave their nesting areas. Depending on strength, underwater noise may disturb fish, diving ducks (long-tailed duck, common eider) and marine mammals (grey seal and ringed seal). If various organisational measures (for example, more extensive use of LNG as ship fuel, developing the capacity of ports to receive waste and wastewater etc.) are applied, the impacts on marine biota should not increase despite more intensive vessel traffic (expect underwater noise). Dredging of waterways is often necessary to ensure navigation safety regardless of the number of ships that use the waterway. If it is necessary to dredge (or clean sediments from traffic areas) in some traffic areas to ensure navigation safety, particular demersal habitats may be damaged during the works, but at the same time dredging reduces significantly the risk of ships running on the rock or aground, thereby reducing the risk of fuel leakage. Based on the conducted studies, it can be concluded that the impact on zoobenthos is short-term, but the following effect may last up to two years. The communities recover by immigration from neighbouring areas. Possible impact on the structure of fish communities, fish stocks, spawns and fishing operations is related usually to the generation of suspended solids but also changes in the bottom substrate (removal). Monitoring data after dredging and excavation show that the impact on the environment is significant, although short-term (a couple of years) and is local in nature. An exception is harbour basins and marine areas and fairways in vicinity. The depths are controlled in harbour basins and fairways (if necessary, with repeated dredging). Measures 5.3−5.9 that are mostly related to ensuring safe navigation, 6.1 (improving the capability of the public sector to plan protection of the marine environment, prevent environmental pollution and alleviated their consequences), 6.2 (reduction of environmental load related to ships and ports), 7.2 (spatial planning of marine areas), 7.3 (amending the marine-related legislation), 9.1 (supporting maritime research work) have a positive impact. The measures are intended to help preserve the marine environment, improve its status and ensure its protection, reduce pressure of risks on the natural environment and improve legislative basis. Measure 6.1 helps fulfil the requirements set down in the Marine Strategy Framework Directive. If objective 8 (Estonian education system provides modern training in balanced volume of specialists necessary for all fields of the marine sector) and measures to achieve it are implemented, an indirect positive impact may be expected if the marine education concept is designed to help preserve the marine environment and achieve its good status and discusses nature conservation aspects. To increase the positive impacts of the Estonian Marine Policy development plan, the expert group makes a proposal to add to objective 6 the following activities:
• It is proposed to prepare management plans for protected areas, primarily for national parks and Natura 2000 areas and add this activity to measure 6.1. Currently many protected areas have no management plan, which makes it harder to achieve conservation objectives.
• It is proposed to support developing the existing Estonian Nature Information System (Eestimaa Looduse Infosüsteem - EELIS), improving it and presentation of information and add this activity to measure 6.1. Valuable data have been collected in Estonia on habitats and biota (range, area, condition, risk factors etc.) during

128 Strategic Environmental Assessment of the National Development Plan “Estonian Marine Policy 2012−2020”
Draft Report, 2015.
various projects but these data are not included in the official database. Data are deficient or do not reflect the actual situation regarding some areas.
5.2.3 Impact on air quality (including outdoor noise) and climate change
According to section 2.1.6, air pollution and noise originating from marine transport influences significantly air quality and climate at large. The Baltic Sea is appointed as a SECA where stricter norms apply on sulphur content of ship fuels compared to non-SECA. The main outdoor noise (but also air pollution) problems related to shipping sector are present in port areas. Based on the above, it is important to continue making efforts to reduce air pollution and noise caused by shipping. Area-specific analysis of the objectives and measures set by the development plan “Estonian Marine Policy 2012−2020” (see table 5.1, section 5.1) showed that most objectives and measures help directly or indirectly improve air quality (e.g. objective 6: the state of the marine environment has improved) or do not have a significant impact thereon (e.g. objective 11: the preservation of marine cultural heritage and traditions is secured). An exception is objectives 2 and 3 that promote increasing of goods and passenger volumes and, if realised, will increase vessel traffic that may cause a negative impact due to a worsening air quality and noise situation, especially in ports. As there have been air quality (mainly unpleasant smell in cargo ports where air quality problems are not caused by vessel traffic but the cargo handled in ports) as well as noise (in passenger and cargo ports) problems near larger ports, air quality and noise aspects must be analysed in case of increased cargo and passenger flows and when developing ports and necessary measures must be taken. The specific features of the location of the particular port must be taken into account. Air quality and climate change require introduction of cleaner ship fuels, e.g. LNG. According to a study conducted in Estonian Maritime Academy of Tallinn University of Technology (TTÜ Eesti Mereakadeemia) (2015), LNG as a type of ship fuel is radically different from traditional liquid fuels produced from oil (or e.g. shale oil) or biological liquid fuels in terms of properties, handling and using in engines. Therefore, it is not possible to use LNG on the existing ships that operate on liquid fuels without labour-intensive and expensive reconstruction. Furthermore, port infrastructures that have been developed over decades do not meet the requirements for storing, processing and bunkering LNG. Consequently, transition in the shipping sector from liquid fuels to natural gas is inevitably a long-term process and for at least 20−30 years traditional liquid fuels will remain dominant – regardless of all the benefits that using LNG offers. Upon introduction of LNG on ships, the volume of exhaust gases released into air compared to traditional liquid fuels significantly decreases (SOx - 99%; NOx - 90%; CO2 - 25%; PM - 99%) and fuel savings increase. The study analysed the option of installing scrubbers on ships that operate on heavy fuel, but LNG was preferred because of environmental sustainability and profitability. In summary, the study by Tallinn University of Technology Estonian Marine Academy (2015) has come to the following conclusion: “There is a sufficient potential to use LNG and a necessary pressure on the market that introduction of LNG could continuingly develop on sea and on land. From the point of the marine environment, using LNG as ship fuel is much more environmentally sustainable as the current main liquid fuels used on the Baltic Sea, and in the opinion of the authors, introduction of LNG as ship fuel is an important measure in reducing atmospheric pollution caused by shipping. However, from the climate warming aspect, attention has been drawn to the fact that LNG is natural gas that contains methane (Oregon Sierra Club, 2014). Methane is a very significant greenhouse gas. Methane

129 Strategic Environmental Assessment of the National Development Plan “Estonian Marine Policy 2012−2020”
Draft Report, 2015.
leakage is possible in different stages of LNG production, transport and other activities that have a negative impact on the climate warming. Besides, production of LNG is an energy-intensive process. Consequently, in fighting climate warming, using LNG may be inefficient, but given that the LNG topic is quite new, it is not yet possible to make conclusions. There is no need to include a measure to facilitate introduction of LNG as ship fuel in the new implementation plan of the development plan “Estonian Marine Policy 2012−2020” because it is included in the Marine Strategy`s programme of measures. Based on the above, the author of this report does not see any need to highlight any possible topics that have not been discussed in the development plan.
130 Strategic Environmental Assessment of the National Development Plan “Estonian Marine Policy 2012−2020”
Draft Report, 2015.
5.2.4 Impact on sustainable use of natural resources and resources
Most objectives and measures set in the development plan of the “Estonian Marine Policy 2012−2020” have a positive environmental impact on sustainable use of natural resources and resources. Implementation of measure 2.1, which is designed to improve the functioning of sea-related collaborative networks that will not only increase the flow of goods but also improve use of the fleet during cargo transport, has a positive aspect. More efficient sea transport of goods primarily helps to save fuel. Growing use of container goods accelerates loading and unloading of cargo, enabling ports to handle larger cargo flows. A positive aspect in shipbuilding and repair sector is supporting contribution to new and more sustainable technologies and adding repair capacity to small harbours. If measures of objective 5 are implemented, it is possible to optimise waterway trajectories, traffic density and increase safety by renewing navigation marks, performing hydrographic surveys and improving data exchange systems. Objective 6 includes also introduction of environmentally sustainable ships, reduction of emission amounts and introduction of pollution control systems (including acquisition of pollution control fleet) that will have a positive environmental impact in short term as well as long term in this area. Measures 7.2 and 7.3 ensure protection of areas that are important from the nature conservation aspect and imposing limits that apply to these areas. These measures have been partly implemented: Hiiu and Pärnu marine areas are covered by a spatial plan by now (however, the plans have not yet been adopted). Measures 8 and 9 contribute indirectly to sustainable use of natural resources and consumption of energy by educating people involved in the maritime sector and increasing the volume of research work in this area because it helps to introduce newer and more sustainable technologies to the marine sector. A negative aspect is related to objective 3, which is designed to increase the flow of passengers on the Baltic Sea. It is a fact that growth in the number of passengers causes greater consumption but also increased generation of waste that does not support the implementation of sustainable development principles. It is necessary to develop in ports the capacity to receive waste and wastewater from cruise ships to reduce the impact of cruise tourism on the marine environment. Along with cruise tourism, during the implementation of the development plan of the “Estonian Marine Policy 2012−2020”, focus must be on facilitation of nature tourism by using the possibilities offered by small harbours, such as offering various services to recreational craft tourists, establishing collaborative networks between various tourism service providers and harbours and improving dissemination of information so that tourists would know what sights, accommodation, catering services they can expect in different locations. It is also important to develop the capacity of small harbours to receive waste and wastewater. Promotion of coastal lifestyle needs developing as an area related to tourism. Hopefully, nature tourism helps to ensure sustainable use of natural resources and resources, enabling to influence this area in a positive way. Objectives 10 and 11 are focused on the implementation of the above listed development areas and implementation of their respective measures ensure also the development of tourism related to recreational craft and introducing local life. According to the “Marine sector overview 2013”, the Ministry of Economic Affairs and Communications has prepared a plan of a network of small harbours for 2014−2020, which focuses on efficient implementation of Estonia`s recreational craft tourism, i.e. according to the concept the small harbour network includes 63 harbours with good development potential.
131 Strategic Environmental Assessment of the National Development Plan “Estonian Marine Policy 2012−2020”
Draft Report, 2015.
The author of the strategic environmental assessment believes that the topic of wind energy as an alternative energy source has not been included as objectives and measures of the development plan of the “Estonian Marine Policy 2012−2020”. The Estonian Renewable
Energy Action plan up to 2020 specifies as an action supporting offshore windfarm construction with investment aid when tariff free financing sources are found. The National Spatial Plan “Estonia 2030+” has determined suitable areas for the establishment of off-shore wind parks that have been addresses in detail in the county planning of the marine areas of Hiiu and Pärnu counties. As wind energy external costs are many times smaller compared to the production of electricity by burning fossil fuels, then by increasing the proportion of wind generators in electricity production will improve the environmental quality of the entire region (nation) both from the nature as well as economic aspect. According to the renewable energy action plan and the National Spatial Plan and county planning, the author of the SEA makes a proposal to consider introducing measures necessary for the development of alternative energy when preparing the new implementation plan of the “Estonian Marine Policy 2012−−−−2020”. 5.2.5 Impact on human well-being and health (including outdoor noise)
Human well-being and health are influenced by many circumstances from air pollution and noise to the general cleanliness of the marine environment. The general social and economic situation also affect humans well-being. The objectives and measures set in the development plan take into account the human well-being and health aspect that will mainly have positive impacts upon implementation. The examples are increasing navigation safety and security (objective 5), improving marine search and rescue sector (objective 5), facilitating development of sea tourism and other opportunities to spend free time in sea-related activities (objective 10) and marine policy objectives (e.g. objectives 2,3) that indirectly facilitate economic growth. A more specific positive aspect is expected from an activity that is designed to achieve objective 1 of the development plan, which is making social insurance agreements for Estonian seamen that serve on ships that sail under foreign flags. An indirect positive impact can be seen in the development of shipbuilding and repair sector (objective 4) and increasing the volume of research work (objective 9) that facilitate development of new innovative and environmentally sustainable technologies in the shipping sector. Negative aspect is related to possible air pollution and noise that may become a problem particularly when fulfilling objectives 2 and 3, i.e. increasing cargo flows and number of passengers. This topic has been discussed in detail in section 5.2.3. If these objectives are fulfilled, attention must be paid to traffic safety in the marine area when vessel traffic increases. Fulfilment of objective 6 (the state of the marine environment has improved) will have a positive impact on human health and well-being due to a better marine environment status. People that live on the coast as well as people involved in sea tourism are influenced. It is important to increase people`s awareness about how humans influence marine environment status and what everybody can do to improve it. One of the topics is reducing litter that is introduced into the sea from the coast (including beaches).
132 Strategic Environmental Assessment of the National Development Plan “Estonian Marine Policy 2012−2020”
Draft Report, 2015.
Based on the above, the author of the SEA makes a proposal to consider planning to improve awareness of people as a new measure of objective 6 when preparing the new implementation plan of the “Estonian Marine Policy 2012−−−−2020” development plan. One of the topics is reduction of litter that is introduced into the sea from the coast (including beaches).
5.2.6 Impact on sea-related business (including fisheries, aquaculture, tourism etc.)
Most measures that influence the business environment have a positive impact. Consequently, measure 1.1 has been partly implemented because according to the “Marine Sector Overview
2013”, common fairway dues were imposed with the amendment of the Maritime Safety Act that ensures more streamlined duties on shipping companies of different countries. When objective 2 is fulfilled, the flow of goods becomes more efficient through collaborative networks and introduction of container transport, which increases export and import of goods. At the same time, objective 3 has been partly realised because according to the “Maritime
Sector Overview 2013”, the number of passengers, including cruise ship tourists grew in 2013 (compared to earlier years). However, tourism services offered on the Estonian coast need to be introduced more by better dissemination of information and cooperation between different parties so as to increase the number of recreational craft tourists in coastal villages. Taking into account the business environment development perspectives, fulfilment of objective 5 that facilitates navigation safety as well as optimisation of waterways by better navigation marks, reconstruction of waterways, creation of a common navigation network, improving vessel traffic services and conducting hydrographic surveys are certainly important activities. Implementation of objective 6 has a short-term negative impact, although in a longer perspective it supports sustainability because its implementation causes several activities to be taken and several flows imposed limits (e.g. fishing limits) for the purpose of improving marine environmental status. In the long perspective, this will help not only to ensure sustainability of sea-related business but also to maintain a cleaner environment to attract tourists and offer better opportunities for aquaculture in the marine areas. In order to facilitate fulfilment of objectives 10 and 11, it is necessary to include additional measures designed to develop marine tourism, taking into account primarily recreational craft tourists, and improve introduction of cultural heritage especially through the development of nature tourism. The need to direct marketing activities (including dissemination of tourist information) to the final consumer as well as tour operators so that optimal information and access to channels is ensured during the visitor`s entire trip has been highlighted in the Estonian
National Tourism Development Plan 2014−2020 (2013). In addition, it is important to develop the technical platform of the tourism information system by improving its user-friendly features, exchange of information with external databases and ensuring functioning of the system. It is also important to offer additional value at tourist information and visitor centres that service clients in addition to dissemination of information. To develop nature tourism, collaborative networks should be created to unite culture, creative industries and tourism sector businesses. Consequently, the author of the SEA makes a proposal to consider measures that improve combining of recreational craft and nature tourism in Estonian marine and coastal areas to be added to objectives 10 and 11 of the development plan when preparing the new implementation plan of the “Estonian Marine Policy 2012−−−−2020”.

133 Strategic Environmental Assessment of the National Development Plan “Estonian Marine Policy 2012−2020”
Draft Report, 2015.
“Estonian Marine Policy 2012−2020” needs more specific measures for the development of aquaculture in the Estonian marine areas. It presumes cooperation with neighbours and using their experience when developing this business sector. The author of the strategic environmental assessment is of an opinion that the “Estonian Marine Policy 2012−2020” does not address this particular topic sufficiently and does not include enough opportunities to develop aquaculture businesses. Several objectives and activities that should help develop aquaculture businesses have been set out in the Estonian Aquaculture Development Strategy
2014–2020 (2013) and the Estonian Aquaculture Multiannual National Action Plan 2014−2020 (2014). Most important is cooperation with research and development institutions to develop and launch products with higher added value that are better differentiated on the market. Supporting the development of technologies designed to farm new species that suit Estonian conditions and development and implementation of suitable financing and insurance schemes. The study “Research on mapping the most suitable areas for aquaculture escalation,
development of infrastructure and the implementability of innovative technologies” (Jaanuska, 2015) shows that the prerequisites of the development of aquaculture are cooperation of fish farmers, innovation and improving professional education in this area. In addition, the study notes that there is a great potential to develop aquaculture business in the same areas as offshore wind farms (Jaanuska, 2015). The author of the SEA makes a proposal to plan measures for the development of offshore aquaculture activities (e.g. support establishment of protected areas, specific research on the protected areas) when preparing the new implementation plan of the “Estonian Marine Policy 2012−−−−2020”.
5.2.7 Impact on marine transport and ports (including navigational safety and security, marine rescue)
According to section 2.1.2, the Baltic Sea is not only an easily threatened marine area and a pollution-sensitive ecosystem, but also a region with intensive vessel traffic. Hence, efforts must be continued in future to improve navigation safety and security in the region. It is also important to continued improving marine rescue capacity (including, for example, renewal of appropriate equipment). In addition, from the socio-economic aspect, it is important to deal with ports (including small and fishing harbours) and the development of relevant infrastructure therein. It is important to develop in ports, including small harbours the capacity to receive waste and wastewater. These activities are covered in the Marine Strategy`s programme of measures. According to the analysis made in section 5.1 (Table 5.1), a positive impact on this area from the fulfilment of objectives set in the development plan will occur. Fulfilment of all objectives included in the development plan has a smaller or greater impact. The topics named in the previous section are covered by the objectives and measures of the development plan and the author of this report does not see any need to highlight any new possible topics not discussed in the development plan.
5.2.8 Impact on marine cultural heritage
Estonia has a rich marine cultural heritage, be it values such as cultural property in the sea or the traditional coastal lifestyle. However, the coastal fishing tradition is fading away, work traditions and handicraft skills related to coastal living are fading away, and coastal landscapes are overgrown with shrubs or under strong construction pressure. In addition, there is a lack of

134 Strategic Environmental Assessment of the National Development Plan “Estonian Marine Policy 2012−2020”
Draft Report, 2015.
resources to take an inventory of objects of cultural value and carry out necessary activities to conserve them. An example is the historic lighthouse programme that has not began. Objectives 10 (marine tourism and marine and coastal business activities are developed) and 11 (the preservation of marine cultural heritage and traditions is secured) are set in the development plan to ensure conservation of marine cultural heritage. Facilitation measures of marine tourism (including reconstruction and development of small and fishing harbours) are mostly designed to help preserve the coastal lifestyle. In addition, other objectives set by the development plan have an indirect positive impact because they are related to the development of the marine sector (which is also part of cultural heritage). In addition to facilitating tourism, it is important to continue supporting activities that motivate people (including coastal fishermen) that live in coastal villages to stay on in the area. Implementation of objective 4 (Estonian shipbuilding and repair operations are internationally competitive) helps to achieve this goal. In addition, keeping people in the area is supported by similar activities financed in recent years by the European Fisheries Fund, such as renovation of small harbours and loading places, production and direct marketing of fish products and agar-agar, diversification of activities of fishermen outside fishing season and supporting training. Supporting maintaining of coastal landscapes (including coastal meadows) and promotion of cooperation between different parties (land owners, local authorities, Environmental Board etc.) are also important activities. Furthermore, it is important to map the location of historic and still preserved coastal villages and their state and the memories of locals. Based on the above, the author of the SEA suggests to consider the following activities as new measures of objective 11 of the development plan when preparing the new implementation plan of the “Estonian Marine Policy 2012−−−−2020”:
1. Facilitating activities that support staying in the area of people (including coastal fishermen) that live in coastal villages;
2. Supporting maintaining coastal landscapes (including coastal meadows) and promotion of cooperation between different parties (land owners, local authorities, Environmental Board etc.);
3. Mapping the location of historic and still preserved coastal villages and their state and the memories of locals.
5.2.9 Cumulative impacts and cross-border impact
The measures have an overall positive environmental impact on the natural environment. Positive impacts are expected primarily from making navigation and related infrastructure safer and improving of environmental management. Negative impacts are related to expanding of ports and dredging of waterways and more intensive marine transport. Positive impacts are cumulative: more efficient environmental management and safer navigation should in the end help to decrease cumulatively over time the pressure on the environment and environmental pollution from shipping sector. Growth of vessel traffic has a negative cumulative impact on the natural environment. It is primarily related to ship accident risk and the increased probability of ensuing oil pollution. Other environmental pressures related to shipping sector, such as litter, noise, air pollution, release of other pollutants to the sea, invasion of non-indigenous species, may also be

135 Strategic Environmental Assessment of the National Development Plan “Estonian Marine Policy 2012−2020”
Draft Report, 2015.
considered cumulative. The question is whether the above described positive cumulative impacts set off the negative impact. The practice of recent decades has shown that the Baltic Sea countries` common environmental policy in HELCOM has brought about several positive developments. Regardless of the economic growth of the countries surrounding the sea, the environmental problems have not generally become worse. For example, although vessel traffic has grown, the number of detected oil spills is smaller. Progress has been made in relation to reduction of content of several hazardous substances. Vessel traffic intensity in the waters neighbouring our marine areas will increase regardless of whether transport in Estonian marine area grows or not. A local cumulative negative impact is seen in relation to expansion/development of ports that increases vessel traffic. Furthermore, when ports are expanded, the need to clean the area under reconstruction or repair and rfor removal of sediments from ports and related environmental impact will increase, e.g. environmental disturbance due to dredging and dumping works. However, for example, dredging of waterways to ensure navigation safety does not depend entirely on the density of traffic because dredging works are often necessary to ensure navigation safety for a smaller number of craft but also ships with larger draught if the capacity of ports to receive such ships is increased. The impact of these works can be mitigated using technologies that have a smaller environmental impact, avoiding environmentally sensitive seasons, sensitive areas (e.g. dumping) and unfavourable weather. The current practise shows that in Estonia the mitigation measures presented during the environmental impact assessment process have been quite successful. Long-term environmental impacts have been of local importance and limited to harbour basins and areas in vicinity. There is no overview and assessment on the cumulative impact of ground works conducted in ports and excavation areas and dumping grounds. In the section that discusses monitoring requirements, we have suggested the establishment of a relevant database as a mitigation measure. Both positive and negative impacts influence the entire ecosystem. For example, improving navigation safety controls environmental risks and this has a positive effect on the entire ecosystem. Fulfilment of the objectives of the development plan in socio-economic environment has a positive overall cumulative impact on the marine sector because the development plan is designed to further the entire marine sector. Positive impacts are related to the sea-related business environment, marine transport, development of ports and preservation of marine cultural heritage. Fulfilment of all objectives of the development plan has a smaller or greater impact. It is important that the development plan has focused on setting objectives that are directly related to the development of the marine sector (increasing the flow of goods in ports) as well as objectives that have an indirect impact (e.g. marine education). Cumulative negative impacts that occur in the socio-economic environment are mainly related to human well-being and health. The main factors that have cumulative effect are air pollution and noise as a result of expanding ports and thereby increased cargo and passenger traffic that affect people that work in ports as well as people that live nearby. In case of ports that are located in the city (e.g. the passenger terminal in the city centre of Tallinn), there is a cumulative impact in combination with air pollution and noise caused by street traffic. However, the positive development of the maritime sector is expected to bring economic growth that has an indirect positive impact on the well-being of population.
136 Strategic Environmental Assessment of the National Development Plan “Estonian Marine Policy 2012−2020”
Draft Report, 2015.
To reduce the negative cumulative impacts, measures have to be implemented that would ensure that air pollution and noise aspects (including appropriate standards) are taken into account when ports are expanded and developed. During construction works, the current situation, i.e. the existing air pollution and noise sources, as well as the planned activity must be taken into account. Cross-border impact When the objectives of the development plan were set, Estonia`s administrative territory and related marine environment and development of Estonian marine sector were taken into account. Estonia is related to several other countries through sea, which means that the objectives set down in the development plan influence also the marine environment and maritime sector of other countries. For example, direct impacts are related to the improvement of marine environment status as well as improving navigation safety in the Estonian waters. Developing ports` infrastructure creates better conditions for servicing foreign vessels that visit Estonian ports. An international positive aspect is sea-related research work as well as planning activities to promote tourism (marine tourism, preservation of marine cultural heritage). However, promotion of Estonian shipping and shipbuilding sectors may increase competition between the Baltic Sea ports and countries. The marine policy measures do no cause any significant negative cross-border impacts.
137 Strategic Environmental Assessment of the National Development Plan “Estonian Marine Policy 2012−2020”
Draft Report, 2015.
6. DESCRIPTION OF MONITORING REQUIREMENTS AND FOLLOW-UP ASSESSMENT
Environmental monitoring is a constant monitoring of environmental status and factors influencing it that includes environmental observations and analyses and processing of monitoring data. In order to assess the actual environmental impact of the measures and activities that are designed to achieve the objectives of the development plan, it is necessary to conduct periodically assessment/analysis of the quality of environmental components. The monitoring and follow-up of the development plan must give information on how any implemented measure/activity has influenced various environmental components. Hence, it is not only necessary to gather data on the natural environment and environmental pollution, but also social and economic environment data have to be collected so that it would help to update the development plan. The authority that gathers and analyses monitoring data is the authority that initiates preparing of the development plan and reviews it, i.e. the Ministry of Economic Affairs and Communications in cooperation with other competent authorities.
6.1 Monitoring of natural environment Achieving the objectives set in the development plan influence the natural environment. To monitor changes in the natural environment, it is necessary to conduct every four years an analysis of the environmental changes in the Estonian marine area based on the results of national monitoring carried out in accordance with the Estonian Marine Strategy’s marine monitoring programme (TTÜ Meresüsteemide Instituut, 2014). When preparing a review of the development plan, the monitoring data of the particular period must be obtained and analysed whether after carrying out of the activities there have been changes in the marine environment status. If the marine environment status has worsened, then it must be analysed whether the reason may be the activities included in the development plan. Indicators of the expected impact and need to improve current monitoring Fulfilment of the development plan objectives does not cause a drastic increase in activities that have a negative marine environment impact. Therefore, no major changes in the national marine monitoring programme are needed to be made in relation to the activities included in the development plan. Concurrently with this strategic environmental assessment, a strategic environmental assessment of the new measures of the Estonian Marine Strategy`s programme of measures is conducted during which specific proposals are made concerning the monitoring programme based on the specific marine environment issues. Additional proposals have been made to the current marine monitoring programme in the work “Marine monitoring programme” (TTÜ Meresüsteemide Instituut, 2014). The direct positive or negative environmental impacts as a result of the implementation of the development plan on the entire Estonian marine area should reflect as changes in the Good Environmental Status (GES) indicators for most activities. Monitoring of local environmental impact caused by each activity upon implementation of the development plan (e.g. establishment of ship repair plants, expanding of ports, dredging, dumping etc.) should be presented during the relevant environmental impact assessment process.
138 Strategic Environmental Assessment of the National Development Plan “Estonian Marine Policy 2012−2020”
Draft Report, 2015.
The positive impacts of the development plan on seawater quality and physical indicators occur primarily due to activities that help make navigation and related infrastructure safer and promote environmental management. These impacts should be primarily monitored based on the indicators of GES descriptors “Concentrations of contaminants are at levels not giving rise to pollution effects” and “Contaminants in fish and other seafood for human consumption do not exceed levels established by Community legislation or other relevant standards”. Changes over time in pollution originating from ships should be assessed by a parameter that would directly describe the frequency and volume of oil spills found in the sea. In the SEA of the Estonian Marine Strategy`s programme of measures we have proposed to use PF (Pollution per Flight) index that shows the number of oil spills detected per every flight hour. Negative impacts of the development plan are related to expanding of ports and dredging of waterways and more intensive sea transport. To monitor a negative impact, the indicators of the descriptors related to the mentioned contaminants and PF index must be monitored. The growth of vessel traffic may cause an impact based on the indicators of the descriptors “Non-indigenous species introduced by human activities are at levels that do not adversely alter the ecosystems”, “Introduction of energy, including underwater noise, is at levels that do not adversely affect the marine environment” and “Properties and quantities of marine litter do not cause harm to the coastal and marine environment”. When assessing the impacts caused by expanding of ports and dredging of waterways, the indicators of descriptors “Sea-floor integrity is at a level that ensures that the structure and functions of the ecosystems are safeguarded and benthic ecosystems, in particular, are not adversely affected” and “Biological diversity is maintained. The quality and occurrence of habitats and the distribution and abundance of species are in line with prevailing physiographic, geographic and climatic conditions” should be monitored. There are applicable monitoring indicators for most mentioned GES descriptors, except for the descriptors related to marine litter and underwater noise. Furthermore, there are no pressure indicators that describe the environmental impact of excavation, dredging and dumping operations in the Estonian marine area. As there are nuclear power plants on the coast of Estonia`s neighbouring countries, we suggest to begin with operative radioactivity monitoring in the Gulf of Finland. In summary, the following activities are suggested in addition to the existing national monitoring: • It is proposed to establish a common database of on the water excavation and
dredging and dumping operations. This database would give a whole picture of the works that are conducted in the Estonian marine areas that modify the coast and sea-floor and it could be used for spatial planning, environmental impact assessments of property developments and monitoring. The database should include information about presumed volume of dredging (dumping) (in the special use of water permit application phase), the actual dredged volume (will be clear after the works are completed), integration of sediments and content of hazardous substances in sediments. If the works have been monitored, the database should include references to monitoring reports. Based on the gathered data, it is possible to prepare a pressure indicator of excavation, dredging and dumping operations in the Estonian marine areas.
• It is proposed to add underwater noise monitoring to the national monitoring programme. Currently there is no assessment of the negative effect caused by this pressure in Estonian marine areas. The results of LIFE+ project “Baltic Sea Information on the

139 Strategic Environmental Assessment of the National Development Plan “Estonian Marine Policy 2012−2020”
Draft Report, 2015.
Acoustic Soundscape” (BIAS) may be taken as the basis when preparing the monitoring programme. Establishment of a noise register is proposed as a new measure in the draft programme of measures of the Estonian marine strategy.
• We propose to consider adding marine litter monitoring to the national monitoring programme. Currently there is no assessment of the negative effect on the Estonian marine areas caused by this pressure. Several marine litter indicators have been proposed in the draft programme of measure of the Estonian marine strategy.
• As there are nuclear power plants on the coast of Estonia`s neighbouring countries, it is suggested to install in the Gulf of Finland at least one autonomous measuring device that sends real-time radioactivity data. This could be integrated into the first Baltic Sea offshore autonomous monitoring station near Keri Island.
6.2 Monitoring of the objectives (including socio-economical) of the development plan The following data should also be gathered when analysing the fulfilment of the objectives of the development plan (Table 6.1): Table 6.1. Suggestions for monitoring the fulfilment of development plan objectives
Objective of development plan
Monitored parameters/gathered data Frequency of data gathering
Objective 1. Estonian shipping is internationally competitive.
Number of ships sailing under Estonian flag Data should be gathered for the review of the development plan with the precision of a year. If possible, every year, but at least before the preparation of a new development plan and new implementation plan by different years.
Number and list of countries with which social insurance agreements have been made
Data should be gathered for the review of the development plan with the precision of a year. If possible, every year, but at least before the preparation of a new development plan and new implementation plan by different years.
Objective 2. Increased trade flows through Estonian ports
Goods turnover of larger cargo ports (Muuga, Paldiski South Port, Paldiski North Port, Sillamäe, Kunda, Pärnu)
Data should be gathered for the review of the development plan with the precision of a year. If possible, every year, but at least before the preparation of a new development plan and new implementation plan by different years.
Objective 3. Increased number of passengers on international shipping lines.
Number of passengers on international lines Data should be gathered for the review of the development plan with the precision of a year. If possible, every year, but at least before the preparation of a new development plan and new

140 Strategic Environmental Assessment of the National Development Plan “Estonian Marine Policy 2012−2020”
Draft Report, 2015.
Objective of development plan
Monitored parameters/gathered data Frequency of data gathering
implementation plan by different years.
Number of cruise ship tourists Data should be gathered for the review of the development plan with the precision of a year. If possible, every year, but at least before the preparation of a new development plan and new implementation plan by different years.
Opening of new international lines Data should be gathered for the review of the development plan with the precision of a year. If possible, every year, but at least before the preparation of a new development plan and new implementation plan by different years.
Objective 4. Estonian shipbuilding and repair operations are internationally competitive.
Number of shipbuilding companies and their employees
Data should be gathered for the review of the development plan with the precision of a year. If possible, every year, but at least before the preparation of a new development plan and new implementation plan by different years.
Objective 5. The safety and security in vessel traffic and in ports has improved
Total number of ship accidents and dangerous incidents
Data should be gathered for the review of the development plan with the precision of a year. If possible, every year, but at least before the preparation of a new development plan and new implementation plan by different years.
Objective 6. The state of the marine environment has improved.
Monitoring in accordance with the Estonian Marine Strategy`s marine monitoring programme + information in section 6.1.
Data should be gathered every four years for the purpose of review of the development plan.
Objective 7. The marine sector management and marine regulations are more effective
The portion of marine areas covered by marine area spatial plan.
Data should be gathered every four years for the purpose of review of the development plan
Objective 8. Estonian education system provides modern training in balanced volume of specialists necessary for all fields of the marine sector.
Number of graduates of vocational and higher educational maritime institutions.
Data should be gathered for the review of the development plan with the precision of a year. If possible, every year, but at least before the preparation of a new development plan and new implementation plan by different years.

141 Strategic Environmental Assessment of the National Development Plan “Estonian Marine Policy 2012−2020”
Draft Report, 2015.
Objective of development plan
Monitored parameters/gathered data Frequency of data gathering
Objective 9. The quantity and quality of Estonian marine research have increased.
Number of sea-related research work and subjects.
Data should be gathered for the review of the development plan with the precision of a year. If possible, every year, but at least before the preparation of a new development plan and new implementation plan by different years.
Objective 10. Marine tourism and marine and coastal business activities are developed
Number of recreational craft that have visited Estonian harbours.
Data should be gathered for the review of the development plan with the precision of a year. If possible, every year, but at least before the preparation of a new development plan and new implementation plan by different years.
Number and list of harbours that belong to the network of small harbours.
Data should be gathered for the review of the development plan with the precision of a year. If possible, every year, but at least before the preparation of a new development plan and new implementation plan by different years.
Objective 11. The preservation of marine cultural heritage and traditions is secured.
Number of visitors of maritime museums. Data should be gathered for the review of the development plan with the precision of a year. If possible, every year, but at least before the preparation of a new development plan and new implementation plan by different years.
Number of people that permanently live in coastal villages by rural municipalities.
Data should be gathered for the review of the development plan with the precision of a year. If possible, every year, but at least before the preparation of a new development plan and new implementation plan by different years.

142 Strategic Environmental Assessment of the National Development Plan “Estonian Marine Policy 2012−2020”
Draft Report, 2015.
7. OVERVIEW OF THE SEA PROCESS AND ENCOUNTERED DIFFICULTIES
The strategic assessment of the Estonian Marine Strategy`s programme of measures to achieve or maintain good environmental status of the Estonian marine area and the strategic assessment of the national development plan “Estonian Marine Policy 2012–2020” were initiated by Decree No. 342 of 8 April 2015 of the Minister of the Environment (SEA programme Annex 1). The SEA is conducted in accordance with the Environmental Impact Assessment and Environmental
Management System Act, which is in effect until 30 June 2015 and which transitional provision is applicable until 1 July 2018. The Government of the Republic initiated the preparation of the development plan “Estonian Marine Policy 2012–2020” and adopted it. The authority that supervises the preparation of the development plan and the new implementation plan is the Ministry of Economic Affairs and Communications. Eesti Keskkonnauuringute Keskus OÜ is responsible for organising the preparation of the SEA and the assessment is prepared by Alkranel OÜ and Marine Systems Institute at Tallinn University of Technology. The Ministry of Economic Affairs and Communications, the Ministry of the Interior, the Agricultural Board, the Ministry of Education and Research, the Ministry of Social Affairs, the Environmental Board and the Estonian Maritime Administration were asked to express their opinion on the content of the draft SEA programme with a letter of 17 June 2015. Due to the potential environmental impact of the SEA programme, Finland, Sweden, Russia, and Latvia were asked to express their opinions regarding the draft SEA programme. Poland, Denmark, Germany and Lithuania were also informed about the SEA process. Finland and Latvia expressed their intention to participate in the process and Poland requested to be introduced the final version of the SEA report. The received opinions and how they have been taken into account are presented in the SEA programme (Annex 1). The SEA programme was displayed publicly 13.07–27.07.2015 on the web site of the Ministry of the Environment http://www.envir.ee/et/merestrateegia and the web site of Eesti Keskkonnauuringute Keskus OÜ http://www.klab.ee/merestrateegia/uudised/. Publication of the programme was notified in the publication Ametlikud Teadaanded (http://www.ametlikudteadaanded.ee, 10.07.2015) and in the newspaper Postimees (11.07.2015). The information was also posted to the news section of the Internet home pages of the Ministry of the Environment (http://www.envir.ee/et/merestrateegia/), Eesti Keskkonnauuringute Keskus OÜ (http://www.klab.ee/merestrateegia/uudised/) and Alkranel OÜ (http://www.alkranel.ee/). An e-mail about the publication of the draft SEA programme (including public discussion) was sent to the interested persons and authorities on 9 July 2015 by Eesti Keskkonnauuringute Keskus OÜ. The public discussion of the SEA programme was held on 27 July 2015 at 10 a.m. in the premises of the Ministry of the Environment (Narva maantee 7a, Tallinn 15172). During the public display of the SEA programme, opinions were sent by the Health Board and the Ministry of Agriculture, which are included and described in the SEA programme (Annex 1). The SEA programme was approved by letter No. 11-2/15/5029-14 of 12 October 2015 of the Ministry of the Environment (Annex 2).

143 Strategic Environmental Assessment of the National Development Plan “Estonian Marine Policy 2012−2020”
Draft Report, 2015.
No significant difficulties were encountered during the preparation of the SEA. The issues were discussed and solutions were arrived at within the SEA working group.

144 Strategic Environmental Assessment of the National Development Plan “Estonian Marine Policy 2012−2020”
Draft Report, 2015.
8. SUMMARY OF THE SEA RESULTS The object of this strategic environmental assessment (hereinafter SEA) is the national development plan “Estonian Marine Policy 2012–2020” (approved by the Government of the Republic on 2 August 2012). Five priorities together with strategic objectives to develop the maritime sector are set out in the development plan. To achieve these strategic objectives, measures have been planned along with main activities to implement the measures. The document is accompanied by an implementation plan that is prepared for four years that describes in detail the activities, outcomes, implementers and the financial plan to implement them. The objective of the SEA is to analyse the activities planned in the development plan and its implementation plan and, if necessary, make proposals for the preparation of a new implementation plan. The SEA is conducted in accordance with the Environmental Impact
Assessment and Environmental Management System Act (in effect until 30 June 2015 (RT I, 13.03.2014, 32). According to § 56 (8) of the Environmental Impact Assessment and
Environmental Management System Act (RT I, 01.09.2015, 12), the transitional provision is applied until 1 July 2018. The Government of the Republic initiates the preparation of the development plan and adopts it. The authority responsible for organising the preparation of the SEA is the Ministry of Economic Affairs and Communications. The SEA is prepared by Alkranel OÜ and Marine Systems Institute at Tallinn University of Technology. The draft SEA programme was displayed publicly 13.07–27.07.2015 and the public discussion was held on 27 July 2015. The SEA programme was approved by letter No. 11-2/15/5029-14 of 12 October 2015 of the Ministry of the Environment (Annex 2).
8.1 OVERVIEW OF THE CURRENT SITUATION, PROBLEMS AND PRESSURES
8.1.1 Overview of socio-economic environment and problems Business environment related to maritime industry For the purpose of this SEA report, the business environment includes various infrastructures (electricity, gas) and related business as well as the development of shipping, fisheries, aquaculture, tourism and energy in the Baltic Sea. Maritime industry plays an important role in the Estonian economy, because ca 60% of Estonian export and import operations are conducted by sea.

145 Strategic Environmental Assessment of the National Development Plan “Estonian Marine Policy 2012−2020”
Draft Report, 2015.
Infrastructure Direct current connections with Finland have been established. In a longer perspective, it is possible to create a connection with Sweden and construct a third connection between Estonia and Finland that would ensure sale possibilities for the production of the perspective offshore windfarms. It is planned to synchronise the power grids of the Baltic States and the European Union. Converter stations need to be built on the state border (National Spatial Plan “Estonia
2030+”). Transition to natural gas as the most clean fossil fuel requires the development of a necessary infrastructure, i.e. liquefied gas (hereinafter LNG) terminals and bunkering stations in the SECA region, including the Baltic Sea ports. Currently, there are terminals only near Stockholm and in Klaipeda. The plan is to connect the Estonian gas transfer network in addition to the existing transfer networks also to the Finnish gas market via Balticconnector (Ramboll Eesti AS, 2014). Marine infrastructure problems are mainly related to intensifying construction of infrastructures into the sea where clearly is seen a relative growth of physical loss: smothering of seafloor, sealing and growth of underwater noise due to construction works.
Shipping industry The annual overview of the ship register prepared by the Estonian Maritime Administration shows a big drop in the number and gross tonnage of bareboat charted cargo vessels. In addition to changes in the number of bareboat cargo vessels, the number and tonnage of fishing ships has dropped almost by half. The number of passenger ships that sail under the Estonian flag has been quite stable compared to the data of 2003. From 1 January 2015, all ships that sail on the Baltic Sea must use fuels with sulphur content < 0.1% or be equipped with treatment facilities that ensure SOx content reduction to the required limit in exhaust gases. Currently, only a few LNG fuel ships sail on the Baltic Sea. However, a very quick growth in the number of LNG-ships is not foreseen in near future, because facilities for supplying ships with LNG in ports, except for in Norway, are non-existent or limited. The Estonian shipping sector is part of the world and the Baltic Sea shipping, which is why it is important to ensure the Estonian shipping companies equal competitive conditions at least with neighbouring countries. This means bringing into line of ship operating costs with those of the competitors as well as improving administrative activities related to ship operating. Moreover, the system should be long-term to ensure companies certainty so that they are ready to make investments. Trawlers must also be taken into account. According to the “Marine
Sector Overview 2013”, common fairway dues were imposed from 1 July 2013 with the amendment of the Maritime Safety Act that ensures more streamlined principles to stay in competition with the neighbouring countries. Shipbuilding and repair There are three weaknesses that limit the development of the ship-building sector: lack of qualified labour, no infrastructure to build and repair large ships year around and limited investing capacity. The state can support entrepreneurs through cooperation that targets renovation of the state-owned fleet. As the competitive edge of Estonian companies is mainly building of special and more complex ships and providing technological updates and flexibility

146 Strategic Environmental Assessment of the National Development Plan “Estonian Marine Policy 2012−2020”
Draft Report, 2015.
in fulfilling orders, they have to offer new and innovative solutions. However, entering the market with a new product is complicated, because potential buyers need certainty that these products function. During the renovation of the state`s fleet, it is possible to take into account new solutions offered by our entrepreneurs that would give them an opportunity to demonstrate the operational reliability of their products and give a reference for potential foreign clients (Eesti merenduspoliitika 2012−2020, 2011). Tourism The main resource of the Estonian marine tourism is the nature that has not been influenced very much by human activity and offers varied landscapes and diversity of species and a long coastline with over 1,500 islands and inlets. According to the Estonian National Tourism Development Plan for 2014−2020 (2013), the routes of international shipping lines are overly concentrated around Tallinn and it is necessary to extend them to other coastal regions and islands (e.g. Kunda, Sillamäe, Saaremaa). In addition, to develop marine tourism, it is necessary to improve the awareness of neighbouring markets about marine tourism products and services offered on the Estonian coast and islands and about local recreational opportunities. Fisheries According to Statistics Estonia, deep-sea fishing on the Baltic Sea accounted for 75–90% of the total fishing activities on the Baltic Sea in 2000–2010. The most caught species are the Baltic herring and the sprat and the percentage of these fish in the total catch numbers exceeds 95%. The main coastal fishing regions are the Pärnu Bay, Väinameri and the Gulf of Finland. Many different species are caught, of which economically more important are the perch, the Baltic herring, the smelt, the zander, the flounder, and the eel. The garfish and the sea trout are also important species, whereas the salmon and the pike are caught in smaller numbers (SA SEI Tallinn, 2012). The volume of recreational fishing compared to trawl fishing is marginal. The main raw material of the Estonian fish processing companies are local fish species, the Baltic herring and the sprat, and for the filleting companies fresh water fish, the perch and the pike-perch. In 2011, 22% of Estonian total production (fishing and aquaculture) of fish and fish products remained in the country for consumption and 78% was exported (Eesti kalanduse strateegia 2014-2020, 2013). A very important pressure in the fisheries sector is the selective extraction of species as well as organic matter inputs into the sea. A weakness of the fisheries sector (e.g. in the Gulf of Riga) is high intensity of fishing, which main cause is a large number of fishing gear. It is necessary to find a balance between fishing opportunities and the existing resources. Illegal fishing is also a problem on the Baltic Sea (Eesti kalanduse strateegia 2014−2020, 2013). Aquaculture In Estonia, offshore aquaculture practice is represented by some individual cases and experts are of an opinion that no appropriate competence in this field exists in Estonia. Although there are suitable sites for farms in the sea, they are few. As there exist regions that are potentially suitable for offshore aquaculture, the offshore aquaculture in Estonian conditions should be studied and tested. To develop offshore aquaculture, the following is necessary (Jaanuska, 2015):

147 Strategic Environmental Assessment of the National Development Plan “Estonian Marine Policy 2012−2020”
Draft Report, 2015.
• The nutrients loop principle must be introduced into the Environmental Code. If feed is made from fish caught from the Baltic Sea, a permit for special use of water is awarded using a simplified procedure for the farming of fish of same amount containing the same amount of phosphorous that is bound in the feed.
• Vaccination equipment that is necessary to continue farming the salmonids in the sea has to be obtained.
• The problem of building rights has to be resolved that makes the process of starting using seawater areas very long.
Marine transport and ports (including maritime rescue) Because of its geographic location, Estonia lies along an important international east-west trading route. According to HELCOM (2014) data, the main traffic happens in the norther part of the Baltic Sea in the Gulf of Finland. Ports service international and internal carriage of passengers and cargo. Almost all transit of goods is conducted through ports. Besides large ports, small and fishing harbours play an important role not only on the local level but also internationally. Search and rescue operations of people in distress at sea under Estonia`s responsibility and on Lake Peipsi, Lake Lämmi and Lake Pihkva are carried out by the Police and Border Guard Board. Maritime rescue is ensured with the readiness of small units at coastal border points. Voluntary marine rescue is well-developed. As the Baltic Sea is an ecologically easily threatened marine area and a pollution-sensitive ecosystem and also a region with intensive traffic, efforts must be continued to improve the safety and security of navigation in the region. It is also important to continue increasing maritime rescue capacity (including, for example, updating of relevant equipment). From the socio-economic point of view, it is important to address the issue of harbours (including small and fishing harbours) and development of their infrastructure. Natural recourses (mineral resources, wind) and using thereof The largest deposits of mineral resources in the marine area that have been registered are located west and northwest of Hiiumaa where are Hiiumadal and Kõpu sand deposits. In addition, sea mud is excavated in Estonia. The Kassari Bay is a habitat for a red algae species Furcellaria lumbricalis from which furcellaran is produced that can be used as a stabilising, thickening and gelatinizing substance in food, agriculture, cosmetics and pharmacy industries. Currently, there are no wind generators and windfarms in the marine areas. Estonia`s western coastal sea is primarily suitable for the establishment of offshore windfarms (National Spatial Planning “Estonia 2030+”; Figure 2.24). Estonia`s northern coastal sea, Lake Peipsi and Lake Võrtsjärv are not suitable for the establishment of windfarms due to natural conditions and national defence purposes.
The potential of wave energy exists in the entire Baltic Sea. A central problem in using wave energy is the seasonal icing of the Baltic Sea. There are several ongoing projects that study the possibility to produce electricity for local use from wave energy in the icing sea and it can be said that this energy production method will be used in future, if in a limited amount.

148 Strategic Environmental Assessment of the National Development Plan “Estonian Marine Policy 2012−2020”
Draft Report, 2015.
There are several sea-based natural resources that are used or can be potentially used. It is important to find a balance between using natural resources and related potential environmental impacts. Marine cultural heritage and traditional coastal lifestyle Estonia has a rich sea-related cultural heritage, be it cultural valuables (wrecks) in the sea or the traditional coastal lifestyle. The coastal living environment is characterised by a beautiful natural environment, traditional coastal villages with interesting history and cultural heritage with potential for the development of tourism services and other small businesses and creating a high-quality living environment (Eesti kalanduse strateegia 2014−2020, 2013). Maritime and coastal lifestyle heritage should be kept alive and made visible to people and accessible to all interested. Although these activities are mainly focused on the coastal areas, it must be also taken into account that maritime image must be improved among inland habitants by making known the opportunities to access the sea and coastal tourism possibilities. Maritime education and research and development activity Maritime education As maritime subject is an interdisciplinary field, maritime education is provided by various educational institutions. Currently, there is a serious deficiency of ship`s officers in the EU and of the rating of EU citizens. On the one hand, the reason is increased international carriage of cargo; on the other hand, decreased interest in the seaman profession in the EU Member States. In Estonia, there is an excess of qualified seamen, because the national shipping industry has been in decline from the beginning of the 1990s. This has created a situation where we export our labour force to other EU Member States (Eesti merenduspoliitika 2012−2020, 2011).
Marine monitoring and development activity Within the Estonian national environmental monitoring programme, marine monitoring is conducted that includes monitoring and distant monitoring of the coastal sea, high seas and sea coasts. In addition to sea monitoring, within the framework of the subprogrammes of nature diversity and landscape monitoring of the national environmental monitoring programme, the marine biota is monitored. The sea is also studied with one-time projects. Marine monitoring needs joint coordinated activities, because the tasks are currently divided between five ministries. Because the marine environment and maritime industry are important, it is necessary to continue providing quality marine education and facilitate scientific research. Air quality Exhausts from marine transport deteriorate air quality and bring into the environment undesirable nutrients. Pollution from marine transport is regulated by Annex VI of the Convention (Regulations for the Prevention of Air Pollution from Ships) MARPOL 73/78 of the International Marine Organisation (IMO). As a result of international call to implement additional measures in order to reduce the emissions caused by marine transport, gradual reduction of the content of sulphur in fuels used on all seas to 0.5% from 2020 and in the SECAs to 0.1% from January 2015 was imposed. Provisions which purpose is to ensure compliance with the requirements are technologically

149 Strategic Environmental Assessment of the National Development Plan “Estonian Marine Policy 2012−2020”
Draft Report, 2015.
neutral and the requirements may be fulfilled by reduction of emissions with alternative methods, such as exhaust gas cleaning systems, or using alternative clean fuels, such as liquefied gas (LNG) (Euroopa Komisjon, 2011). Exhaust gas emissions generated by marine transport are significant because they deteriorate air quality and put undesirable nutrients into the environment. Therefore, it is important to deal with the reduction of air pollution.
Vessel traffic noise in air environment Because ships that sail along waterways are far away, the level of noise caused by these ships that reaches the coast may be considered insignificant compared to the noise that reaches the water environment and affects the water biota. Outdoor noise caused by vessel traffic will be significant for the people that live near ports. In Estonia, according to the Health Board, there have been complaints by residents about noise from the territory of ports. Outdoor noise generated by ship traffic is important in terms of human wellbeing and health primarily for the people that live in port regions. Consequently, it is especially important to pay attention to the noise issue when ports are being developed. 8.1.2 Overview of natural environment The report “Initial Environmental Assessment of the Estonian Marine Area” about the status of the marine areas under the jurisdiction of Estonia was prepared in 2012 (TÜ Eesti Mereinstituut, 2012). This section has been compiled based on this report and supplemented with information from other sources, if necessary. Bathymetry, characteristics of sea floor and coast The Estonian marine area includes three subareas of the Baltic Sea – the Gulf of Finland, the Gulf of Riga and offshore Baltic Sea where the characteristics of coasts as well as bathymetry greatly varies. In the south-eastern part of the Gulf of Finland (Narva Bay) the sea is mainly 20−40 metres deep, in the western part the sea is relatively deep. The seafloor topography is characterised by shallower and deeper areas (over 100 m deep). The open sea of the western islands has a varied coastline (bordering with western Estonia islands) and in the coastal sea mainly 10−40 m deep, although deeper in the territorial sea and economic zone outside it. Estonian coastline is very diverse. According to Kaarel Orviku (1993) classification, there are eight types of coasts in the Estonian coastal sea: cliff shore, scarp shore, rocky shore, till shore, gravel shore, sandy shore, silty shore, artificial shore (artificial facilities – breakwalls, quays and protective walls). The most frequent seafloor reliefs in the Estonian marine area outside the coastal sea are muddy or clayey plains and valleys. Temperature, salinity, stratification, ice cover Temperature and salinity define largely the characteristics of a region`s ecosystem, including species composition. The temperature and salinity fields of the Baltic Sea are highly variable both in time and space which is caused by complex topography, strong horizontal and vertical gradients and major atmospheric variability in different temporal scales, i.e. long-term trends, changes between years, seasonal cycle and synoptic variability.
150 Strategic Environmental Assessment of the National Development Plan “Estonian Marine Policy 2012−2020”
Draft Report, 2015.
The density and stratification of seawater depend mainly on the variability of temperature and salinity described above. If we study the hypsographic curve of the Estonian marine areas, it shows that around 20% of the Estonian marine area is so shallow that it should be mixed from the surface to the bottom most of times, that 50% of the Estonian marine area is temporarily stratified and around 30% of the marine area is deeper than 60 m that allows the presence of the halocline, i.e. there is a high probability that in this part the water column is stratified all year around. Ice cover on the Baltic Sea may be very different every year. In shallow and half-closed bays, ice may cause hypoxia. Abundance of ice is mainly dependent on how harsh the winter is that in turn depends on the atmospheric circulation. Ice is an important factor that influences vessel traffic, processes that occur in ports and on the coast. Difficult ice conditions increase the frequency of shipping accidents. Thick ice cover and/or ice pressure caused by strong wind may leave ships icebound. Currents, wave regime and sea level Characteristic current velocity in the surface layer of the Estonian marine area is 10−20 cm s-1. At the same time, currents are very changeable and depend largely on local wind. As characteristic to stratified estuaries, inflow from offshore Baltic Sea to the gulf dominates in demersal layers (deeper water layers), whereas outflow from the gulf dominates in the upper layers. Strong southwestern winds can temporarily reverse this circulation scheme, i.e. outflow dominates in deeper layers and inflow in the upper layer. The central circulation of the Gulf of Riga is also cyclonic, as in other Baltic Sea basins. Significant differences between the Gulf of Riga and high seas of the Baltic Sea and offshore part of the Gulf of Finland is that the Gulf of Riga is separated from the high seas by thresholds in straits and exchange of water occurs there through quite narrow straits (the Irbe strait (Kura kurk) and the Suur väin strait) and that the gulf mixes to the bottom during the autumn-winter storms. The significant wave height (for the period of 2001−2007) has been over 2 m in the offshore Baltic Sea (in the Estonian marine area), over 1.5 m in the open sea of the Gulf of Finland and 1.0−1.5 m in the open sea of the Gulf of Riga. The average wave height in the coastal sea is significantly lower. The long-term change of water level in the Estonian coastal sea is primarily related to the slow land uplift in the region and the long-term change in the world sea water level. Due to the seasonal nature of winds in the Baltic Sea region, the high water levels are more frequent in autumn and winter. An important aspect in terms of ship connection with the mainland is low levels of water. This is especially important on Rohuküla-Sviby and Rohuküla-Heltermaa waterways. Nutrients and oxygen Nutrients, such as nitrogen and phosphorus, are necessary for the production of phytoplankton, macrophytes and bacteria in the sea. Long-term changes in nutrients is related to nutrient input to and output from atmosphere, rivers, neighbouring areas and sediments, and consumption. As regards nitrogen, somewhat lower values have been registered in recent years in the Gulf of Finland. As for phosphorous, the values have been bigger in recent years. It is likely that the

151 Strategic Environmental Assessment of the National Development Plan “Estonian Marine Policy 2012−2020”
Draft Report, 2015.
increase in the content of phosphorous in the Gulf of Finland is not directly related to the growth of inflow from rivers and pollution sources. As in coastal waters, the average total phosphorus in the offshore Baltic Sea has been growing. The total nitrogen content was relatively stable in 1993−2003 but in recent years a growing trend has been seen. The nutrient regime of the Gulf of Riga differs considerable from the other parts of the Baltic Sea, the total nitrogen and phosphorous values compared to the offshore Baltic Sea are double. The long-term trend of the open sea area of the Gulf of Riga is characterised by an increase in the concentration of total nitrogen, but concentrations of total phosphorus, regardless of low average indicators measured in 2010, show a growing trend in all monitoring stations. Deficiency of oxygen in the bottom layers in the entire Baltic Sea is an acute topic. Although hypoxia is a natural phenomenon in the Baltic Sea, it is believed that the extent of hypoxia is a result of anthropogenic eutrophication, at least partly. Hypoxia is present in the deeper layers of the Estonian offshore areas (offshore part of the Baltic Sea, in the Gulf of Finland and in the Gulf of Riga) and in the coastal zone in areas of high trophicity. Plankton
Phytoplankton The most important factor that influences phytoplankton is enriching the marine environment with nutrients, or eutrophication. The increase of nutrient concentrations in seawater causes intensive algae blooms, or growth of phytoplankton biomass. According to the HELCOM (2009b) thematic report, the most eutrophic offshore areas, such as the Gulf of Finland and the Gulf of Riga and the northern part of the Baltic Sea, are located along the Estonian coastal waters. Based on the results of operative and general monitoring of the Estonian coastal waters and the assessment system established in Estonia, most of the coastal waters are considered to be in poor condition. An exception is the most eastern and western waters, i.e. the Narva Bay and the Kihelkonna Bay, which condition is good based on the state of phytoplankton. Of the Estonian coastal waters, the Haapsalu Bay is in the worst ecological state.
Zooplankton Zooplankton is an important link in the marine food chain, because juvenile fish stages feed on it.
Zooplankton communities are very varying and respond quickly to changes (e.g. water salinity and climate change) in the ambient environment. Relatively recently it has been proved that there are links between some zooplankton species and phosphorus and nitrogen concentrations of seawater (Põllumäe and Kotta, 2007; Põllumäe et al., 2009). Based on the existing studies, some zooplankton species respond to eutrophication of seawater (Põllumäe and Kotta, 2007; Põllumäe et al., 2009). Currently, there are no indicators that help assess the marine environment condition based on zooplankton in the Baltic Sea.
Benthos
Phytobenthos

152 Strategic Environmental Assessment of the National Development Plan “Estonian Marine Policy 2012−2020”
Draft Report, 2015.
The Baltic Sea brackish water is an extremely complicated environment for sea plants because of varied salinity conditions, different coast types and substrates and other environmental conditions, which is also the reason for relatively low diversity of the Baltic Sea phytobenthos. Plants grow up to 5–6 m deep on the soft seafloor in the Estonian coastal sea. The deepest areas are usually inhabited by charophyte communities. At depths lower than 1 m phanerophytes dominate. Phytobenthos has been used as a means to assess water quality for a long time. Based on the aggregate index of phytobenthos, the condition of most Estonian coastal waters can be given a good score. This index also shows that the Haapsalu Bay is in a poor condition and the Matsalu Bay is in the worst condition.
Zoobenthos The range patterns of zoobenthos communities in Estonian coastal sea depend on the region`s hydrology, characteristics of sediments, in shallower coastal waters also the phytoplankton content in the water column, the character of phytobenthos communities and influence of ice. The crustacean (Crustacea) species are most widespread in the Estonian waters. In addition to crustaceans, the typical zoobenthos of the Estonian marine area includes seawater and brackish water clams (Bivalvia), snails (Gastropoda) and worms (Polychaeta). Hydrozoans (Hydrozoa), ribbon worms (Nemertini), priapulid worms (Priapulida), marine and brackish water oligochaetes (Oligochaeta), moss animals (Bryozoa), marine and brackish water snails (Gastropoda) and clams (Bivalvia) can be found in our marine area. Relatively often, the zoobenthos includes four fresh water species of snails and five fresh water insect groups. Above the halocline, the range of benthic communities is determined by three main factors, which are salinity, depth and type of seabed. Local factors are competition between species and, lately, human impact. To assess the water quality in waterbodies using zoobenthos, Estonian Marine Institute of Tartu University has developed the zoobenthos community index ZKI, the hard bottoms index KPI and the habitat diversity index of phytobenthic zone FDI. The environmental condition of waterbodies calculated by the values of these indexes was good for the entire Estonian coastal sea in 2008–2010.
The main pressures that influence the condition of the benthos are marine environment eutrophication, invasion of non-indigenous species and oxygen deficiency in deep sea. Fish fauna
Highly migratory species The only catadromous species in the Estonian waters is the eel. The stock of the European eel is at low levels and eel fishing is not sustainable. The reason given is small number of spawners (Dekker, 2003), which indicates overfishing in the entire range of the species. The abundance of the eel is negatively influenced by dams that have been built on the migration rivers causing late migration or mortality (Bruijs and Durif, 2009).
153 Strategic Environmental Assessment of the National Development Plan “Estonian Marine Policy 2012−2020”
Draft Report, 2015.
The representatives of anadromous species are the salmon and the sea trout. The number of allowed sized salmon in the Estonian coastal sea depends on the catch of salmon originating from Estonia outside our economic zone. According to prognoses, the catches will remain on the same level in near future (Kesler et al., 2011). Sea trout catches during 1999–2010 have shown a slight growing trend. It must be taken into account, that salmon and sea trout catches include introduced fish. An important factor that causes reduction in the numbers of anadromous species is dams on spawning rivers that block access to the spawning grounds. The success of reproduction is influenced by the water level on the spawning rivers during the autumn and winter period.
Coastal sea fish The coastal sea fish group includes marine species, such as eelpout, sea stickleback, broadnosed pipefish, straightnose pipefish, rock gunnel, lesser sandeel, great sand eel, black goby, sand goby, common goby, two-spotted goby, and longspined bullhead. Fish that inhabit the Estonian part of the Baltic Sea of freshwater origin can be classified as belonging to the coastal sea fish group. The abundance of large species is relatively low, fishing pressure is moderate, but still very different depending on the particular species (Saat et al., 2011). An exception is the non-indigenous species Prussian carp and the round goby that are strongly expanding their range (Eschbaum et al., 2011; Ojaveer et al., 2011). The factors that reduce the abundance are fishing mortality rate, pressure by cormorants, hydrometeorological factors as well as overgrown spawning grounds (Saat et al., 2011; Vetemaa et al., 2010). Demersal fish species These are species which range extends outwards of the shallow coastal area. The European flounder and the Atlantic cod are the main species in the Estonian waters that are of a commercial interest. For the Atlantic cod, a pressure in the eastern part of the Baltic Sea is primarily hydrological processes, such as water exchange with the North Sea (HELCOM, 2006). In the Estonian waters, the European flounder is able to spawn in areas close to the coast with lower salinity (Ojaveer and Drevs, 2003), but their reproduction is more successful following an inflow of salty water. The monitoring data show that the stock of the European flounder has decreased in all the largest areas of the Estonian coastal sea, although the fishing mortality rate can be considered moderate. The reason for the reduction of their stock is the deteriorating situation in flounder spawns (Saat et al., 2011). Pelagic species In the Estonian waters, the typical small size pelagic species are the Baltic herring and the sprat. Spring Baltic herring abundance in the Gulf of Riga is still high (although showing a decreasing trend), but in other sea areas low. Autumn Baltic herring is still in deep depression. The Baltic herring stock in the Estonian economic zone can be considered relatively good. In addition to the Baltic herring and the sprat, an abundant species in the pelagic zone is the three-spined stickleback. Sometimes random visitors (e.g. also the European anchovy) can be found here. Seasonally the garfish is abundant in the Estonian waters. Cyclostomes There are two species of cyclostomes in the Estonian waters: the European river lamprey and the sea lamprey, whereas the latter is found very seldom. The condition of the European river lamprey is significantly better than in the rest of Europe.

154 Strategic Environmental Assessment of the National Development Plan “Estonian Marine Policy 2012−2020”
Draft Report, 2015.
The main pressures on the fish fauna are fishing mortality rate, destruction and declining conditions of habitats and spawning grounds and hydrometeorological conditions. Wild birds Most bird species in the north-western Europe, including the Estonian marine area, are migratory birds and the range and abundance of these species is mostly influenced by factors outside Estonia. Over 40 bird species nest in the Estonian coastal areas and on inlets, of which many species gather into nesting colonies. Even more birds gather outside nesting period forming moulting sites. Seabirds moulting colonies are located on offshore banks (the common scoter, the common eider) as well as in the coastal sea (the common goldeneye, the dabbling ducks, the mute swan, the greylag goose etc.). The autumn migration of birds from the Arctic nesting grounds begins already in the middle of summer and lasts until the end of October. A remarkable congregation of seabirds happens in spring (spring migration) after melting of ice when in addition to the wintering birds other species wintering elsewhere fatten themselves here, such as the long-tailed duck, the scoter, the swan, the goose and the black goose that head on to nest in the tundra. The trends discovered in the work performed for the initial assessment of the Estonian marine areas (TÜ Eesti Mereinstituut, 2012) show great changes in the numbers of wintering waterbirds during the recent 15–20 years. An important component in assessing the Estonian marine area status is the diverse composition of breeding bird species on inlets and in the coastal areas. Breeding birds like wintering birds are stationary for a long time, which means that they are greatly influenced by local pressures.
The main pressures on birds are eutrophication, by-catching and oil pollution. Protected natural objects and Natura 2000
Protected natural objects According to § 4 of the Nature Conservation Act, the protected natural objects in Estonia are protected areas, limited-conservation areas, protected species and fossils, species` protection sites, individual protected natural objects and natural objects protected at the local government level. As of 31 December 2014, there was altogether 3,895 protected natural objects in Estonia. According to the EELIS database (19.09.15), in Estonia there are:
• 343 limited-conservation areas, of which 57 include a part of the sea. In the Estonian waters, the largest limited-conservation areas are Väinameri (Hiiu, Saare, Lääne County), the Pärnu Bay and Kura kurk limited-conservation areas.
• 149 nature conservation areas, of which 23 include a part of the sea; • 149 landscape conservation areas, of which 31 include a part of the sea; • 5 national parks, of which 3 include a part of the sea (Vilsandi, Matsalu and Lahemaa) • 1,380 species protection sites, of which 11 include a part of the sea. • 570 protected plant, fungi and animal species, of which:
155 Strategic Environmental Assessment of the National Development Plan “Estonian Marine Policy 2012−2020”
Draft Report, 2015.
o marine mammals are the grey seal (category III) and the ringed seal (category II) and the harbour porpoise (category III);
o waterbirds are the white-tailed eagle (category I) that feeds on fish and water birds. II category species are the Eurasian bittern, the tundra swan, the whooper swan, the greater scaup, the Steller's eider, the smew, the little gull, the lesser black-backed gull, the razorbill and the black guillemot;
o fish are the European sea sturgeon, the spined loach, the bullhead (category III). Natura 2000 areas Of Natura 2000 areas, 89 nature and bird areas have also a sea part. Of these, 26 are bird areas with a sea part with an area of about 6,500 km2 and 63 nature areas with a sea part with an area of about 3,900 km2. The largest of Natura areas are Lahemaa and Väinameri nature and bird areas and the Pärnu Bay and Kura kurk bird areas (EELIS (Eesti Looduse Infosüsteem - Keskkonnaregister): Keskkonnaagentuur, 15.09.15). All nature and bird areas that have a sea part are in the territorial sea. There are no Natura areas in the economic zone. According to the EELIS database (18.09.15), there are altogether 62 valuable habitat types on the Natura nature areas in Estonia. According to the “Manual of Nature Directive Habitat Types” (Paal, 2007), six of these are marine habitats. Several species included in Annex II of the Nature Directive inhabit Estonian seawaters whose habitats are protected. Of species represented in Estonia, in addition to migratory species and other species of local importance, 65 species belong to Annex I of the Bird Directive. Estonia has to take into consideration about 90 species when selecting bird areas (Natura 2000, 16.09.15). The main risk factors of marine habitat types are construction works in the marine area, for example, construction of ports and windfarms and establishing waterways, but also excavation of mineral resources, marine pollution and eutrophication of the marine environment, but also overgrowing and drainage (Keskkonnaamet, 2009, 2011, 2012). The main pressures on the ringed seal and the grey seal are disturbance by humans, poor state of fish stocks, being killed in fishnets (Keskkonnaamet, 2011; Eesti Mereinstituut, 2012). Land habitats may be endangered by poor management or lack thereof; for example, suspension of grazing or no grazing that may result in overgrowing (Keskkonnaamet 2011b, 2012b). Aquatic birds are threatened by oil pollution, ship and motor boat traffic, disturbance during their breeding period, changes in food base in bird areas (Keskkonnaamet, 2009, 2012). Deficiencies In Estonia, various data sources are available about protected natural objects, including habitat types and species on the Natura areas. It is often the case that valuable data on the habitats and biota (range, area, status, risk factors etc.) are included in different reports that have been prepared during various projects carried out in Estonia, but the Estonian official database EELIS (Estonian Nature Information System) does not include these data. Scattered valuable and important data makes it difficult for nature experts to work and slows down their progress. Marine mammals There are three endemic species of marine mammals in the Estonian coastal waters: the grey seal (Halichoerus grypus), the ringed seal (Phoca hispida) and the harbour porpoise (Phocoena
phocoena).

156 Strategic Environmental Assessment of the National Development Plan “Estonian Marine Policy 2012−2020”
Draft Report, 2015.
The grey seal is a very migratory species whose range is primarily linked to their habitats. The range during the breeding period is linked to the presence of ice during that period (February–March). The main breeding grounds are located on the western and southern coast of Saaremaa, the eastern and central part of the Gulf of Finland, and more seldom in the northern coastal waters of Hiiumaa in normal and milder than average winters. The status of the population of the Baltic Sea grey seal population that inhabits the Estonian coast has constantly improved over recent decades. Due to a great decrease in abundance, hunting of grey seals was prohibited in Estonia in 1972 (Keskkonnaamet, 06.09.2015). In Estonia, ringed seals live mainly in Väinameri and the Gulf of Riga, and less frequently in the Gulf of Finland. The known resting grounds are in Väinameri and in the northern part of the Gulf of Riga on the banks near the coast. Their breeding grounds are mainly in the Pärnu Bay and the northern part of the Gulf of Riga. Distribution during breeding time depends on the existence of suitable ice types. The ringed seal population status can be considered unstable. 8.1.3 Pressures on and status of the natural environment
• Physical damage: siltation, sealing, elimination, smothering, changing the coastline Dredging and excavation can have material impacts on the coastal processes, water column light field, distribution of nutrients, plankton, benthos and fish fauna. The impact on the biota is estimated to last up to two years.
• Underwater noise Noise created by ships and hydrotechnical and explosion operations has a negative impact on fish fauna and marine mammals. Currently, there is no data to determine the quantitative impact for the entire Estonian marine area.
• Enrichment with nutrients As discharges of nitrogen and phosphorus-rich substances is the main cause of eutrophication of the Estonian coastal sea, the status assessment of the existing marine environment (TÜ Eesti Mereinstituut, 2012) clearly shows that the inflowing nutrient amounts are too large for the Estonian coastal sea and the status is considered unsatisfactory based on this indicator.
• Inputs of organic matter
The condition of the Estonian coastal waters based on the input and content of organic matter is not good in most areas. Hence, it is necessary to limit not only nutrient inputs but also organic substance inputs into the coastal sea. It is also reasonable to broaden monitoring for more precise detection of organic substance.
• Introduction of microbial pathogens to waterbodies
The most significant source of pathogenic bacteria in Estonia is the fast-growing cruise ship operating sector and still insufficient organisation of wastewater (sewerage) treatment originating from cruise ships. As cruise ships discharge partly treated sewerage mainly into international waters, it does not have a direct impact on the microbiological quality of the Estonian coastal waters. As the bathing season in Estonia is relatively short, the sea temperature cool and usually healthy people go bathing, the

157 Strategic Environmental Assessment of the National Development Plan “Estonian Marine Policy 2012−2020”
Draft Report, 2015.
microbiological load on waters is local and small, and possible pathogen load unlikely (TÜ Eesti Mereinstituut, 2012).
• Contamination by hazardous substances The status of the Estonian marine area in terms of hazardous substances is average and poor according to HELCOM (2010b) data. However, the content of hazardous substances is not generally in conflict with the main objective of environmental quality specified in the EU norms – the contents of hazardous substances must not significantly increase over time. A positive indicator is that the concentrations of hazardous substances in the Baltic Sea marine environment are decreasing. A decreasing trend is also seen in the content of radioactive substances, although the indicator has not yet dropped to the level before the Chernobyl nuclear power plant disaster.
• Marine litter As the largest part of marine litter is generated on land and it can be presumed that using plastic (including packaging) continues to increase in future, it is important to focus on improving the awareness of people about marine litter and compliant handling of waste.
• Oil pollution from ships and its impact Due to intensive waterborne traffic and significant and extensive impact of oil pollution on the marine environment, oil products leaked into sea due to ship accidents is the largest environmental pollution risk in our marine area.
• Selective extraction of species
For many fish species, the fishing mortality rate is very high. Birds and marine mammals also die due to fishing activities. Selective catching of species is an important pressure on the marine environment.
• Introduction of non-indigenous species
In the Baltic Sea, shipping is the most significant entryway for non-indigenous species that find their way through ship ballast water and by attaching to ship hulls.
• Intentional or systematic release of solid substances into the marine environment
No known data has been published on the amount and nature of food wastes. A potential significant impact on the character of the sea bottom may be caused by erecting wind generators.
• Status of natural environment
To describe the status of the marine environment, eleven qualitative descriptors of good environmental status are used (MSFD, Annex I). Good environmental status of the Estonian marine areas has been achieved only by some descriptors. For five descriptors, at least three indicators good environmental status has not been achieved. For three descriptors (descriptor 7 (Permanent alteration of hydrographical conditions does not adversely affect marine ecosystems), descriptor 10 (Marine litter) and descriptor 11 (Energy and noise)) no indicators exist for the Estonian marine areas.
8.2 METHOD AND SCOPE OF THE SEA

158 Strategic Environmental Assessment of the National Development Plan “Estonian Marine Policy 2012−2020”
Draft Report, 2015.
Two main methods were used when preparing the SEA: compliance analysis and external impacts analysis. Compliance analysis is an assessment of the objectives and measures of the development plan to determine whether they are in agreement with the relevant objectives set by other strategic documents. External impacts analysis is an approach during which the planned activities are compared against a spectrum of external impacts. During the external effects analysis, it is analysed which areas of the natural, economic and social environment and to what extent are influenced by the measures/activities planned for the fulfilment of the objectives of the development plan and, if necessary, proposals are made to improve the implementation plan of the development plan in relation to environmental aspects. In addition, if necessary, alternative or additional measures will be suggested to mitigate negative impacts and proposals will be made to amplify positive impacts. The assessments given during the SEA process are generally short-term and long-term. During the external impacts analysis, the impacts were primarily assessed qualitatively (descriptively) in various areas of the natural and socio-economic environments. Based on the SEA programme (Annex 1), the presumed impact associated with the implementation of the SEA development plan “Estonian Marine Policy 2012−2020” was assessed:
1. On the natural environment (including water environment, atmosphere, seafloor and coasts):
o Impact on the marine biota and habitats (including impact on the protected nature objects and protection objectives of Natura 2000 areas and the integrity of the areas);
o Impact on seawater quality and physical indicators of the marine environment (including underwater noise);
o Impact on air quality and climate change; o Impact on the sustainable use of natural resources and resources.
2. On the socio-economic environment:
o Impact on human wellbeing and health (including outdoor noise); o Impact on maritime business environment (including fisheries, aquaculture,
tourism etc.); o Impact on the marine transport and ports (including navigation safety and
security); o Impact on the marine cultural heritage.
As the SEA is prepared under the principle of the level of precision of strategic development documents, impacts will be assessed on a more general level than in case of a detailed plan or activity permit, although no additional studies will be conducted during the SEA process. When giving assessments, the existing statistics, monitoring and research data are used.
The extent of the impacted area addressed during the SEA process is different by the respective areas. Generally, the area of impact stretches from the coast to the border of the Estonian economic zone, except for cross-border impact and inland waters. 8.3 IMPACT ASSESSMENT
159 Strategic Environmental Assessment of the National Development Plan “Estonian Marine Policy 2012−2020”
Draft Report, 2015.
The compliance analysis (interlinkage of the development plan with other strategic documents) conducted during the SEA process identified that the objectives of the development plan are not in conflict with the objectives specified in regional and European Union documents. No s were found with the objectives set down in the Estonian national documents. The results of the impacts analysis have been presented by relevant areas. Impact on seawater quality and physical indicators of marine environment Positive impacts on seawater quality and physical indicators are mainly caused by activities that help make vessel traffic and related infrastructure safer and promote environmental management. Negative impacts are related to expanding of ports and dredging of waterways and intensification of sea transport. However, dredging of waterways is often necessary for navigation safety regardless of the number of ships that use the waterway. If various organisational measures are implemented (for example, more extensive use of LNG as ship fuel, development of ports` capacity to receive waste and wastewater etc.), then regardless of more intensive vessel traffic, the impacts on seawater quality and physical indicators may not increase (except for underwater noise). The proposals concerning this area developed during the SEA process regarding the topics discussed in the implementation plan of the development plan for the new period are presented in section 8.4. Impact on marine biota and habitats (including impact on protected nature objects) The main negative impact is related to construction works of ports and waterways and intensified vessel traffic. The main risks are dredging operations, deterioration of water quality (reduced water transparency, suspended solids, introduction of organic substances and pollutants into water), noise, risk of oil pollution and invasion of non-indigenous species. If various organisational measures (for example, more extensive use of LNG as ship fuel, developing ports´ capacity to receive waste and wastewater etc.) are applied, the impacts on marine biota may not increase despite more intensive vessel traffic (except underwater noise). Positive impacts are related to activities that help make navigation and related infrastructure safer and promote environmental management. Several measures are intended to help preserve marine environment, improve its status and ensure that it is protected thereby reducing pressures on the natural environment and improving legislative basis. The proposals concerning this area developed during the SEA process regarding the topics discussed in the implementation plan of the development plan for the new period are presented in section 8.4. Impact on air quality (including outdoor noise) and climate change Most objectives and measures adopted by the development plan help directly or indirectly improve air quality or do not have a significant impact thereon. An exception is objectives 2 and 3 that promote growing goods and passengers flows and, if realised, will increase vessel traffic that may cause a negative impact due to worsening air quality and noise situation, especially in ports. As there have been air quality (mainly unpleasant smell in cargo ports where air quality problems are not caused by vessel traffic but the cargo handled in ports) as well as noise (in passenger and cargo ports) problems near larger ports, air quality and noise aspects must be analysed in case of increased cargo and passenger flows and where ports are developed and necessary measures must be taken. The specific features of the location of the particular port must be taken into account.
160 Strategic Environmental Assessment of the National Development Plan “Estonian Marine Policy 2012−2020”
Draft Report, 2015.
Air quality and climate change require introduction of cleaner ship fuels, e.g. LNG. There is no need to include a measure to facilitate using LNG as ship fuel in the new implementation plan of the development plan “Estonian Marine Policy 2012−2020” because it is included in the Marine Strategy`s programme of measures. Impact on sustainable use of natural resources and resources Most objectives and measures set out in the development plan have a positive environmental impact on sustainable use of natural resources and resources. The main impacts are related to the movement of goods and activities that contribute to more efficient vessel traffic (saving fuel) and support introduction of new sustainable technologies (shipbuilding). A negative aspect is related to objective 3, which is designed to increase the number of passengers on the Baltic Sea. It is a fact that growth in the number of passengers causes greater consumption but also increased generation of waste that does not support the implementation of sustainable development principles. Hopefully, the development of nature tourism helps ensure sustainable use of natural resources and resources. The proposal concerning this area developed during the SEA process regarding the topics discussed in the implementation plan of the development plan for the new period is presented in section 8.4. Impact on human well-being and health (including outdoor noise) Human well-being and health are influenced by many factors from air pollution and noise to the general cleanliness of the marine environment. The general social and economic situation also affect people`s well-being. The objectives and measures set out in the development plan take into account the human well-being and health aspect that will mainly have positive impacts when achieved. Crew members, people that live on the coast and those visiting the coast and people involved in marine tourism are influenced. A negative aspect is related to possible air pollution and noise that may be a problem particularly in case of implementation of objectives 2 and 3, i.e. achieving an increase in cargo and passenger flows. The proposal concerning this area developed during the SEA process regarding the topics discussed in the implementation plan of the development plan for the new period is presented in section 8.4. Impact on sea-related business (including fisheries, aquaculture, tourism etc.) Most measures that influence the business environment have a positive impact. Fulfilment of objective 6 has a short-term negative impact, although in a longer perspective it supports sustainability, because several activities and flows are limited (e.g. fishing limits) to improve the marine environmental status. In the long perspective, this will help to not only maintain sustainability of sea-related business but also achieve a cleaner environment to attract tourists and offer better opportunities for aquaculture operations in the marine areas. The proposal concerning this area developed during the SEA process regarding the topics discussed in the implementation plan of the development plan for the new period is presented in section 8.4. Impact on marine transport and ports (including navigation safety and security, marine rescue) A positive impact on this area due to fulfilment of objectives set in the development plan will occur. Fulfilment of all objectives included in the development plan have a smaller or greater impact. The author of this report does not see any need to highlight any new possible topics that have not been discussed in the development plan.

161 Strategic Environmental Assessment of the National Development Plan “Estonian Marine Policy 2012−2020”
Draft Report, 2015.
Impact on marine cultural heritage Objectives 10 (marine tourism and marine and coastal business activities are developed) and 11 (the preservation of marine cultural heritage and traditions is secured) are set in the development plan to ensure preservation of marine cultural heritage. Other objectives of the development plan have an indirect positive impact because the objectives are related to the development of the maritime sector (which is also a part of marine heritage). Activities that promote marine tourism (including reconstruction and development of small and fishing harbours) have mainly been designed to help preserve the coastal lifestyle. In addition to marine tourism, it is important to continue supporting measures that motivate people (including coastal fishermen) to continue living in the area. Implementation of objective 4 (Estonian shipbuilding and repair operations are internationally competitive) helps to achieve this. The proposals concerning this area developed during the SEA process regarding the topics discussed in the implementation plan of the development plan for the new period are presented in section 8.4. Cumulative impacts and cross-border impact Positive impacts have a cumulative effect on the natural environment: more efficient environmental management and safer navigation should in the end lead to a cumulative decrease of the pressure on the environment and environmental pollution from shipping over time. Growth of vessel traffic and expanding/developing of ports have a negative cumulative impact on the natural environment. It is primarily related to ship accident risk and associated increased probability of oil pollution and dredging and dumping operations. Other environmental pressures related to shipping sector, such as litter, noise, air pollution, release of other pollutants into the sea, invasion of non-indigenous species, may also be considered cumulative. The practice of recent decades has shown that the Baltic Sea countries` common environmental policy in HELCOM has brought about several positive developments. Regardless of the economic growth of the countries surrounding the sea, the environmental problems have not generally gotten worse. Fulfilment of the development plan objectives in socio-economic environment has a positive overall cumulative impact on the marine sector because the development plan is designed to further the marine sector. Positive impacts are related to the sea-related business environment, marine transport, development of ports and preservation of marine cultural heritage. Fulfilment of all objectives of the development plan has a smaller or greater impact. The cumulative negative impacts that occur in the socio-economic environment are mainly related to human well-being and health. The main factors that have primarily a cumulative effect are air pollution and noise caused by expanding of ports and thereby increased cargo and passenger flows that affect people that work in ports as well as people that live nearby. However, the positive development of maritime sector is expected to lead to economic growth that has an indirect positive impact on the well-being of people. To reduce the negative cumulative impacts, measures have to be implemented that would ensure that air pollution and noise aspects (including appropriate standards) are taken into account when ports are expanded and developed. Estonia`s administrative territory and related marine environment and development of Estonian marine sector are considered when the objectives of the development plan are set down. Estonia
162 Strategic Environmental Assessment of the National Development Plan “Estonian Marine Policy 2012−2020”
Draft Report, 2015.
is related to several other countries through sea, which means that the objectives set by the development plan influence also the marine environment and maritime sector of other countries. For example, direct cross-border impacts are related to the improvement of marine environment status as well as improving navigation safety in the Estonian waters. Developing ports` infrastructure create better conditions for servicing foreign vessels that visit Estonian ports. An international positive aspect is sea-related research work as well as planning activities that promote tourism (marine tourism, preservation of marine cultural heritage). However, promotion of Estonian shipping and ship-building sectors may increase competition between the Baltic Sea ports and countries. The marine policy measures do no cause any significant negative cross-border impacts. 8.4 PROPOSALS The proposals of the author of the SEA concerning the topics that should be taken into account when preparing the new implementation plan of the “Estonian Marine Policy 2012−2020” development plan are presented below: 1. In order to increase the positive impacts and alleviate negative impacts on seawater quality
and physical indicators of the Estonian Marine Policy, the expert group makes a proposal to add the following activities to the measures of objective 6 in the implementation plan for the new period: • Currently dredging and dumping works are considered one by one from the point of
environmental impact, but knowledge about the total impact and extent of the pressure on the marine environment of these works is insufficient. Therefore, it is proposed to establish a common database of on the water excavation and dredging and dumping operations. This database would give a whole picture of the works that are conducted in the Estonian marine areas that modify the coast and sea-floor and it could be used for spatial planning, environmental impact assessments of property developments and monitoring. The database should include information about presumed volume of dredging (dumping) (in the special use of water permit application phase), the actual dredged volume (will be clear after the works are completed), integration of sediments and content of hazardous substances in sediments. If the works have been monitored, the database should include references to monitoring reports.
• We suggest to continue the tradition (that has evolved during the environmental impact assessment process) of no dredging works in shallow close-to coast regions. For that purpose, the distribution of dumping grounds in the Estonian coastal sea should be reviewed (Figure 2.19, 2.3.1) and, if necessary, changed. An exception is regions with active sediment transport where it may be reasonable to put dredged material on the coast or near the coast to reduce sediment deficit (the environmental impact assessment expert group may make the relevant proposal). Estonia has to take an inventory of dumping grounds according to the London convention.
• It is proposed to add underwater noise monitoring to the national monitoring programme. Currently there is no assessment of the negative effect caused by this pressure in Estonian marine areas. The results of LIFE+ project “Baltic Sea Information on the Acoustic Soundscape” (BIAS) may be taken as the basis when preparing the monitoring programme.
• We suggest to classify establishment of waterways intended for ships with displacement >1,350 tons as an activity of significant environmental impact. According to current legislation, establishment of waterways (if at least 10,000 m3 is not dredged) is not considered to have a significant environmental impact and an activity
163 Strategic Environmental Assessment of the National Development Plan “Estonian Marine Policy 2012−2020”
Draft Report, 2015.
that requires conducting of the environmental impact assessment. When establishing waterways, the environmental protection aspects should be taken into account and their impact could be assessed in the spatial plan of marine areas.
• As there are nuclear power plants on the coast of Estonia`s neighbouring countries, it is suggested to install in the Gulf of Finland at least one autonomous measuring device that sends real-time radioactivity data. This could be integrated into the first Baltic Sea offshore autonomous monitoring station close to Keri Island.
• The largest environmental impact caused by hydraulic engineering in Estonian marine areas is Väike väin dyke. The impact of this structure can be mitigated with putting openings into the dyke. This would reduce the blocking effect of this artificial structure on water and substance exchange and ecological components of the sea. The extent of the impact should be prior studied with current and substance distribution models that are verified by monitoring data from Väike väin. Then the impact on the ecological components can be assessed. The local residents are also interested in putting openings into the dyke. We suggest to analyse the possible impact on the marine environment of openings in Väike väin dyke.
• It is proposed to prepare management plans for protected areas, primarily for national parks and Natura 2000 areas and add this activity to measure 6.1. Currently many protected areas have no management plan, which makes it harder to achieve conservation objectives.
• It is proposed to support developing the existing Estonian Nature Information System (Eestimaa Looduse Infosüsteem - EELIS), improve it and presentation of information therein and add this activity to measure 6.1. Valuable data have been collected in Estonia on habitats and biota (range, area, condition, risk factors etc.) during various projects but the data are not included in the official database. Data are deficient or do not reflect the actual situation regarding some areas.
• Implementation of objective 6 has a positive impact on human health and well-being through a better marine environment. People that live on the coast but also people that visit the coast or are involved in marine tourism are affected. It is important to increase people`s awareness on what everybody can do to improve the marine environment status. Based on the above, it is proposed to consider as a new measure planning of increasing people`s awareness. One topic is reducing litter that is introduced to the sea from the coast (including beaches).
2. The author of the environmental strategic assessment believes that the topic of wind energy
as an alternative energy source has not been included as objectives and measures of the development plan of the “Estonian Marine Policy 2012−2020”. The Estonian Renewable
Energy Action plan up to 2020 specifies as an action supporting offshore windfarm establishment with investment aid when tariff free financing sources are found. The National Spatial Plan “Estonia 2030+” has determined suitable areas for the establishment of off-shore wind parks that have been detailed with the county planning of the marine areas of Hiiu and Pärnu counties. As wind energy external costs are many times smaller compared to the production of electricity by burning fossil fuels, then by increasing the proportion of wind generators in electricity production will improve the environmental quality of the entire region (nation) both from the nature as well as economic aspects. Based on the renewable energy action plan and the national spatial plan and county plans, it is suggested to consider introducing measures to develop the alternative energy sector.

164 Strategic Environmental Assessment of the National Development Plan “Estonian Marine Policy 2012−2020”
Draft Report, 2015.
3. In order to facilitate fulfilment of objectives 10 and 11, it is necessary to include additional measures intended for the development of sea tourism, taking into account primarily recreational craft tourists, and better introduction of cultural heritage especially through the development of nature tourism. The need to direct marketing activities (including dissemination of tourist information) to the final consumer as well as tour operators so that optimal information and access to channels is ensured during the visitor`s entire trip has been highlighted in the Estonian National Tourism Development Plan 2014−2020 (2013). In addition, it is important to develop the technical platform of the tourism information system by improving its user-friendly features, exchange of information with external databases and ensuring functioning of the system. It is also important to offer additional value in addition to dissemination of information at tourist information and visitor centres that service clients. To develop nature tourism, collaborative networks should be created to unite culture, creative industries and tourism sector businesses. Consequently, the author of the SEA makes a proposal to consider measures that improve combining recreational craft and nature tourism in the Estonian marine and coastal areas to be added to objectives 10 and 11 of the development plan when preparing the new implementation plan of the “Estonian Marine Policy 2012−−−−2020”.
4. The author of the strategic environmental assessment is of an opinion that the “Estonian
Marine Policy 2012−2020” does not include sufficiently opportunities for the development of aquaculture related businesses. Several objectives and activities that should help develop aquaculture business have been set out in the Estonian Aquaculture Development Strategy
2014–2020 (2013) and the Estonian Aquaculture Multiannual National Action Plan
2014−2020 (2014). Most important is cooperation with research and development institutions to develop and launch products with higher added value that are better differentiated on the market. Supporting the development of technologies to farm new species that suit Estonian conditions and development and implementation of suitable financing and insurance schemes are also important activities. The study “Research on
mapping the most suitable areas for aquaculture escalation, development of infrastructure
and the implementability of innovative technologies” (Jaanuska, 2015) shows that the prerequisite of the development of aquaculture is cooperation of fish farmers, innovation and improving professional education in this area. In addition, the study notes that there is a great potential to develop aquaculture business in the same areas as offshore wind farms (Jaanuska, 2015). The author of the SEA makes a proposal to plan measures for the development of offshore aquaculture (e.g. support establishment of protected areas, specific research on the protected areas) when preparing the new implementation plan of the “Estonian Marine Policy 2012−−−−2020”.
5. In addition to facilitating tourism, it is important to continue supporting activities that
motivate people (including coastal fishermen) that live in coastal villages to stay on. Fulfilment of objective 4 (Estonian shipbuilding and repair operations are internationally competitive) helps to achieve this. In addition, people are motivated to stay on in the area by similar activities financed in recent years by the European Fisheries Fund, such as renovation of small harbours and loading places, production and direct marketing of fish products and agar-agar, diversification of activities of fishermen outside fishing season and supporting training. It it also important to support maintaining of coastal landscapes (including coastal meadows) and promote cooperation between different parties (land owners, local authorities, Environmental Board etc.). Furthermore, it is important to map the location of historic and still preserved coastal villages and their state and the memories

165 Strategic Environmental Assessment of the National Development Plan “Estonian Marine Policy 2012−2020”
Draft Report, 2015.
of locals. Based on the above, the author of the SEA suggests to consider the following activities as new measures of objective 11 of the development plan when preparing the new implementation plan of the “Estonian Marine Policy 2012−−−−2020”: • facilitating activities that support people that live in coastal villages to stay on
(including coastal fishermen); • supporting maintenance of coastal landscapes (including coastal meadows) and
promoting cooperation between different parties (land owners, local authorities, Environmental Board etc.);
• mapping the location of historic and still preserved coastal villages and their state and the memories of locals.
8.5 DESRIPTION OF MONITORING RQUIREMENTS AND FOLLOW-UP ASSESSMENT
Environmental monitoring is a constant monitoring of environmental status and factors influencing it that includes environmental observations and analyses and processing of monitoring data. In order to assess the actual environmental impact of the measures and activities that are designed to achieve the objectives of the development plan, it is necessary to conduct periodically assesment/analysis of the quality of environmental components. The monitoring and follow-up of the development plan must give information on how any implemented measure/activity has influenced various environmental components. Hence, it is not only necessary to gather data on the natural environment and environmental pollution, but also social and economic environment data have to be collected so that the data would help update the development plan data. The authority that gathers and analyses monitoring data is the authority that initiates the preparation of the development plan and reviews it, i.e. the Ministry of Economic Affairs and Communications in cooperation with other competent authorities. The author of the SEA suggests to conduct monitoring based on the parameters of the natural as well as socio-economic environment. The suggested monitoring measures are presented in section 6 of the SEA report.
166 Strategic Environmental Assessment of the National Development Plan “Estonian Marine Policy 2012−2020”
Draft Report, 2015.
MAIN REFERENCED SOURCES
• Admiral Danish Fleet HQ, National Operations, Maritime Environment, 2011. Sub-
regional risk of spill of oil and hazardous substances in the Baltic Sea (BRISK). Risk Model Result Report.
• Andrejev O., Myrberg K., Alenius P. and Lundberg P.A., 2004. Mean circulation and water exchange in the Gulf of Finland - a study based on three-dimensional modeling. Boreal. Env. Res. 9: 1-16.
• BACC II autor team, 2015. Assessment of Climate Change for the Baltic Sea Basin, 477 lk, Springer.
• Balti Keskkonnafoorum, 2011. Väärtuslikud avameremadalikud Eesti vetes. • Bergman A., 2007. Pathological changes in seals in Swedish waters: The relation to
environmental pollution. Tendencies during a 25-year period. Thesis No.2007: 131, Swedish University of Agricultural Sciences, ISBN 978-91-85913-30-5.
• Bergström, L., Sundqvist, F. & Bergström, U., 2013. Effects of an offshore wind farm on temporal and spatial patterns in the demersal fish community. Marine Ecology Progress Series, vol. 485, 199–210.
• Bredhult C., Bäcklin B., Bignert A. & Olovsson M., 2008. Study of the relation between the incidence of uterine leiomyomas and the concentrations of PCB and DDT in Baltic gray seals. Reproductive Toxicology (2):247-225.
• Bruijs MCM & Durif CMF, 2009. Silver eel migration and behaviour. Spawning Migration of the European Eel: 65-95.
• Dekker W., 2003. Status of the European eel stock and fisheries. Eel Biology: 237-254. • Durinck, J., Skov, H., Jensen, F.P. & S. Pihl., 1994. Important Marine Areas for
Wintering Birds in the Baltic Sea. EU DG XI research contract no. 2242/90-09-01. Ornis Consult report, 110.
• EELIS (Eesti Looduse Infosüsteem – Keskkonnaregister): Keskkonnaagentuur (september 2015).
• EELIS: Infoleht (15.09.2015). Natura 2000 loodusalad ja linnualad. • Eelsalu, M., 2013. Laineenergia potentsiaal Eesti rannikumeres. • Eesti elektrimajanduse arengukava aastani 2018, 2008. • Eesti kalanduse strateegia 2014–2020, 2013. • Eesti Keskkonnastrateegia aastani 2030, 2007. • Eesti Keskkonnauuringute Keskus, 2012. Õhukvaliteedi andmete kogumine ja
aruandlus. 2012 a. aruanne. • Eesti Looduse Fond, 2007. Merereostustõrje käsiraamat. • Eesti maaelu arengukava 2014–2020, 2014. • Eesti Mereinstituut, (15.09.15). Natura 2000 rakendamine Eesti merealadel: alade valik
ja kaitsemeetmed - ESTMAR, 2007-2011. (http://www.sea.ee/estmar/). • Eesti riiklik turismiarengukava 2014–2020, 2013. • Eesti säästva arengu riiklik strateegia aastani „Säästev Eesti 21“, 2005. • Eesti taastuvenergia tegevuskavas aastani 2020, 2010. • Eesti vesiviljeluse sektori arengustrateegia 2014–2020. • Ellermaa M., Pettay T. & Könönen J., 2010: Sügisränne Põõsaspeal 2009. aastal.
Hirundo 23:21-46.

167 Strategic Environmental Assessment of the National Development Plan “Estonian Marine Policy 2012−2020”
Draft Report, 2015.
• Eschbaum, R., 2009. Kalastiku uuring. Sõitjate ja veoste üle Suure väina veo perspektiivse korraldamise kava koostamine ja keskkonnamõjude strateegiline hindamine, Majandus- ja kommunikatsiooniministeerium, Maanteamet.
• Eschbaum, R., A. Albert, H. Špilev, K. Jürgens, M. Vetemaa, Ü. Talvik, A. Verliin, and T. Saat., 2011. “Rannikumere kalad.”Rahvusliku kalanduse andmekogumisprogrammi täitmine. III vahearuanne, edited by T. Saat, pp. 1-193. Tallinn: TÜ Eesti Mereinstituut.
• Euroopa Komisjon, 2011. Komisjoni teatis Euroopa Parlamendile, Nõukogule, Euroopa Majandus- ja sotsiaalkomiteele ning Regioonide Komiteele, milles käsitletakse direktiivi 1999/32/EÜ rakendamise läbivaatamist seoses teatavate vedelkütuste väävlisisaldusega ja meretranspordist tuleneva saasteainete heite täiendavat vähendamist. Brüssel, 15.7.2011; KOM(2011) 441 lõplik.
• Euroopa Liidu bioloogilise mitmekesisuse strateegia aastani 2020, 2010. • Euroopa Liidu Läänemere piirkonna strateegia. • European Environment Agency (EEA), 2013. The impact of international shipping on
European air quality and climate forcing. EEA Technical Report, No 4/2013. • Final report of Baltic marine litter project MARLIN - litter monitoring and raising
awareness. 2011-2013, http://www.projectmarlin.eu, 13.08.2015. • Fleming, V. & Kaitala, S., 2006. Phytoplankton spring bloom intensity index for the
Baltic Sea estimated for the years 1992 to 2004. Hydrobiologia 554, 57–65. • Fleming-Lehtinen V., Laamanen, M., Kuosa, H., Haahti, H. & Olsonen, R., 2008. Long-
term development of inorganic nutrients and chlorophyll a in the open northern Baltic Sea. Ambio 37, 86-92.
• GASUM jt., 2015. Balticconnector. Soome ja Eesti vaheline maagaasitorustik. Keskkonnamõju hindamise aruanne.
• Graham, A.L. and Cooke, S.J., 2008. The effects of noise disturbance from various recreational boating activities common to inland waters on the cardiac physiology of a freshwater fish, the largemouth bass (Micropterus salmoides). Aquatic Conservation Marine and Freshwater Ecosystems 18, 1315–1324.
• Handegard, N.O., Michalsen K. & Tjøstheim, D., 2003. Avoidance behavior in cod, Gadus morhua, to a bottom trawling vessel. Aquatic Living Resources 16, 265–270.
• Harding K.C. & Härkönen T.J., 1999. Development in the Baltic grey seal (Halichoerus grypus) and Ringed seal (Phoca hispida) populations during the 20th century. AMBIO 28, No.7: 619-627.
• Harkonen T., Jüssi M., Jüssi I., Verevkin M., Dmitrieva L., Helle E., Sagitov R. & Harding K. C., 2008. Seasonal Activity Budget of Adult Baltic Ringed Seals. PLoS ONE 3(4). DOI: 10.1371/journal.pone.0002006.
• Harrastuskalapüügi arengukava aastateks 2010–2013 (perspektiiviga kuni 2018). • HELCOM 2014b. Annual report on illegal discharges observed during arieal
surveillance 2013, 13 pp. • HELCOM, 2006. Development of tools for assessment of eutrophication in the Baltic
Sea. Baltic Sea Environment Proceedings No. 104, 64 pp. • HELCOM, 2009. Biodiversity in the Baltic Sea – An integrated thematic assessment on
biodiversity and nature conservation in the Baltic Sea. Balt. Sea Environ. Proc.116B. • HELCOM, 2009b. Eutrophication in the Baltic Sea. An integrated thematic assessment
of the effects of nutrient enrichment in the Baltic Sea region. Baltic Sea Environment Proc. 115B, 148 p.
168 Strategic Environmental Assessment of the National Development Plan “Estonian Marine Policy 2012−2020”
Draft Report, 2015.
• HELCOM, 2010. Maritime Activities in the Baltic Sea – An integrated thematic assessment on maritime activities and response to pollution at sea in the Baltic Sea Region. Balt. Sea Environ. Proc., 123.
• HELCOM, 2010b. Hazardous Substances in the Baltic Sea- An Integrated Thematic Assessment of Hazardous Substances in the Baltic Sea. Balt. Sea Environ. Proc. 120B, 116p.
• HELCOM, 2012. Checklist of Baltic Sea Macro-species. Baltic Sea Environment Proceedings No. 130.
• HELCOM, 2014. Annual report on shipping accidents in the Baltic Sea in 2013. • HELCOM. 2004. The Fourth Baltic Sea Pollution Load Compilation (PLC-4). Baltic
Sea Environment Proceedings, 93, 1-188. • HELCOMi Läänemere tegevuskava aastani 2021, 2007. • Hendrikson & Ko OÜ, 2011. Neugrundi meretuulepargi keskkonnamõju hindamine.
Aruanne Töö nr: 864/06. Tartu. 449 pp. • Herküll, K. & Kotta, J., 2012. Assessment of the ecological impact of an oil spill on
shallow brackish-water benthic communities: a case study in the northeastern Baltic Sea. Estonian Journal of Ecology 61 (3): 173-189.
• Hiiu maakonnaga piirnevate merealade maakonnaplaneering (kehtestamata); • http://geoportaal.maaamet.ee/, Maavarude koondbilansid, 31.08.2015. • http://loodus.keskkonnainfo.ee/eelis/default.aspx?id=1678265564&state=3;-
951956260;est;eelisand. • http://www.itopf.com/knowledge-resources/documents-guides/environmental-effects/ • Hänninen, S. & J. Sassi (2009) Estimated nutrient load from waste waters originating
from ships in the Baltic Sea area – Updated 2009. Researched Report VTT-R-07396-08.
• ICES, 2011b. Report of the Working Group on Widely Distributed Stocks (WGWIDE), 23 - 29 August 2011, ICES Headquarters, Copenhagen, Denmark. ICES CM 2011/ACOM:15. 642 pp.
• ICES. 2011. Report of the ICES Advisory Committee, 2011. ICES Advice, 2011. Book 1.
• ITOPF (23.09.15). Environmental effect of oil spills. • ITOPF, 2011. Effects of oil pollution on the marine environment. Technical information
paper 13. • Jaanus, A., Andersson, A., Hajdu, S., Huseby, S., Jurgensone, I., Olenina, I., Wasmund,
N. & Toming, K., 2007. Shifts in the Baltic Sea summer phytoplankton communities in 1992-2006. HELCOM Indicator Fact Sheets 2007. Online 15.09.2015, http://helcom.fi/baltic-sea-trends/environment-fact-sheets/eutrophication/shifts-in-the-baltic-sea-summer-phytoplankton-communities-in-1992-2006.
• Jaanuska, H., 2015. Vesiviljeluse laiendamiseks sobivaimate alade kaardistamise, vajalike infrastruktuuride arendamise ja innovatsiooniliste tehnoloogiate elluviidavas.
• Johansson, L., Jalkanen, J.-P., Kalli, J. & Kukkonen, J., 2013. The evolution of shipping emissions and the costs of recent and forthcoming emission regulations in the northern European emission control area. Atmospheric Chemistry and Physics Discussions, 13, 16113–16150, 2013.
• Järvik, A., 2011. Loode-Eesti rannikumere madalikele tuuleparkide rajamise KMH. Töö nr. LPMI01655. Tallinn: TÜ Eesti Mereinstituut. 244 pp.
169 Strategic Environmental Assessment of the National Development Plan “Estonian Marine Policy 2012−2020”
Draft Report, 2015.
• Jüssi M., Härkönen T., Helle E., Jüssi I., 2008. Decreasing Ice Coverage Will Reduce the Breeding Success of Baltic Grey Seal (Halichoerus grypus) Females. AMBIO 37 (2), lk 80-85.
• Jüssi, I., 2010. Mereimetajad. Sõitjate ja veoste üle Suure väina veo perspektiivse korraldamise kava koostamine ja keskkonnamõjude strateegiline hindamine, Majandus- ja kommunikatsiooniministeerium, Maanteeamet.
• Kalli, J., Jalkanen, J-P., Johansson, L. & Repka, S., 2013. Atmospheric emissions of European SECA shipping: long-term projections. WMU Journal of Maritime Affairs (2013) 12:129–145.
• Keskkonnaamet, 2009. Küdema lahe hoiuala ja Laidu saare looduskaitseala kaitsekorralduskava 2011-2020. http://www.keskkonnaamet.ee/kkk/Kydema_lahe_HA_ja_Laidu_saare_LKA_KKK_2011_2020.pdf.
• Keskkonnaamet, 2011. Hiiumaa laidude maastikukaitseala kaitsekorralduskava 2011–2019. http://loodus.keskkonnainfo.ee/eelis/GetFile.aspx?fail=-1153133558.
• Keskkonnaamet, 2011b. Abruka looduskaitseala ja Abruka hoiuala kaitsekorralduskava aastateks 2011-2020. http://loodus.keskkonnainfo.ee/eelis/GetFile.aspx?fail=-381321612.
• Keskkonnaamet, 2012. Väinamere hoiuala mereosa, Kadakalaiu viigerhülge, Pujuderahu hallhülge ja Selgrahu hallhülge püsielupaikade (osa Väinamere linnu- ja loodusalast) kaitsekorralduskava 2013–2022 http://www.keskkonnaamet.ee/kkk/Vainamere_HA_mereosa_hylgePEPid_KKK_2013_2022.pdf.
• Keskkonnaamet, 2012b. Tagamõisa puisniidu ja Tagamõisa hoiuala kaitsekorralduskava aastateks 2012-2021 http://loodus.keskkonnainfo.ee/eelis/GetFile.aspx?fail=2043112556.
• Keskkonnaamet, 2013. Hädaolukordade riskianalüüs. Ulatuslik rannikureostus. • Keskkonnaamet, 2015. Hallhüljes (Helichoerus grypus). 6.09.2015. URL:
http://www.keskkonnaamet.ee/teenused/jahindus-4/hulgejaht/ • Keskkonnaministeerium, 2012. Üleujutusohuga seotud riskide esialgne hinnang. • Keskkonnaministeeriumi koduleht, liigikaitse http://www.envir.ee/et/liigikaitse
(19.09.15). • Kesler M., Kangur M., Vetemaa M., 2011. Natural re-establishment of Atlantic salmon
reproduction and the fish community in the previously heavily polluted River Purtse, Baltic Sea. Ecology of Freshwater Fish, 3: 472-477.
• Kotta, I., Kotta, J., 1997. Changes in zoobenthic communities in Estonian waters between the 1970's and 1990's. An example from the southern coast of Saaremaa and Muuga Bay. In: Proceedings of the 14th Baltic Marine Biologists Symposium. Ojaveer, E. (ed.). Estonian Academy Publishers, Tallinn, 70–79.
• Kotta, J., Jaanus, A., Kotta, I., 2008. Haapsalu and Matsalu Bay. Schiewer, U. (Toim.). Ecology of Baltic Coastal waters (245 - 258). Springer, Berlin.
• Kousa, A., Koskentalo, T. & Matilainen, L., 2013. SNOOP - Exposure and health effects estimation in Helsinki, Turku and Tallinn.
• Kowalczuk, P., Zabłocka, M., Sagan, S., Kuliński, K., 2010. Fluorescence measured in situ as a proxy of CDOM absorption and DOC concentration in the Baltic Sea. Oceanologia, 52, 431–471.
• Kujala, P., Hänninen, M., Arola, T. ja Ylitalo, J., 2013. Reliability Engineering and System Safety, 94(8), pg. 1349–1357.

170 Strategic Environmental Assessment of the National Development Plan “Estonian Marine Policy 2012−2020”
Draft Report, 2015.
• Laanemets, J., Väli, G., Zhurbas, V., Elken, J., Lips, I. and Lips, U., 2011. Simulation of mesoscale structures and nutrient transport during summer upwelling events in the Gulf of Finland in 2006. Boreal Env. Res., 16A, 15-26.
• Lagemaa, P., 2012. Operational Forecasting in Estonian Marine Waters., Tallinna Tehnikaülikool Meresüsteemide Instituut, Tallinn: TTU Press.
• Lahemaa rahvuspargi kaitsekorralduskava 2016-2025 tööversioon, mai 2015. • Larsson K. & Tydén L., 2005. Effects of oil spills on wintering Long-tailed Ducks
Clangula hyemalis at Hoburgs Bank in the central Baltic Sea between 1996/97 and 2003/04. Ornis Svecica, 15:161–171.
• Lehmann, A. Getzlaff, K., Harlass, J., 2011. Detailed assessment of climate variability in the Baltic Sea area for the period 1958 to 2009. Climare Research, 46 (2011), pp. 185–196.
• Liblik, T ja Lips, U., 2011. Characteristics and variability of the vertical thermohaline structure in the Gulf of Finland in summer. Boreal Env. Res., 16A, 73–83.
• Liblik, T., Laanemets, J., Raudsepp, U,. Elken, J., Suhhova, I., 2013. Estuarine circulation reversals and related rapid changes in winter near-bottom oxygen conditions in the Gulf of Finland, Baltic Sea. Ocean Science, 9, 917 - 930.
• Lilja, K., Norström, K., Remberger, M., Kaj, L., Egelrud, L., Junedahl, E., Brorström-Lunden, E., Ghebremeskel, M., Schlabach, M., 2009. Screening of Selected Hazardous Substances in the Eastern Baltic Marine Environment,Report B 1874, September 2009, 57 p.
• Lilover, M.-J.; Stips, A., 2008. The variability of parameters controlling the cyanobacteria bloom biomass in the Baltic Sea. Journal of Marine Systems, 74(SI), S108 - S115.
• Lips, I., Lips. U. and Liblik, T., 2009. Consequences of coastal upwelling events on physical and chemical patterns in the central Gulf of Finland (Baltic Sea). Continental Shelf Research, 29, 1836- 1847.
• Looduskaitse arengukava aastani 2020, 2012. • Loos, R., Gawlik, B.M., Locoro, G., Rimaviciute, E., Contini, S., Bidoglio, G., 2008.
EU Wide Monitoring Survey of Polar Persistent Pollutants in European River Waters. JRC Scientific and Technical Reports EUR 23568 EN, JRC 48459, Luxembourg: Office for Official Publications of the European Communities, European Communities, 2008, 51p.
• Lääne maakonnaplaneeringu tuuleenergeetika teemaplaneering, 2013. • Lääne-Eesti, Ida-Eesti ja Koiva vesikonna veemajanduskavad 2015–2021. • Maaeluministeerium, 2015. Varasemate aastate püügiandmed. 28.09.2015.
http://www.agri.ee/et/varasemate-aastate-puugiandmed. • Mackenzie, B. R. and Schiedek, D., 2007. Daily ocean monitoring since the 1860s
shows record warming of northern European seas. Global Change Biology, 13: 1335–1347. doi: 10.1111/j.1365-2486.2007.01360.
• Majandus- ja Kommunikatsiooniministeerium, 2013. Merendussektori ülevaade 2012. • Majandus- ja Kommunikatsiooniministeerium, 2014. 2013. a merenduspoliitika
täidetud tegevused. • Martin G., 2000. Phytobenthic communities of the Gulf of Riga and the Inner Sea of the
West-Estonian Archipelago. Doktoritöö. Tartu University Press. • Mustonen, M., 2013. Noise as an environmental challenge for ports;
171 Strategic Environmental Assessment of the National Development Plan “Estonian Marine Policy 2012−2020”
Draft Report, 2015.
• Myrberg, K., Andrejev, O., 2003. Main upwelling regions in the Baltic Sea – a statistical analysis based on three-dimensional modelling. Boreal Environment Research 8 (2), 97–112.
• Natura 2000 (17.09.15). Eestis esinevad loodusdirektiivi taime- ja loomaliigid. http://www.natura2000.envir.ee/files/doc/eestiliigid.pdf.
• Natura 2000. Linnu- ja loodushoiualade võrgustik. 15.09.15, 16.09.15. http://www.natura2000.envir.ee/.
• Nord Stream, 2009. Environment impact assessment report. Natural gas pipeline through the Baltic Sea. Environmental imact assessment in the exclusive economic zone of Finland. 1–966.
• Ojaveer H., Kotta J., Põllumäe A., Põllupüü M., Jaanus A. & Vetemaa M., 2011. Alien species in a brackish water temperate ecosystem: annual-scale dynamics in response to environmental variability. Environ. Res., 111, 933–942.
• Ojaveer, E. & Drevs, T., 2003. Flounder, Platichthys flesus trachurus (Duncker). Fishes of Estonia (362-370). Tallinn: Estonian Academy Publishers.
• Ojaveer, H. & Järv, L. 2003. Eelpout, Zoarces viviparus (L.). Ojaveer, E., Pihu, E., Saat, T. (Toim.). Fishes of Estonia (316 - 323). Tallinn: Estonian Academy Publishers.
• Ojaveer, H., Eek, L. & Kotta, J., 2011. Vee võõrliikide käsiraamat. Tallinn. • Oregon Sierra Club, 2014. Summary of Recent Science: Climate Impacts of Natural Gas
Production and LNG Export. Edition One, August 7, 2014 (http://www.westernlaw.org/sites/default/files/Summary%20of%20Recent%20Science-Climate%20Impacts%20of%20Natural%20Gas%20Production%20and%20LNG%20Export-Edition%20One%20FINAL-August%207%202014%5B1%5D.pdf).
• Orviku, K., 1993. Nüüdisrandla. Rmt.: Lutt, J. & Raukas, A. (toim.) Eesti Šelfi Geoloogia. Eesti Geoloogia Selts. Tallinn.
• OSPAR Commission, 2009. Overview of the impacts of anthropogenic underwater sound in the marine environment, OSPAR Convention for the Protection of the Marine Environment of the North-East Atlantic. Biodiversity and Ecosystem Series, 1–134.BIAS 2014.
• OÜ Alkranel, TTÜ Meresüsteemide Instituut, OÜ Artes Terrae., 2015. Hiiu maakonnaga piirneva mereala maakonnaplaneeringu keskkonnamõju strateegiline hindamine.
• Pihu E & Turovski A., 2001. Eesti mageveekalad. Tallinn. 2001. • PwC AS, 2014. Logistikasektori mõjuulatus Eesti majanduses. • Põllumäe, A. & Kotta, J., 2007. Factors describing the distribution of the zooplankton
community in the Gulf of Finland in the context of inter¬actions between native and introduced predatory cladocerans. Oceanologia 49(2), 277–290.
• Põllumäe, A., Kotta, J. & Leisk, Ü., 2009. Scale-dependent effects of nutrient loads and climatic conditions on benthic and pelagic communities in the Gulf of Finland. Marine Ecology 30, (Suppl. 1), 20–32.
• Pärnu maakonnaga piirnevate merealade maakonnaplaneering (kehtestamata). • Raid, T., Kaljuste, O., Špilev, H. and Lankov, A., 2011. Räim ja kilu. Rahvusliku
kalanduse andmekogumisprogrammi täitmine. III vahearuanne, edited by T. Saat, pp. 1-65. Tallinn: TÜ Eesti Mereinstituut.
• Ramboll Eesti AS, 2007. Pt 3.3. Traffic Analysis of Shipping Routes. Technical Assistance for dredging and reconstruction of shipping routes in West-Estonian Archipelago.
172 Strategic Environmental Assessment of the National Development Plan “Estonian Marine Policy 2012−2020”
Draft Report, 2015.
• Ramboll Eesti AS, 2008. Tehniline abi laevateede süvendamiseks ja rekonstrueerimiseks Lääne-Eesti saarestikus. Keskkonnamõju hindamise aruanne.
• Ramboll Eesti AS, 2014. Balticconnector projekt KMH programm. • Rattiste K., 2006. Life history of the Common Gull (Larus canus). A long-term
individual-based study. Doktoritöö, Uppsala Ülikool. • Raudsepp, U., Laanemets, J., Maljutenko, I., Hongisto, M., Jalkanen, J-P., 2013. Impact
of ship-borne nitrogen deposition on the Gulf of Finland ecosystem: an evaluation. doi:10.5697/oc.55-4.837.
• Regional action plan on marine litter, 2015. • Riigi jäätmekava 2014–2020, 2014. • Riiklik arengukava „Eesti merenduspoliitika 2012–2020“, 2011. • Rolke, M., Michalek, M., Werner, M., Lehtiniemi, M., Strake, S., Antsulevich, A. &
Zaiko, A., 2013. Trends in arrival of new non-indigenous species. HELCOM Core Indicator Report. Online. [24.09.15], (http://www.helcom.fi/Core%20Indicators/HELCOM-CoreIndicator-Trends_in_arrival_of_new_non-indigenous_species.pdf).
• Rünk, N., 2009. Keskkonnaparameetrite ajalis-ruumiline muutlikkus laia estuaari pinnakihis kevadperioodil (FerryBox andmete põhjal Soome lahes), Tallinna Tehnikaülikool, TTÜ Meresüsteemide Instituut, Okeanograafia õppetool.
• SA SEI Tallinn, 2012. Eesti mereala keskkonnaseisundi esialgse hindamise sotsiaal-majanduslik analüüs.
• SA SEI Tallinn, TÜ Eesti Mereinstituut, TTÜ Meresüsteemide Instituut, 2015. Eesti merestrateegia meetmekava. Eelnõu ettepanek.
• Saare maakonnaplaneeringu tuuleenergeetika teemaplaneering, 2013. • Saat, T., R. Eschbaum, T. Raid, T. Drevs, and M. Kesler., 2011. Kalavarude seisund ja
prognoos. Rahvusliku kalanduse andmekogumisprogrammi täitmine. I vahearuanne. pp. 1-30. Tallinn: TÜ Eesti Mereinstituut.
• Schlitzer, R., Ocean Data View, http://odv.awi.de, 2015. • Seifert, T., Tauber, F., and Kayser, B., 2001. A high resolution spherical grid
topography of the Baltic Sea – 2nd edition, Baltic Sea Science Congress, Stockholm 25–29 November 2001, Poster #147, http:/www.io-warnemuende.de/iowtopo.
• Sirp, S. and K. Klaas., 2011. Annual report on the implementation of Council Regulation (EC)No 812/2004. University of Tartu Estonian Marine Institute; The Ministry of the Environment.
• Skov H., Heinänen S., Žydelis R., Bellebaum J., Bzoma S., Dagys M., Durinck J., Garthe S., Grishanov G., Hario M., Kieckbusch J.J., Kube J., Kuresoo A., Larsson K., Luigujoe L., Meissner W., Nehls H. W., Nilsson L., Petersen I.K., Roos M. M., Pihl S., Sonntag N., Stock A. & Stipniece A., 2011. Waterbird Populations and Pressures in the Baltic Sea. Nordic Council of Ministers, Copenhagen. 203 p.
• Smith, M.E., Kane, A.S. & Popper, A.N., 2004. Noise-induced stress response and hearing loss in goldfish (Carassius auratus). The Journal of Experimental Biology 207, 427-435.
• Snoeijs P., 1999. Marine and brackish waters. Raamatus: Rydin H., Snoeijs P., Diekmann M. (toim.) Swedish Plant Geography, lk. 187–212.
• Sørmo E.G., Jüssi I., Jüssi M., Braathen M., Skaare J.U & Jenssen B. M., 2005. Thyroid hormone status in gray seal (Halichoerus grypus) pups from the baltic sea and the atlantic ocean in relation to organochlorine pollutants. Environmental Toxicology and Chemistry, 24 (3): 610–616.

173 Strategic Environmental Assessment of the National Development Plan “Estonian Marine Policy 2012−2020”
Draft Report, 2015.
• Sørmo E.G., Skaare J.U., Jüssi I., Jüssi M. & Jenssen, B. M., 2003. Polychlorinated biphenyls and organochlorine pesticides in baltic and atlantic gray seal (Halichoerus grypus) pups. Environmental Toxicology and Chemistry. Volume 22, Issue 11, Pages: 2789–2799.
• Statistikaamet. stat.ee, 31.08.2015. • Suursaar, Ü., Kullas, T., 2009. Meretase ja hoovused Eesti rannikumeres muutuva
kliima tingimustes. Rmt Kont, A. (toim.). Kliimamuutuse mõju Eesti rannikule – ASTRA projekti uurimistulemusi. Tallinna Ülikooli Ökoloogia Instituudi Publikatsioonid 11/2009, 25–43.
• Suursaar, Ü., Kullas, T., Otsmann, M., Saaremäe, I., Kuik, J. ja Merilain, M., 2006. Cyclone Gudrun in January 2005 and modelling its hydrodynamic consequences in the Estonian coastal waters. Boreal Environment Research, 11(2), 143 - 159.
• Žydelis, R., Bellebaum, J., Österblom, H., Vetemaa, M., Schirmeister, B., Stipniece, A., Dagys, M., van Eerden, M. & Garthe, S. 2009. Bycatch in gillnet fisheries - An overlooked threat to waterbird populations. Biological Conservation 142: 1269-1281.
• Thomsen, F., Lüdemann, K., Kafemann, R. & Piper, W., 2006. Effects of offshore wind farm noise on marine mammals and fish, biota, Hamburg, Germany on behalf of COWRIE Ltd.
• Tougaard, J., Carstensen, J., Teilmann, J., Skov, H. & Rasmussen, P., 2009. Pile driving zone of responsiveness extends beyond 20 km for harbor porpoises (Phocoena phocoena (L.). J. Acoust. Soc. Am., 126, 11–14.
• Tougaard, J., Henriksen, O.D., Miller, L.A. 2009b. Underwater noise from three types of offshore wind turbines: estimation of impact zones for harbor porpoises and harbor seals. J. Acoust. Soc. Am. 125, 3766–3773. HELCOM 2013.
• Transpordi arengukava 2014–2020, 2014. • TTÜ Eesti Mereakadeemia, 2015. Veeldatud maagaasi laevakütusena kasutuselevõtu
tehnilise ja majandusliku teostatavuse uuring. • Tuomi, L., Kahma, K. K. and Pettersson, H., 2011. Wave hindcast statistics in the
seasonally ice-covered Baltic Sea. Boreal Env. Res. 16: 451-472. • TÜ Eesti Mereinstituudi koduleht http://www.sea.ee/valisosalusega-projektid/nema/
(19.09.15). • TÜ Eesti Mereinstituut ja TTÜ Meresüsteemide Instituut, 2015. Avamere seire 2014. • TÜ Eesti Mereinstituut, 2009. Väikese väina seisundi parandmise võimaluste uuring. • TÜ Eesti Mereinstituut, 2011. Kassari lahe tööndusliku punavetikavaru uuringud.
LEPING nr. 4-1.1/68, Tallinn. • TÜ Eesti Mereinstituut, 2011b. Muuga sadama merekeskkonna seire. Vasutav täitja R.
Aps. • TÜ Eesti Mereinstituut, 2012. Eesti mereala keskkonnaseisundi esialgne hindamine.
Aruanne EL-i merestrateegia raamdirektiivi artikkel 8-st tulenevate riiklike kohustuste täitmiseks.
• TÜ Eesti Mereinstituut, 2012b. Eesti Mereala Hea Keskkonnaseisundi indikaatorid ja keskkonnasihtide kogum. Aruanne MSFD artikkel 9 ja 10 nõuete täitmiseks.
• TÜ Eesti Mereinstituut, 2015. Ohtlikute ainete seire meres. Riikliku keskkonnaseire programmi mereseire allprogramm. 2014. aasta aruanne.
• Uiboupin R. and Laanemets J., 2009. Upwelling characteristics derived from satellite sea surface temperature data in the Gulf of Finland, Baltic Sea. Boreal Env. Res. 14: 297-304.
174 Strategic Environmental Assessment of the National Development Plan “Estonian Marine Policy 2012−2020”
Draft Report, 2015.
• Vabariigi Valitsuse 25. juuli 2000. a määruse nr 247 Tervisekaitsenõuded supelrannale
ja suplusveele (RT I 2000, 64, 407).
• Vabariigi Valitsuse 3. aprilli 2008. a määrus nr 74 Nõuded suplusveele ja supelrannale (RT I, 29.08.2011, 6).
• Vabø, R., Olsen, K. & Huse, I., 2002. The effect of vessel avoidance of wintering Norwegian spring-spawning herring. Fisheries Research 58, 59–77.
• Verevkin, M.V., Vysotsky, V.G., Lisitsyn, A.V., 2011. Catastrophic decreasing of population size of the Baltic ringed seal (Pusa hispida botnica) in the Gulf of Finland (East part of the Baltic Sea) 19th Biennial Conferenceon the Biology of Marine Mammals \ avaldamisel.
• Weston, D. P., 1990. Quantitative examination of macrobenthic community changes along anorganic enrichment gradient. Marine Ecology Progress Series, 61, 233–244.
• Vetemaa, M. & Piirisalu, U., 2011. “Hülgekahjude vähendamine püügivahendite hülgekindlamaks ehitamise ja hülgepeletite kasutusele võtmise abil. PRIA projekti aruanne.” Tartu: TÜ Eesti Mereinstituut.
• Vetemaa, M., Eschbaum, R., Albert, A., Saks, L., Verliin, A., Jürgens, K., Kesler, M., Hubel, K., Hannesson, R., Saat, T., 2010. Changes in fish stocks in an Estonian estuary: overfishing by cormorants? ICES Journal of Marine Science 67(9): 1972-1979.
• WWF Baltic Ecoregion Programme, 2010. Future Trends in the Baltic Sea, 40 pp. • Wysocki, L.E., Dittami, J.P. & Ladich, F., 2006. Ship noise and cortisol secretion in
European freshwater fishes. Biological Conservation 128, 501–508; • Üleriigiline planeering Eesti 2030+, 2012.