strategic cyber effects in complex systems: understanding
TRANSCRIPT

111
Strategic Cyber Effects in Complex Systems:Understanding the US Air Transportation Sector
Abstract: US policy-makers have coalesced around the need to develop a risk-based approach for managing strategic effects of cyber attacks. This paper uses graph networks of US air infrastructures from the Department of Transportation to develop the Strategic Disruption Index (SDI), a means to assess the loss of effective transportation network capacity of passengers resulting from various cyber attack scenarios. Dynamic effects are measured using an agent based model to assess the ensuing propagating air passenger delays. Results from this analysis show strategic effects are influenced by airport and airline network structure and induce dynamic effects across the entire sector. We find that the largest national strategic effects are generated through the disruption of key vendor relationships that can potentially affect multiple private operators simultaneously. Policy-makers who are charged with developing means of measuring national risk can apply this approach to evaluate strategic impacts to any number of domestic or international transportation networks. They can also use the approach to compare impacts between disparate infrastructure networks to prioritize resources that best limit the range of strategic risk.
Keywords: strategic cyber risk, critical infrastructure, complex systems analysis
Charles HarryAssociate Research ProfessorSchool of Public PolicyUniversity of MarylandCollege Park, MD, United [email protected]
Skanda VivekAssistant ProfessorSchool of Science and TechnologyGeorgia Gwinnett CollegeLawrenceville, GA, United [email protected]
2021 13th International Conference on Cyber Conflict Going ViralT. Jančárková, L. Lindström, G. Visky, P. Zotz (Eds.)2021 © NATO CCDCOE Publications, Tallinn
Permission to make digital or hard copies of this publication for internal use within NATO and for personal or educational use when for non-profit or non-commercial purposes is granted providing that copies bear this notice and a full citation on the first page. Any other reproduction or transmission requires prior written permission by NATO CCDCOE.

112
1. INTRODUCTION
Governments have increasingly focused on the range of strategic impacts cyber attacks can generate, including significant disruptions to critical infrastructure. US policy-makers have sought to adopt risk-based approaches to cybersecurity to promote resilience in critical infrastructure but have struggled with ways to quantify risk. The Department of Homeland Security notes, “We lack integrated and scalable adoption and application of systemic risk assessment, resulting in ineffective and uncoordinated application of resources for cybersecurity” [1]. This challenge arises in part from the inability to assess strategic impact across many independent but related organizations that support critical public services [2]. The Cyber and Infrastructure Security Agency (CISA) has defined several National Critical Functions (NCF) – key strategic services where a cyber attack could generate a significant public concern. These include the movement of air passengers. We address two key questions in this paper. First, how do you quantify the strategic effects of a cyber attack on airports, airlines, or key vendors that disrupt portions of the passenger air network? Second, which events generate the greatest concern for national operators and policy-makers? To answer these questions, we explore effective capacity loss in passenger transport networks and the resulting propagation delay for connecting flights in US air infrastructure as a measure of strategic impact. The approach discussed in this paper contributes to the literature on strategic effects of cyber attack to air transport systems specifically and provides a means of calculating strategic impact on critical infrastructure more generally.
Disruptions at Delta in 2016, United Airlines in 2017, and Southwest in 2019 have highlighted the growing impact IT failure can have across air networks [3]. While most disruptive events against air infrastructure are a result of unintended consequences of ill-timed application rollouts, a small number of incidents have resulted from malicious actors who have succeeded in disrupting air operations through attacks on proprietary systems at airlines or by attacking airport infrastructure directly. Attacks on RavnAir in 2019 [4], Polish national carrier LOT in 2015 [5], and Russian attacks on Swedish [6] and Ukrainian airport infrastructure highlight the potential for malicious disruptive activity [7]. In this paper, we assume that cyber attacks disrupt systems that are key to transportation of passengers by aircraft. Examples of these types of attacks include disabling of tower communications systems, air passenger booking software, or aircraft weighing systems. The specific technical details of the cyber attack, such as the deployment of a ransomware variant, a specific exploit used, or different persistence mechanisms, is not dealt with specifically, as policy-makers are more interested in the operational effects than in the technical details of the malware. However, some techniques are more likely to occur than others, and their probability of occurrence can be paired with the results from this analysis to generate a measure of cyber risk.

113
Data from the 2019 US Department of Transportation air carrier statistics are used to construct national graph models of air transportation and regional graphs aligned with the Federal Emergency Management Agency (FEMA)’s response zones. While cyber-induced disruption to US air infrastructure would no doubt create impacts to international flights, we do not explicitly address the effects in this analysis. However, the approach discussed could be applied to international air passenger networks. To assess the loss of effective transport network capacity, we introduce the Strategic Disruption Index (SDI) to measure the weighted capacity loss the disruption would represent on air networks. Finally, we assess the dynamic propagation delay of aircraft and the impacts they would have on connecting flights. Our key findings suggest that the largest strategic effects on the national air network would result from attacks on airline infrastructure and are most concerning when involving the disruption of common-use third-party vendors. Such attacks would substantially reduce air transport capacity at several airports simultaneously, generating substantial delays across the graph structure. This finding suggests that the cyber security of key vendors or operators in air transportation remains a greater strategic vulnerability to local and national air infrastructure. It also suggests, though, that this relationship likely exists in other infrastructures as well.
2. LITERATURE ON CYBER EFFECTS, ATTACKS ON NETWORK STRUCTURE, AND PROPAGATION DELAY
Scholars have attempted to categorize and measure the range of cyber impacts, including estimates of the categories of harm [8, 9] and organizational impact [10], but generally have not linked together the primary (technical), secondary (organization), and second-order (society) effects that bind the actions of a threat actor on a specific device to the cascading impacts on society [11, 12]. Several studies have looked at impacts to critical infrastructures, including the electrical grid [13], water distribution [14], and even transportation [15], yet tend to narrowly focus on defining specific technical vulnerabilities tied to the provision of the service, not on quantifying the capacity loss or delay to provisioning of the service on society. Dieye et al. [16] and Santos et al. [17] come closest in their analysis of macroeconomic linkages but focus their approach on output loss and price changes as a result of the disruption to ports. Their analysis does not measure changes in the capacity of the transport network holistically or assess the delay propagation stemming from attacks on the organizational network infrastructure of the entire sector.
The estimation and description of network structures have been broadly explored in critical transport infrastructures [18]. Exploration of airline routes [19], roads [19, 20], railways [21], and river networks [21, 22] detail the structure of linkage but do
114
not themselves explore disruptive impacts as a result of cyber attacks on the network structure specifically. Amaral et al. [19] explore the structure of large national airport networks, highlighting their scale-free structure, but do not seek to quantify the impact to flight operations from either natural or man-made disruptions. Other efforts to estimate the impact of vertex removal, specifically in internet structures, note the resilience of scale-free network structures to single vertex removal [23, 24]. However, when it comes to the estimation of disruption to transport and critical infrastructure capacities resulting from cyber attack, there appears to be a gap in the literature.
Disruption to air network infrastructure not only impacts the effective capacity of air networks but can propagate delay. Wu et al. [25] found that delays can be propagated due to reasons such as airport congestion, resource limitations, or even through connecting-flight delays. Wu et al. also noted that at least one airline in China had nearly 50% of its sequence flights suffering from such effects. Beatty et al. [26] came up with the concept of a delay multiplier to capture the amplification of an initial delayed flight through the day, estimating that the flight delay cost was more than 30 billion dollars every year. Other studies have found a range of flight delay propagation due to the increasing demand burden on the air transportation systems [27, 28, 29]. Modeling failure or disruption of critical infrastructure due to a natural or malicious act is generally well studied but is limited in both the specific exploration of transport infrastructure and in the use of graph- or agent-based techniques to assess the consequences of capacity loss across sectors. While there exist several studies looking at the disruption to specific critical infrastructure sectors utilizing system dynamics, agent-based, network, input-output, or high-level architecture models, only a single paper was identified that examined the disruption to the transportation sector [30]; and that study sought only to estimate the change in passenger demand in case of a physical attack on the US air infrastructure utilizing an input-output model. In this context our analysis contributes to the literature in two significant ways. First, our use of both a graph and an agent-based model are novel, providing both an approach to estimating capacity loss and propagation impacts in air transport. Second, the introduction of an index to measure effective capacity loss enables policy-makers to compare the impact of a range of cyber events more easily across any air network, and even serves as a means for measuring impacts across sectors.
3. MEASURING EFFECTIVE NETWORK CAPACITY LOSS IN AIR TRANSPORTATION
We measure effective capacity loss in an air network by imagining a set of airports as vertices connected by edges (flights) which ferry passengers between locations and where the loss of any airport or flight creates a loss in transport capacity (Figure 1).

115
Let us assume a weighted graph (G) below with the set of vertices (V={ν1,ν2,…,νn}),edge pairings (E), and where W is a matrix of edge weights (w i,j), where row i represents the individual vertices in G columns j equal the edge pairings between a specific vertex in row i and all other vertices in the graph, and whose value is equal to the number of passengers. For example, in Figure 1, w 1,2 and w 2,1 are equal to 5 while w 1,3 and w 3,1 are 0 as there is no connection between ν1 and v3. Cyber events can have different impacts on services that support flight operations at an airport (Tνi). These effects can range from slight delays to those that completely incapacitate operations (i.e.0 ≤ Tνi ≤ 1). Examples might include a ransomware attack that disables tower communication systems (Tνi = 1), a spear-phishing event that only compromises data, (Tνi = 0), or a sustained DDoS event that degrades operations (Tνi = 0.3).
To estimate an effective capacity loss of one or more airport vertices in the graph, we sum across all vertices in the graph, the operational effect of the attack per vertex (Tνi), and multiply it by the sum of both the impact of the positional importance in the graph, measured by the eigenvector centrality of the vertex impacted by the cyber attack (Cνi
e ) over the sum of all the vertices’ eigenvector centralities, and the volume of passengers traversing the affected vertex to other vertices divided by the sum of all passengers through the air network. Tuning parameters for both the positional importance (α) of the vertex as well as the volume of passengers the vertex supports (β) are included.
Therefore, for any graph G we can measure the Strategic Disruption Index (SDI) between 0 and 1:
FIGURE 1: A REPRESENTATIVE GRAPH (G) OF VERTICES AND EDGES
Where: α + β = 10 ≤ Tνi ≤ 1

116
For example, if we wanted to calculate the SDI for a ransomware attack on vertex ν3 tower communications (Tν3 = 1), we would take into account ν3’s calculated eigenvector centrality (1) divided by the sum of all centralities in the graph (4.28) and the sum of edge weights connected to it (40) over the sum all edge weights (61). Assuming α and β are both equal to 0.5 (e.g., both factors are of equal importance), we can calculate an SDI of 0.45, indicating that the attack generated an effective capacity loss in this graph of 0.45 or 45% of its weighted capacity. Conversely, the same attack on ν1 would only generate an SDI of 0.08, or 8% of the effective weighted capacity of the entire air network. In this manner, we can use the SDI to differentiate the capacity loss across a range of airports, airlines, or supporting vendors for any number of cyber scenarios.
4. CONSTRUCTING AIR NETWORKS
We utilize year 2019 US Department of Transportation air carrier statistics to build graphs of airports and flight connections. Figure 2 highlights a national graph, with the top 10 airport codes identified by passenger volume and eigenvector centrality. We identified 374 airports with 5,481 connections that moved at least 1,000 passengers a month (Table I). The national air infrastructure can be described as a scale-free network with a few highly interconnected airports that stitch smaller regional locations together into a single air infrastructure. This follows a similar pattern found by Amaral et al. [19], with the degree distribution following a power law distribution.
FIGURE 2: GRAPH OF NATIONAL AIR TRANSPORT NETWORK

117
To assess the regional effects of disruption to air infrastructure, we divide the national air infrastructure into the 10 different Federal Emergency Management Agency (FEMA) regions (Figure 3). These regional graphs consist only of flights beginning and ending in the same region. Intra-regional networks vary not only in the number of vertices and passenger volume but also in structure. For example, FEMA Region 1 has relatively few airports (6) with an average degree centrality of 1.33, implying that most airports have few interconnections and that their structure is likely considerably different from other regions such as 4 and 9 that maintain both more vertices (61, 42) and greater average degree centrality (6.67, 6.79).
FIGURE 3: FEMA REGIONS
Figure 4 highlights two of the graph structures, demonstrating that there is a larger set of interconnections in Region 9 than in Region 1. We find that this diversity of network structure generates substantial differences in both the regional capacity loss and delay propagation effects from the disruption to either airport operations or airline infrastructure.
FIGURE 4: INTRA-REGIONAL AIR NETWORKS
FEMA Region 1(With at Least 1,000 Passengers Between Airports)
FEMA Region 9(With at Least 1,000 Passengers Between Airports)

118
The differences in regional structures found in Table I, including in average degree, numbers of vertices, and edge connections, reflect the differences in geography and physical distance found in different parts of the country and which we find to drive differences in effective capacity loss and flight delay propagation.
TABLE I: AIR NETWORK DESCRIPTIVE STATISTICS
5. ESTIMATING LOSS OF EFFECTIVE NETWORK CAPACITY IN US AIR INFRASTRUCTURE
Disruption to airport flight operations, including jetway functions, air traffic management systems, or even booking management systems, can have strategic impacts on the entire sector [32]. Using the SDI approach, our analysis shows that only a few well-connected airports (Table II) with large traffic volume generate the heaviest impacts; many small and regional airports have little overall impact on the national air network. These results broadly correlate with the scale-free structure of the national air network and confirm the experience of any air traveler who has been delayed when a weather event shuts down a major airport. For example, a cyber event that shuts down Hartsfield-Jackson Atlanta International Airport (ATL) generates an SDI of 0.04, or roughly 4% of the effective capacity of the national air transport system. Disruption at other major hubs, such as ORD, DEN, or DFW, induces similar
Nodes Edges Diameter Modularity Avg. Degree
FEMA 1 6 8 3 0.32 1.33
FEMA 2 16 44 4 0.32 2.75
FEMA 3 17 54 3 0.21 3.18
FEMA 4 61 407 5 0.22 6.67
FEMA 5 45 181 3 0.18 4.02
FEMA 6 11 192 3 0.24 4.36
FEMA 7 5 8 2 0 1.60
FEMA 8 37 97 3 0.20 2.62
FEMA 9 42 285 3 0.18 6.79
FEMA 10 36 100 5 0.34 2.78
National 374 5481 7 0.25 14.66

119
impacts to effective network capacity loss, whereas the loss of air operations at smaller airports such as in Boise, Idaho, represents less than 0.1% loss in effective national network capacity.
TABLE II: NATIONAL SDI BY AIRPORT
Regional effects are also calculated utilizing each region’s specific graph structure to estimate an SDI value. We find that while national SDI values remain largely consistent (at between 0.02 and 0.04) among the largest airports, disruption to the most important airports in each region can vary substantially (Table III). For example, in Region 9, which includes much of California, Arizona, and Nevada, the loss of LAX would constitute a 10% loss of the effective air capacity in the region. By contrast, the loss of St. Louis Lambert International Airport would be 42% of the regional network capacity. Similarly, an attack on Boston’s Logan International would represent a loss of 30% of the regional network capacity.
Airport Strategic Disruption Index (SDI)
Hartsfield-Jackson Atlanta International (ATL) 0.04
O’Hare International (ORD) 0.03
Denver International (DEN) 0.03
Dallas/Ft. Worth International (DFW) 0.03
Los Angeles International (LAX) 0.03
Las Vegas McCarran International (LAS) 0.02
Charlotte Douglas International (CLT) 0.02
Seattle-Tacoma International (SEA) 0.02
Phoenix Sky Harbor International (PHX) 0.02
Orlando International (MCO) 0.02

120
TABLE III: REGIONAL AND NATIONAL SDI BY MOST AFFECTED AIRPORT IN FEMA REGION
The range of values indicates that different network structures lead to substantial differences in impact. In some cases, where airports remain at the center of a regional hub-and-spoke network structure (e.g., Regions 1 and 3), the disruption of airport operations at a single location can generate impacts far exceeding that airport’s influence in the national air infrastructure. This is primarily due to the small number of airports that are servicing regional flights and are highly reliant on a major airport (e.g., Boston’s Logan International Airport). As seen in Figure 2, the network structure of Region 1 is tightly connected through a single vertex (BOS), yet Region 9 has more highly connected vertices limiting regional effective capacity loss from a single airport disruption.
How would attacks on airline infrastructure, including their vendor systems, compare with attacks on airports? Disruptions to some specific airline systems (e.g., disabling the ability to file a flight plan) can lead to the grounding of the entire air fleet across all airports they serve. In some cases, airlines provide much of the capacity at many airports, and thus attacks on them would disrupt large percentages of air capacity simultaneously across regions. Recent events at Delta in 2016, United Airlines in 2017, and Southwest in 2019 are representative. We find that attacks on an airline’s air network generate significantly larger national effects (Table IV) than do attacks on a specific airport.
FEMA Region Top Disrupted Airport Regional SDI National SDI
1 Boston Logan International (BOS) 0.30 0.02
2 New York International (JFK) 0.20 0.01
3 Philadelphia International (PHL) 0.20 0.02
4 Hartsfield-Jackson International (ATL) 0.17 0.04
5 O’Hare International (ORD) 0.17 0.03
6 Dallas/Ft. Worth International (DFW) 0.16 0.03
7 St. Louis Lambert International (STL) 0.42 0.01
8 Denver International (DEN) 0.26 0.03
9 Los Angeles International (LAX) 0.10 0.03
10 Seattle-Tacoma International (SEA) 0.23 0.03

121
TABLE IV: NATIONAL SDI BY AIRLINE
The loss of capacity across potentially hundreds of air corridors simultaneously generates SDI values that are more than twice the impact of the largest and most central airports (such as ATL). This supports a general observation from scholars who point out that scale-free network structures are resilient after losing a single vertex but remain largely vulnerable to attacks on many highly connected nodes simultaneously [23]. For example, an attack against Southwest Airlines generates a 10% loss of effective network capacity across the United States, more than twice what was achieved in disrupting Atlanta’s Hartsfield-Jackson International.
As airlines frequently manage operations using integrated services from third-party vendors, the loss of a single vendor’s service can exacerbate the problem. Airlines that utilize the same vendor to provide critical services as part of their broad operations open the potential for a single third party to cause disruption to ground flights across multiple airlines simultaneously. For example, AeroData, a privately owned company providing flight inspection systems, suffered a system disruption in 2019 that forced major carriers United, Delta, Southwest, JetBlue, and Alaskan Airlines to cancel more than 7,000 flights throughout the day [31, 32]. The outage, while only lasting 40 minutes, would score a collective SDI value of 0.36, representing a capacity loss nine times greater than the loss of ATL operations. With national carriers responsible for the largest percentage of flights between major airports, the disruption of common vendor systems essential to flight operations presents the largest strategic impact to the effective network capacity of US air infrastructure. This type of attack highlights the challenge to scale-free network structures that, while resilient to the removal of
Airline Market Value Vertices Edges Strategic Disruption Index (SDI)
Southwest $126.45B 127 2505 0.10
Delta $130.25B 215 3072 0.08
American Airlines $131.59B 158 1953 0.08
United $111.28B 181 2021 0.06
SkyWest $21.39B 280 4084 0.02
Jet Blue $41.44B 94 810 0.02
Alaska Airlines $47.48B 114 771 0.02
Frontier $22.57B 105 768 0.01
Hawaiian $12.28B 30 104 0.01

122
a single vertex, generate substantial impacts when several highly connected nodes are disrupted simultaneously. The use of a handful of key service vendors raises the possibility of single points of failure with the potential for widespread national air disruption extending far beyond the loss of flight operations at a single airport or airline.
6. MODELING PROPAGATION DELAYS
Disruption to air capacity also has the potential to propagate impacts through the entire air network. To measure this dynamic effect, we use an agent model leveraging flight-time information obtained from the Airline On-Time Performance Database, distributed by the Bureau of Transportation Statistics. Simulations are done in Python, with delays propagated to downstream flights using random sampling through Monte Carlo methods. While the SDI quantifies the weighted loss of an initial disruption on passenger air network capacity, our delay propagation captures the ensuing propagation of delays on the impending air flight network.
We define the propagation parameter, ɑ, as the fraction of flights impacted by an initial delayed flight of the same airline, within a fixed-time interval (tdur) from the scheduled time of arrival at the arrival airport. The agent-based algorithm is as follows:
1) x0 flights are initially delayed from a cyber attack;2) Each of the x0 delayed flights impacts a fraction ɑ of flights from the
same airline within a certain time tdur at the airport from which the flight is scheduled for departure;
3) Each of the subsequently delayed flights also causes delays at the corresponding airport at which they are scheduled to land, further propagating delays according to Rule 2, resulting in a cascade of delays through the day.
Previous work [29] found that ɑ of between 0.02 (or 2% of downstream flights impacted by an initial delayed flight) and 0.25 (25% of downstream flights impacted by an initial delayed flight) reproduced clusters of propagating delayed flights in regular operating conditions. The higher ɑ values reflected times in which there were more passengers leading to fewer buffers in the airline networks, such as during the holiday season. In our analysis we vary ɑ as 0.02 or 0.25 and choose a fixed tdur = 1 hour. For example, ɑ = 0.25 would mean that a delayed Delta flight that was supposed to land at 13:00 in Atlanta would impact 25% of subsequent Delta flights that are supposed to depart between 13:00 and 14:00. That delay would continue propagating across the Delta air network until the end of the day.

123
Figure 5 shows the cascading disruption in a scenario when an airport is shut down for an hour from 8:00–9:00 EST. Diagrams (a), (b), and (c) correspond to a disruption of the Atlanta Hartsfield-Jackson International Airport, at 9:00, 13:00, and 17:00 EST, respectively. Diagrams (d), (e), and (f) correspond to disruption of the Los Angeles International Airport during the same times as Diagrams (a), (b), and (c). The colors are a heatmap indicating the number of flights disrupted over the course of the day. Regions with greater disruption have more intense red colors, whereas regions of less disruption are colored blue. An attack on ATL airport propagates from East to West, whereas an attack that originates in LAX propagates from West to East.
FIGURE 5: AIRPORT CYBER ATTACK CASCADING DELAY SCENARIO ANALYSIS. DURATION OF THE ATTACK: 8:00–9:00 EST ON DECEMBER 1, 2019. TOP: ATL AIRPORT. BOTTOM: LAX AIRPORT.
Figure 6 denotes the total fraction of delayed flights by the end of the day. Symbols denote attacks at 8:00–9:00 that impact the 10 most important airports in their respective FEMA region. Red lines are error bars from multiple simulations with the same ɑ. The dashed black line is slope = 1, or national disruption = regional disruption. The low delay multiplier (ɑ = 0.02) shows lower delay effects as compared to the larger delay multiplier (ɑ = 0.25). Thus the propagation multiplier (ɑ) acts as a “tuning” parameter to probe varying levels of cascade impacts.

124
FIGURE 6: EFFECTS OF DELAY MULTIPLIER ON FLIGHT DISRUPTION CASCADE. (a) ɑ = 0.02. (b) ɑ = 0.25.
A smaller delay propagation parameter (ɑ = 0.02) is associated with limited initial disruption between 8:00–9:00 EST, with hardly any cascade. Most airport disruptions are above the dashed line, showing that they cause larger regional disruptions than national ones. STL, BOS, and LGA are under the dashed line. STL and BOS cause little to no regional disruption due to the lack of intra-regional flights by major airlines in FEMA Regions 1 (no regional flights on December 1) or 7 (13 regional flights on December 1), whose flights are well distributed through the day. By contrast, FEMA Region 3’s reliance on larger carriers is significantly impacted by the disruption of PHL, creating the largest regional delay disruption. This is likely due to the large presence of American Airlines in FEMA Region 3. It should be noted that the Airline On-Time Performance Database does not contain information on small regional carriers, which might lead to the underestimation of delay propagations in regions that are have a larger dependence on small regional carriers, such as FEMA Region 1. National delay impacts largely align with the large hubs, with ATL, ORD, and DFW accounting for the largest national disruptions.
Larger delay parameters (ɑ = 0.25) are associated with larger downstream propagation. PHL, ATL, and ORD generated the largest regional disruptions; ORD, DFW, and LGA generated the largest national disruptions; and West Coast airports DEN, LAX, and SEA saw smaller disruptions, likely due to the early hour of the event (e.g., 6:00 MST/5:00 PST). Changes in the timing of an attack appear to also induce differences in national and regional delay propagation. In Figure 7b, we see an overall shift of disruption to lower national impacts when the cyber attack is later in the day, as the originating delay has less time to propagate to other connections during the day. However, cyber attacks on West Coast airports, including DEN, LAX, and SEA, respectively, lead to larger disruptions when the attack originates later in the day. Cascading delay disruptions are found to be sensitive to both geographical and temporal variations.
(a) (b)

125
FIGURE 7: TIME OF DAY IMPACT ON CASCADE. (A) DELAY CASCADE IN A SCENARIO WHERE THE RESPECTIVE AIRPORTS ARE DISRUPTED FROM 12:00–13:00 EST. (B) RELATIVE DISRUPTION IN A 12:00–13:00 SHUTDOWN VS. 8:00–9:00 SHUTDOWN.
Attacks on airline infrastructure also cause delays, as aircraft are unable to make connections when proprietary systems do not allow for normal flight operations. We study a scenario in which flights are disrupted on December 1, 2019, corresponding to the five largest carriers by flight volume: American (AA), Delta (DL), United (UA), Southwest (WN), and Alaskan (AS) Airlines, respectively. We find that the five largest airline network structures vary in the level of both national disruption and regional impacts corresponding to the locations of its hub operations. Figure 8 highlights both the national and regional propagation delays across the five largest carriers. In the most extreme case, an attack that disables operations at Alaskan Airlines impacts almost exclusively a single region (Region 10). Figure 9 highlights the range of national and regional effects to compare the impacts of airline shutdowns, plotting the fraction of flights. Here the numbers for the air carriers correspond to the FEMA region that is most impacted (in terms of the fraction of delayed flights). For example, during a DL shutdown from 12:00–13:00, 15% of flights are delayed across the country through the day, and in FEMA Region 4, 30% of flights are delayed. In general, we find that, similarly to the analysis of effective capacity loss, delay disruptions from attacks on airline carriers are larger than those from attacks on airports.
(a) (b)

126
FIGURE 8: IMPACTS OF AIRLINE SHUTDOWNS FROM 12:00–13:00 ON DECEMBER 1, 2019. LEFT: PERCENTAGE OF TOTAL FLIGHTS DELAYED CASCADING THROUGH THE DAY NATIONALLY AND BY FEMA REGION (AS INDICATED IN THE LEGEND). RIGHT: SNAPSHOTS OF DELAY AT THE END OF THE DAY.

127
FIGURE 9: FRACTION OF FLIGHTS IMPACTED NATIONALLY AND BY MAXIMALLY IMPACTED REGION, CORRESPONDING
Additionally, the four regions that endure the largest disruptions from airline attacks are the same four regions that have the biggest disruptions as a result of airport attack (Regions 3, 4, 8, and 10). FEMA regions are particularly susceptible to strategic effects due to the combination of regional reliance on the dominant airport and the same airport being the hub of a large national carrier. Regions where carrier hub airports are located are more vulnerable to cascading delays that originate either from carrier or airport shutdown, due to the interdependencies between airport and carrier network structures. By contrast, national impacts are not dependent on the structure of airline networks, due to the national redundancy of airline hubs in multiple airports across regions. While we assumed a uniform delay propagation factor (ɑ = 0.25) across airline networks, studies have indicated that certain point-to-point carriers have lower risks for cascading delays [33, 34].
7. CONCLUSION
The growing threat of attacks against critical infrastructure is an enduring concern among national policy-makers. Key to managing the risk of these threats is the ability to effectively measure the strategic effect a cyber attack has on the series of interconnected organizations. Organizational dependencies, including third-party vendors, can create disparate and complex impacts to capacity and delay propagation. These complex sets of interdependencies challenge the ability of policy-makers to effectively prioritize defensive resources.
National disruptive effects propagated primarily through airlines highlight the potential for substantial impacts through the degradation of third-party vendors who provide service across multiple airlines. The combination of capacity loss and propagation
128
delay across major hubs simultaneously serves as an effective attack on the scale-free structure of the national air infrastructure. While operators utilize these vendors to take advantage of efficiencies, they add critical vulnerabilities to the whole of the transport sector. Attacks on a single operational system (e.g., passenger booking) have the potential to disrupt air infrastructure more than attacks on entire airports. Threats to vendors who provide for terminal management, passenger facilitation, airside operations, and information management all represent avenues of strategic disruption not presently accounted for in the effects literature. Decisions regarding design, development, and deployment of key flight operational systems, all made by private actors, can generate substantial public risk.
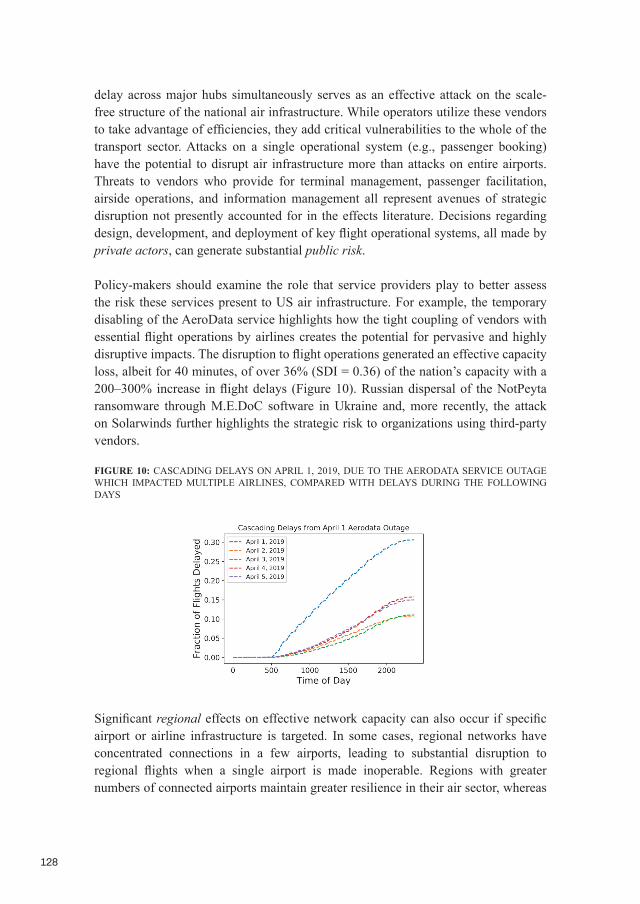
Policy-makers should examine the role that service providers play to better assess the risk these services present to US air infrastructure. For example, the temporary disabling of the AeroData service highlights how the tight coupling of vendors with essential flight operations by airlines creates the potential for pervasive and highly disruptive impacts. The disruption to flight operations generated an effective capacity loss, albeit for 40 minutes, of over 36% (SDI = 0.36) of the nation’s capacity with a 200–300% increase in flight delays (Figure 10). Russian dispersal of the NotPeyta ransomware through M.E.DoC software in Ukraine and, more recently, the attack on Solarwinds further highlights the strategic risk to organizations using third-party vendors.
FIGURE 10: CASCADING DELAYS ON APRIL 1, 2019, DUE TO THE AERODATA SERVICE OUTAGE WHICH IMPACTED MULTIPLE AIRLINES, COMPARED WITH DELAYS DURING THE FOLLOWING DAYS
Significant regional effects on effective network capacity can also occur if specific airport or airline infrastructure is targeted. In some cases, regional networks have concentrated connections in a few airports, leading to substantial disruption to regional flights when a single airport is made inoperable. Regions with greater numbers of connected airports maintain greater resilience in their air sector, whereas
129
regions with a dominant metropolitan area (e.g., Boston) will be more susceptible to regional disruption from the loss of a single airport or large airline servicing intraregional flights. Furthermore, disruption to low-resilience airport infrastructure or to airline capacity heavily concentrated in those locations can lead to substantial regional delay propagation in addition to the significant loss of effective capacity. Estimations of risk at the state and local level might vary, given this difference from the national results; these variations highlight the general degree of nuance one needs to employ when estimating the collective impact to effective network capacity. While several qualitative [35, 36] and quantitative studies [37] explore interconnected vulnerabilities in critical infrastructure, the complexity of interdependence creates substantial challenges to measuring strategic impacts [38]. The approach explored in this paper expands on prior efforts to create a more extensible method for comparing strategic effects between sectors.
Our framework complements existing approaches through the combination of network analysis and computing network flows. The advantages of this approach are the relative ease and adaptability to various other infrastructures, such as other transportation networks, power supply networks, and water networks. For example, the 2003 Northeastern blackout features a short-time cascade, which can be modeled using a similar approach.
A risk-based approach to cyber security defense is at the heart of the US public efforts to promote resilience in critical infrastructure. While both the US 2018 National Cybersecurity and relevant executive action define and promote defense of the nation’s 16 critical infrastructures as an essential element of the defensive strategy, the ability to quantify the range of strategic effect remains an ongoing challenge in the field. Policy-makers who are charged with developing means of measuring national risk can apply the approach in this paper to assess the interdependence of organizations and prioritize resources to best limit the range of strategic risk to any number of critical infrastructures.
REFERENCES
[1] E. Kenneally, L. Randazzese, and D. Balenson, “Cyber risk economics capability gaps research strategy,” in 2018 Int. Conf. Cyber Situational Awareness, Data Analytics And Assessment (Cyber SA), 2018, pp. 1–6.
[2] C. Harry, “The challenge of assessing strategic cyber security risk in organizations and critical infrastructure,” Cyber Security: A Peer-Reviewed J. vol. 4, pp. 58–69, 2020.
[3] Government Accountability Office, “Commercial Aviation: Information on Airline IT Outages,” GAO-19-514, 2019.
[4] S. Ikeda. “Impact of cyber attacks on RavnAir more damaging than first thought; flights may be grounded for a month.” https://www.cpomagazine.com/cyber-security/impact-of-cyber-attacks-on-ravnair-more-damaging-than-first-thought-flights-may-be-grounded-for-a-month/ (accessed Dec. 21, 2020).

130
[5] Reuters. “Hackers ground 1,400 passengers at Warsaw in attack on airline’s computers.” http://www.theguardian.com/business/2015/jun/21/hackers-1400-passengers-warsaw-lot (accessed Dec. 21, 2020).
[6] C. Cimpanu. “Swedish air space shut down by cyber-attacks, officials blame Russia.” news.softpedia.com/news/swedish-air-space-shut-down-by-cyber-attacks-officials-blame-russia-502919.shtml (accessed Dec. 21, 2020).
[7] P. Polityuk and J. Stubbs. “New wave of cyber attacks hits Russia, other nations.” Reuters. https://www.reuters.com/article/us-ukraine-cyber/new-wave-of-cyber-attacks-hits-russia-other-nations-idUSKBN1CT21F (accessed Dec. 21, 2020).
[8] C. Simmons, C. Ellis, S. Shiva, D. Dasgupta, and Q. Wu, “AVOIDIT: A cyber attack taxonomy,” 9th Annu. Symp. Inf. Assurance, pp. 2–12, 2014.
[9] I. Agrafiotis, J. R. C. Nurse, M. Goldsmith, S. Creese, and D. Upton, “A taxonomy of cyber-harms: Defining the impacts of cyber-attacks and understanding how they propagate,” J. Cybersecurity, vol. 4, pp. 1–15, 2018.
10] A. Cresswell and S. Hassan, “Organizational impacts of cyber security provisions: A sociotechnical framework,” in 2007 40th Annu. Hawaii Int. Conf. Syst. Sci. (HICSS’07), pp. 98-125 2007.
[11] C. Harry and N. Gallagher, “Classifying cyber events,” J. Inf. Warfare, vol. 17, pp. 17–31, 2018.[12] S. Vivek, D. Yanni, P. J. Yunker, and J. L. Silverberg, “Cyberphysical risks of hacked internet-connected
vehicles,” Physical Rev. E, vol. 100, p. 012316, 2019. [13] D. Kundur, X. Feng, S. Liu, T. Zourntos, and K. L. Butler-Purry, “Towards a framework for cyber attack
impact analysis of the electric smart grid,” in 2010 First IEEE Int. Conf. Smart Grid Commun., 2010, pp. 244–249.
[14] R. Taormina, S. Galelli, H. C. Douglas, N. O. Tippenhauer, E. Salomons, and A. Ostfeld, “A toolbox for assessing the impacts of cyber-physical attacks on water distribution systems,” Environmental Modelling & Software, vol. 112, pp. 46–51, 2019.
[15] J. Petit and S. E. Shladover, “Potential cyberattacks on automated vehicles,” IEEE Trans. Intell. Transp. Syst., vol. 16, pp. 546–556, 2014.
[16] R. Dieye, A. Bounfour, A. Ozaygen, and N. Kammoun, “Estimates of the macroeconomic costs of cyber-attacks,” Risk Manage. and Insurance Rev., vol. 23, pp. 183–208, 2020.
[17] J. R. Santos, Y. Y. Haimes, and C. Lian, “A framework for linking cybersecurity metrics to the modeling of macroeconomic interdependencies,” Risk Anal., vol. 27, pp. 1283–1297, 2007.
[18] D. J. Watts and S. H. Strogatz, “Collective dynamics of small-world networks,” Nature, vol. 393, pp. 440–442, 1998.
[19] L. A. N. Amaral, A. Scala, M. Barthelemy, and H. E. Stanley, “Classes of small-world networks,” Proc. Nat. Acad. Sci., vol. 97, pp. 11149–11152, 2000.
[20] V. Kalapala, V. Sanwalani, A. Clauset, and C. Moore, “Scale invariance in road networks,” Physical Rev. E, vol. 73, no. 2, p. 026130, 2006.
[21] P. Sen, S. Dasgupta, A. Chatterjee, P. A. Sreeram, G. Mukherjee, and S. S. Manna, “Small-world properties of the Indian railway network,” Physical Rev. E, vol. 67, pp. 036106, 2003.
[22] P. S. Dodds and D. H. Rothman, “Geometry of river networks. III. Characterization of component connectivity,” Physical Rev. E, vol. 63, p. 016117, 2000.
[23] R. Albert, H. Jeong, and A. L. Barabasi, “Error and attack tolerance of complex networks,” Nature, vol. 406, pp. 378–382, 2000.
[24] A. Bonato, “A course on the web graph,” American Mathematical Soc., vol. 89, 2008. [25] W. Wu, H. Zhang, T. Feng, and F. Witlox, “A network modelling approach to flight delay propagation:
Some empirical evidence from China,” Sustainability, vol. 11, p. 4408, 2019. [26] R. Beatty, R. Hsu, L. Berry, and J. Rome, “Preliminary evaluation of flight delay propagation through an
airline schedule,” Air Traffic Control Quart., vol. 7, pp. 259–270, 1999. [27] N. Kafle and B. Zou, “Modeling flight delay propagation: A new analytical-econometric approach,”
Transp. Res. Part B: Methodological, vol. 93, pp. 520–542, 2016. [28] N. Pyrgiotis, K. M. Malone, and A. Odoni, “Modelling delay propagation within an airport network,”
Transp. Res. Part C: Emerging Technologies, vol. 27, pp. 60–75, 2013. [29] P. Fleurquin, J. J. Ramasco, and V. M. Eguiluz, “Systemic delay propagation in the US airport network,”
Sci. Reps., vol. 3, p. 1159, 2013.[30] M. Iturriza, L. Labaka, J. M. Sarriegi, and J. Hernantes, “Modelling methodologies for analysing critical
infrastructures,” J. Simulation vol. 12, no. 2, pp. 128–143, 2018.[31] Deutsche Welle. “AeroData software outage delays hundreds of US regional flights.” https://www.dw.com/
en/aerodata-software-outage-delays-hundreds-of-us-regional-flights/a-48152813 (accessed Dec. 21, 2020).[32] D. Spaniel and P. Eftekhari, “Hacking our nation’s airports: Cyber-kinetic threats to the technologies
running airport operations,” Inst. Crit. Infrastructure Technol., 2019.

131
[33] Z. Zgodavova, R. Rozenberg, and S. Szabo, “Analysis of point-to-point versus hub-and-spoke airline networks,” in 2018 XIII Int. Sci. Conf. – New Trends in Aviation Development (NTAD), 2018, pp. 158–163.
[34] G. Cook and J. Goodwin, “Airline networks: A comparison of hub-and-spoke and point-to-point systems,” J. Aviation/Aerospace Educ. & Res., vol. 17, pp. 2, 2008.
[35] N.J. Carhart and G. Rosenberg, “A framework for characterising infrastructure interdependencies,” Int. J. Complexity in Appl. Sci. and Technol., vol. 1, pp. 35–60, 2016.
[36] A. Laugé, J. Hernantes, and J. M. Sarriegi, “Critical infrastructure dependencies: A holistic, dynamic and quantitative approach,” Int. J. Critical Infrastructure Protection, vol. 8, pp. 16–23, 2015.
[37] M. Iturriza, L. Labaka, J. M. Sarriegi, and J. Hernantes, “Modelling methodologies for analysing critical infrastructures,” J. Simulation, vol. 12, 128–143, 2018.
[38] C. Nan, I. Eusgeld, and W. Kroger, “Analyzing vulnerabilities between SCADA system and SUC due to interdependencies,” Rel. Eng. and Syst. Safety, vol. 113, 76–93, 2013.