strain gage load calibration of the wing interface ... safety-of-flight parameters for the adaptive...
TRANSCRIPT

American Institute of Aeronautics and Astronautics1
Strain Gage Load Calibration of the Wing Interface Fittings for the Adaptive Compliant Trailing Edge Flap Flight Test
Eric J. Miller,1 Andrew C. Holguin,2 Josue Cruz,3 and William A. Lokos4
NASA Dryden Flight Research Center, Edwards, California, 93523
The safety-of-flight parameters for the Adaptive Compliant Trailing Edge (ACTE) flap experiment require that flap-to-wing interface loads be sensed and monitored in real time to ensure that the structural load limits of the wing are not exceeded. This paper discusses the strain gage load calibration testing and load equation derivation methodology for the ACTE interface fittings. Both the left and right wing flap interfaces were monitored; each contained four uniquely designed and instrumented flap interface fittings. The interface hardware design and instrumentation layout are discussed. Twenty-one applied test load cases were developed using the predicted in-flight loads. Pre-test predictions of strain gage responses were produced using finite element method models of the interface fittings.Predicted and measured test strains are presented. A load testing rig and three hydraulic jacks were used to apply combinations of shear, bending, and axial loads to the interface fittings. Hardware deflections under load were measured using photogrammetry and transducers. Due to deflections in the interface fitting hardware and test rig, finite element model techniques were used to calculate the reaction loads throughout the applied load range, taking into account the elastically-deformed geometry. The primary load equations were selected based on multiple calibration metrics. An independent set of validation cases was used to validate each derived equation. The 2-sigma residual errors for the shear loads were less than eight percent of the full-scale calibration load; the 2-sigma residual errors for the bending moment loads were less than three percent of the full-scale calibration load. The derived load equations for shear, bending, and axial loads are presented, with the calculated errors for both the calibration cases and the independent validation load cases.
NomenclatureACTE = Adaptive Compliant Trailing Edge a = calibration coefficient determined by multiple linear regressionb = calibration coefficient determined by multiple linear regressionc = calibration coefficient determined by multiple linear regressioncal = calibrationDFRC = Dryden Flight Research Center�� = excitation voltage, V�� = output voltage, VF = component loadsFEM = finite element methodFLL = Flight Loads LaboratoryGF = gage factorGIII = Gulfstream IIILC = load cellLRT = linear resistance transducerLVDT = linear voltage displacement transducerN = bridge factor
1 Research Engineer, Aerostructures Branch, P. O. Box 273, Edwards, California, AIAA member.2 Research Engineer, Aerostructures Branch, P. O. Box 273, Edwards, California, AIAA nonmember.3 Research Engineer, Aerostructures Branch, P. O. Box 273, Edwards, California, AIAA nonmember.4 Research Engineer, Aerostructures Branch, P. O. Box 273, Edwards, California, AIAA nonmember.
https://ntrs.nasa.gov/search.jsp?R=20140003965 2018-07-03T10:37:32+00:00Z

American Institute of Aeronautics and Astronautics2
NASA = National Aeronautics and Space Administration R = gage responsesRBS = rear beam stationRMM = regression math modelRMS = root mean squarerAF = axial force response, mV/VrBND = bending moment bridge response, mV/V rNF = shear bridge response, mV/VrPM = pitching moment response, mV/VSCRAT = SubsoniC Research Aircraft TestbedVIF = variance inflation factor�� = measured value��� = derived value� = load residual = strain output, in/in
I. Introductionlight-testing new and innovative structures in a flight-relevant environment promotes the transition of structural technologies from research to mainstream production. Wind-tunnel and ground-based load testing of structural
flight technologies have inherent limitations that can be overcome through flight-testing. The National Aeronautics and Space Administration (NASA) Dryden Flight Research Center (DFRC) has procured, modified, and instrumented a Gulfstream GIII airplane (Gulfstream Aerospace Corporation, Savannah, Georgia), tail number N804NA, to increase the Technology Readiness Level (TRL) of promising new flight technologies. The airplane,named the SubsoniC Research Aircraft Testbed, is commonly known as the “SCRAT.”1
The NASA DFRC is partnering with the Air Force Research Laboratory (AFRL) and FlexSys Inc. (Ann Arbor, Michigan) to flight-test the Adaptive Compliant Trailing Edge (ACTE) experiment to demonstrate an adaptive compliant structural control surface in flight on the SCRAT. Wind-tunnel testing and small-scale flight tests of the compliant technology have been conducted, but a full-scale compliant structure requires flight-testing to build confidence in the adaptive compliant structure.2 Contemporary aviation structures employ a system of mechanisms to mechanically actuate control surfaces. FlexSys technology takes advantage of material elasticity to produce large structural deformations while maintaining the structural strength required to carry the air loads. These seamless compliant structures have the potential to reduce drag, increase maneuverability, and reduce noise. As well, the technology has been shown to provide increased performance in the form of reduced fuel usage.
Two ACTE flaps will be fabricated and assembled to replace both existing Fowler flaps on the SCRAT. Figure 1shows a conceptual sketch of the SCRAT with installed ACTE flaps. The objective is structural flight demonstrationof the ACTE technology. The ACTE flaps are each planned to be fixed at a predetermined deflection angle for each flight and to remain fixed in that position for the duration of the flight. The design flight deflection range of the ACTE is -2 deg up and +30 deg down.
The ACTE project plans to fly beyond the cleared Fowler flap flight envelope. External load predictions indicate possible strength exceedances of the wing box during high-dynamic-pressure maneuvers. The ACTE flap and attachment hardware may also approach or exceed the structural limits of the wing rear spar interface attachment. As such, instrumenting, calibrating, and monitoring the structure in real time is warranted. Monitoring for overloads during the flight envelope expansion of the ACTE structure in flight is a significant risk reduction element ofconducting a safe flight project. The ACTE and wing box structure are instrumented at multiple locations for the monitoring of overloads during flight-testing. Figure 2 shows the locations of the two instrumented wing rear beam stations (RBSs) and the four instrumented wing interface fittings on the left wing. Fittings will be installed on both wings for flight-testing. The two wing RBSs are instrumented for monitoring shear, bending, and torque wing loads at the 40-percent chord reference line; the four wing interface fittings are monitored for combinations of shear, bending, axial, and lateral side load. The side load is monitored at the outboard interface fitting (D) which is the only interface that transmits side load from the flap to the wing box. Both the left and right wing interface fittings will be monitored, allowing the team to observe any unsymmetric wing loading during flight-test points. Two internal jack screw actuators located in each ACTE flap are monitored for axial loads.
Real-time monitoring of the loads will require that the instrumentation be calibrated on the ground using the application of known loads. Instrumentation calibration requires that known loads be applied to the structure while recording the strain gage response. The strain gage response is correlated with the known loads through linear
F

American Institute of Aeronautics and Astronautics3
regression techniques, producing derived equations for loads in terms of strain gage bridge responses. The calibration effort aspired to achieve errors on the order of 5 percent or less for bending and 10 percent or less for shear. The benefits of safety-of-flight instrumentation and making comparisons to models after testing diminish with errors larger than 10 percent. Previous load calibrations on wing structures have achieved load equation errors in therange being utilized for this experiment.3 The interface design, instrumentation layout, calibration testing design, and analysis procedures all must converge to produce the desired objective.
II. Interface DesignThe ACTE flaps will attach to the wing rear spar at the existing four Fowler flap attachment points on each wing.
The existing GIII Fowler flaps are actuated aft and down using rollers guided by the four tracks attached to the rear spar of the wing. The ACTE integration will require that the GIII flight and ground spoilers be removed to makeroom for the ACTE structure. The ACTE modification will require the four Fowler flap tracks to be removed and replaced with the wing interface fittings that will attach each ACTE flap to each GIII wing rear spar. The inboard wing interface fitting is referenced as fitting A, proceeding outboard to fitting D which is closest to the aileron.Figures 3 and 4 show the left wing ACTE interface fittings installed on the SCRAT.
All ACTE loads will transfer into the wing box through the four wing interface fittings. All closeout structure will attach to the ACTE structure, minimizing additional load transfer paths into the wing box structure. The four interface fittings must constrain all three directions of motion of the ACTE flap, but maintain adequate translational and rotational freedom to allow thermal expansion and wing flex reactions. Thermal expansion of the ACTE flaprequires room for movement of the ACTE structure relative to the wing box rear spar. Wing interface fittings A, B, and C allow for lateral span-wise movement. Interface fitting D constrains the span-wise motion of the ACTE flap,as does the GIII Fowler flap interface.
The eight interface fittings are made from 4340 steel that has been heat-treated to 200 ksi. The forward end of each interface fitting matches the original production Fowler flap fitting design, but the aft portion of each fitting was redesigned to interface with the new ACTE clevis fittings. All new hardware has been designed to a factor of safety of 2.25 for ultimate strength, while all existing GIII aircraft interfaces are shown to have positive margin to the original production airplane design factor of safety of 1.5.
III. Instrumentation and Data AcquisitionThe wing interface fittings have been instrumented with foil metallic strain gages. The shear bridges are Vishay
CEA-06-250US-350 strain gages (Vishay Intertechnology, Inc., Malvern, Pennsylvania; specifically,Micro-Measurements, Raleigh, North Carolina) and are located on the interface fitting web. Two tee rosettes wereplaced on the top and bottom flanges of each interface fitting to comprise the axial and bending bridge response. The tee rosettes are WK-06-125TB-10C/W strain gages. Each pair of rosettes (top and bottom) was configured in a full bridge configuration. The bridges were added to form an axial load response (rAF) and subtracted to form a bending bridge response (rPM). Two linear pattern gages were added to wing interface fittings B and C to form a bending response bridge (rBND). The bending gages are WK-06-125PC-10C/W. A four-active-arm Wheatstone Bridge configuration was chosen for all sensors to minimize thermal effects.4 Figure 5 shows the installed instrumentation on interface fittings A (left) and B (right).
The orientation and locations of the strain gages were determined as next described. The center of each shear bridge was located on the neutral axis of each interface fitting and oriented perpendicular to or parallel with a nearby flange for ease of installation. The tee rosettes and linear pattern gages were aligned on center with the shear gage on the inside of the upper and lower flanges. The gages were installed on the inner flanges to protect them from abuse during installation and actuation of the flap. The strain gage bridge locations were selected on each interface fitting to avoid fillets and geometry that would hinder the strain response of the bridge.
The interface fitting surface was prepared by baking it for 1 hr at 275 °F. The adhesive M-Bond 600 (Micro-Measurements) was used and was cured for 2 hr. The sealants M COAT-A (Micro-Measurements) andM COAT-D (Micro-Measurements) were applied, followed by a final coat of MIL-S-8802 sealant to protect the strain gage from the environment. Interbridge wiring was 32-gauge. Shielded four-conductor aircraft wire was used for the leadwire from the solder tabs to the Teletronics Technology Corporation (TTC) (Newtown, Pennsylvania) boxes.
Ground test calibration data were recorded using the DFRC Flight Loads Laboratory (FLL) fourth-generation Data Acquisition and Control System (DACS4), which has 16-bit resolution. The FLL Interactive Analysis and Display System (IADS), along with DACS4, were used to display the data in real time during the testing. Data taken

American Institute of Aeronautics and Astronautics4
during load application were sampled at 10 samples per second, allowing for a sufficient number of samples along the load run during the load ramp.
The SCRAT airplane instrumentation system collects data from sensors positioned throughout the airplane. The data are recorded onboard and transmitted to the ground for real-time monitoring in the control room. The airplaneinstrumentation system has 16-bit resolution, allowing adequate range and resolution in the measurements. The instrumentation system is configured for monitoring 1200 parameters at a range of 1 to 20,000 samples per second.1The interface fitting loads will be monitored at 500 samples per second to collect any dynamic response in the structure. Previous wing strain gage data recorded during the SCRAT baseline flights show minimal noise in the data.
IV. Load Case DesignExternal loads analysis was performed on the wing and ACTE cartridge. A modification of any size to the outer
mold line of an aircraft requires that an external loads analysis be performed in order to determine the design loads for the modified structure. Additionally, the analysis must be performed to ensure that the modification will not damage the interface structure of the aircraft in flight.
Inertial and aerodynamic loads were considered. The production GIII airplane was cleared to operate between -1.0 g and 2.5 g. The aircraft weight distribution and center of gravity location determine the magnitude of the inertial loading. Aerodynamic loading is the load induced by the outside air flow. The wing and ACTE cartridge pressure loads were calculated using TRANAIR++ (Calmar Research Corporation, Needham, Massachusetts),5a full-potential computational fluid dynamics code. Figure 6 shows a TRANAIR++ model with a pressure distribution over the new flap structure.
The external pressure loads were developed using rigid aerodynamic loading assumptions. The above described method does not take into account the aeroelastic effects that the aircraft experiences in flight. The wing of an airplane flexes and deforms under its own weight as well as under the aerodynamic loading it experiences in flight.Accordingly, pressure distribution is modified, which in turn modifies the loads on the wing. Except in cases of static divergence, discounting aeroelastic effects is conservative for external load cases that are used to analyze wing loads.6
All credible worst-case loading conditions for the GIII airplane were taken into account. These loading conditions were separated into two main categories: symmetric and unsymmetric loads. Symmetric loads result from flight conditions that have no lateral component such as a pushover-pullup maneuver. The remaining load cases encompass unsymmetric loads, which are those that are not symmetric about the center line of the aircraft, such as bank-to-bank rolling maneuvers. Both maneuver loading and gust loading were considered for unsymmetric and symmetric loads. Gust-type loading is often critical in establishing the worst-case external loads on an aircraft.Vertical gusts of varying degrees of severity can hit an aircraft in flight, causing rapid increases in aerodynamic loading. The external loads analysis considered every credible gust condition to which the GIII could be subjectedduring the ACTE flights.
Using this set of external loads, the design load cases were selected for each flap deflection based on the cases that had the highest vertical shear and hinge moment. In some cases, the highest of both of these loads could be captured by one load case. Negative shear cases were the result of the deployment of the ailerons. Negative gust loadconditions may also produce negative shear forces and bending moments. The resulting pressure loads for each flap deflection were applied to the ACTE finite element method (FEM) model to determine the interface loads. The interface loads were then used to determine the ground calibration loads.
V. Test Setup and Load Application MethodologyEarly on in the ACTE project it was debated whether the interface fittings should be calibrated when they were
installed on the airplane or in a dedicated test rig. Calibrating the fittings when they were installed on the airplanewould allow the fittings to be constrained in the same way as they would be in flight, and would not require adedicated self-reacting test rig, which would save design and fabrication time. There would be a number of challenges, however, involved in calibrating the fittings in this way. The interface fittings are installed on the airplane at a slight angle to the ground due to wing dihedral, which complicates the load application for an on-airplane calibration. Constraining the airplane so that wing flex and gear reaction would have a minor influenceon the calibration would also present a challenge. Load application to a flightworthy aircraft generally requires more people and more resources than what is required to conduct a small-scale laboratory load calibration. The ACTE project team decided to design a dedicated load fixture for calibration of the wing interface fittings.

American Institute of Aeronautics and Astronautics5
There are two requirements for the calibration test rig design. First, the test frame design must accommodate all four interface fittings as they are installed on the airplane. Second, the test rig must apply the required loads in the appropriate load reference axes while maintaining positive margins of safety for all interface fittings and load application hardware. All calibration rig hardware was designed to a factor of safety of 3.0 on ultimate material strength. All ACTE flight hardware maintained their original design factors of safety.
The original production Fowler flap tracks were designed to carry the load through the upper flanges using fasteners, requiring all fasteners to have tight tolerance holes or be match-drilled upon assembly. The upper flange support on the interface fittings was widened to allow two sets of holes to be drilled. The outer set of holes in the added flange area were used for ground-testing only; the inner set would be match-drilled at final assembly on the airplane. Figure 7 shows the top flange and lower main lug fastener locations. The holes that are shown in green in the figure were match-drilled to the calibration test rig support; those shown in blue were drilled at the airplaneduring assembly.
The interface fitting support hardware was designed to accommodate all four unique interface fittings, as shown in Fig. 8. The lower main lug attachment was adjusted so that the upper flange attachment fit-up was aligned. The support bracket and interface fitting upper flange were then match-drilled to create a close-tolerance assembly. The rotation of the interface fitting about the main lug determined the load reference axis for the load application hardware. The test rig was designed to allow different load bar angles.
The test frame was assembled from FLL steel erector set C-channels and steel diagonal support rods. The test rig is shown in Fig. 9. The horizontal and vertical C-channels were connected by one-inch-thick steel angle at each corner. The frame was designed to support the shear, bending, and axial forces to be applied to the interface fittings.The adapter plates bolted to the erector set frame allowed for the positioning of the jack bases to ensure theperpendicularity and parallelism of the load path with the I-beam load bar. Each interface fitting required a different configuration, but all used basically the same hardware. A unique set of adapter plates was fabricated for each interface fitting to attach the load bar to the fitting spherical bearings.
The FLL four-channel load control system was used to apply loads to the test articles. A maximum of three hydraulic channels were used at any one time. The four-channel hydraulic cart is a stand-alone hydraulic power unit that can independently control four hydraulic load channels. The four-channel cart requires 480VAC to power the system. Three channels were used simultaneously to complete the required load cases.
Three 5000-lb capacity dual bridge load cells (LCV1, LCV3, LCA1) were used for control and data acquisition of the input loads to the load bar. The load cells were mounted at the end of each actuator using a male/female threaded connection. A clevis was mounted to the other end of the load cell to allow a pinned connection to the load bar. The load cell errors are less than 1 lb. One type K thermocouple (TC1) was placed near the test article to measure the ambient temperature during tests. Each hydraulic actuator had an integrated linear resistance transducer (LRT) to measure stroke (LRTV1, LRTV3, LRTA1).
Two linear voltage displacement transducers (LVDTs) were used for real-time monitoring of the test article and nearby test structure displacement. The DACS channel LVDT1 was placed on the bottom edge of the support bracket adapter plate. Channel LVDT2 was placed underneath each interface fitting approximately in line with the shear/torque gage. Supported by a uni-strut frame fixed to the floor tracks, each LVDT measurement is independent of any test rig deflection. The instrumentation naming convention is shown in Fig. 10.
The test process followed the same sequence for each pair of fittings. Before the fitting was installed, the upper flange of the fitting was match-drilled to the support hardware. Depending on the fitting, shimming may have beenrequired to obtain the correct fit. Obtaining a sufficient calibration required that the actual operational environment be understood. The bridge outputs were recorded before and after assembly in the test frame to assess any installation-induced strains. The interface fitting installed in the test frame was referred to as the zero load reference state. This condition did not include any calibration hardware. The interface fitting bridge outputs were zeroed (software) in this reference condition. This condition most closely resembled the flight application configuration.
Once installed, the load bar with the unique adapter plates for each fitting was pinned to the interface fitting.The pins, adapter plates and load bar were all machined for a close-tolerance fit-up, allowing very little free play in the load hardware. The angle of the load bar was fixed, and all load application hardware was aligned to meet the requirements of the load reference axis. The jack bases for each hydraulic jack were able to slide to accommodatethe correct alignment. The correct alignment achieved, the load bar and jack base pin locations were measured for later use in the analysis. The strain gage instrumentation was connected and the LVDTs were adjusted to finish the setup process. The entire setup could be completed in approximately four hours.

American Institute of Aeronautics and Astronautics6
VI. Calibration Load DesignThe target calibration loads were based on the predicted ACTE design limit loads. All ACTE design limit loads
were within the original Gulfstream Fowler flap design limit loads. The load reference axis for each interface fitting was located at the main lug, as shown in Fig. 11. The load reference axis was derived from the Fowler flap track design coordinate system. A requirement of the test rig was to apply all loads in the load reference axis coordinate system to minimize errors of misalignment.
A set of 21 load cases was developed to cover the range of expected in-flight loads, and was broken into four loading types:
1. Pure load cases: Only one type of load is applied;2. Bending/shear/axial: All three loads are applied simultaneously;3. Pure shear at pin axis: Derives the stiffness at the pinned joint;4. Check cases: Independent of the original load cases.
The load case schedule was designed to cover the expected flight load envelope. The 21 load cases for interface fitting A are shown in Table 1. Figure 12 shows the 21 load cases plotted as bending versus shear loads. For most of the ACTE flights, the interface fittings will see both positive shear and bending loads. The ACTE flights will limit the aircraft operating maneuvering limits to 0.0 g to 2.0 g, which would maintain positive loads on the ACTE cartridge. The expected in-flight loads should remain in quadrant I of the flight load envelope for most of the ACTE flights. Negative shear and bending loads on the interface fitting would be caused by negative flap deflections or a gust condition. A negative shear and bending load would reside in quadrant III. Load cases were added to quadrants II and IV to investigate a complete flight load envelope. Check cases were added to quadrant I for validation of the equations.
Table 1. Interface fitting A: Calibration loads.
Load bar loads, lb Loads at main lug, lb
Load case description LC V1 V3 A1Bending,
in-lb Shear, lb Axial, lbPure bending 1 1124 -1124 50 44964 0 50Pure shear 2 -2091 751 50 0 1340 50Pure axial 3 -50 -50 645 4274 101 645Pure bending (negative) 4 -699 699 50 -27972 0 50Pure shear (negative) 5 1044 -375 50 0 -670 50Bending/shear/axial (1,1,1) 6 -692 -648 645 55939 1340 645Bending/shear/axial (-1,1,1) 7 -2250 1256 645 -27943 995 645Bending/shear/axial (1,-1,1) 8 1980 -1310 645 37417 -670 645Bending/shear/axial (1,1,-1) 9 -692 -648 50 55939 1340 50Bending/shear/axial (-1,1,-1) 10 -2250 1256 50 -27943 995 50Bending/shear/axial (1,-1,-1) 11 1980 -1310 50 37417 -670 50Bending/shear/axial (-1,-1,1) 12 55 428 645 -27962 -483 645Bending/shear/axial (-1,-1,-1) 13 55 428 50 -27962 -483 50Pure shear at pin axis 14 -1773 434 50 12657 1339 50Pure shear at pin axis (negative) 15 886 -217 50 -6323 -669 50Pure axial (large axial load) 16 -50 -50 2500 4274 101 250050% shear 50% bending (large axial) 17 -346 -324 2500 27959 670 250050% shear 100% bending 18 312 -901 50 49221 589 50100% shear 50% bending 19 -1391 50 50 27967 1340 5050% shear 100% bending with 50% axial 20 312 -901 323 49221 589 323100% shear 50% bending with 50% axial 21 -1391 50 323 27967 1340 323

American Institute of Aeronautics and Astronautics7
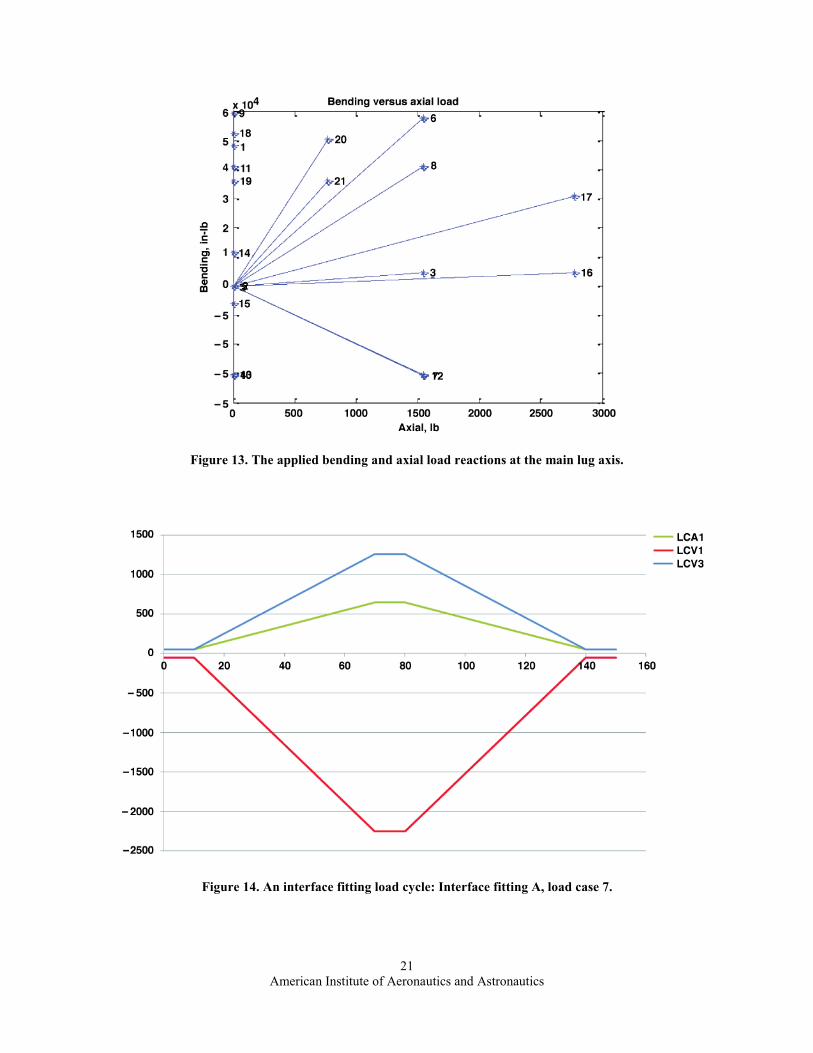
The design of the interface fittings does not lend itself to accurate axial load measurement. Axial loads were added to the flight load envelope schedule to investigate the potential of measuring axial load and to make sure that any expected drag loads on the interface fittings did not have a large effect on the shear and bending measurement. The axial applied loads were only applied in the positive direction and are shown in Fig. 13.
VII. Testing ProceduresThe testing consisted of a crew brief to review procedures and crew assignments, a pre-test setup, the load
application, and a post-test debrief to discuss any anomalies that were discovered in the testing. The pre-test setup is conducted using a checklist and consists of hydraulic controller setup and checkout, installation of the load bar, and pin-up of the hydraulic actuators. The entire process required approximately 45 minutes. All of the instrumentation,including the interface fitting strain gage instrumentation, was zeroed before installation of the load bar to the interface fitting. Once the load bar was installed and the hydraulic actuators pinned up, the load application couldbegin.
Applying preloads before application of the calibration loads was found to be beneficial from a hydraulic system and data quality standpoint. When traversing through zero or the neutral load point of the load application hardware, the hydraulic controller obtained excessive error in the controller, leading to a hydraulic dump. To preclude this event, a preload greater than the weight of the load bar assembly was applied to the rig before the calibration load was applied. Depending on the load direction of each vertical jack, a preload of 100 lb or 5 lb was applied to the actuators. A preload of 5 lb was applied to the axial jack for each case.
Figure 14 depicts each hydraulic channel load profile used for interface fitting A during load case 7. Each test case had a similar ramp-up and ramp-down profile. The load profile consisted of a 60-s ramp-up time to the target load,followed by a 5-s dwell, immediately followed by a manual hold to allow time for load cell data checks and deflection measurements to be taken. The load profile was then allowed to resume. The hydraulic controller reducedall loads to the preload condition at the same rate: 60 s. All load cases included three repeated load cycles for statistical comparison.
For load cases in which only one or two channels were used, the unused channels remained pinned and hadtension or compression loads applied (depending on force direction) to provide higher control stability for those channels. Near-exact desired test loads were achieved and adjusted on a per-channel basis at the test condition.Figure 15 shows the hydraulic jacks being pinned to the load bar during the preload setup.
VIII. Calibration AnalysisThis section discusses the analysis process that was required to calibrate the instrumentation on each interface
fitting for shear force, bending moment, and axial force. The equation coefficients were calculated by correlating the known applied loads with the strain gage output using linear regression techniques. The loads are defined as the dependent variables. The gage responses are defined as the independent variables and are presented in Table 2.
Table 2. Strain gage response (independent variables).
Strain gage response variable Gage response descriptionrAF1 Top flange axial bridge responserAF2 Bottom flange axial bridge responserNF Shear bridge responserPM Pitching moment response (rAF2 - rAF1)rAF Axial force response (rAF2 + rAF1)rBND Bending bridge response (added to interface fittings B and C)
The experimental loading design must provide sufficient linearly-independent information to solve for all of the unknown coefficients in the mathematical model. Assumptions include linear bridge outputs and a load/output relationship independent of strain direction. The data analysis process was organized into five steps:
1. Raw data analysis;2. Correction of applied reaction loads;3. Load case selection;4. Mathematical model selection;5. Linear regression analysis.

American Institute of Aeronautics and Astronautics8
A. Raw Data AnalysisWhen all 21 load cases had been applied, the load and response data were reviewed for quality. The applied
reaction loads were plotted along with the gage responses to review the acceptability of the data for calibration. The data were reviewed to verify that the correct loads had been applied, that the data were linear during application of the applied loads, and that there was minimum noise over the load run. It was necessary that the jacks have removedany initial backlash present in the system before loading of the interface fitting could take place. Initial backlashcreated non-linear data that were unusable for the calibration analysis. The use of preloads eliminated any large non-linearity in the initial portion of the data. A total of 50 data points were chosen over the load ramp for each load case.
B. Correction of Applied Reaction LoadsThe reaction loads were corrected for the alignment of the actuators and the deflection of the loading hardware.
The interface fitting, spherical bearings, attachment pins, adapter plates, and load bar all introduced deflection into the test rig and thus created error in the direction of the applied loads. A beam FEM model was created to incrementally correct the applied reaction loads. The reaction loads were calculated from the FEM model, as the interface fitting and load bar deflect during loading. This approach enabled approximating the applied load components at each point in time during the course of the load run. One-dimensional finite elements were implemented into the FEM code.7 Each node had two displacements and one rotation. The three actuator load application points were modeled by applying the actuator loads at their correct angle given the deflected shape. Figure 16 shows how the FEM correction load scheme worked. The beam model deflections were validated against the displacement transducer over the load run, as shown in Fig. 17.
C. Load Case SelectionA successful calibration requires a compromise between the cases used for the linear regression analysis and the
independent check cases used for validation of the equations. Four sets of cases were chosen to assess the effects of using different combinations of calibration cases and check cases for the calculation of the shear force and bendingmoment loads. Figure 18 presents the four different combinations of load cases. The blue points in the figurehighlight the cases used in the linear regression analysis; the green points highlight the points used in the post linear regression equation validation. The ideal situation is one in which the calibration cases cover the extent of the operational envelope and the check cases cover a realistic operational case. The specific load cases were combined into one data set to create the input into the linear regression analysis program.
D. Mathematical Model SelectionA linear mathematical model was chosen for deriving the equation coefficients. The gage response is expected to
be linear throughout the load range. Any nonlinearities in the data would indicate inadequate preloads or unacceptable gage installation. The calibration model for calculation of the component loads F is related to the gage responses R by a linear function of the form shown in Eq. (1):
� = �� + �����
��� + ��|��|���� (1)
where n is the number of strain gage response variables (n = 3 for fittings A and D; and n = 4 for fittings B and C).The a, b, and c terms represent the calibration coefficients determined by multiple linear regression. The intercept term �� will zero the load equation once the interface fittings are installed on the airplane.
The BALFIT8 software tool, developed at the NASA Ames Research Center (Moffett Field, California), was utilized to determine which mathematical model coefficient to use for the calibration. The candidate mathematicalmodel search was used over the entire 21-case data set. Various combinations of the search metrics were established to assist in determining the mathematical models used for calibration of the interface fittings. Only linear terms were allowed in the search. The search strategy metrics were adjusted to assess optimal mathematical models. The search strategy consisted of either a forward selection or backward elimination search metric to determine the mathematicalmodel terms. After assessing the recommended mathematical models provided from the candidate model search, a few additional models were added to round out the group for exploratory purposes. The additional bending bridge on interface fittings B and C allowed a larger number of mathematical model combinations to be selected. Table 3 and Table 4 show the selected mathematical models for interface fittings A and B, respectively.

American Institute of Aeronautics and Astronautics9
Table 3. Interface fitting A: Regression mathematical models.
Table 4. Interface fitting B: Regression mathematical models.
E. Linear Regression AnalysisThe linear regression analysis was also conducted using the BALFIT software tool. Three different analysis
modes were available: iterative, non-iterative, and classical linear regression. The classical and non-iterative modes were the same except the non-iterative mode supported tare load iteration processes. The non-iterative linear regression method was used for calibration of the ACTE interface fittings. The non-iterative method expressed the component forces and moments as functions of the bridge outputs. The independent variables were the bridge outputs; the dependent variables were the component loads. Most wind-tunnel balance calibrations use the iterative method, but it has been shown previously that the two methods give similar results.9 One benefit of the iterative method is the ability to know if there is insufficient data for calibration of the balance.10 The real-time monitoring of loads in flight requires a direct approach and does not lend itself to iterative methods.
IX. Equation ValidationA set of quality metrics was selected to determine the adequacy of the equations for predicting real-time loads.
The quality metrics are shown in Table 5. The first four metrics are referred to as adequacy checks due to their relationship to the calibration load set. The only true validation of the derived equations comes from the independent check cases. The check cases contain applied loads that are independent of the original calibration load set.

American Institute of Aeronautics and Astronautics10
Table 5. The calibration analysis quality metrics.
Quality metric Adequacy check ValidationCalibration load schedule XMaximum of variance inflation factor XStandard deviation of load residuals XPercent root mean square error XValidation check case X
A. Calibration Load ScheduleThe purpose of the calibration load schedule metric is to ensure that the applied calibration loads cover the
operational envelope of the interface fitting and are flight-relevant combinations of the applied loads. The calibration loads for the interface fittings were designed with the ACTE predicted loads in mind. The calibration cases were taken from quadrants I and III of the flight load envelope, which are the interface loads most likely to occur in flight. Four different combinations of calibration and check cases were selected to determine how the different combinations affected the equations and the equation errors.
B. Maximum of Variance Inflation FactorThe variance inflation factor (VIF) quantifies the degree of multicollinearity in the linear regression analysis. It
is recommended that the VIF be less than 10.11 A VIF greater than 10 may indicate flaws in the experimental design, but recent investigations have shown that VIFs of up to 50 can be acceptable. A VIF of up to 10 was deemed acceptable for the ACTE interface fitting derivation equations. Any case with a VIF over 10 is assessed on a case-by-case basis.
C. Standard Deviation of Load ResidualsThe standard deviation � calculation provides an estimate of the quality of the derived equations. A 2� value
was calculated that represented a 95-percent confidence that 95 percent of the load residuals were captured. The 2�standard deviation is shown as a percentage of the maximum calibration load capacity. The standard deviation was calculated using the arithmetic mean as the population mean. The load residual is defined by �, where �� is the measured value, ��� is the derived value, and n is the number of measurements. The equation for load residual is shown in Eq. (2) and that for the standard deviation in Eq. (3).
� = ��� � �� (2)
� = � 1� � 1 (� � ��)� ���� (3)
D. Root Mean Square ErrorThe root mean square (RMS) error is a commonly used metric that has been utilized in many previous load calibration tests. The RMS error, like the standard deviation, can be calculated for both the calibration cases and the check cases. The RMS error is calculated as shown in Eq. (4).
� = 100 � �� (��� � �� )������ ������� (4)
E. Validation Check CaseThe only true validation of the derived equations is assessing the errors on the check cases. The check cases were
selected using non-calibration cases. A quality check case is one that represents realistic flight loads but is not contained in the original calibration load set.

American Institute of Aeronautics and Astronautics11
X. Calibration ResultsThe calibration data were analyzed from all eight interface fittings. A total of 16 separate shear force and 16
bending moment equations were derived for interface fittings A and D. Due to the additional instrumentation on fittings B and C, there was a total of 24 separate shear force and 28 separate bending moment equations. The quality metrics described above, along with good engineering judgment, were used to downselect to the best shearforce and bending moment equation for each interface fitting. The results for only these primary equations arepresented in this report.
The load equation coefficients for each interface fitting for the shear force and bending moment loads are shown in Table 6. The magnitudes of the coefficients for both left and right interface fitting pairs compare reasonably well, which is expected due to similarities in the instrumentation layout and calibration test setup for each interface fitting pair. The rBND bridge response was found to produce less error in the equations than therPM bridge response. This may be because rBND is a true bending response, not a derived bending response. The rAF bridge response coefficient was not selected in the shear force and bending moment equations because of the small output response.
Table 6. The interface fitting load equation coefficients.
The quality metric details for each selected primary load equation are shown in Table 7. The calibration case and validation check case numbers are presented for each load equation. All equations used cases 1-15 for the calibration load set except for the interface fitting B shear force equation. A smaller load set was required to obtain shear force equations with acceptable errors. The same can be said for the validation check cases. All equations used cases 18-21 for the validation cases except for the interface fitting B shear force equation, which used cases 6 and 9.
The VIF is shown for each equation. The largest VIF is 13, for interface fitting “Right B.” This VIF is acceptable despite being above the cutoff value of 10, which is a rule-of-thumb guideline. A number of equations had VIFs of 50 or larger; these were quickly eliminated from consideration.

American Institute of Aeronautics and Astronautics12
Table 7. The interface fitting calibration results.
The standard deviation and RMS are listed for both the calibration load case set and the validation check case set. The validation check case set errors were smaller compared to the calibration load case set results, validating the equations for a realistic flight load case. The 2� residual errors for the shear force loads are less than 8 percent of the full-scale calibration load, and the 2� residual errors for the bending moment loads are less than 3 percent of the full-scale calibration load. The larger-than-expected shear force RMS errors can be attributed to a shortfall in the RMS calculation when assessing small measured loads in the denominator.
The potential for axial load measurement was investigated. Due to the characteristics of the interface fittings, axial force measurement was not readily obtainable. It happened that interface fittings B and C had the potential for axial force measurement due to the large axial applied loads, which were on the order of 2500 lb. The axial force 2�residual errors for interface fittings B and C were on the order of 10 percent. The axial force errors for interface fittings A and D were not acceptable due to the lower in-flight predicted applied axial loading. Interface fittings A and D will need to be designed differently if axial force measurement becomes a requirement.
XI. Predicted and Measured Strain ComparisonsPre-test strain predictions of the interface fittings were used to help determine instrumentation placement and
expected strain response output. Finite element method models were created using a commercial off-the-shelf software package, ProE Mechanica (Parametric Technology Corporation, Needham, Massachusetts).12 The interface fittings were designed and built using ProE Mechanica drawing tools. The solid models were auto-meshed using tetrahedral solid elements. The boundary constraints made use of the lower main lug and upper flange fastener holes.The applied loads were calculated from the ground calibration hydraulic jack loads and translated to the spherical bearing holes. Figure 19 shows a strain contour plot of interface fitting A under load. The strain gage response (mV/V) from the gages was converted to strain output (in/in) post-test for validation of the models. Equation (5)demonstrates the conversion of strain gage bridge data.
= 4(��)(�)(��)(��) (5)
= strain output, in/in�� = output voltage, VN = bridge factor (dependent upon the !"#$!!!"#%&' relationship and bridge configuration)GF = gage factor�� = excitation voltage, V

American Institute of Aeronautics and Astronautics13
Bridge factors:
N = 2.67 (axial bridge factor)N = 2.00 (shear bridge factor)
The strain comparison of the strain gages and FEM output were within 10 percent for most cases. The cases with errors higher than 10 percent can be attributed to low applied loads, where a low strain output can create a large error when divided by itself. As expected, a pure shear load case may result in large errors in the axial strain bridge response. Table 8 shows the predicted and measured strain comparisons for load cases 1-15 for interface fitting A.
Table 8. Interface fitting A: Comparison of predicted and measured strain.
Microstrain difference between FEM and data, %
Load case Type rAF1 rAF2 rNF1 Pure bending -9.9 1.7 6.52 Pure shear -10.7 3.7 1.53 Pure axial -32.7 -31.0 43.44 Pure bending (negative) -7.1 -4.4 3.76 Bending/shear/axial (1,-1,1) 2.1 2.0 -1.87 Bending/shear/axial (1,1,1) 1.0 1.7 -1.98 Bending/shear/axial (-1,1,1) 0.2 1.1 1.09 Bending/shear/axial (1,-1,1) -10.7 0.1 5.810 Bending/shear/axial (1,1,-1) -5.0 2.4 2.911 Bending/shear/axial (-1,1,-1) -7.3 3.4 7.812 Bending/shear/axial (1,-1,-1) -2.1 -1.2 1.313 Bending/shear/axial (-1,-1,1) -7.5 1.6 7.414 Pure shear at pin axis -12.3 -13.1 2.815 Pure shear at pin axis (negative) -30.4 12.3 -2.3
XII. ConclusionsThe Adaptive Compliant Trailing Edge (ACTE) project requires the ability to monitor and record the wing and
ACTE interface loads in real time in flight for model validation and safety-of-flight objectives. This paper presentedthe results of the ACTE wing interface fitting strain gage calibration. The ACTE interface design, instrumentation layout, calibration test design, and analysis procedures were discussed. The calibration-derived equations and resulting errors were shown for all eight wing interface fittings.
The interface fittings in general do not lend themselves to ample bridge response given the large design factors of safety and short, stubby nature of the flight articles. The calibration was thus a challenging effort.Recommendations for future testing of similar articles of this nature are to spend additional time optimizing thearticles for improved output: changing features to produce more strain response output and creating larger footprints that avoid fillets and geometry that hinder the strain response of the bridge.
The preloading of the interface fitting at the beginning of each load cycle made a considerable difference in obtaining acceptable data and is recommended when multiple interfaces are involved that induce hysteresis effects.The test rig deflection should also be sufficiently investigated before testing, to minimize off-axis loading effects.Should said effects still present, it is possible to calculate them out using finite element methods after testing.
Variance inflation factor, standard deviation, and root mean square error metrics were applied to the derived equations for validating their adequacy for in-flight monitoring. Load cases which were independent of the original load case schedule were selected to validate the set of calibration load cases. These metrics provided a path for determining the best equation for implementation.
The results of this report highlight the ability to instrument non-ideal force measurement articles for load monitoring purposes. The calibration aspired to achieve errors on the order of five percent or less for bending

American Institute of Aeronautics and Astronautics14
moment loads and ten percent or less for shear loads. An independent set of validation cases was used to validate each derived equation. The 2-sigma residual errors for shear loads were less than eight percent of the full-scale calibration load; the 2-sigma residual errors for bending moment loads were less than three percent of the full-scale calibration load. The potential for axial force measurement was investigated and shown acceptable for interface fittings B and C due to the application of large axial loads. The structure of interface fittings A and D would requireoptimization to obtain future axial force measurements. Post-test comparison of the calibration test measured strains and finite element method predicted strains show that the strains can be reasonably predicted to within ten percentfor assisting with instrumentation layout.
Overall, the calculated errors meet the desired objectives for the calibration effort. The derived equations presented in this report will allow the team to safely monitor the interface loads in real time in flight and to conduct post-test comparisons of structural models.
AcknowledgmentsThe authors gratefully acknowledge the work performed by Joe Gonzales in the design of the eight interface
fittings. We also gratefully acknowledge Aric Warner for the care and technical insight he provided to the fabrication of the interface fittings. Each interface fitting was unique and required special attention to obtain anacceptable match to the existing aircraft interface. The authors thank Tyler Latsha for assisting with the strain gage placement finite element model analysis and post-test strain comparisons. The metallic foil strain gage installation and wiring of the interface fittings was performed by Jeff Howell and Wally Hargis; installing a large number of strain gages with no flaws is no small achievement and deserving of recognition. As well, the authors extend thanks to everyone in the Flight Loads Laboratory who assisted with the calibration of the interface fittings.
References1Baumann, E., Hernandez, J., and Ruhf, J., “An Overview of NASA’s SubsoniC Research Aircraft Testbed (SCRAT),”
AIAA-2013-5083, 2013.2Sridhar, K., Osborn, R., Ervin, G., Maric, D., Flick, P., and Paul, D., “Mission Adaptive Compliant Wing – Design,
Fabrication and Flight Test,” RTO-MP-AVT-168, pp. 18-1 - 18-19.3Jenkins, J. M., and DeAngelis, V. M., “A Summary of Numerous Strain-Gage Load Calibrations on Aircraft Wings and
Tails in a Technological Format,” NASA TM-4804, 1997.4Murray, W. M, and Miller, W.R., The Bonded Electrical Resistance Strain Gage. Oxford University Press, New York, 1992,
Chap. 11.5CALMAR Research Corporation, TRANAIR++, http://www.calmarresearch.com/NF/STG/Tranair/Tranair.htm, accessed
November 6, 2013.6Lomax, T. L., Structural Loads Analysis for Commercial Transport Aircraft: Theory and Practice, AIAA Education Series,
AIAA, Reston, Virginia, 1996, Section 10.4.3, p. 1637Tessler, A., and Dong, S.B., “On a Hierarchy of Conforming Timoshenko Beam Elements, Computers & Structures, Vol.
14, No. 3-4, pp. 335-344.8Ulbrich, N., and Volden, T., “Development of a New Software Tool For Balance Calibration Analysis,” AIAA 2006-3434,
2006.9Ulbrich, N. “Comparison of Iterative and Non-Iterative Strain-Gage Balance Load Calculation Methods,” AIAA 2010-4202,
2010.10American Institute of Aeronautics and Astronautics, Recommended Practice: Calibration and Use of Internal Strain-Gage
Balances with Application to Wind Tunnel Testing, R-091-2003, AIAA, Reston, Virginia, 2003.11Ulbrich, N., Volden, T., and Booth, D., “Predictive Capabilities of Regression Models used for Strain-Gage Balance
Calibration Analysis,” AIAA 2008-4028, 2008.12Parametric Technology Corporation, Pro/ENGINEER® Wildfire® 3.0, www.ptc.com, accessed November 6, 2013.

American Institute of Aeronautics and Astronautics15
FIGURES
Figure 1. The Adaptive Compliant Trailing Edge integrated on the SubsoniC Research Aircraft Testbed.
Figure 2. The Adaptive Compliant Trailing Edge load monitoring locations, left wing.

American Institute of Aeronautics and Astronautics16
Figure 3. Three of four ACTE wing interface fittings attached to the left wing rear spar.
Figure 4. Closeup of an ACTE interface fitting attached to the left wing rear spar.

American Institute of Aeronautics and Astronautics17
Figure 5. Instrumented wing interface fitting A, left; and B, right.
Figure 6. The TRANAIR++ computational fluid dynamics model.

American Institute of Aeronautics and Astronautics18
Figure 7. The interface fitting support hardware: Top flange and lower main lug attachment.
Figure 8. The interface fitting support hardware: Overall design.

American Institute of Aeronautics and Astronautics19
Figure 9. The interface fitting load rig.
Figure 10. The naming convention for the calibration testing instrumentation.

American Institute of Aeronautics and Astronautics20
Figure 11. The reference axis coordinate system.
Figure 12. The applied bending and shear load reactions at the main lug axis.
American Institute of Aeronautics and Astronautics21
Figure 13. The applied bending and axial load reactions at the main lug axis.
Figure 14. An interface fitting load cycle: Interface fitting A, load case 7.

American Institute of Aeronautics and Astronautics22
Figure 15. Pinning the hydraulic jacks to the load bar during a calibration testing preload setup.
Figure 16. The beam finite element model incrementally deflected over the load application range.

American Institute of Aeronautics and Astronautics23
Figure 17. The finite element model displacements compared against the test rig deflection measurements.
Figure 18. Load case selection.

American Institute of Aeronautics and Astronautics24
Figure 19. The interface strain contour plot of interface fitting A under load.