straight - mr. glover
TRANSCRIPT
FoM 11
6.3 – Modelling Data with Line of Best Fit Day 1
We found in the probability unit that ___________ is useful to calculate probabilities of likely outcomes. Today we are going to use data to try and find _____________ so that we can make ______________ for the future. Line of Best Fit: A _______________ line that best approximates the trend in a scatter plot Regression Function: A ________ or ___________ of best fit developed through statistical analysis of data When data seems confusing, it is a good idea to try to determine what the overall trend is (are things increasing, decreasing etc…). We draw trendlines such as a line of best fit to try to make sense of the data. Creating Graphs: When you graph something in this course you need to include the following:
1. __________ (usually an Y vs X title) 2. Labelled ___________ (including units and increments on graph) 3. _____________ points 4. Line of __________ ________ 5. Use the space you are provided with (i.e. fill up the whole graph with data. If it is too
small, change the increments of your axis) 6. ______________ variable (on Y-axis) and _________________ variable (on the X-axis) 7. ______________ (if colour is used)
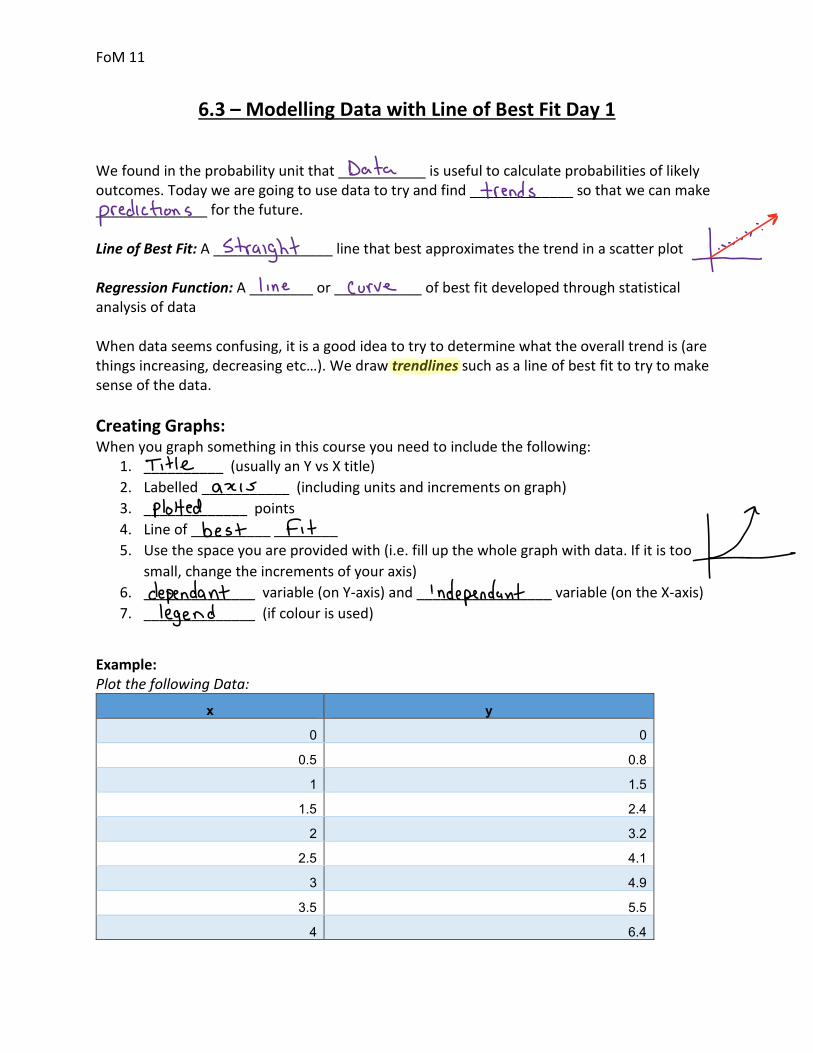
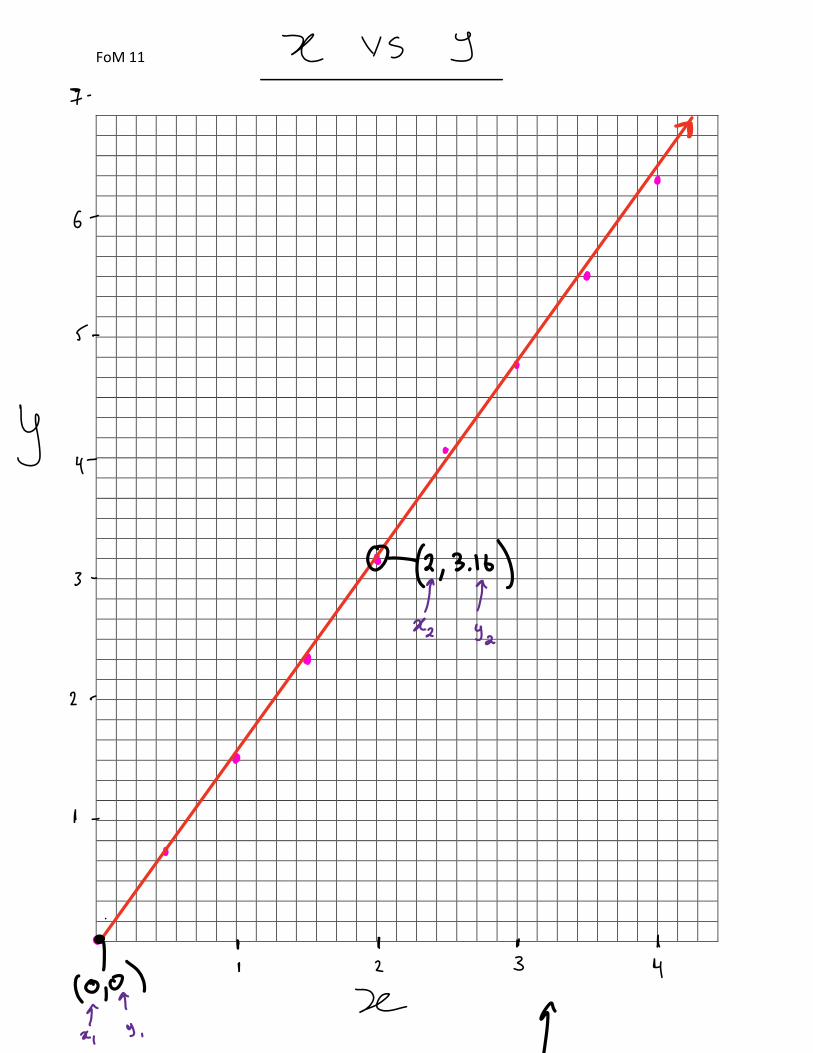
Example: Plot the following Data:
x y
0 0
0.5 0.8
1 1.5
1.5 2.4
2 3.2
2.5 4.1
3 4.9
3.5 5.5
4 6.4
Datatrends
predictions 9
straightline curve
Titleanis
plottedbest fit µ
dependant independentlegend
FoM 11
Z vs y7
of
G
r
Y y
42,3163f fR2 92
2
I
og r r r d
0,02 3 e
r 9 2ex Y J
FoM 11
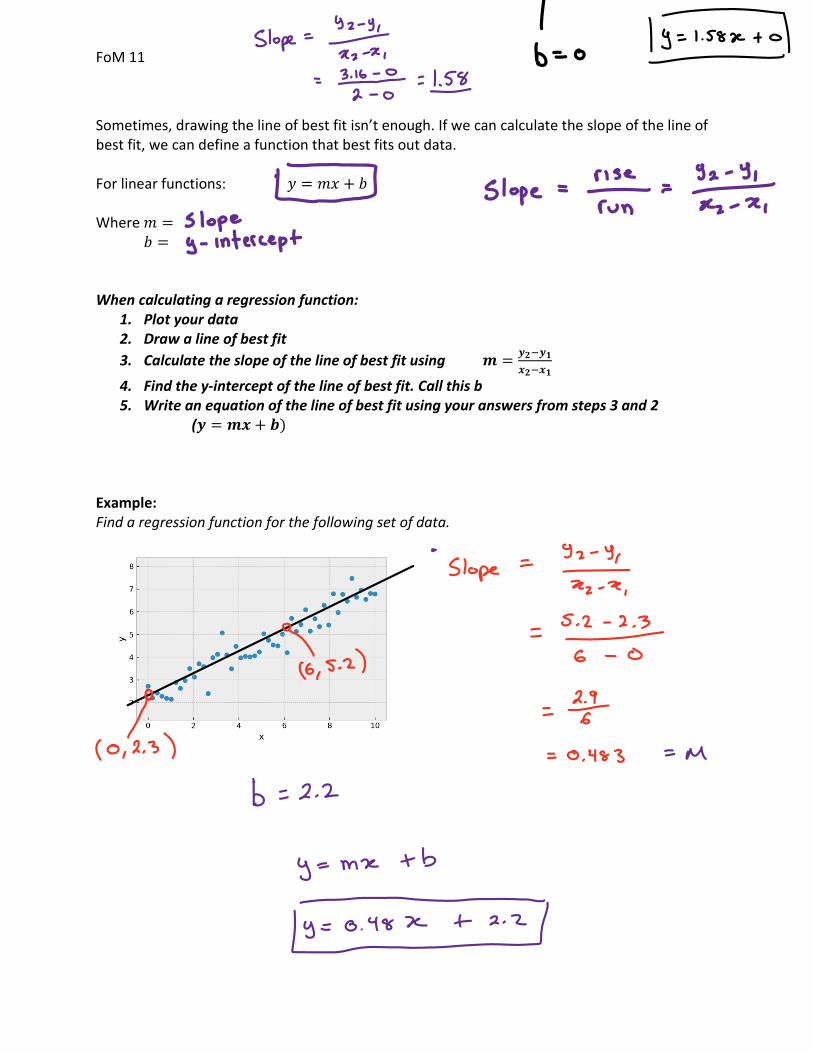
Sometimes, drawing the line of best fit isn’t enough. If we can calculate the slope of the line of best fit, we can define a function that best fits out data. For linear functions: ! = #$ + & Where # = & = When calculating a regression function:
1. Plot your data 2. Draw a line of best fit 3. Calculate the slope of the line of best fit using ' = ()*(+
,)*,+
4. Find the y-intercept of the line of best fit. Call this b 5. Write an equation of the line of best fit using your answers from steps 3 and 2
(( = ', + -) Example: Find a regression function for the following set of data.
ISlope _b 19 1.58 0
Nz Ni b O
3.21607
1.580slope _r 92
Slopeg intercept
Slope92422R5 2
2.316,52 G O
f0,2 3 0.483 M
b _2.2
y mx b
9 0.4821221

FoM 11
Interpolation: Using trends to ____________ a value ___________ the domain of a set of data Extrapolation: Using trends to _____________ a value ___________ the domains of a set of data Sometimes finding regression functions by __________ is not ideal (i.e. a data set with many points). We can use ______________ to help us with this task. In Desmos:
1. Open a google sheet and type in your data table (include x and y at the top of each column)
2. Open a Desmos page and copy your table into the first input box. 3. In the second input box type (+~',+ + - 4. The slope, m, and the y-intercept, b, will be calculated by desmos and are listed under
the heading PARAMETERS. Example: The following table shows data about students’ height and hand spans. Find a regression function for this data. Height (cm) Hand Span (cm) 165 20 172.5 21.1 172.5 17.6 153.8 16.5 157.5 17.5 170 19 168.8 20.8 177.5 22.5 182.5 25 172.5 23 180 20.2 177.5 21.1 165 20.7 165 16 175 21.2
Assignment: WB P. 163 # 1-3
Find within
Find outside
handtechnology
M 0 226 y eo 2262 18LTb 18 3