stormwater management steps stormwater effectsunix.eng.ua.edu/~rpitt//class/stormwatermanagement/m2...
TRANSCRIPT

1
Photo by Lovena, Harrisburg, PA
Stormwater EffectsRobert Pitt, P.E., Ph.D., DEEDepartment of Civil and Environmental EngineeringThe University of Alabama
Presentation based on material further discussed in: Burton, G.A. Jr., and R. Pitt. Stormwater Effects Handbook: A Tool Box for Watershed Managers, Scientists, and Engineers. ISBN 0-87371-924-7. CRC Press, Inc., Boca Raton, FL. 2002. 911 pages.
Stormwater Management Steps• Identify beneficial use impairments• Identify causes of impairments• Identify sources (magnitude, seasonality,
flow phases, etc.) of problem constituents• Identify, select, and design controls
suitable for problem pollutants and locations
• Implement controls, conduct validation monitoring, modify controls as needed
Major Receiving Water Beneficial Uses
• Stormwater Conveyance (flood prevention)• Recreation (non-water contact) Uses• Biological Uses (Warm water fishery,
aquatic life use, biological integrity, etc.)• Human Health Related Uses (Swimming,
Fishing, and Water Supply)
WI DNR photo

2
Basic Goals for Urban Streams• Stormwater conveyance and aesthetics should
be the basic beneficial use goals for all urban waters.
• Biological integrity should also be a goal, but with the realization that the natural stream ecosystem will be severely modified with urbanization.– “Biological integrity is the capacity to support and
maintain a balanced, integrated and adaptive biological system having the full range of elements [the form] and process [the function] expected in a region’s habitat.” James Karr 1991, modified
• Certain basic stormwater controls at the time of development, plus protection of stream habitat, may enable partial use of some of these goals in urbanized watersheds.
• Water contact recreation, consumptive fisheries, and water supplies are not appropriate goals for most heavily urbanized watersheds.
Receiving Water Effects of Water Pollutant Discharges
• Sediment (amount and quality)• Habitat destruction (mostly through high flows
[energy] and sedimentation)• Eutrophication (nutrient enrichment)• Low dissolved oxygen (from organic materials)• Pathogens (mostly from municipal wastewater and
agricultural runoff)• Toxicants (heavy metals and organic toxicants)• Temperature• Debris and unsafe conditions• etc.
Historical concerns focused on increased flows during rains and associated flooding. However, decreased flows during dry periods are now seen to also cause receiving water problems.
WI DNR photo
3
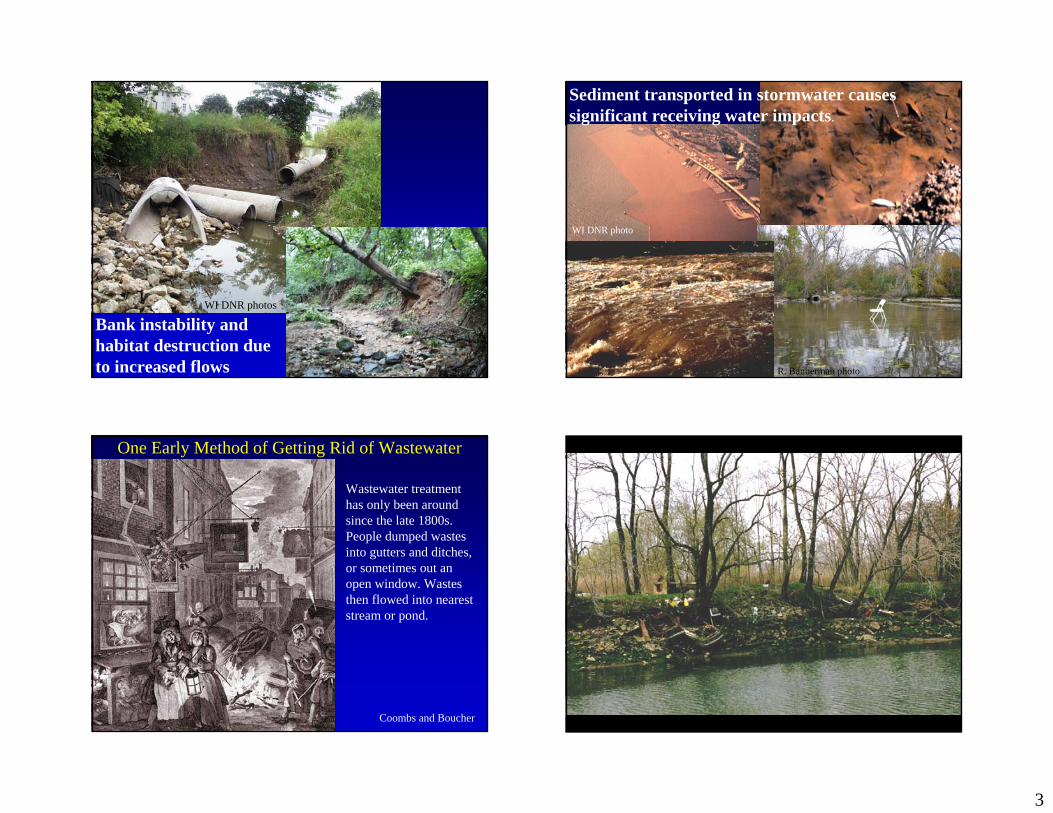
Bank instability and habitat destruction due to increased flows
WI DNR photos
Sediment transported in stormwater causes significant receiving water impacts.
WI DNR photo
R. Bannerman photo
One Early Method of Getting Rid of Wastewater
Coombs and Boucher
Wastewater treatmenthas only been aroundsince the late 1800s.People dumped wastesinto gutters and ditches,or sometimes out anopen window. Wastes then flowed into nearest stream or pond.

4
Polluted New York Harbor in 1883
Coombs andBoucher
Gross floatables most important wet weather flow pollutant in many urban areas.
Basic Wastewater Conveyance in Sanitary Condition not Always Achieved
McKinney and Schoch
5
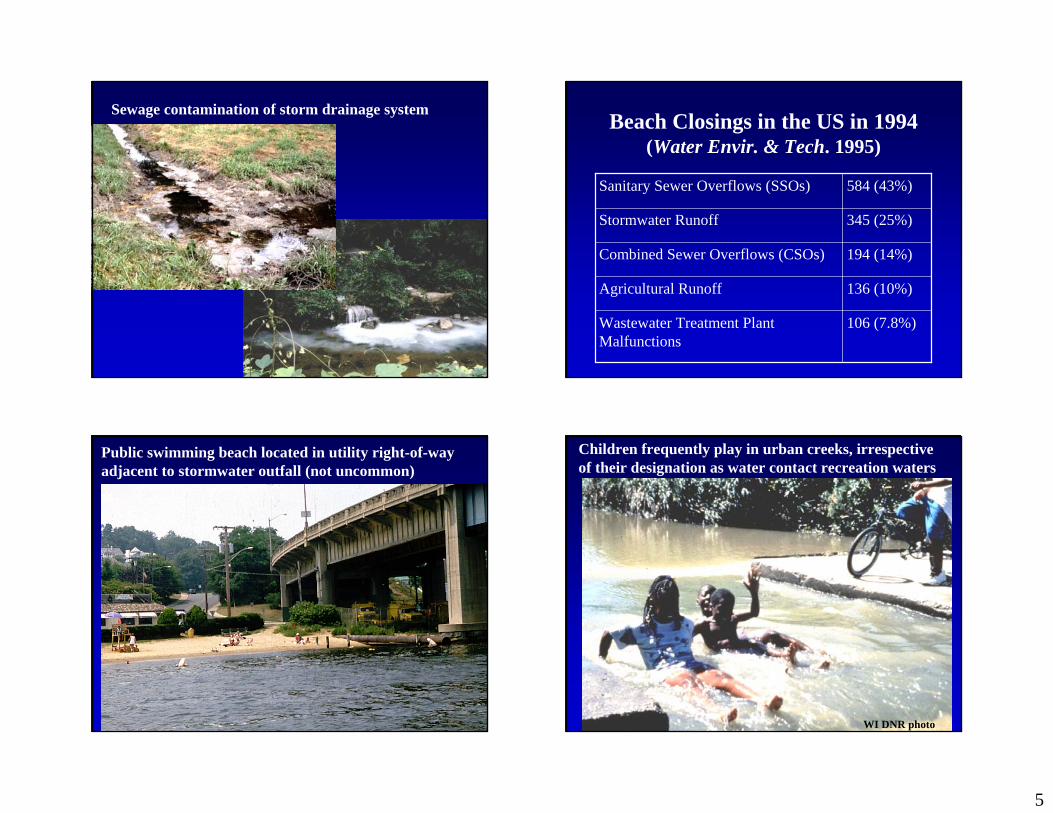
Sewage contamination of storm drainage system Beach Closings in the US in 1994(Water Envir. & Tech. 1995)
106 (7.8%)Wastewater Treatment Plant Malfunctions
136 (10%)Agricultural Runoff
194 (14%)Combined Sewer Overflows (CSOs)
345 (25%)Stormwater Runoff
584 (43%)Sanitary Sewer Overflows (SSOs)
Public swimming beach located in utility right-of-way adjacent to stormwater outfall (not uncommon)
Children frequently play in urban creeks, irrespective of their designation as water contact recreation waters
WI DNR photo
6
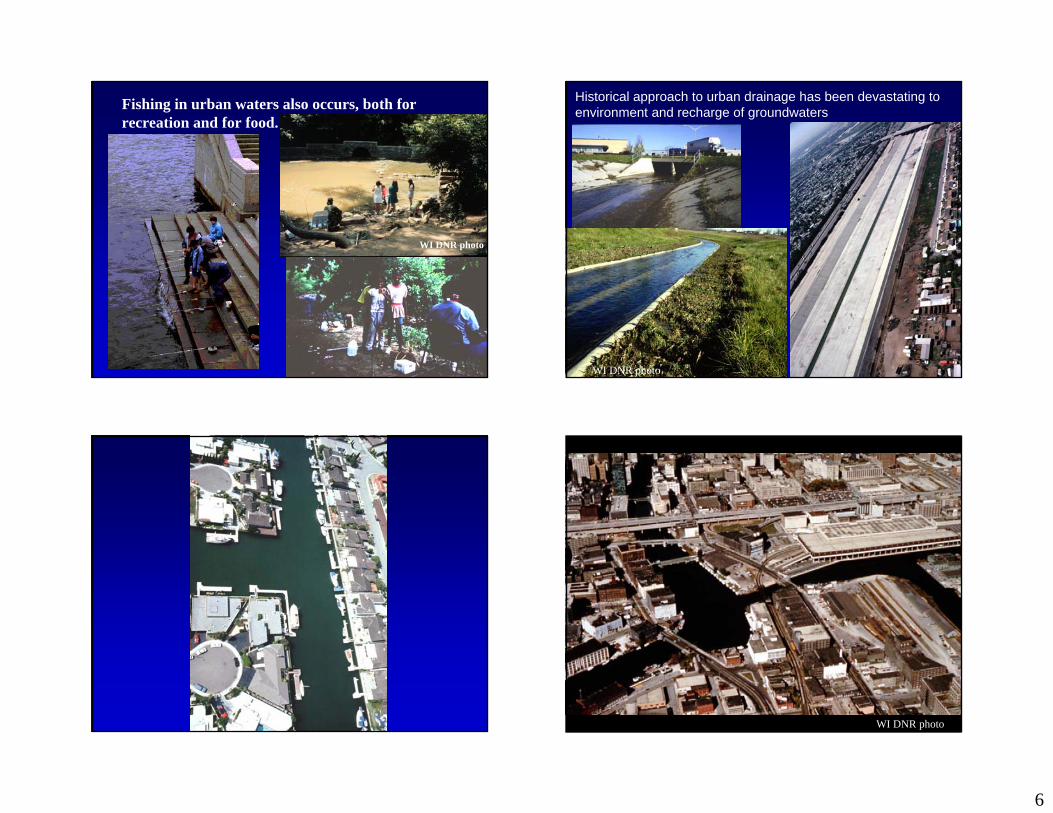
Fishing in urban waters also occurs, both for recreation and for food.
WI DNR photo
Historical approach to urban drainage has been devastating to environment and recharge of groundwaters
WI DNR photo
WI DNR photo
7
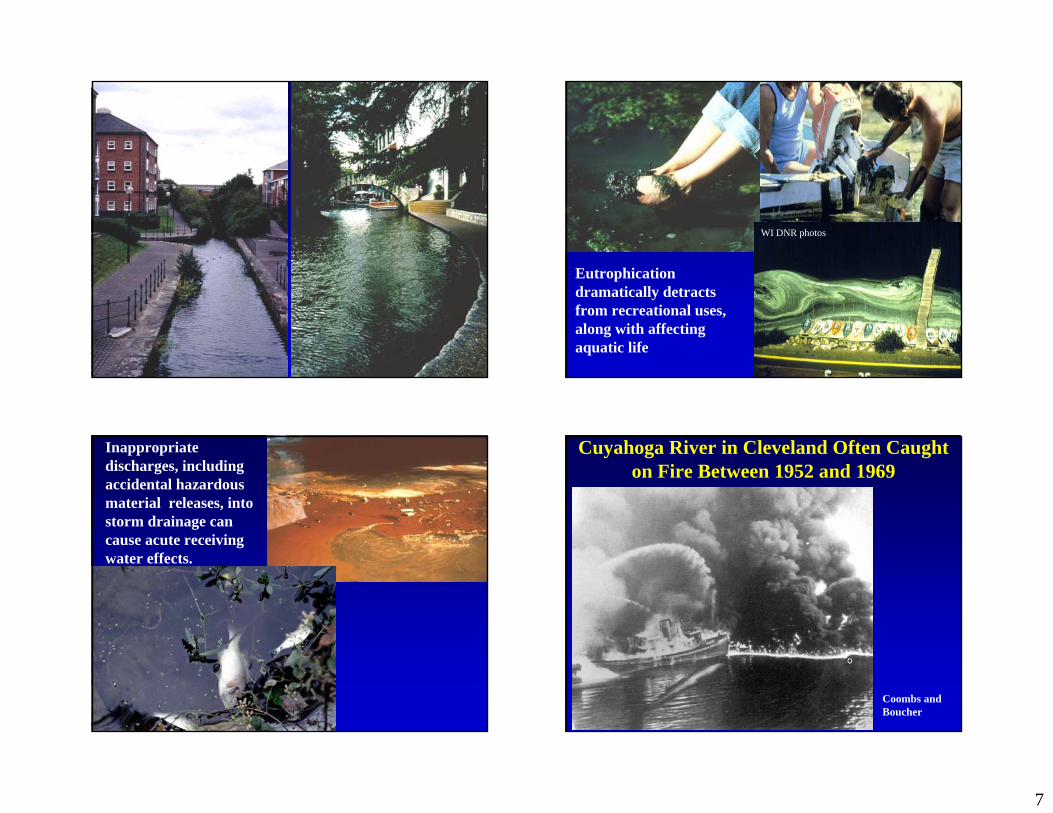
Eutrophication dramatically detracts from recreational uses, along with affecting aquatic life
WI DNR photos
Inappropriate discharges, including accidental hazardous material releases, into storm drainage can cause acute receiving water effects.
Cuyahoga River in Cleveland Often Caught on Fire Between 1952 and 1969
Coombs andBoucher

8
Whatcom Creek, Bellingham, WA, fire-fighting foam
Fire from 200,000 gallons of spilled gasoline in residential area from pipeline rupture (June 1999)
Bellingham Herald (Washington)
Birmingham News (Alabama)
Alabama has about 200 transportation accidents a year involving hazardous materials. This is typical for most states.
Groundwater ContaminationThe potential for groundwater contamination associated
with stormwater infiltration is often asked.
Book published by Ann Arbor Press/CRC, 219 pages. 1996, based on EPA research and NRC committee work.
Road cut showing direct recharge of Edwards Aquifer, Austin, TX
http://civil.eng.ua.edu/~rpitt/Publications/BooksandReports/Groundwater%20EPA%20report.pdf

9
Barton Springs, Austin, TX Example Weak-Link Model Influencing Factors
very lowvery lowmoderateLead
highintermediatehighPyrenemoderateintermediatelowAnthracene
very lowintermediatemoderateChlordane
highmobilelow/moderateNitrates
Filterable Fraction (treatability
Mobility (sandy/low organic soils)
Abundance in Stormwater
Constituent
Links Depend on Infiltration Method(contamination potential is the lowest rating of the
influencing factors)
• Surface infiltration with no pretreatment (grass swales or roof disconnections)– Mobility and abundance most critical
• Surface infiltration with sedimentation pretreatment (treatment train: percolation pond after wet detention pond)– Mobility, abundance, and treatability all
important• Subsurface injection with minimal pretreatment
(infiltration trench in parking lot or dry well)– Abundance most critical
Moderate to High Groundwater Contamination Potential
ChlorideChlorideChloride
Nickel, chromium, lead, zinc
Enteroviruses, some bacteria and protozoa
EnterovirusesEnteroviruses
1,3-dichlorobenzene, benzo (a) anthracene, bis (2-ethylhexl phthalate), fluoranthene, pentachlorophenol, phenanthrene, pyrene
Fluoranthene, pyreneBenzo (a) anthracene, bis (2-ethylhexl phthalate), fluoranthene, pentachlorophenol, phenanthrene, pyrene
Lindane, chlordaneLindane, chlordane
Injection after Minimal Pretreatment
Surface Infiltration after Sedimentation
Surface Infiltration with no Pretreatment

10
Basic Premise for Receiving Water Assessments
• No one single approach can be routinely used to accurately determine or predict ecosystem health and beneficial use impairment.
• Each assessment approach or component has associated strengths and weaknesses.
Major Components of Receiving Water Assessments• Chemical (major impairments and uses)• Biological (community tolerance)• Physical/habitat (ecological integrity)• Toxicity (availability of chemical
contaminants)
The complexity of ecosystems require thatthese assessment tools be used in an integrated manner.
Selection of Components Based on Site Specific Conditions
• At sites of extensive chemical pollution, extreme habitat destruction, or absence of desirable aquatic organisms, the impact can be clearly established with only one or two components, or simply qualitative measures.
• However, at most study sites, there will be “gray” areas where the ecosystem’s integrity is less clear and should be measured via multiple components, using a weight-of-evidence approach.
Reported State’s Bioassessment Tools• macroinvertebrate surveys (almost all programs,
but with varying identification and sampling efforts)• habitat surveys (almost all programs)• some simple water quality analyses• some watershed characterizations• few fish surveys• limited sediment quality analyses• limited stream flow analyses• hardly any toxicity testing• hardly any comprehensive water quality analyses

11
The study design must be developed based on:
• study objectives, • preliminary site-problem
assessments,• regulatory mandates, and • available resources.
The main objectives of most monitoring studies may be divided
into two general categories:
• Characterization (quantifying a few simple attributes of the parameter of interest ), and/or
• comparisons (to standards or reference conditions).
Other common objectives include identifying hot spots, examining trends, etc.
Typical Urban Receiving Water Problems and Key Parameters of
Concern• Flooding and drainage: debris and
obstructions affecting flow conveyance.• Biological integrity: habitat destruction,
high/low flows, inappropriate discharges, polluted sediment (SOD and toxicants), benthic macroinvertebrate and fish species impairment (toxicity and bioaccumulation of contaminants) and wet weather quality (toxicants, nutrients, DO).
Typical Urban Receiving Water Problems and Key Parameters of
Concern (cont.)• Non-contact recreation: odors, trash, high/low
flows, aesthetics, and public access.• Swimming and other contact recreation:
pathogens, and above listed non-contact parameters.
• Water supply: water quality standards (especially pathogens and toxicants).
• Shellfish harvesting and other consumptive fishing: pathogens, toxicants, and those listed under biological integrity.

12
Selection of Biological Endpoints for Monitoring
• The most commonly used biological groups in aquatic assessments are fish, benthic macroinvertebrates, zooplankton and algae.
• In streams and rivers, fish and benthic macroinvertebrates are often chosen as the major monitoring tools.
Macroinvertebrates • Macroinvertebrates are organisms larger
than 0.3 to 0.5 mm. They include a wide range of invertebrates, such as worms, insect larvae, snails, and bivalves.
• Excellent indicators of water quality because they are relatively sedentary and do not move between different parts of a stream or lake, as fish do. In addition, a great deal is known about their life histories and pollution sensitivity.
Other Common Biological Indicators
• Algae, zooplankton, and fish are used more in lake environments. Of these, fish are most often used.
• Fish are transient, moving between sites, therefore it is more difficult to determine their source of exposure to stressors; however, they are excellent indicators of water quality and provide a direct link to human health and wildlife consumption advisories.
Selection of Multiple Biological Endpoints
• In order to effectively and accurately evaluate ecosystem integrity, biosurveys should use two to three types of organisms which have different roles (functions) in the ecosystem.
• This same approach should be used in toxicity testing

13
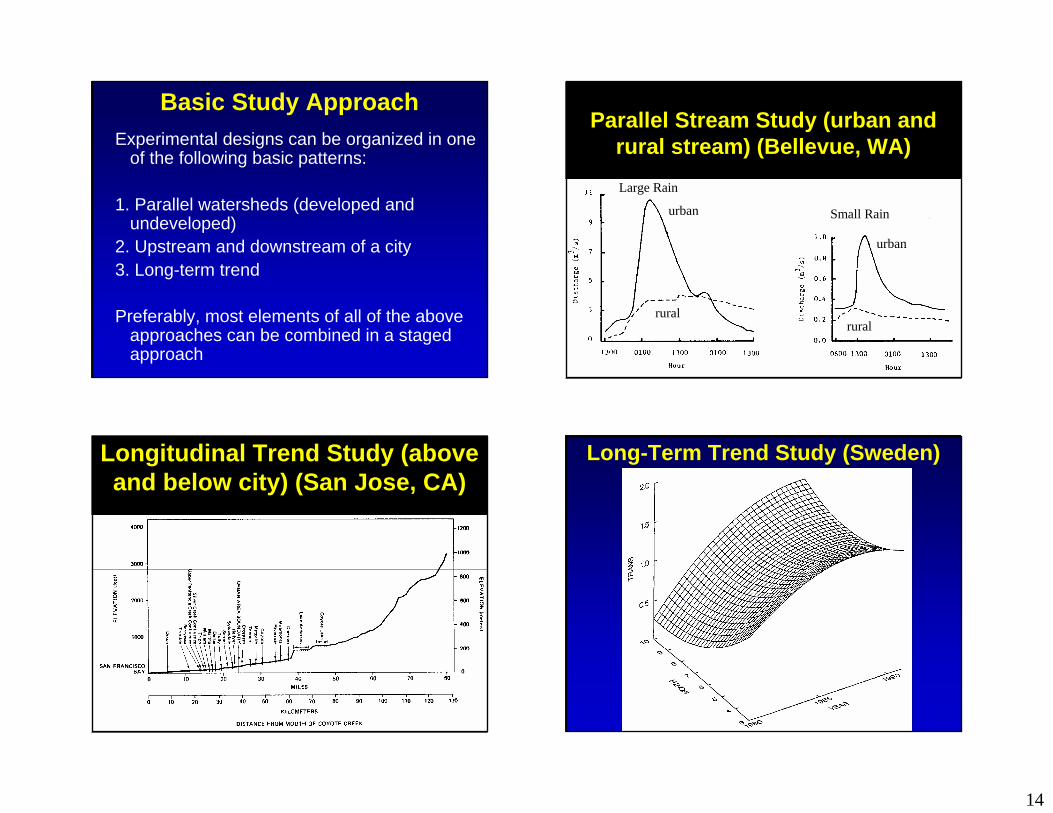
Experimental Design Issues
• Budget• Basic Study Approach• Duration• Sampling Effort• Sampling Locations• Data Analyses• Quality Control/Quality Assurance
14
Basic Study ApproachExperimental designs can be organized in one
of the following basic patterns:
1. Parallel watersheds (developed and undeveloped)
2. Upstream and downstream of a city3. Long-term trend
Preferably, most elements of all of the above approaches can be combined in a staged approach
Parallel Stream Study (urban and rural stream) (Bellevue, WA)
urban
urban
ruralrural
Large Rain
Small Rain
Longitudinal Trend Study (above and below city) (San Jose, CA)
Long-Term Trend Study (Sweden)

15
Likely Follow-up Testing
• Short-term chronic toxicity testing with additional species (lab and in situ),
• Increased testing of toxicants,• Characterizing fish, plankton, periphyton, or
mussel populations,• Measuring assimilative capacity via long
term BOD and SOD testing, and/or• Measuring productivity with light/dark bottle
BOD in situ tests.
Stormwater Discharge Characterization Monitoring
• Data needed to calculate expected mass discharges to receiving waters.
• Also needed to calibrate and validate stormwater runoff quality models.
• Much data collected over past 25 years, but not easily accessible.
• Main historical nationwide database is the NURP information (EPA 1983).
• NPDES Phase 1 stormwater permit monitoring data since early 1990s.
• Univ. of Alabama and the Center for Watershed Protection are being funded by EPA to gather and present this data.

16
WI DNR photo
WI DNR photo
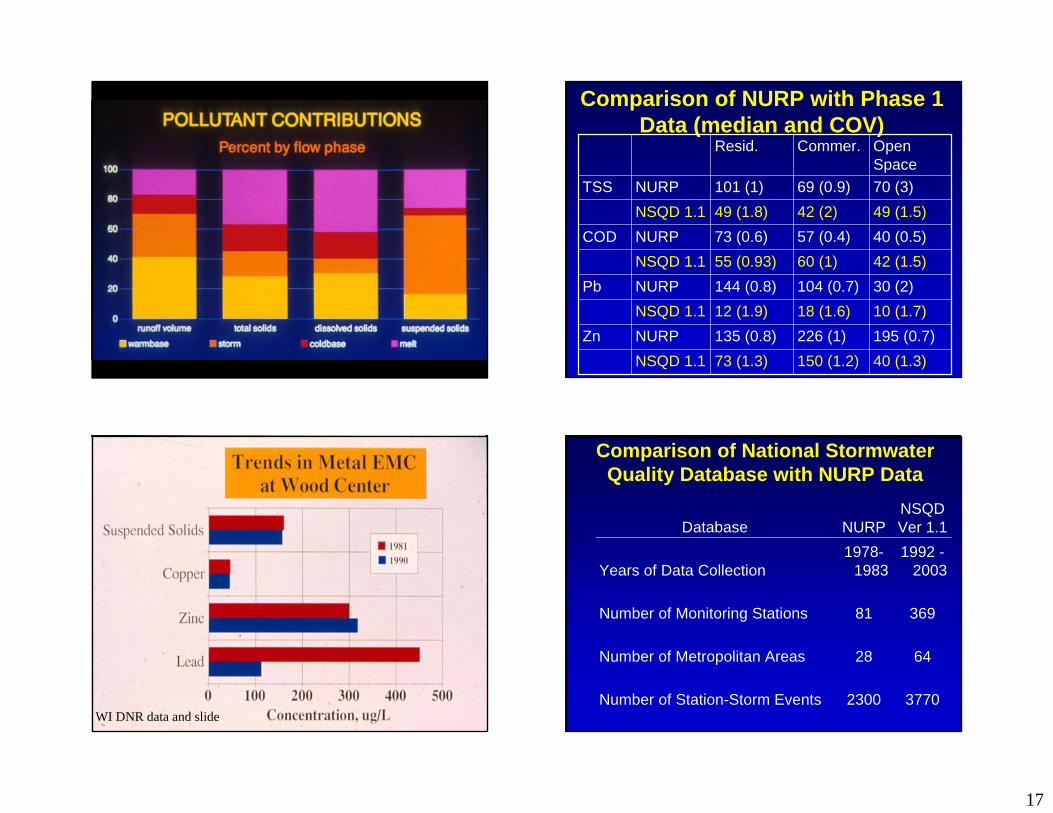
Stormwater quality can vary greatly, even at a single site. Variations between events is greater than variations within events.
WI DNR photo
17
Comparison of NURP with Phase 1 Data (median and COV)
Open Space
Commer.Resid.
40 (1.3)150 (1.2)73 (1.3)NSQD 1.1195 (0.7)226 (1)135 (0.8)NURPZn10 (1.7)18 (1.6)12 (1.9)NSQD 1.130 (2)104 (0.7)144 (0.8)NURPPb42 (1.5)60 (1)55 (0.93)NSQD 1.140 (0.5)57 (0.4)73 (0.6)NURPCOD49 (1.5)42 (2)49 (1.8)NSQD 1.170 (3)69 (0.9)101 (1)NURPTSS
WI DNR data and slide
Comparison of National Stormwater Quality Database with NURP Data
37702300Number of Station-Storm Events
6428Number of Metropolitan Areas
36981Number of Monitoring Stations
1992 -2003
1978-1983Years of Data Collection
NSQDVer 1.1NURPDatabase

18
0.25 (1.8)
2.0 (1.4)
1700 (1.9)
100 (1.1)
99 (2.5)
Freeways (185 events)
0.18 (1.0)
1.4 (0.5)
n/a50 (0.9)
17 (0.83)
Institutional (18 events)
0.26 (1.4)
1.4 (1.2)
2500 (5.6)
60 (1.2)
77 (1.5)
Industrial (524 events)
0.22 (1.2)
1.6 (0.9)
4500 (2.8)
63 (1.0)
43 (2.0)
Commercial (497 events)
0.25 (3.6)
0.6 (1.0)
3100 (2.9)
21 (1.8)
51 (1.9)
Open Space(68 events)
0.30 (1.1)
1.42 (1.3)
7750 (5.1)
55 (1.1)
48 (1.8)
Residential (1069 events)
0.27 (1.5)
1.4 (1.4)
5080 (4.6)
53 (1.2)
58 (1.8)
All data combined (3,770 events)
P (mg/L)
TKN (mg/L)
Fecal colif. (#/100mL)
COD (mg/L)
SS (mg/L)
Median (COV)
Zone 1
Zone 2
Zone 3
Zone 4
Zone 9
Zone 5Zone 6
Zone 7Zone 8
Communities Included in Database (EPA Rain Zones)
These grouped box-whisker plots sort all of the data by land use. Kruskal-Wallis analyses indicate that all constituents have at least one significantly different category from the others. Heavy metal differences are most obvious.
Residential area concentrations grouped by EPA rain zones. Zones 1-4 are eastern half of country, zones 5-9 are western half of country. Zones 3 and 7 are the wettest zones.

19
Plots of expected relationships are being used to identify data redundancies that can reduce future analytical costs.
Plots of concentrations vs. rain depth typically show random patterns.
Mean Suspended Solids Concentrations (mg/L) for Different Rain Zones and Land Uses
No samples
No samples151
(26)183 (104)
No samples
No samples
No samples47
(3)No samplesFree-
ways
502 (9)
No samples183
(24)296 (19)
245 (43)
206 (62)
124 (41)
78 (212)
50 (13)
Indus-trial
188 (9)
No samples84
(40)177 (11)
44 (22)
317 (54)
61 (24)
80 (287)
37 (3)
Com-mercial
232 (7)
97 (7)
62 (51)
126 (25)
104 (87)
229 (89)
149 (55)
76 (631)
132 (25)
Resid-ential
No samples
No samples
No samples
No samples
No samples225
(13)No samples160
(28)34 (1)
Open Space
9 (N central)
8 (N mtns)
7 (coastal NW)
6 (SW)
5 (Texas)
4 (S central)
3 (SE)
2 (mid Atlantic)
1 (NE and mid west)
Seasonal data are well distributed at each site, and did not statistically influence TSS
In-Stream and Laboratory Biological and Toxicity
Assessments needed to Identify and Quantify Actual Receiving
Water Problems

20
Contaminated sediments in urban receiving waters likely much more responsible for biological impacts than contaminated water.
Fish surveys in urban streams typically find similar biomass as in control streams, but sensitive native fish displaced by hardy exotics
WI DNR photo
Benthic macroinvertebrate populations on natural and artificial substrates have been extensively used to indicate receiving water effects.
EXCELLENT
GOOD
FAIR
POOR
0
10
20
30
40
50
60
70
80
90
100
0 10 20 30 40 50 60 70 80 90 100Watershed Urbanization (%TIA)
0
5
10
15
20
25
30
35
40
45
Ben
thic
Inde
x of
Bio
tic In
tegr
ity
(B-I
BI)
Riparian IntegrityBiotic Integrity
C. May 1996
Toxicity tests using stormwater find much of the toxicity associated with small particulates, not just filtered portions of the water.

21
Interstitial water in urban sediments highly contaminated and directly affected by contaminated sediment
WI DNR and USGS tests
Side-stream bioassay tests show chronic toxicity after about 1 to 2 weeks of exposure to urban stream water, and no 96-hr toxicity
Side-stream bioassay tests demonstrated the benefits of stormwater controls for the removal of fine particulates. Residual toxicity remains, however.
WI DNR and USGS tests
Conclusions• We can learn from the past several
decades of receiving water investigations• Problems are site specific and require
sequential investigations• Must use combination of study
components, including:- habitat evaluations, - rain and flow monitoring, - chemical, and biological monitoring, and- toxicity investigations
22
Conclusions (continued)• Must evaluate both sediment and water
in most cases• All flow phases (dry and wet weather)
and seasons (including snowmelt) may be important
• May require extensive and long-term effort to obtain data with small uncertainty
• Need to balance resources with study objectives