storage tanks impact on water quality and assessing performance presentation 3 april 2015
TRANSCRIPT

Storage TanksImpact on Water Quality and
Assessing Performance
Presentation 3April 2015

Overview Tank functions & designs Tank operating parameters impacting
water quality (chlorine residual) Sampling at tanks and in their vicinity Tank case histories Assessing Performance Approaches to improve water quality Case study Summary

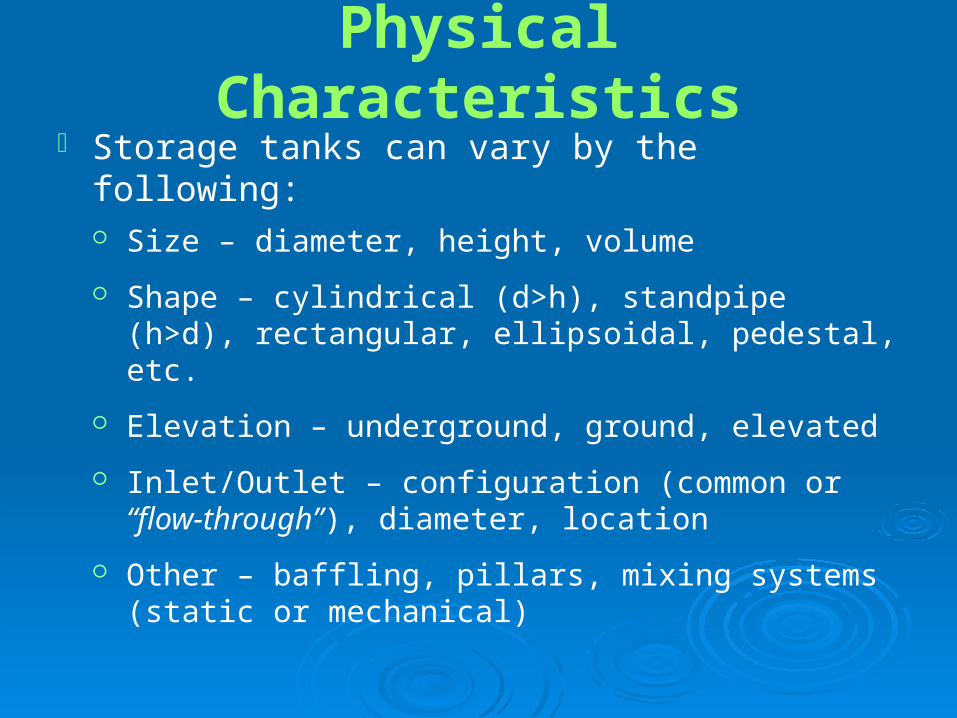
Physical Characteristics Storage tanks can vary by the following:
Size – diameter, height, volume
Shape – cylindrical (d>h), standpipe (h>d), rectangular, ellipsoidal, pedestal, etc.
Elevation – underground, ground, elevated
Inlet/Outlet – configuration (common or “flow-through”), diameter, location
Other – baffling, pillars, mixing systems (static or mechanical)
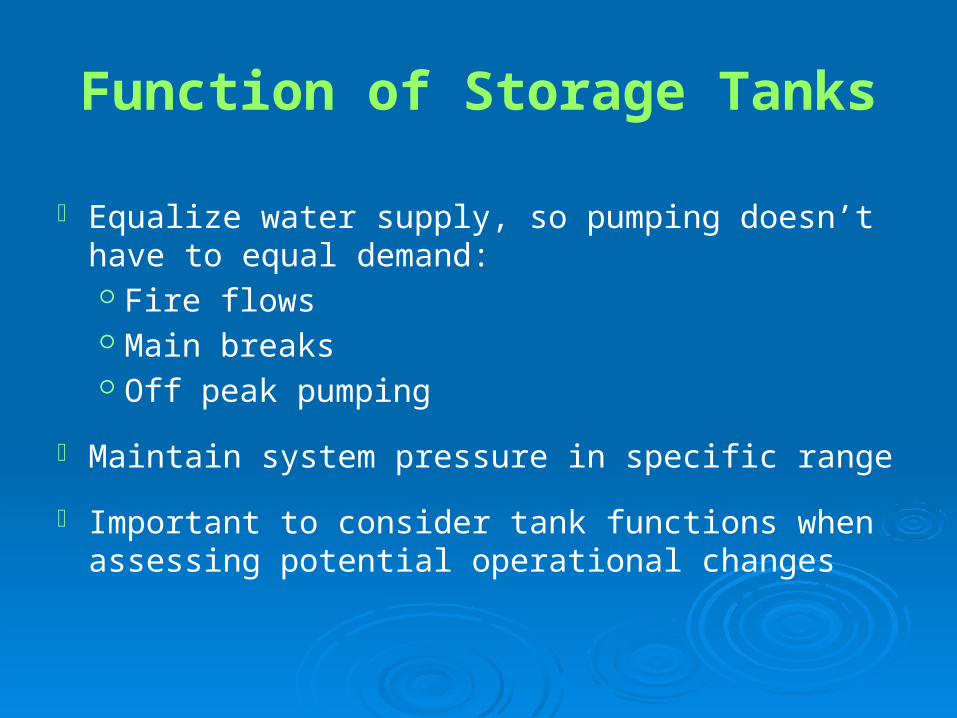
Function of Storage Tanks
Equalize water supply, so pumping doesn’t have to equal demand: Fire flows Main breaks Off peak pumping
Maintain system pressure in specific range
Important to consider tank functions when assessing potential operational changes

Ground Tank
VentHatch(Closed)
Overflow
Inlet/Outlet
Courtesy of Jeff Swertfeger
Greater Cincinnati Water Works

Underground Tank
Vent/OverflowHatch
(Closed)
Inlet
Outlet
Courtesy of Jeff Swertfeger
Greater Cincinnati Water Works

Elevated Tank
Vent
Overflow
Access Hatch
Inlet/Outlet
Monitor
OperatingRange
Courtesy of Jeff Swertfeger
Greater Cincinnati Water Works

Factors Affecting Chlorine Residual in Tanks
Water age (tank turnover)
Tank Mixing
Fill period chlorine residual (chlorine in)
Chlorine demand in the tank Bulk water Tank surface Sediment
Temperature Higher temp = lower residual

Water Age in Tanks
Water age determined by average tank volume and volume
added per day.
Water age will be the same throughout a tank only if it is
well mixed.
Stagnant zones:
Stratification
Poor mixing
Short draw/fill cycle
Operating Range?
Courtesy of Jeff Swertfeger
Greater Cincinnati Water Works

Tank Mixing
VentHatch(Closed)
Overflow
Courtesy of Jeff Swertfeger
Greater Cincinnati Water Works

Short Circuiting
VentHatch(Closed)
Overflow
InletOutlet
Courtesy of Jeff Swertfeger
Greater Cincinnati Water Works

Inlet/Outlet
Monitor
Last in / First Out
Courtesy of Jeff Swertfeger
Greater Cincinnati Water Works

Tank Sampling
VentHatch(Closed)
Overflow
Inlet
Outlet
Courtesy of Jeff Swertfeger
Greater Cincinnati Water Works
Some “Problem Tanks” We Have Met
Selected Case Histories
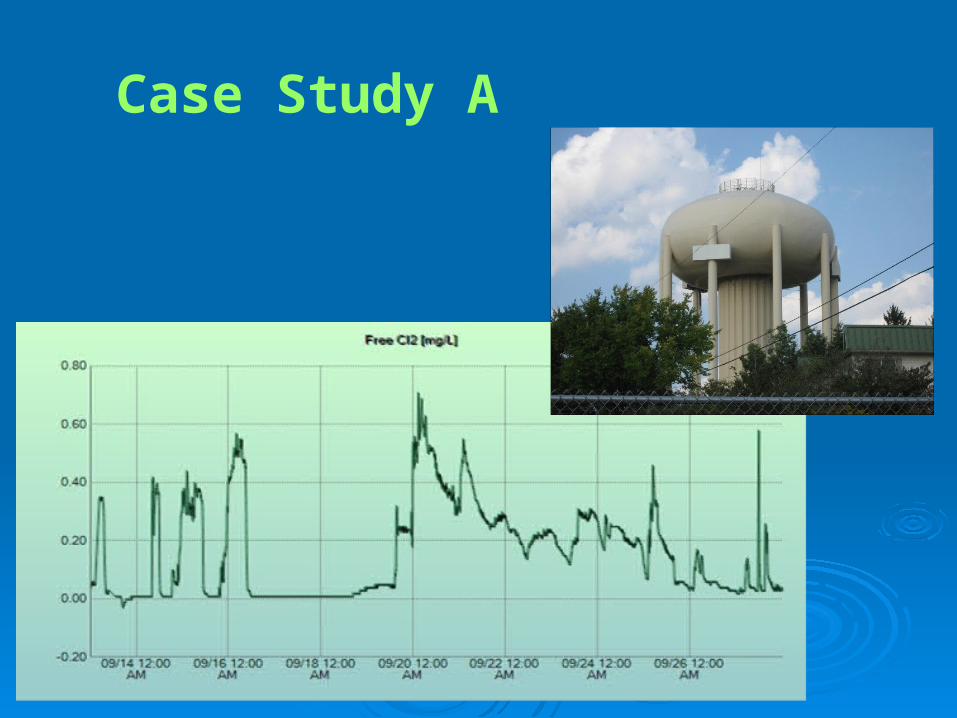
Case Study A

Case Study B
30
32
34
36
38
5/13/2008 12:00 PM 5/13/2008 6:00 PM 5/14/2008 12:00 AM 5/14/2008 6:00 AM 5/14/2008 12:00 PM 5/14/2008 6:00 PM
Date & Time
Ap
pro
xim
ate
Tan
k L
evel
(ft
)
0.00
0.30
0.60
0.90
1.20
Ch
lori
ne
Res
idu
al (
mg
/L)
Tank Level Cl Residual

Case Study B
30
32
34
36
38
40
5/13/2008 12:00 PM 5/13/2008 6:00 PM 5/14/2008 12:00 AM 5/14/2008 6:00 AM 5/14/2008 12:00 PM 5/14/2008 6:00 PM
Date & Time
Ap
pro
xim
ate
Tan
k L
evel
(ft
)
0
30
60
90
120
DB
P C
on
cen
trat
ion
(p
pb
)
Tank Level TTHM HAA5 THM Plus

Case Study C
Bayer Tank9/23/2008 - 9/27/2008
0
0.1
0.2
0.3
0.4
0.5
0.6
0.7
0.8
9/23
/200
8 0:
00
9/24
/200
8 0:
00
9/25
/200
8 0:
00
9/26
/200
8 0:
00
9/27
/200
8 0:
00
Date
Fre
e C
hlo
rin
e
50
51
52
53
54
55
56
57
58
59
60
Pre
ssu
re
Free Cl2 mg/L
Free Cl2 Grab mg/L
Pressure psi
Cl Probe Calibration

Case Study C
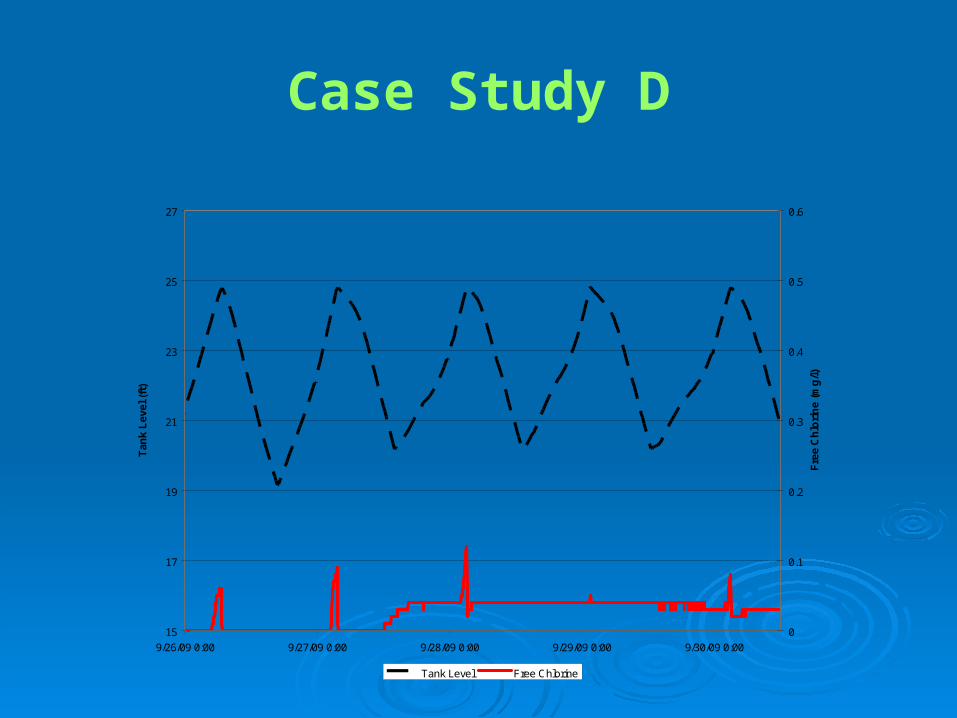
Case Study D
15
17
19
21
23
25
27
9/26/09 0:00 9/27/09 0:00 9/28/09 0:00 9/29/09 0:00 9/30/09 0:00
Tan
k L
evel
(ft
)
0
0.1
0.2
0.3
0.4
0.5
0.6
Fre
e C
hlo
rin
e (m
g/l)
Tank Level Free Chlorine

Case Study D

Case Study E

Case Study E
Case Study E

0
0.1
0.2
0.3
0.4
0.5
0.6
0.7
0.8
0.9
1
1.1
1.2
1.3
1.4
4/1/2009 4/11/2009 4/21/2009 5/1/2009 5/11/2009 5/21/2009 5/31/2009 6/10/2009 6/20/2009 6/30/2009
40
45
50
55
60
65
70
75
80
85
90Chlorine Temperature
Case Study F

Case Study F

Assessing Storage Tank Performance
Objective: To develop an accurate “picture” of storage tank performance related to water quality
Water Quality Data
Operational Data
Physical
Character-
istics

Tank Parameters Impacting Water Quality
Water quality in storage tanks is significantly influenced by both:
Turnover Time (Water Age) – Average length of time that water
resides in a tank.
Optimization Guideline: Turnover time should be less than
3-5 days.
Each tank should be evaluated individually and given its own
goal.
Tank Mixing – A function of the momentum of the inlet flow
during a fill cycle.
Tank level (or pressure) data and physical characteristics are
needed to calculate these parameters.
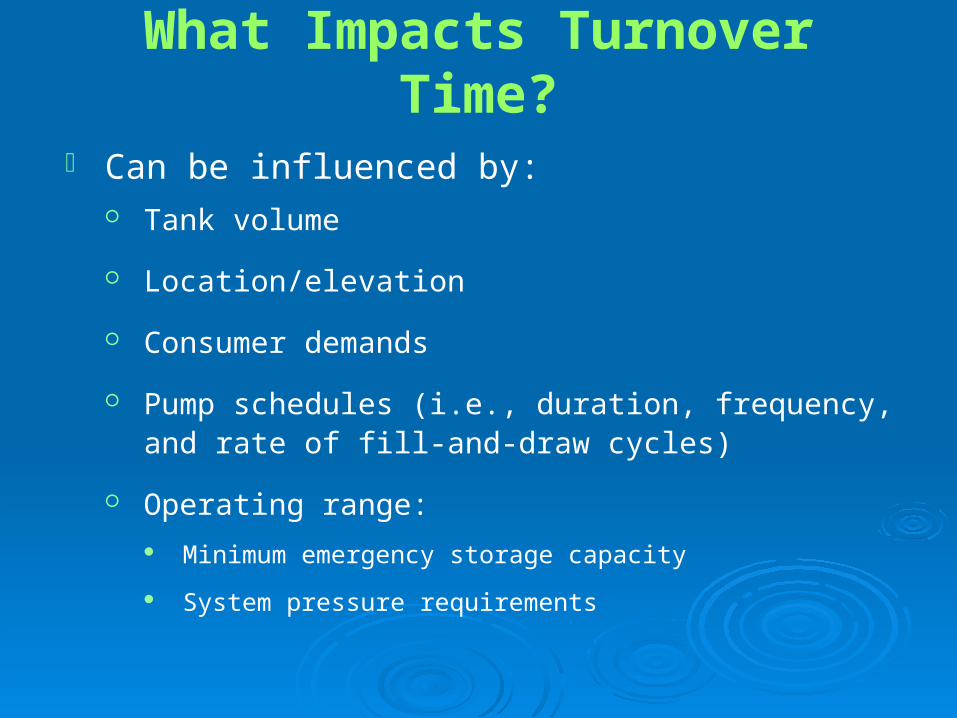
What Impacts Turnover Time?
Can be influenced by: Tank volume
Location/elevation
Consumer demands
Pump schedules (i.e., duration, frequency, and rate of fill-and-draw cycles)
Operating range:
Minimum emergency storage capacity
System pressure requirements

Storage Tanks in Series
WTP
2.0 Days 3.0 Days 4.0 Days
3.5 Days
4.5 Days
3.5 Days
2.0 + 4.5 + 3.0 + 3.5 + 3.5 + 4.0 = 20.5 Days!

What Impacts Mixing? Can be influenced by:
Tank shape
Temperature differentials: Inflow > Ambient = Turnover
Inflow < Ambient = Stratification
Momentum of inlet flow (function of flow rate and diameter
of inlet/outlet)
Inlet/Outlet – configuration (common or
“flow through”), diameter, and location
Fill cycle duration
Engineering controls – baffling, static, or mechanical mixers
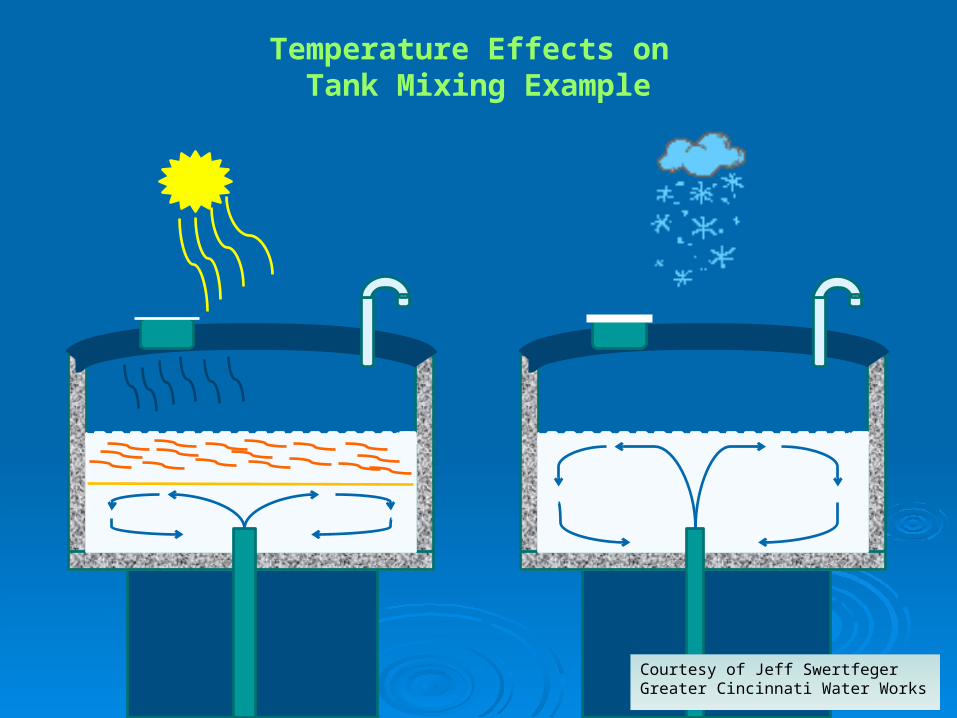
Temperature Effects on Tank Mixing Example
Courtesy of Jeff SwertfegerGreater Cincinnati Water Works
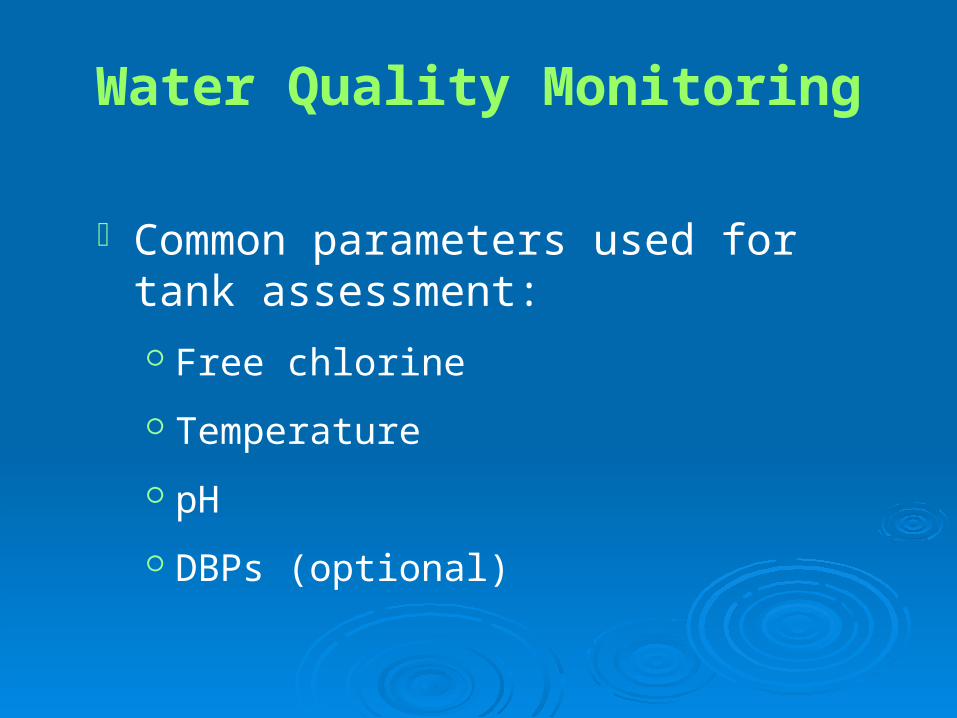
Water Quality Monitoring
Common parameters used for tank assessment:
Free chlorine
Temperature
pH
DBPs (optional)
Water Quality Monitoring
Grab Sampling (In-Tank or DS): Quick and easy assessment of water quality
Must consider whether tank is filling/draining
May not capture variability of data
Less expensive, but requires more time and labor
Online Monitoring: Convenient and continuous assessment of water quality
Continuous readings capture variability of water quality throughout tank cycle
More expensive, but requires less time and labor

Online vs. Grab Sampling
30
32
34
36
38
5/13/2008 12:00 PM 5/13/2008 6:00 PM 5/14/2008 12:00 AM 5/14/2008 6:00 AM 5/14/2008 12:00 PM 5/14/2008 6:00 PM
Date & Time
Ap
pro
xim
ate
Tan
k L
evel
(ft
)
0.00
0.30
0.60
0.90
1.20
Ch
lori
ne
Res
idu
al (
mg
/L)
Tank Level Cl Residual

Summary
Understanding how tanks operate is a critical aspect of assessing their performance. Both adequate turnover and mixing are necessary.
Storage tanks are unique, and their performance should be assessed individually.
Consider secondary impacts and understand the extent of a problem when making operational changes.
Water quality data is the best indicator of tank performance.