stopping a roller coaster train. - göteborgs...
TRANSCRIPT
Stopping a Roller Coaster Train.
Ann-Marie Pendrill1,2 and Magnus Karlsteen3 and Henrik
Rodjegard4
1) Department of Physics, University of Gothenburg, SE 412 96 Goteborg, Sweden2) National Resource Centre for Physics Education, Lund University, Box 118, SE221 00 LUND, Sweden3) Department of Applied Physics, Chalmers University of Technology, SE 412 96Goteborg, Sweden4) Rodjegard Technology, Norrgardsvagen 2, SE 820 64, Nasviken, Sweden
E-mail: [email protected]
Abstract. A roller coaster ride comes to an end. Magnets on the train induce eddycurrents in the braking fins, giving a smooth rise in braking force as the remainingkinetic energy is absorbed by the brakes and converted to thermal energy. In this pa-per an IR camera was used to monitor the temperature of the first braking fin, before,during and after the passage of a train. In addition, the resulting acceleration of thetrain was modelled and compared to accelerometer data for the Kanonen roller coasterin Liseberg. The results are used to model the distribution of temperature increaseover the braking fins. Finally, the cooling of the fins after the passage of the train isanalysed and compared to the IR data.
This is an author-created, un-copyedited version of an article published in PhysicsEducation 47 728 (2012). IOP Publishing Ltd is not responsible for any errors oromissions in this version of the manuscript or any version derived from it. The Versionof Record is available online at doi:10.1088/0031-9120/47/6/728. Online supplemen-tary data available from http://iopscience.iop.org/0031-9120/47/6/728/media
1. Introduction
Roller coasters are classical examples of energy conversion, with an interplay of kinetic
and potential energy as the train moves around the curves, loops, hills and valleys of
the track. At the end of the ride, the train must be slowed down and brought to a stop
in the station. In modern roller coasters, permanent magnets on the train (or track)
induce eddy currents in braking fins as the train moves past the brakes [1]. The faster
the train, the stronger the currents induced, and the stronger the braking force. The
onset of the braking is smooth; as the train enters the brakes, more and more braking
fins are activated. This is in strong contrast to the sudden action of older roller coaster
brakes.
The kinetic energy of the roller coaster train is converted to thermal energy in the
braking system. A large fraction of the energy is absorbed by the braking fins - sheets
Stopping a Roller Coaster Train. 2
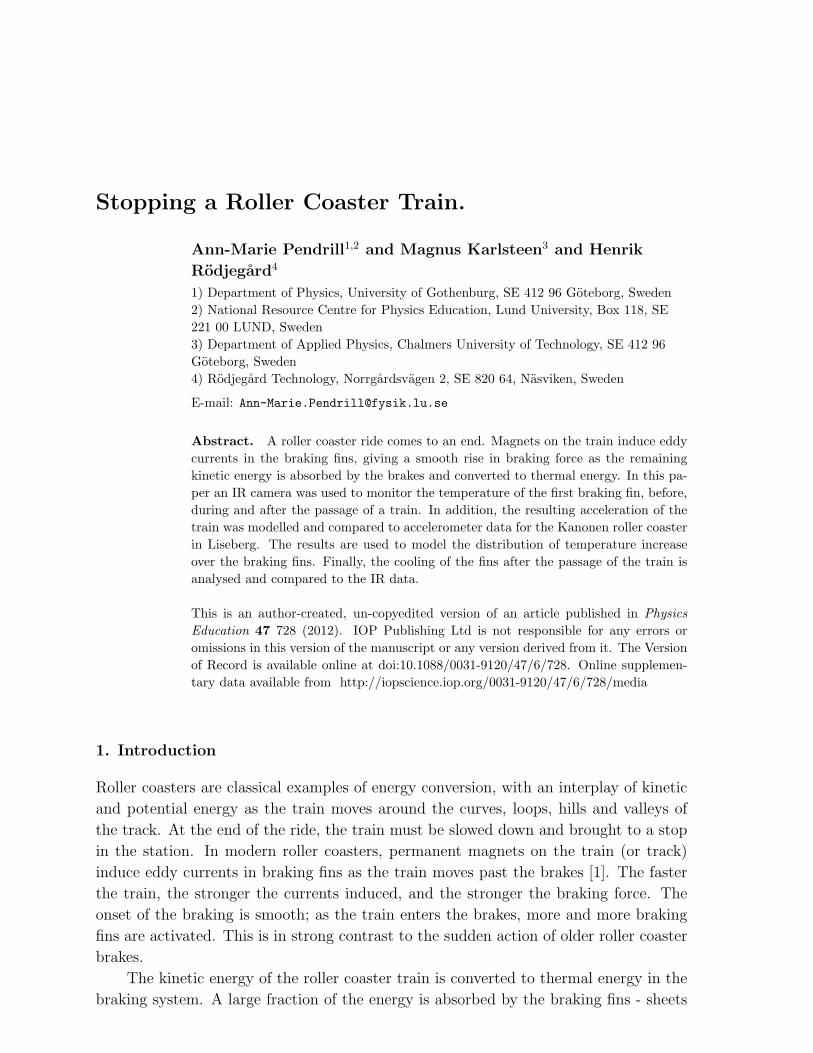
Figure 1. IR image of the first braking fin after a train has passed. The two pointsmarked are used for extracting the time-dependence of the temperature.
of brass along the brake run - leading to a temperature increase. We have used an IR
camera to study this temperature increase in the first brake fin of the Kanonen roller
coaster at the Liseberg amusement park in Goteborg, Sweden [2, 3], as discussed in
section 2. The subsequent cooling is discussed in section 5.
Since the speed of the train is reduced by the brakes, stronger eddy currents are
produced in the earlier brake fins and more energy is absorbed than in the later brake
fins. To find how the temperature increase varies over the length of the brakes, we have
modelled the stopping of a train entering the brake run (section 3 and Appendix A).
The results from the model were then compared to authentic accelerometer data in the
Kanonen roller coaster (section 4). The comparison also gave suitable numeric data
for the pre-braking speed and the braking force. The resulting time dependence of the
acceleration (i.e. the slowing down) of the train, as well as speed and distance from the
model were then used to model the energy distribution over the brake run (section 4.1
and Appendix B).
2. Heating of the braking fins
The kinetic energy of the train before the brakes, Ek = mv20/2, is converted into thermal
energy. What temperature increase would result if we assume that all the energy is
absorbed by the brass plates in the braking fins? To estimate this increase we need to
know the masses involved. The mass of the train in Kanonen train is around 7000 kg.
The initial speed of the train is estimated to v0 ≈ 12 m/s, based on the matching to the
accelerometer data discussed in section 4, and consistent with data from the technical
drawing, and from on-site timing of the passage of the train. The brakes consisted of
9 pairs of braking fins, each with a length L = 0.825m, and h = 0.200m high and
b = 6mm thick. The last pair was only 0.600m long. (Additional brake fins have been
Stopping a Roller Coaster Train. 3
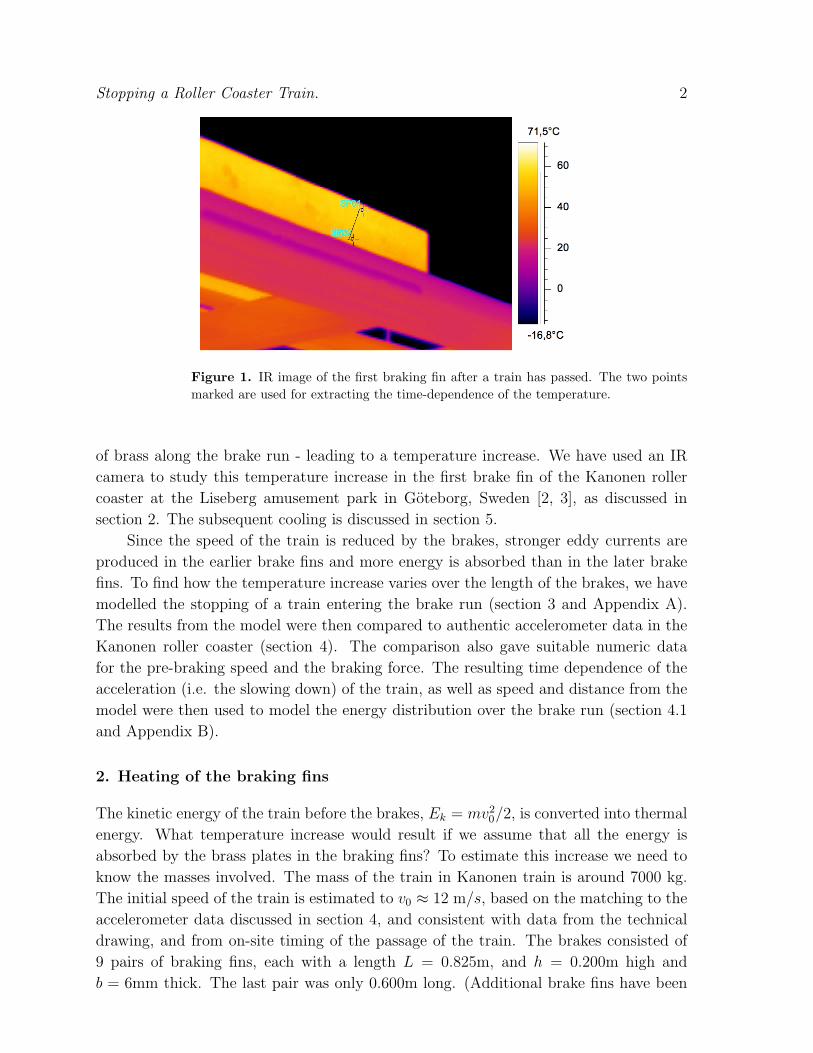
Figure 2. Time dependence of the temperature (in oC) of the brakes in Kanonenbefore and after two train passages. The dips in temperature are caused by the coldertrain obscuring the brakes during the passage itself. The blue (upper) and red (lower)graphs correspond, respectively, to the upper and lower points marked in figure 1 .
added after the measurements.) The brass used in the fins is CuZn10, except for the last
ones, were CuZn5 was used, i.e. consisting mainly of copper, but containing, respectively
10% and 5% zinc. The presence of zinc leads to a small reduction of the density, to
ρ = 8.74 × 10³kg/m3 compared to the value 8.96 × 10³kg/m3 for copper. The specific
heat C = 385 J/kgK remains essentially unchanged. The zinc admixture leads to a
significant reduction of the electric conductivity [4]; the lower zinc content in the last
few brake fins thus leads to an increase in their braking power.
A temperature increase of Ek/CρV = Ek/Cρ(18Lhb) ≈ 8.4K could be expected if
all the kinetic energy were absorbed by the brake fins and evenly distributed. However,
the train passes the first brake fins with larger speed than the following ones, so we
expect more energy deposited there. To analyse the temperature increase distribution,
we need to know in more detail how the train slows down, as discussed in the next
section.
Figure 2 shows the time dependence of temperature in two points of the first brake
fin before and after two train passages, indicating an increase of 9-13 K when a train
passes. During the passage, the train obscures the brake, giving a dip in the temperature
reading. In addition, there is a very brief reading of higher temperature. We interpret
this as a skin effect, where currents and heating have not yet penetrated through the
whole thickness of the sheet. We can also see from the IR movie [5] that the initial
heating is concentrated at the center of the surface.

Stopping a Roller Coaster Train. 4
Figure 3. Acceleration vs time for a train entering a horizontal brake run with initialspeed v0 = 12 m/s (green) or 10 m/s (red and blue) and with the values k = 0.15 /(ms)(red and green) and k = 0.18 /(ms) (blue curve).
3. Modelling the deceleration of the train
In the discussion below, we assume that the magnets are placed on the train and the
braking fins placed on the track, as in the Kanonen roller coaster. The opposite
arrangement is possible and used in other roller coasters, as discussed in Ref.[1].
However, the mathematics or physics does not depend on the choice of technology.
The magnetic brake run is a straight line so the motion in this part of the ride is purely
one-dimensional.
To model the acceleration of the train first note that the induced electric field is
proportional to the time derivative of the magnetic field, in turn proportional to the
speed, v, of the magnet. The induced eddy current in a conductor is proportional to
the resulting electric field, in turn leading to an induced magnetic field proportional to
the speed. The current is also proportional to the conductivity, σ, of the material in
the braking fin. Collecting these factors we can express the force from a conductor on
a moving magnet as F ∝ σB2v [6]. In the case of a linear magnetic brake, the force is
also proportional to the length where magnets are adjacent to the braking fins, which
corresponds to the distance, s, the train has traveled into the brake run. Since a = F/m
we can write
a = −kvs (1)
The minus sign indicates that the acceleration is opposite to the direction of motion,
causing the train to slow down. The properties of the magnets, the material and
dimensions of the braking fins, as well as the distance between them, enter in the
constant, k. This constant also depends on the mass of the train; a fully loaded train
Stopping a Roller Coaster Train. 5
will come to a stop more slowly than an empty train. (For very rapidly changing
magnetic fields, the eddy currents do not penetrate the whole conductor. The thickness
of 6 mm of the braking swords is the skin thickness corresponding to a frequency of
about 100 Hz for the variation of the magnetic field. The magnets on the Kanonen
train are mounted in 0.5m yokes, each containing 6 magnets, giving frequencies of this
order of magnitude for the change in magnetic field. We do not consider skin effects in
our analysis.)
As a first approximation, we assume that there brakes and train are ”infinitely
long”, or rather, sufficiently long for the train to come to a stop before the front of the
train has moved past the end of the brakes, and before the tail of the train has reached
the start of the brake run. Figure 3 shows how the acceleration varies with time for
this approximation for a few values of the constant k and the initial speed, v0. The
different graphs in Figure 3 can, in fact, be joined into a single graph by introducing
dimensionless variables, as discussed in more detail in Appendix A, which also gives an
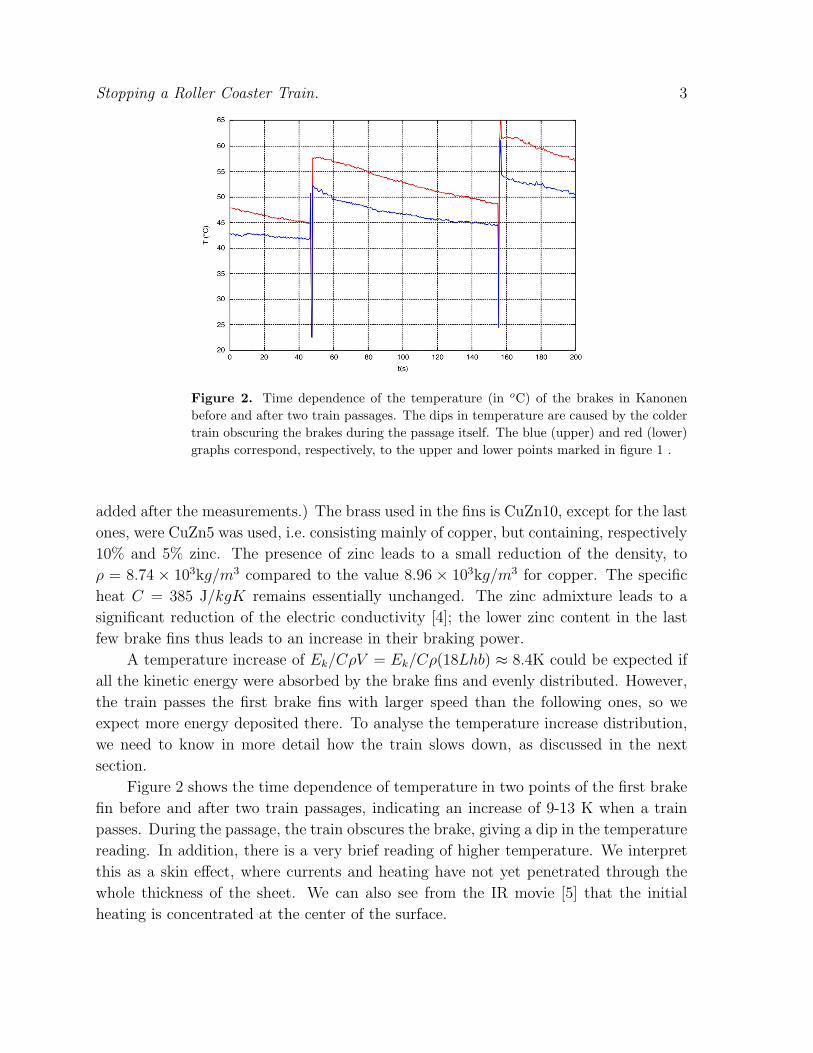
analytical solution for the case of a long train on a horizontal track. Figure 4 shows
how acceleration and speed varies with distance, all expressed in the corresponding
dimensionless variables.
It is interesting to note that, although the braking power is reduced with decreased
speed, which never reaches zero, the train only moves a finite length. Design concerns
may include how the acceleration varies with distance travelled and not least how the
stopping distance depends on the initial speed, on the number of passengers in the train
and possibly on other variables.
Figure 4. Acceleration and speed vs distance as the train enters the brake runfor a horizontal track. The graph uses the dimensionless variables, presented in theappendix, i.e. y = s
√2k/v0, y′ = v/v0 and y′′ = a/
√kv3
0 .
Stopping a Roller Coaster Train. 6
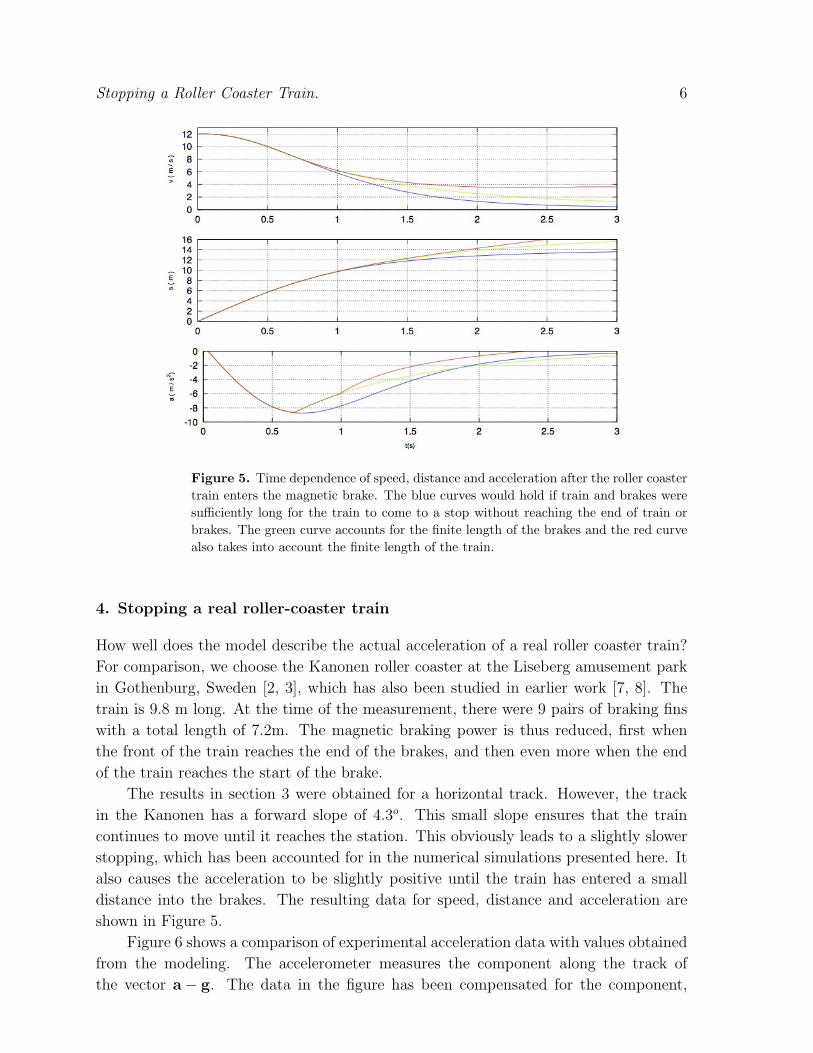
Figure 5. Time dependence of speed, distance and acceleration after the roller coastertrain enters the magnetic brake. The blue curves would hold if train and brakes weresufficiently long for the train to come to a stop without reaching the end of train orbrakes. The green curve accounts for the finite length of the brakes and the red curvealso takes into account the finite length of the train.
4. Stopping a real roller-coaster train
How well does the model describe the actual acceleration of a real roller coaster train?
For comparison, we choose the Kanonen roller coaster at the Liseberg amusement park
in Gothenburg, Sweden [2, 3], which has also been studied in earlier work [7, 8]. The
train is 9.8 m long. At the time of the measurement, there were 9 pairs of braking fins
with a total length of 7.2m. The magnetic braking power is thus reduced, first when
the front of the train reaches the end of the brakes, and then even more when the end
of the train reaches the start of the brake.
The results in section 3 were obtained for a horizontal track. However, the track
in the Kanonen has a forward slope of 4.3o. This small slope ensures that the train
continues to move until it reaches the station. This obviously leads to a slightly slower
stopping, which has been accounted for in the numerical simulations presented here. It
also causes the acceleration to be slightly positive until the train has entered a small
distance into the brakes. The resulting data for speed, distance and acceleration are
shown in Figure 5.
Figure 6 shows a comparison of experimental acceleration data with values obtained
from the modeling. The accelerometer measures the component along the track of
the vector a− g. The data in the figure has been compensated for the component,
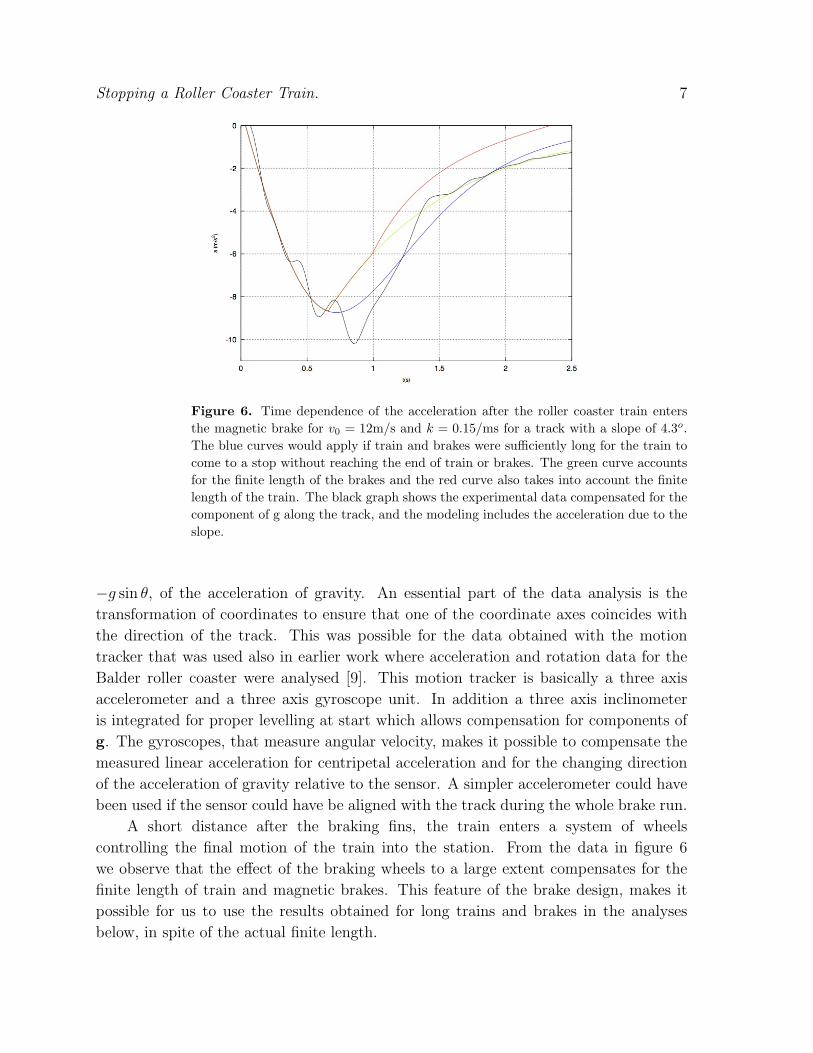
Stopping a Roller Coaster Train. 7
Figure 6. Time dependence of the acceleration after the roller coaster train entersthe magnetic brake for v0 = 12m/s and k = 0.15/ms for a track with a slope of 4.3o.The blue curves would apply if train and brakes were sufficiently long for the train tocome to a stop without reaching the end of train or brakes. The green curve accountsfor the finite length of the brakes and the red curve also takes into account the finitelength of the train. The black graph shows the experimental data compensated for thecomponent of g along the track, and the modeling includes the acceleration due to theslope.
−g sin θ, of the acceleration of gravity. An essential part of the data analysis is the
transformation of coordinates to ensure that one of the coordinate axes coincides with
the direction of the track. This was possible for the data obtained with the motion
tracker that was used also in earlier work where acceleration and rotation data for the
Balder roller coaster were analysed [9]. This motion tracker is basically a three axis
accelerometer and a three axis gyroscope unit. In addition a three axis inclinometer
is integrated for proper levelling at start which allows compensation for components of
g. The gyroscopes, that measure angular velocity, makes it possible to compensate the
measured linear acceleration for centripetal acceleration and for the changing direction
of the acceleration of gravity relative to the sensor. A simpler accelerometer could have
been used if the sensor could have be aligned with the track during the whole brake run.
A short distance after the braking fins, the train enters a system of wheels
controlling the final motion of the train into the station. From the data in figure 6
we observe that the effect of the braking wheels to a large extent compensates for the
finite length of train and magnetic brakes. This feature of the brake design, makes it
possible for us to use the results obtained for long trains and brakes in the analyses
below, in spite of the actual finite length.

Stopping a Roller Coaster Train. 8
Figure 7. The expected distribution of temperature increase over the brake fins,obtained from the integral in Eq.(B.1). The blue curve takes into account that thebrake fins in the beginning of the brake do not contribute to the braking after the traintail has past - this energy would instead be taken up by the mechanical brakes thatfollow after the brake fins. The data also accounts for the 4.3o forward slope of thetrack.
4.1. Brake fin temperature increase
A temperature increase of ∆T = Ek/Cρ(18Lhb) ≈ 8.4K could be expected if all the
kinetic energy were absorbed by the brake fins and evenly distributed, as discussed in
section 2. However, the first brake fin should heat up more, since the train has higher
speed as it passes. The temperature was modelled by evaluating the reduction in kinetic
energy lost as the train travels a distance ds and distributing the energy over the part
of the brake that is active during this part of the motion. The details of the calculation
are shown in Appendix B. Figure 7 shows the expected distribution of temperature
increase over the length of the brake. The largest temperature increase is found to be
∆T (0) =m
3 C ρhb
√k2v3
0.
The real temperature increase is slightly lower: Due to the finite length of the train,
part of the energy is absorbed by the mechanical brakes following after the braking fins.
5. Cooling down
The brakes must cool down before the next train arrives. The warm fins at temperature
T will radiate energy according to Stefan-Boltzmann’s law. The net radiation loss to
the colder surrounding at temperature T0 from an area A can be expressed as
P = eσA(T 4 − T 40 ) (2)
where Stefan’s constant σ = 5.6703× 10⁻⁸W/m2K2 and e is the emissivity, assumed to
be 1. For a distance ds of the braking fins, the area is A = 2h ds (accounting for back
Stopping a Roller Coaster Train. 9
and front of the fin, but neglecting the small area at the top/bottom edges of the fin).
The corresponding volume that is cooling down is V = hb ds. The rate of temperature
change can then be written as
dT
dt=−PACρV
=2eσ(T 4
0 − T 4)
Cρb(3)
The surrounding temperature can be approximated by the lowest temperature readings
in figure 2 for the dips corresponding to the temperature of the passing train. For a fin
temperature 40K higher than a surrounding temperature of 296K, we find a cooling rate
due to radiation of about 0.03K/s, which can be seen as an upper limit of the cooling
rate due to radiation.
The experimental data from the FLIR camera for the cooling of the first braking
fin in figure 2 show the temperature dropping at a rate
dT
dt≈ −0.10K/s. (4)
From this comparison, we conclude that other energy losses are more important; to the
surrounding air, through convection and wind, and into the track, through conduction,
as visible also in the IR movie [5].
6. Discussion
Educational aspects of energy conversions in roller coasters are traditionally limited
to the conversion between potential and kinetic energy and possibly discussions of
losses along the track. With this work, we demonstrate that energy considerations
in roller coaster can involve many more areas of physics and use theory, modeling
and measurements in realistic comparisons with real roller coaster data. More
detailed studies could also e.g. include video-analysis of the stopping train, as well
as measurement of the magnetic field strengths and simulations of the induced eddy
currents.
Acknowledgements
We gratefully acknowledge the support by Liseberg, including access to Kanonen when
the park was closed, giving us the opportunity to take the relevant IR pictures. Special
thanks go to Ulf Johansson and Kenneth Berndtsson, who also provided access to
relevant data from the technical specifications.
References
[1] Peschel J Achterbahnbremsen - Von der Reib- zur Wirbelstrombremse Coasters and Morehttp://www.coastersandmore.de/rides/brake/brake.shtml
[2] Marden D, Roller Coaster Data Base http://www.rcdb.com[3] Peschel J Kanonen - Great Firepower at Liseberg Coasters and More
http://www.coastersandmore.de/rides/kanonen/kanonen.shtml

Stopping a Roller Coaster Train. 10
[4] Ho C Y et al 1983 Electric resistivity of ten selected binary alloy systems J. Phys. Chem. Ref. Data12 183-322, www.nist.gov/data/PDFfiles/jpcrd221.pdf
[5] A movie sequence of the heating and cooling of the brakes is available atstacks.iop.org/PhysED/47/000000/mmedia.
[6] Wiederick H D, Gauthier N, Campbell D A and Rochon P 1987, Magnetic braking: Simple theoryand experiment American Journal of Physics, 06/1987, 55 p. 500
[7] Pendrill A-M 2008, Acceleration in 1, 2, and 3 dimensions in launched roller coasters, PhysicsEducation 43 483-491
[8] Heintz V, Martensson Pendrill A-M, Schmitt A and Wendt, K (2009) Achterbahn fahren imPhysikunterricht Physik in unserer Zeit, 40:2 90-95
[9] Pendrill A-M and Rodjegard H 2005, A roller coaster viewed through motion tracker data PhysicsEducation 40 522-526
Appendix A. Dimensionless equations of motion and analytical solution
Equation 1 describing the braking in a magnetic brake is analogous to the equation
y′′ = −2y′y (A.1)
Using Mathematica, we were able to solve this non-linear differential equation, giving
y(x) = tanh(x) (A.2)
To make use of this analytical solution, we rewrite equation (1) in terms of dimensionless
variables, e.g. as
a/√kv3
0 = −2(v/v0)(s√k/v0) (A.3)
The analytical solution to this equation can be written as
s(t) =√
2v0/k tanh(√kv0/2t) (A.4)
Since the maximum values of the tanh function is 1, we find that the maximum distance
travelled is
D =√
2v0/k (A.5)
The velocity is found by taking the time derivative of Eq. (A.4), which gives
v(t) =d
dts(t) = v0 sech2(
√kv0/2t) (A.6)
where sech(0) = 1 gives the numerical value for the initial velocity, v(0) = v0. (The
factor 2 in the analytical equation (A.1) is needed to get this simple relation.)
For completeness, we give also the expression for the acceleration of the train:
a(t) = −√
2kv0 tanh(√kv0/2t)sech2(
√kv0/2t)
Using transformations to dimensionless variables, the different graphs in figure 3 can
be reduced to a single graph with the dimensionless variables on the axes. Figure 4
shows how velocity and acceleration depends on the distance travelled, but expressed in
terms of the dimensionless variables y = s√
2k/v0, y′ = v/v0 and y′′ = a
√8/kv3
0. The
dimensionless variable involving the time is given by t√kv0/2.

Stopping a Roller Coaster Train. 11
Appendix B. Temperature distribution over the brakes
In this Appendix we model the distribution of the temperature change in the brakes,
assuming that the energy is distributed evenly over the height, h, of the track, as
well as over the thickness, b. The reduction in kinetic energy as the train moves a
distance ds can be written as dEk = mv dv = ma ds. Neglecting first the complication
that the train is no longer in contact with the first brake fin at the end of the
stopping distance, we find that the energy deposited per length unit of the brakes is
−dEk/s = ma ds/s = −m(kvs) ds/s = −mkv ds for the active part of the brake. For
the temperature increase, we need to know the energy deposited per mass of the brake
fin as the train moves a distance , i.e. dT = dQ/(CM) = dQ/(2Cρhbs), where the
factor 2 is needed to account for the two fins in the brakes.
∆T (x) =mk
2C ρ h b
∫ D
xv ds. (B.1)
From the analytical solution in section 3, we can use figure 4 to estimate the
temperature increase of the first brake fin. The integral over the whole area, using
dimensionless variables becomes∫ 10 y′ dy =
∫∞0 (y′)2 dt = 2/3. Alternatively, the
derivative of tanh(x) can be evaluated explicitly, giving y′ = (1 − y2). The integral
can then be rewritten as∫ 1
0y′ dy =
∫ 1
0(1− y2) dy = 2/3.
Insertion of the parameters from the expressions for s and v in Eqs (A.4, A.6), gives the
temperature increase at the beginning of the brake:
∆T (0) =mk
2 C ρ h bv0
√2v0
k
2
3=
m
3 C ρhb
√k2v3
0.
The expression above would hold for a horizontal track, with train and brakes at least
as long as the stopping distance, D =√
2v0/k, and assuming that all the kinetic energy
of the train is absorbed by the brake fins. We note that dT (0) is proportional to v3/20
rather than to v2, as the kinetic energy. The remaning factor v1/20 comes from the longer
stopping distance (A.5) for an increased initial speed.
To compensate for the final part of the brake, when the train of length Lt is no longer
close to the part of the braking fin at position x, the contribution from the tail can be
subtracted, giving a slightly reduced rise in temperature, ∆Tc(x) = ∆T (x)−∆T (Lt+x).
Inserting numerical values for Kanonen, we find in this way ∆T (0) = 12.8K. Figure
7 shows the expected distribution of temperature increase over the brake fins, with and
without this tail correction. The upper curve in figure 7 starts slightly higher than the
analytical value for dT (0), reflecting the added energy due to the 4.3o slope of track.

Stopping a Roller Coaster Train. 12
Appendix C. Authors
Figure C1. Ann-Marie Pendrill is professor of physics at University of Gothenburgwith a research background in computational atomic physics. Since 2009, she is alsothe director of the Swedish National Resource Centre for Physics Education, hosted byLund university. She has arranged amusement park science days, and used examplesfrom playgrounds and amusement rides in the education of physics, teaching andengineering students.
Figure C2. Magnus Karlsteen is associate professor of applied physics at ChalmersUniversity of Technology.
Stopping a Roller Coaster Train. 13
Figure C3. Henrik Rodjegard has a Ph.D. in Solid State Electronics. In his researchhe has focused on development of micro-sensor components and electronic systems forthese. The electronics research has includes construction and verification of severalanalogue integrated circuits for readout of various sensor signals. Since 2006 he hasbeen working with research related to development of gas sensors based on infra-reddetection.