‘stop the spread’ benchmark study topline charts … · ‘stop the spread’ benchmark study...
TRANSCRIPT

‘Stop the Spread’ Benchmark Study
Topline Charts Prepared for: safefood
April 2011
41110781 VB/BG

2.
Research Objectives
The main objectives of this benchmark research are:
– To understand how the public perceive their own weight– Ascertain to what extent the public see a causal link between
weight and health– Ascertain to what extent the public believe that being
overweight increases the likelihood of family and friends also being overweight
– Evaluate all aspects of waist measurement in the context of obesity

3.
Research Method
Face-to-face in-home surveys (island of Ireland; IOI)
• Representative sample of adults aged 15+ years living ROI
• Nationally representative sample of adults aged 16+ living in NI.
• This study was conducted among a sub sample of adults aged 18+
• Quota controlled in terms of gender, age, social class and region, to reflect the actual demographics of the adult population in both ROI and NI.
Interviews were conducted at 107 IOI sampling points
Sample size: 1,948 from 107 IOI sampling points.
Fieldwork dates: ROI: 16th – 30th March 2011
NI: 21st – 26th March 2011

4.
A lot 8680
12 1115
1 1 14
85
* - 112
A littleNot a lot
NoneDon’t know
IOI
%
ROI
%
NI
%
Q.1 How much impact, if any, do you think being overweight has
on a person’s health?
(Base: All Adults, n=1,948)
Majority agree that being overweight impacts health
96%
2%
(Base: n=975) (Base: n=973)
97%
1%
94%
2%

5.
Heart disease, high BP, diabetes are most top of mind as health conditions
likely to occur in the overweight
Q.2 Which, if any, health conditions are you aware of that are
more likely to occur in someone who is overweight?
82
54
52
35
13
8
5
5
12
1
2
Heart disease
High blood pressure
Type II diabetes
Stroke
Cancers
Problem sleeping
Gallstones
Fertility problems
Don’t know
None
IOI
%
ROI
%
NI
%
83
55
52
34
12
9
6
6
13
1
1
80
52
51
37
13
5
4
3
12
1
5
Other
(Base: All Respondents, n=1,948)
(Base: n=975) (Base: n=973)

6.
One in every two IOI adults feel they do not need to lose weight or never think
about their weight; almost 3 in 10 are losing weight or trying to lose weight
Q.3 With regard to weight, which ONE of the following statements
most applies to you?
37
21
20
15
7I am losing weight and have
been for six months or more
I do not need to lose weight
IOI
%
ROI
%
NI
%
39
21
19
13
7
32
22
21
18
6
I am trying to lose weight
I believe I should lose weight,
but I don’t know how or have
not made it a priority
I never think about my weight, and
I have no intention of changing
(Base: All Respondents, n=1,948)
(Base: n=975) (Base: n=973)
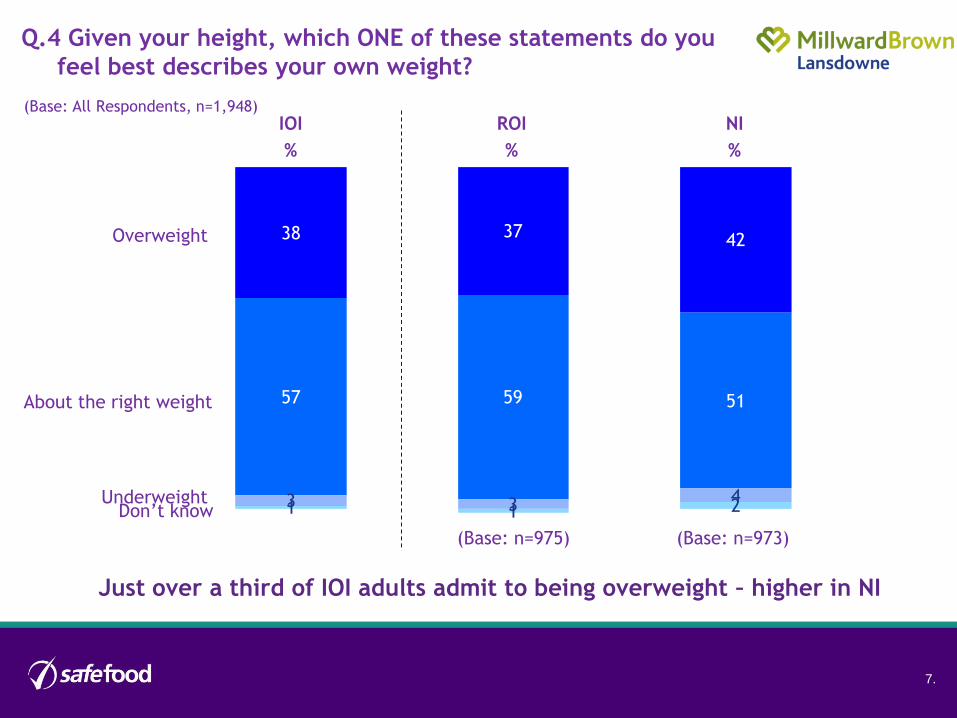
7.
3742
57 59 51
3 34
1 1 2
38
Just over a third of IOI adults admit to being overweight – higher in NI
Overweight
About the right weight
Underweight Don’t know
IOI
%
ROI
%
NI
%
Q.4 Given your height, which ONE of these statements do you
feel best describes your own weight?
(Base: All Respondents, n=1,948)
(Base: n=975) (Base: n=973)
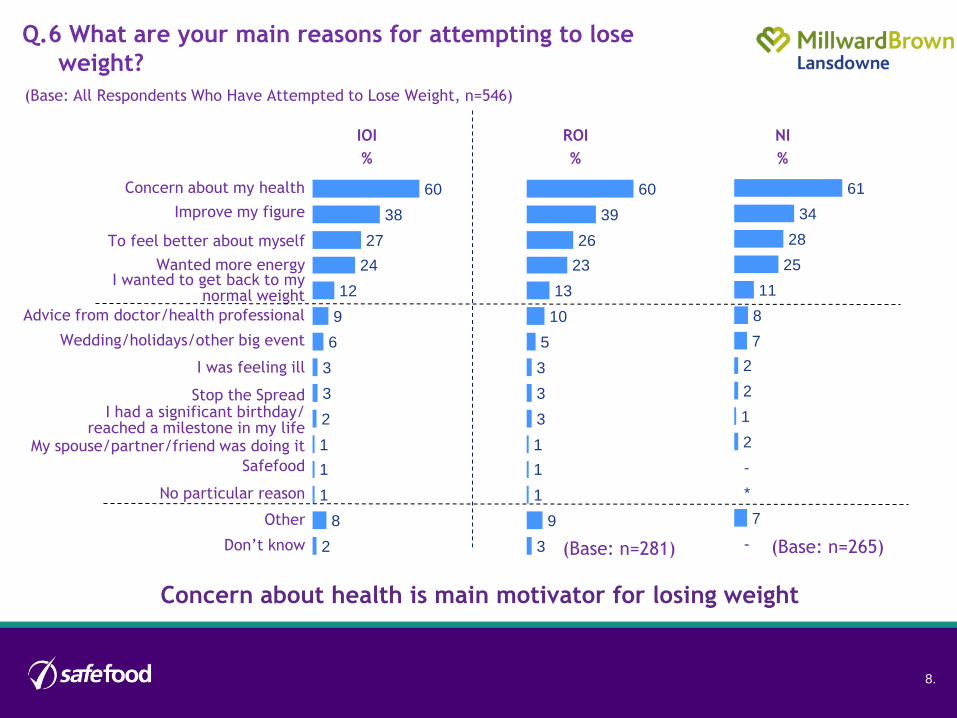
8.
Concern about health is main motivator for losing weight
Q.6 What are your main reasons for attempting to lose
weight?
I was feeling ill
My spouse/partner/friend was doing it
IOI
%
ROI
%
NI
%
Wanted more energy
Improve my figure
Concern about my health
I had a significant birthday/reached a milestone in my life
Advice from doctor/health professional
To feel better about myself
Wedding/holidays/other big event
Stop the Spread
Safefood
No particular reason
I wanted to get back to my normal weight
Other
60
38
27
24
12
9
6
3
3
2
1
1
1
8
2
60
39
26
23
13
10
5
3
3
3
1
1
1
9
3
61
34
28
25
11
8
7
2
2
1
2
-
7
-
*
Don’t know
(Base: All Respondents Who Have Attempted to Lose Weight, n=546)
(Base: n=281) (Base: n=265)
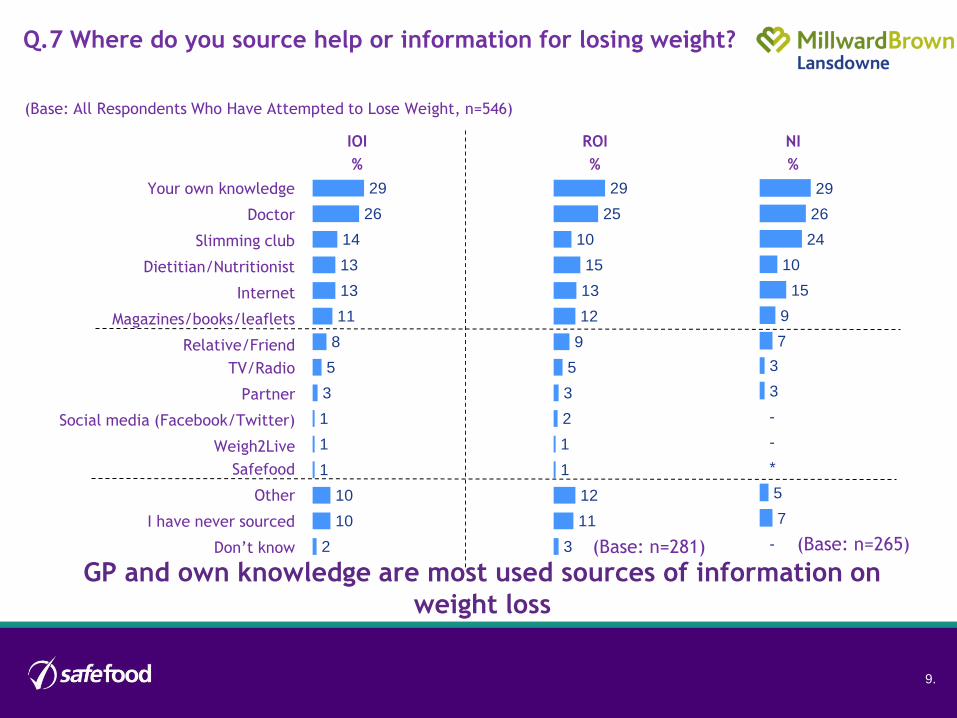
9.
GP and own knowledge are most used sources of information on
weight loss
Q.7 Where do you source help or information for losing weight?
29
26
14
13
13
11
8
5
3
1
1
1
10
10
2
Slimming club
Magazines/books/leaflets
IOI
%
ROI
%
NI
%
29
25
10
15
13
12
9
5
3
2
1
1
12
11
3
29
26
24
10
15
9
7
3
3
-
-
5
7
-
*
Dietitian/Nutritionist
Your own knowledge
Doctor
TV/Radio
Internet
Social media (Facebook/Twitter)
Weigh2Live
Partner
Relative/Friend
I have never sourced
Safefood
Other
(Base: All Respondents Who Have Attempted to Lose Weight, n=546)
Don’t know (Base: n=281) (Base: n=265)

10.
How clothes feel and the weighing scales are key indicators for becoming
overweight
Q.8 How would you know if you were overweight?
64
34
15
12
7
7
5
3
8
2
Scales/weigh myself
Body Mass index (BMI) over a certain level
IOI
%
ROI
%
NI
%
68
32
15
12
7
8
6
3
8
2
54
38
15
13
7
6
3
4
8
4
Up a trouser size
Up a dress size
Clothes feeling too tight
Outside medically recommended range for age and height
Waist measure
Up a new notch on my belt
Other
Don’t know
(Base: All Respondents, n=1,948)
(Base: n=975) (Base: n=973)

11.
-
61
38
6 in 10 IOI adults claim to know their waist measure – higher in ROI and among
men
Yes
No
Don’t know
%
%
Yes
IOI
%
ROI
%
NI
%
Total 61 65 52
Male 77 79 73
Female 46 52 33
U35 63 67 52
35+ 61 64 53
ABC1 60 62 55
C2DE 61 66 50
Base n=975 n=973
Q.9aDo you know what your current waist measure is?
(Base: All Respondents, n=1,948)

12.
The vast majority of adults would measure their waist in inches
Q.9b Would you measure your waist measurement in
Centimetres or Inches?
7 5
77 74 82
17 1913
6Centimetres
Inches
Don’t know
IOI
%
ROI
%
NI
%
(Base: All Respondents, n=1,948)
(Base: n=975) (Base: n=973)

13.
A minority of men claim to be in the danger zone of 102cm+
Q.9c Please tell me what your waist measure is?
% YesIOI
%ROI%
NI%
<24 inches (<60 cm) - - -
25-26 inches (61 – 65cm) * * 1
27-28 inches (66 – 70cm) 2 1 2
29-30 inches (71 – 75cm) 7 6 9
31-32 inches (76 – 80cm) 24 25 21
33-34 inches (81 – 85cm) 30 32 24
35 –36 inches (86 – 90cm) 18 18 19
37-38 inches (91 –95cm) 9 9 10
39-40 inches (96 – 100cm) 4 3 5
41-42 inches (101 – 105cm) 3 3 5
43-44 inches (106 – 110cm) 1 2 1
45-46 inches (111 –115cm) 1 1 1
47-48 inches (116 – 120cm) * * -
49-50 inches (121 –125cm) * * *
50+ inches (125+cm) - - -
Don’t know * - *
Refused 1 1 1
(Base: All Male Respondents that know their waist measure, n=694)
(Base: n=375) (Base: n=319)

14.
Most women claim to be within the recommended 80cm
% YesIOI
%ROI%
NI%
<24 inches (<60 cm) 7 7 5
25-26 inches (61 – 65cm) 11 10 13
27-28 inches (66 – 70cm) 16 15 18
29-30 inches (71 – 75cm) 18 17 21
31-32 inches (76 – 80cm) 12 12 11
33-34 inches (81 – 85cm) 12 11 14
35 –36 inches (86 – 90cm) 8 9 3
37-38 inches (91 –95cm) 4 4 4
39-40 inches (96 – 100cm) 3 3 1
41-42 inches (101 – 105cm) 1 2 1
43-44 inches (106 – 110cm) 1 1 -
45-46 inches (111 –115cm) - - -
47-48 inches (116 – 120cm) 1 1 -
49-50 inches (121 –125cm) - - -
50+ inches (125+cm) * * 1
Don’t know 3 3 3
Refused 4 3 6
Q.9c Please tell me what your waist measure is?
(Base: All Female Respondents that know their waist measure, n=431)
(Base: n=255) (Base: n=176)

15.
Jeans/trouser size most referenced as indicator of waist measurement
Q.10 How did you learn what your current waist measurement
is?
65
22
10
7
1
1
Know from other clothes
IOI
%
ROI
%
NI
%
Know from my jeans/trousers
Was professionally measured
Measured it myself
Other
Don’t know
(Base: All Respondents That Know Their Waist Measure, n=1,125)
65
23
9
8
1
1
68
22
14
3
1
2(Base: n=630) (Base: n=495)

16.
A range of practices emerge for measuring waist size
Q.11 If you were given a measuring tape to measure your waist,
around which area would you put the tape?
37
33
20
3
8
Other
IOI
%
ROI
%
NI
%
38
31
20
3
8
34
37
19
1
9
Where trousers/jeans sit
Around my bellybutton area
The thinnest part of my waist
Don’t know
(Base: All Respondents, n=1,948)
(Base: n=975) (Base: n=973)

17.
Most men feel a waist measure of between 76 and 90cm is healthy for a man
Q.12b Looking at these ranges, can you tell me what you think a
healthy waist measurement for a man should be?
% Yes IOI%
ROI%
NI%
<24 inches (<60 cm) - - -
25-26 inches (61 – 65cm) * * *
27-28 inches (66 – 70cm) 1 1 1
29-30 inches (71 – 75cm) 7 8 4
31-32 inches (76 – 80cm) 22 23 22
33-34 inches (81 – 85cm) 33 33 33
35 –36 inches (86 – 90cm) 16 15 18
37-38 inches (91 –95cm) 4 4 5
39-40 inches (96 – 100cm) 3 3 1
41-42 inches (101 – 105cm) 1 2 -
43-44 inches (106 – 110cm) 1 1 -
45-46 inches (111 –115cm) - - -
47-48 inches (116 – 120cm) - - -
49-50 inches (121 –125cm) - - -
50+ inches (125+cm) - - -
Don’t know 12 11 16
(Base: All Male Respondents, n=912)
(Base: n=471) (Base: n=441)

18.
Most women feel that a waist measure between 66 and 80 cm is healthy for a
woman, but high levels of ‘don’t know’ responses prevail
% YesIOI
%
ROI
%
NI
%
<24 inches (<60 cm) 2 3 2
25-26 inches (61 – 65cm) 11 9 14
27-28 inches (66 – 70cm) 16 14 20
29-30 inches (71 – 75cm) 22 22 22
31-32 inches (76 – 80cm) 18 21 10
33-34 inches (81 – 85cm) 9 10 6
35 –36 inches (86 – 90cm) 3 3 2
37-38 inches (91 –95cm) 2 3 -
39-40 inches (96 – 100cm) * * -
41-42 inches (101 – 105cm) - - -
43-44 inches (106 – 110cm) - - -
45-46 inches (111 –115cm) - - -
47-48 inches (116 – 120cm) - - -
49-50 inches (121 –125cm) - - -
50+ inches (125+cm) - - -
Don’t know 17 13 24
Q.12a Looking at these ranges, can you tell me what you think a
healthy waist measurement for a woman should be?
(Base: n=504) (Base: n=532)
(Base: All Female Respondents, n=1,036)

19.
Wide range of estimates as to % of adults who are overweight or obese, with
most underestimating the true incidence
3 2
20 2216
1719
14
2221
25
2634
3 3 27
8 7
2
28
Q.13 What percentage of adults on the island of Ireland do you
think are overweight or obese?(Base: All Respondents, n=1,948)
0-19%
20-39%
40-49%
50-59%
60-79%
80%+Don’t know
IOI
%
ROI
%
NI
%
(Base: n=975) (Base: n=973)

20.
2 thirds of IOI adults believe that being overweight has a negative impact on
family/partner weight
2519
44 44
43
13 1117
8 96
57
7 6 9
23
6
Very likely
Quite likely
Neither/Nor
Quite unlikely
Very unlikely
Don’t know
IOI
%
ROI
%
NI
%
Likely
67%
Unlikely
14%
Q.14 If someone is overweight, how likely to do you think it is
that their family/partner will also be overweight?
(Base: n=975) (Base: n=973)
Likely
69%
Unlikely
14%
Likely
61%
Unlikely
13%
(Base: All
Respondents,
n=1,948)

21.
Opinion is polarised regarding the negative impact on friends’ weight
Q.14b And how likely do you think it is that their friends will also
be overweight?
(Base: All Adults, n=1,948)
7 3
23 24
19
26 25
29
20 1920
1517
10 9 12
6
15
Very likely
Quite likely
Neither/Nor
Quite unlikely
Very unlikely
Don’t know
IOI
%
ROI
%
NI
%
Likely
29%
Unlikely
35%
(Base: n=975) (Base: n=973)
Likely
32%
Unlikely
34%
Likely
22%
Unlikely
37%

22.
IOI adults UNDERESTIMATE the true PREVALENCE OF OVERWEIGHT/OBESITY.
There is widespread DENIAL about being overweight, and COMPLACENCY about
proactively addressing weight problems.
The correct way to MEASURE WAIST SIZE is NOT UNDERSTOOD.
While there is good understanding of how obesity can spread to family/partner,
spread within the SOCIAL CIRCLE is vastly UNDERESTIMATED.
PUBLIC INFORMATION campaign is ESSENTIAL.
Summary/ Conclusions