stockton and sacramento deepwater ship channel maintenance...
TRANSCRIPT
Stockton and SacramentoDeepwater Ship Channel
Maintenance Dredging Project
2009 Fish Community and Entrainment Monitoring Report
Prepared for
U.S. Army Corps of Engineers, Sacramento District 1325 J Street Sacramento, California 95814
Prepared by
Mari-Gold Environmental Consulting Inc. 25385 South Hughes Lane Canby, Oregon 97013
and
Novo Aquatic Sciences, Inc. 716 SE Malden Street Portland, Oregon 97202
April 2010

Mari-Gold Environmental Consulting Inc. Page ii
Contents 1 Executive Summary ...................................................................................................................... 1 2 Introduction ................................................................................................................................... 4 3 Methods ...................................................................................................................................... 10
3.1 Sampling Methods Overview ................................................................................................ 10 3.2 Sampling Effort, Timing, and Sampling Locations ................................................................ 10 3.3 Fish Community Sampling .................................................................................................... 14 3.4 Entrainment Sampling .......................................................................................................... 18
3.4.1 Sampling Cells ........................................................................................................... 18 3.4.2 Mobile Entrainment Screen ........................................................................................ 19
3.5 Water Quality Monitoring ...................................................................................................... 22 3.6 Reporting, Data Management, Quality Assurance and Quality Control ................................ 23
3.6.1 Fish Entrainment ........................................................................................................ 23 3.6.2 Fish Community Sampling ......................................................................................... 23 3.6.3 Mortality Estimation .................................................................................................... 23 3.6.4 Data Management ..................................................................................................... 23
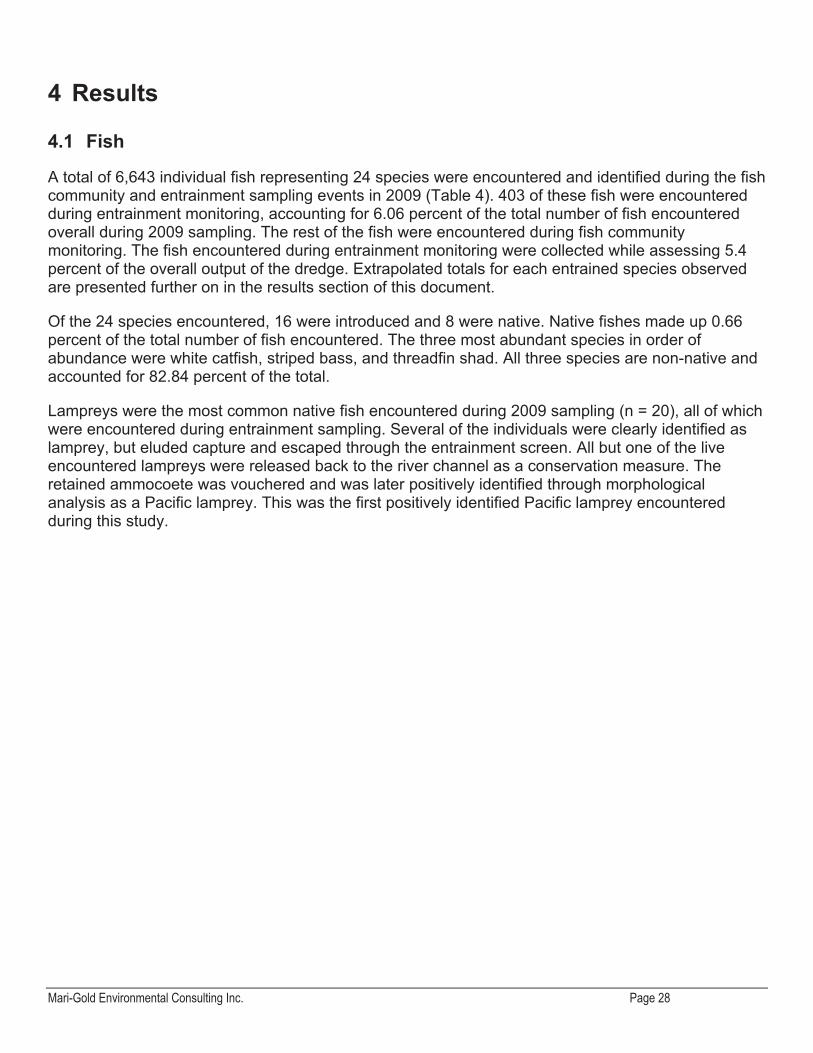
4 Results ........................................................................................................................................ 28 4.1 Fish ....................................................................................................................................... 28
4.1.1 Special-status Species ............................................................................................... 30 4.2 Entrainment Monitoring ......................................................................................................... 30
4.2.1 Sacramento River Shipping Channel Locations ......................................................... 34 4.2.2 Stockton Shipping Channel Locations ....................................................................... 34
4.3 Fish Community Monitoring .................................................................................................. 38 4.3.1 Sacramento River Shipping Channel Locations ......................................................... 40 4.3.2 Stockton Shipping Channel Locations ....................................................................... 41
4.4 Fish Length ........................................................................................................................... 55 4.5 Invertebrates ......................................................................................................................... 57 4.6 Bird Activity Observations ..................................................................................................... 60 4.7 Comparison of Monitoring Method Results ........................................................................... 60 4.8 Water Quality Monitoring ...................................................................................................... 63 4.9 Level of Take ........................................................................................................................ 65 4.10 All Years Combined Data ................................................................................................... 68
5 Discussion .................................................................................................................................. 72 5.1 Hypotheses ........................................................................................................................... 72 5.2 Sampling Design Efficiency .................................................................................................. 75 5.3 Overview ............................................................................................................................... 76 5.4 Bird Activity Monitoring ......................................................................................................... 78 5.5 Adaptive Management Strategies ......................................................................................... 78
5.5.1 Entrainment Monitoring .............................................................................................. 79 5.5.2 Fish Community Monitoring ....................................................................................... 79
5.6 Recommendations ................................................................................................................ 79 5.6.1 Entrainment Monitoring .............................................................................................. 79 5.6.2 Fish Community Monitoring ....................................................................................... 80
5.7 Conclusions .......................................................................................................................... 81 6 References ................................................................................................................................. 82

Mari-Gold Environmental Consulting Inc. Page iii
Tables Table 1. SRSC & SSC 2009 Maintenance Dredging Locations ............................................................. 11 Table 2. 2009 Entrainment Monitoring Effort at DMP Sites ................................................................... 12Table 3. 2009 Fish Community Monitoring Effort by Dredging Reach ................................................... 14Table 4. Ranked List of Fish Encountered from All 2009 Sites from Trawl & Entrainment Monitoring ... 29Table 5. Ranked List of Fish Encountered From All Sites During 2009 Entrainment Monitoring ........... 31Table 6. Summary Results of Entrainment Monitoring Events for All SSC Locations ............................ 31Table 7. Summary Results of Entrainment Events for SRSC Man-made Channel — S-31 DMP Site ... 34Table 8. Summary Results of Entrainment Events at Light 21 — McCormack Pit DMP Site ................. 35Table 9. Summary Results of Entrainment Events at Spud Island — Roberts 2 DMP Site ................... 35Table 10. Summary Results of Entrainment Events at Lower Roberts Island — Roberts 2 DMP Site .. 35Table 11. Summary Results of Entrainment Events at Windmill Cove — Roberts 2 DMP Site ............. 36Table 12. Summary Results of Entrainment Events at Upper Roberts Island — Roberts 1 DMP Site .. 36Table 13. Summary Results of Entrainment Events at Rough & Ready Island —Roberts 1 DMP Site . 36Table 14. Summary Results of Entrainment Events at Upper Turning Basin — Roberts 1 DMP Site ... 37Table 15. Extrapolated Fish Entrainment Catch for 2009 by Event Location & Fish Species ................ 37Table 16. Ranked Catch of Fish from All Sites during 2009 Trawl Monitoring Surveys ......................... 40Table 17. Summary Catch & Effort Data for Fish Encountered in 2009 Trawl Monitoring Surveys ...... 40Table 18. Ranked Fish Catch from 2009 Trawl Surveys in SRSC Man-made Channel – S-31 DMP
Site ................................................................................................................................... 41Table 19. Ranked Fish Catch from 2009 Trawl Surveys in All SSC Sites ............................................. 43Table 20. Summary Results of Trawl Surveys at Scour Pond/ Antioch — Scour Hole DMP Site .......... 45Table 21. Summary Results of Trawl Surveys at Light 21 — McCormack Pit DMP Site ....................... 45Table 22. Summary Results of Trawl Surveys at Spud Island — Roberts 2 DMP Site .......................... 48Table 23. Summary Results of Trawl Surveys at Lower Roberts Island — Roberts 2 DMP Site ........... 48Table 24. Summary Results of Trawl Surveys at Windmill Cove — Roberts 2 DMP Site ...................... 51Table 25. Summary Results of Trawl Surveys at Upper Roberts Island — Roberts 1 DMP Site ........... 51Table 26. Summary Results of Trawl Surveys at Rough & Ready Island — Roberts 1 DMP Site ......... 55Table 27. Summary Results of Trawl Surveys at Upper Turning Basin — Roberts 1 DMP Site ............ 55Table 28. Summary Size Statistics for Fish Encountered during 2009 Trawl Surveys .......................... 56Table 29. Summary Size Statistics for Fish Encountered during 2009 Entrainment Screen Events ...... 57Table 30. Ranked List for Invertebrates Encountered during 2009 Entrainment Monitoring .................. 58Table 31. Ranked List for Invertebrates Encountered during 2009 Trawl Surveys ................................ 59Table 32. Extrapolated Invertebrate Entrainment Catch for 2009 by Location & Species ..................... 59Table 33. Percent Demersal Fishes by Location in 2009Trawl & Entrainment Sampling ...................... 61Table 34. Trawl & Entrainment Percentage for Fish Species Observed in Both Sampling Methods ..... 63Table 35. ESA & CESA Incidental Take Allotments for 2009 & 2010 .................................................... 65Table 36. Total Mortality for 2009 Fish Community Sampling ............................................................... 67Table 37. Total Mortality for 2009 Entrainment Sampling...................................................................... 67Table 38. Vouchered Specimens Collected during 2009 Monitoring ..................................................... 68Table 39. Combined Fish Catch for Entrainment Sampling during All Years of Study ........................... 68Table 40. Combined Fish Catch for Trawl Sampling during All Years of Study ..................................... 69Table 41. Special Status Species List for All Years of Study ................................................................. 70 Table 42. Delta Fish Species Not Encountered in Trawl or Entrainment Sampling during Lifetime of
Study................................................................................................................................. 71
Mari-Gold Environmental Consulting Inc. Page iv
FiguresFigure 1. Project Area Map, Sampling Locations, and DMP Sites Figure 2. Otter Trawl Net Diagram Figure 3. Karen M Research Vessel Figure 4. Examples of Fish Community Survey Tools and Methods Figure 5. Mobile Entrainment Screen Collection System Figure 6. Photographs of Discharge Pipeline Y-valve Figure 7. Example of Debris Collected during Entrainment Screen Monitoring Figure 8. Two Types of Screen Used for Entrainment Screen Sampling in 2008 Figure 9. Horiba U-52 Multi-parameter Portable Water Quality Meter Figure 10. Examples of Specimens Encountered during Fish Community Surveys Figure 11. Percent Native Fish in Fish Community Sampling by Dredge Reach Figure 12. Mean CPUE for Each Fish Community Survey Figure 13. 2009 Fish Community Surveys for Man-made Channel Dredge Reach and S-31 DMP Site Figure 14. 2009 Fish Community Survey for Antioch / Scour Pond Dredge Reach and Scour Hole
DMP Site Figure 15. 2009 Fish Community Surveys for Light 21 Dredge Reach and McCormack Pit DMP Site Figure 16. 2009 Fish Community Surveys for Spud Island Dredge Reach Figure 17. 2009 Fish Community Surveys for Lower Roberts Island Dredge Reach and Roberts 2
DMP Site Figure 18. 2009 Fish Community Surveys for Windmill Cove Dredge Reach and Roberts 2 DMP Site Figure 19. 2009 Fish Community Surveys for Upper Roberts Island Dredge Reach, Roberts 1 and
Roberts 2 DMP Sites Figure 20. 2009 Fish Community Surveys for Rough and Ready Island Dredge Reach and Roberts 1
DMP Site Figure 21. 2009 Fish Community Surveys for Upper Turning Basin Dredge Reach Figure 22. Percent Demersal Fishes in Catch by Survey Type Figure 23. Mean Size of Fish Species Encountered by Survey Type
AppendicesA Special-status Species Life History Information B Water Quality Data C Field Data Collection Forms and Database

Mari-Gold Environmental Consulting Inc. Page ii
AcknowledgementsThis monitoring program has involved cooperative efforts by many individuals and organizations. Mari-Gold Environmental Consulting Inc. (MEC) biologist Jordan Gold, and Novo Aquatic Sciences, Inc. (NAS) biologist Steve Novotny were responsible for field operations, data collection, and reporting. Leuth Novotny (NAS) provided GIS/database services including database maintenance, technical editing and additional QA/QC. Derek and Colin Loree of Loree Consulting also provided GIS technical assistance. Jonas Moiel of Green Banks, LLC provided needed assistance with the fieldwork for a portion of 2009 dredging season. The authors extend their gratitude to Ross Island Sand and Gravel Company for their expertise and logistical support. This program could not be conducted without a close working relationship between the biologists and the dredgers. Each has their areas of expertise with little overlap. The ability to conduct the required sampling is due in large part to merge highly disparate disciplines with very different goals. It is only through careful analysis of activities, sampling needs, and operational parameters and constraints that the investigators are able to conduct the sampling with little to no interruption of the dredging activities. This could not be done without the full cooperation and enthusiasm of the Ross Island dredging crew. The authors also extend their gratitude to Robin Rosenau, Gary Kamei, and others at USACE - Sacramento District for monitoring oversight and regulatory compliance; CDFG - Stockton Office personnel Kelly Souza, Chuck Armor, and Marty Gingras for native fish regulatory guidance and Julio Adib-Samii for assistance with wakasagi identification; Damon Goodman, USFWS - Arcata for lamprey identification assistance; Dr. Jeanette Howard of The Nature Conservancy for native mussel identification assistance; and CDFG License and Revenue Branch, for their assistance with scientific collecting permits and renewals.
DedicationThis report is dedicated to my dog Cal. I had to euthanize Cal on February 11, 2010, while this report was being finalized. He had to go because his hips finally gave out, but he was as good a dog as a person can have right to the end. He came into my life in 1998 when I was living on a floating home in the Delta. He was a black lab and really loved living on the water. I miss that dog.
Mari-Gold Environmental Consulting Inc. Page iii
AbbreviationsAbbreviation Full Term or NameBO biological opinion CDFG California Department of Fish and GameCESA California Endangered Species Act CNDDB California Natural Diversity Database Corps or USACE U.S. Army Corps of Engineers CPUE catch per unit effort Delta Sacramento River and San Joaquin River DeltaDMP dredged material placement (site) DODPS
dissolved oxygen distinct population segment
DWSC deepwater ship channel EFH essential fish habitat ESA Endangered Species Act ESU evolutionarily significant unit FMP fish entrainment and fish community monitoring planFMWT Fall Midwater Trawl [survey] GPS global positioning systemHx hypothesis IEP Interagency Ecological Program IUCN The World Conservation Union MEC Mari-Gold Environmental Consulting, Inc. MSA Magnuson-Stevens Fishery Conservation and Management ActNAS Novo Aquatic Sciences, Inc. NMFS National Marine Fisheries Service ntu nepholometric turbidity unit ppm parts per million ppt parts per thousand POD Pelagic Organism Decline (study) RISG Ross Island Sand and Gravel RM river mile SCP scientific collecting permit SD standard deviation SE standard error SF San Francisco SRSC Sacramento River Deep Water Ship Channel SSC Stockton Deep Water Ship Channel SWCA SWCA Environmental Consultants, Inc.USCG U.S. Coast Guard USFS U.S. Forest Service USFWS U.S. Fish and Wildlife Service
Mari-Gold Environmental Consulting Inc. Page 1
1 Executive Summary This document presents the results of the 2009 fish community and fish entrainment monitoring for maintenance dredging in two deepwater ship channels (DWSC): the Stockton Deepwater Ship Channel (SSC) and the Sacramento River Deepwater Ship Channel (SRSC). Monitoring was instituted to ensure compliance with applicable environmental laws and regulations including Section 7 of the Endangered Species Act (ESA), to quantify the level of incidental take of special-status fish species, and to provide feedback to the U.S. Army Corps of Engineers (Corps) regarding long-term dredging and dredged material placement activities. The Corps will use the feedback to assess and implement adaptive strategies that may decrease potential environmental impacts of the activities.
Fish entrainment was monitored during the 2009 dredging season exclusively using the prototype, mobile entrainment screen constructed in early 2008. Bottom trawling was used to monitor the fish community in the active dredge area of the shipping channels.
Dredging commenced on August 16, 2009, and ended on October 16, 2009. In general, each type of sampling (entrainment and fish community) was conducted on alternating days while the dredge was operating, although occasional night sampling was conducted for comparative purposes. Sampling did not occur on days when the dredge was being moved to a new location or was not in operation. Water quality sampling was conducted in conjunction with the fish community sampling efforts. Dredging operations in 2009 concluded prior to the close of the project in-water work window (November 30). Consequently, observational fish monitoring 24 hours a day aboard the active dredge was not required in 2009 as in 2006 and 2007.
The key findings of the 2009 entrainment monitoring at the dredged material placement (DMP) sites were:
� The prototype mobile entrainment screen was used at all DMP sites during the 2009 dredging season. This was the first dredging season that the sampling cell method was not used at any DMP sites. The goal was to sample 5% or more of the dredge output and 5.64% was sampled. This represents a significant improvement over previous years compared to 4.4% of overall dredged material sampled in 2008, 0.35% in 2007, and 0.37% in 2006.
� A total of 403 individual fish from 14 different taxa were encountered during 26 entrainment surveys.
� The introduced shimofuri goby (Tridentiger bifasciatus) was the most common fish species found in entrainment samples and comprised 64.76% of the entrained individuals.
� Lamprey (Lampetra spp.), comprising 4.71% of the entrained individuals, were the most common native species encountered in entrainment sampling. Lamprey were not observed or encountered in the fish community sampling within navigation channels. A single pacific lamprey (Entosphenus tridentata) was entrained. Lamprey and prickly sculpin (Cottus asper)were the only native fish encountered during entrainment sampling.
� No federal or state special-status species were encountered in 2009 entrainment samples. � Similar to previous years, the majority of fish entrained were demersal species that were also
encountered during fish community monitoring. For the first time, shimofuri goby, rather than white catfish (Ameiurus catus) or channel catfish, was the most commonly entrained fish.
� No entrainment sampling was conducted at the Scour Hole DMP site because the dredge was working in this reach for less than 24 hours. Fish community monitoring was conducted.
Mari-Gold Environmental Consulting Inc. Page 2
� The volume of slurry (dredged water and sediment) sampled throughout 2009 monitoring varied from 3.35% of total deposited slurry at the Windmill Cove dredge reach / Roberts 1 DMP site to 8.99% at the Upper Turning Basin dredge reach / Roberts 2 DMP site. A total of 34,932,127 gallons of slurry was sampled in 2009 surveys.
� A total volume of approximately 619,899,702 gallons of slurry was placed at DMP sites during the 2009 maintenance dredging season. Of this total, approximately 125,085,921 gallons of slurry were dredged from the SRSC and 494,813,781 gallons were dredged from the SSC.
The key findings from the 2009 fish community (trawl) sampling were:
� A total of 6,240 individual fish were encountered during 2009 trawl surveys. These fish represented 22 of the approximately 40 species presently known to occur in the Sacramento River and San Joaquin River Delta (the Delta).
� Twenty-seven trawl surveys were performed in 2009. A total of 96 successful trawl tow replicates were conducted. Total trawled distance was 50,822 meters.
� Six of the encountered fish species are native to the Delta and 16 are introduced.� As in previous years, white catfish, an introduced demersal (bottom-oriented) species, was the
most commonly encountered species in trawl samples and accounted for 55.02% of the total catch in 2009.
� Special status fish species (CESA or ESA threatened or endangered) were not encountered in 2009, unlike previous years when green sturgeon, delta smelt, and longfin smelt were encountered.
� Non-native species accounted for 99.65% of the fish encountered during community sampling. Delta smelt were the most commonly encountered native fish during 2008 (0.33%), similar to 2007. In 2009, however, starry flounder and white sturgeon were the most commonly encountered native fish each comprising 0.11% of the catch.
� Native fishes comprised 1.78% of total fish encountered from the single SRSC location and 0.24% of fish from all the SSC locations.
� Twelve of the 22 species encountered during fish community monitoring were also encountered during entrainment monitoring. Only one of the species encountered during both types of monitoring in 2009 was native: the prickly sculpin.
All data collected in 2009 were incorporated into the Microsoft (MS) Access database constructed for this project in 2006. The database provides data integrity for this large and growing data collection, streamlines electronic field data entry, and can enable examination of the complex relationships between fish presence and other environmental factors such as seasonality, water quality, tidal phase, presence/absence of other species and additional variables. It enables assessment of changes to the fish community resulting from management actions, anthropogenic influences, and/or environmental fluctuations/ perturbations.
Several special-status species designations changed during the 2009 monitoring period. Longfin smelt was petitioned for California and federal ESA listing on August 8, 2007. The California Fish and Game Commission accepted the petition on February 7, 2008, and longfin smelt were listed as threatened under California Endangered Species Act (CESA) on June 25, 2009. On April 8, 2009, the US Fish and Wildlife Service (USFWS) concluded that the San Francisco (SF) Bay - Delta population of longfin smelt did not meet the legal criteria for protection as a species subpopulation or distinct population segment (DPS). The USFWS is currently conducting a status review of all West Coast longfin smelt populations. Delta smelt were accepted as state candidates for up-listing from

Mari-Gold Environmental Consulting Inc. Page 3
threatened to endangered status under CESA on January 16, 2009. Take allotments for delta and longfin smelt encountered by this monitoring program remained unchanged during 2009.
Notable amongst the non-listed native fish species encountered by this monitoring program are Sacramento splittail (Pogonicthys macrolepidotus) and lamprey species. Sacramento splittail, a native minnow, have been encountered every year that this monitoring has been conducted, including 2009. On January 22, 2010, the Center for Biological Diversity won a lawsuit requiring the USFWS to make a new finding by September 30, 2010 on whether listing splittail as threatened or endangered is warranted. The possible listing of splittail in 2010 is unlikely to affect the 2010 dredging season, but could affect the 2011 season.
Two species of lamprey are known to occur in the project area: Pacific lamprey (Entosphenustridentata) and river lamprey (Lampetra ayresii). Though Western brook lamprey (Lampetra richardsoni) and Kern brook lamprey (Lampetra hubbsi) may be present in the Delta, Brown and Moyle (1993) described both species as utilizing higher elevation portions of the San Joaquin River If either species is present in the project area, it is more likely the western brook lamprey as this species is known to inhabit larger river systems than the Kern brook lamprey. Although not currently protected under ESA or CESA, these species are recognized by USFWS and others (Moyle 2002, Goodman et al. 2009) as species that require greater conservation efforts. Lamprey have been encountered during each year of the study in both the fish community and entrainment samples.
All plans and reports stemming from this monitoring program since its inception are now available through a link from the following web address: http://www.mari-gold.biz.
Mari-Gold Environmental Consulting Inc. Page 4
2 Introduction This document provides a description of the fourth year of fish community monitoring and the fifth year of dredge entrainment monitoring conducted for the Sacramento District of the Corps through its contract with Ross Island Sand and Gravel Company (RISG). The Corps is authorized and required to maintain channel depth and levee integrity along the SRSC and the SSC. This monitoring program was mandated by the National Marine Fisheries Service (NMFS) through formal consultation with the Corps to:
� Ensure compliance with applicable environmental laws and regulations including Section 7 of the ESA and the Clean Water Act.
� Quantify the level of incidental take of special-status fish species.� Assess linkages between the fish community around the dredge reach and the numbers and
types of fish species entrained by the dredge. � Provide feedback to the Corps and other agencies to assess and implement adaptive
strategies designed to diminish negative environmental effects of the long-term dredging and dredged material management.
The Corps and NMFS have developed a ten-year programmatic approach to maintain the SRSC and SSC to their authorized depths via maintenance dredging and levee stabilization, as described in the biological opinions (BO) and supplemental documents for the shipping channels (NMFS 2006a,b). Although the timing of dredging projects in the Delta is regulated through area-specific dredging windows, NMFS recognized in these BOs that additional protections for ESA-listed fish (salmon, steelhead, and sturgeon) were needed. To that end, NMFS tasked the Corps with developing and conducting fisheries monitoring associated with Delta ship channel maintenance dredging. SWCA Environmental Consultants, Inc. (SWCA) designed and conducted this monitoring from 2006 through 2008. In 2009, a new contractor, Mari-gold Environmental Consulting Inc. (MEC), was selected by RISG to conduct this work. Jordan Gold, who provided the research vessel and much of the scientific expertise utilized by this monitoring program since its inception, founded MEC. The Corps and NMFS annually review the plans and reports for this project to determine that they are consistent with and appropriate for the requirements of the BOs (i.e., monitoring the effects of maintenance dredging and bank protection on fish in the SSC and SRSC).
This monitoring program was developed to meet the requirements of Conservation Measure 12 of the NMFS BO’s (2006a,b – Note: Conservation Measures 1 through 11 address dredging operations rather than fisheries monitoring). NMFS is required to ensure that project actions do not jeopardize the viability and existence of protected species (steelhead, salmon and green sturgeon) under their jurisdiction. The conservation measures developed through the ESA consultations augment the established in-water work windows that regulate the timing of Delta dredging projects. The established annual work windows for maintenance dredging are from June 1 through December 31 for the SSC, and between June 1 and February 27 for the SRSC (restricted to upstream areas in the Man-made Channel beginning December 1).
Following the collection of delta smelt during (this study’s) fish community monitoring in November and December 2007, the Corps’ Sacramento District requested clarification and guidance from the USFWS regarding incidental take of delta smelt during future maintenance dredging and monitoring activities. In August 2008, in order to minimize potential effects to delta smelt, the USFWS appended the deepwater ship channel maintenance dredging projects to their programmatic consultation on the issuance for Section 10 and 404 permits (Service File Number 1-1-04-F-0345). Under the appended

Mari-Gold Environmental Consulting Inc. Page 5
consultation, the normal in-water work window for protection of delta smelt was then further restricted from August 1 to November 30. Additionally, each week of the permitted dredging season a maximum of ten delta smelt may be collected during monitoring.
Work windows prescribed by the California Department of Fish and Game (CDFG) for the protection of longfin smelt were established due to their threatened status under CESA. These two work windows are: August 1 through October 31 in the SRSC from river mile (RM) 5-10 and RM 31-34 and in the SSC between RM 5-10; and August 1 through November 30, in the SSC between RM 31-32 and RM 36-40.
To convert the NMFS mandated monitoring requirements into testable assumptions. The following hypotheses (H1 and H2) were developed prior to the initiation of the 2006 sampling:
H1: Maintenance dredging of the SSC and SRSC will result in take of listed and other fishes through direct dredge entrainment.
H2: There is a correlation between presence of fish in the dredging areas and entrainment by the dredge.
H2a: Differential use of the water column will result in different entrainment levels among fishes present in the project areas; that is, demersal fish that are associated with the channel bottom (benthic and epibenthic species) will be entrained at higher levels than pelagic fish, which are associated with the water column.
This report presents the results of sampling activities conducted from August 16, 2009, through October 16, 2009. These activities consisted of fish entrainment sampling and fish community sampling. The entrainment monitoring was designed to quantify the level of incidental take of special-status and other (fish) species by the dredging operation. The fish community monitoring was designed to assess which species are present in dredge areas during active dredging and are therefore potentially vulnerable to entrainment by the dredging operation.
The monitoring requirements are focused on species that are listed as threatened or endangered under the ESA, due to the impact that these species can have on annual maintenance dredging of the SSC and SRSC. This report therefore includes information on the following federal special-status species that occur in the SSC and SRSC:
Sacramento River winter-run Chinook salmon (Oncorhynchus tshawytscha) – endangered Central Valley spring-run Chinook salmon (O. tshawytscha) – threatened Central Valley steelhead (O. mykiss) – threatened delta smelt (Hypomesus transpacificus) – threatenedgreen sturgeon (Acipenser medirostris) – threatened

Mari-Gold Environmental Consulting Inc. Page 6
It is important to note that special-status species designations are not limited to the federal ESA nor are they fixed. These monitoring activities are also accountable to provisions of CESA. The CESA-listed species relevant to these monitoring activities consist of:
longfin smelt (Spirinchus thaleichthys) – threateneddelta smelt (Hypomesus transpacificus) – endangered winter-run Chinook salmon (Oncorhynchus tshawytscha) – endangeredCentral Valley spring-run Chinook salmon (O. tshawytscha) – threatened
CDFG also maintains a list of fish Species of Special Concern. This list contains species that have experienced declines in population levels, have limited ranges, and/or are vulnerable to continuing threats of extinction. Some of these species have not yet been awarded any other state or federal status, and have not impacted this monitoring program as of yet. However, the authors feel that it is prudent to list them here due to the likelihood of these fish species having an impact on monitoring and/ or dredging during the lifetime of this monitoring study. These species include:
Chinook salmon – Central Valley fall / late fall-run (Oncorhynchus tshawytscha) ESU river lamprey (Lampetra ayresii)Pacific lamprey (Entosphenus tridentata)hardhead (Mylopharodon conocephalus)Sacramento splittail (Pogonicthys macrolepidotus)
River lamprey have been encountered in both shipping channels during each year that monitoring has been conducted. Pacific lamprey (an ammocoete) was encountered for the first time in 2009. This species, along with five other lamprey species endemic to California, were petitioned for listing under the ESA in 2003 but all were denied (USFWS 2004). Future petitions for CESA and/or ESA listing of these species are likely, with attendant implications for dredging and monitoring, should listing occur. This monitoring program has encountered lamprey during both fish community and entrainment sampling. The lamprey encountered in the fish community samples from 2006 and 2007 and fish entrainment samples from 2006, 2007, and 2008 have been confirmed as river lamprey – a rare species that has not been well studied. Lamprey specimens from 2008 sampling were submitted to the USFWS for ongoing genetic analyses. Nearly half of all lamprey encountered in 2008 were positively identified as river lamprey, with the remaining specimens identifiable only to the genus or family level. Twenty lamprey were encountered during 2009. Only one was vouchered for morphologic and genetic analyses and was determined to be a Pacific lamprey.
The 19 lamprey encountered in 2009 that did not undergo genetic analyses are assumed to be mostly, if not all, river lamprey. For 2009 and previous study years, all lamprey of genus Lampetra areconsidered as a single species: the river lamprey (L. ayresii). A possibility exists that Pacific lamprey, western brook lamprey and Kern brook lamprey have been among the lamprey previously encountered, and incorrectly identified due to the difficulty in resolving these fish to species level when in the ammocoete stage (such as most of the individuals encountered). Goodman et al. (2009) describes morphological characters that allow differentiation between Entosphenus and Lampetra in the field, though determining the species of Lampetra ammocoetes encountered in the future may still require genetic analysis.
There are several other native fishes that utilize the Delta channels and have been, or could be, encountered while conducting this monitoring program – some imperiled to one degree or another. These species have been awarded special status by several entities not yet mentioned, such as the

Mari-Gold Environmental Consulting Inc. Page 7
American Fisheries Society (AFS), the USFWS, and The World Conservation Union (IUCN). This information is continually refined and updated by CDFG and is reported in The California Natural Diversity Database (CNDDB) special animals list. CDFG also produces a frequently updated list of state and federally listed endangered and threatened animals of California. The July 2009 CNDDB and January 2010 CDFG lists were the latest available at the time of this writing. Both lists are available at: www.dfg.ca.gov/biogeodata/cnddb/.
This project has also encountered and documented non-native fish species that are currently a major focus of the Pelagic Organism Decline Study (PODS) due to their rapidly declining populations and their importance to the Delta ecosystem (IEP 2008). Though unable to receive special status (listing) due to the fact that they are not native fishes, their recent major population declines are of significant concern. Though encountering these species will not alter dredging or monitoring operations in the foreseeable future, the data from this annual monitoring program includes information about relative population levels of fish species in multiple Delta (channel) locations. This information is delivered to Interagency Ecological Program (IEP), CDFG, and other parties in order to satisfy permit requirements and for research interests. Use of this information on these and other species is an indirect benefit of this monitoring program. These species are:
threadfin shad (Dorosoma petenense)striped bass (Morone saxatilis)
Dredging and monitoring activities are affected by proposed listings, new listings, and indications of likely future listings of special-status species. The dynamic nature of listing status had a direct effect on dredging and associated monitoring activities in 2007 and 2008, due to changes in the CESA status of delta smelt and longfin smelt that resulted in shortening of the dredging windows. There were no impacts due to status change during 2009.
Recent state and federal petitions have requested that delta smelt be up-listed from threatened to endangered under CESA and ESA. California up-listed delta smelt to endangered status on March 4, 2009 (Final Statement issued on November 10, 2009). USFWS had not yet commented on the petition to up-list delta smelt from threatened to endangered status at the time of this writing, though they did announce the initiation of a five-year status review on March 24, 2009.
During 2007 fish community sampling, one delta smelt was encountered on November 21 in the SSC, and ten delta smelt were encountered between December 2 and December 12 in the SRSC. This led to a mandatory shift in dredging locations and then the suspension of remaining 2007 dredge operations in the SRSC. In 2008, dredging was started in the SRSC in August and finished in the SSC in November. Twenty-two delta smelt were encountered from August 6 to September 6 in the SRSC, and three were encountered on September 21 near the upstream end of West Island in the SSC. No delta smelt were found upstream of Antioch Bridge in the SSC from late September to late November 2008, when dredging operations were completed. No delta smelt were encountered during 2009 fish community or entrainment monitoring.
The California Fish and Game Commission enacted protections for longfin smelt in 2008, which was a CESA candidate species at that time. Incidental take of longfin smelt while conducting fish community monitoring was restricted to 150 juveniles and 150 adults for the entire year. Longfin smelt were accepted as threatened under CESA by the Commission on March 4, 2009. Federal protection of the longfin smelt was recently denied by the USFWS following review of the petition to list the longfin smelt under the ESA (April 9, 2009). The USFWS found that the San Francisco Bay-Delta longfin smelt did not qualify as a distinct population segment (DPS). The USFWS has initiated (April
Mari-Gold Environmental Consulting Inc. Page 8
9, 2009) a status review for the entire longfin smelt population from Alaska to California. No longfin smelt were encountered during 2009 fish community or entrainment monitoring.
This annual monitoring report is submitted to the Corps and CDFG as a reporting requirement for fish monitoring of federal ship channel maintenance dredging activities. Collection details of any ESA-listed fish is reported within 24-hours to the Corps Sacramento District’s Environmental Scientist and RISG’s Project Manager; subsequent notifications are then made by the Corps to the regulatory agencies of NMFS, USFWS, and/or CDFG. Additional requirements include reporting of sampling activities and ESA fish collections on a weekly basis to the ESA Reporting Website of IEP, a requirement for research projects conducted in the SF Bay-Delta region (CDFG 2008a). Resource agencies including NMFS, USFWS, and CDFG may access the IEP database for updated ESA catch reports. The license and revenue branch of CDFG requires an annual collection summary for review and renewal of state scientific collecting permits (SCP) held by the investigative biologists conducting the fish monitoring. The SCP collections summaries are submitted to Paul Roberts or Russ Bellmer at CDFG (Sacramento) and now require a review period of 28 weeks prior to renewal of permits. CDFG also requires reporting of all state Endangered, Threatened, and Special Concern species to the California Natural Diversity Database. All longfin smelt (California Code of Regulations - Longfin Smelt 2084 Regulation), and sturgeon collection data are sent to biologists at the Bay-Delta Branch of CDFG as detailed in specific measures of the SCPs.
This report describes fish species encountered at each dredging location and compares sites based on simple assessments of catch per unit effort (CPUE), species composition, and overall numbers of fish. Although species that do not have special status under federal law are outside the monitoring requirements for dredging in the SRSC and SSC, the sampling methods used for monitoring yielded information on these species. Since species status determinations are ongoing and any changes in status could affect dredging and monitoring activities, this report includes data on all species encountered. Comparisons with data from previous years are made when sufficient data are available. This report also discusses the efficacy of the monitoring methods, efforts to minimize sampling mortality, and adaptive management measures with suggestions for future monitoring.

Sacr
amen
to
Riv
er
Chan
nel
Man
-mad
e Ch
anne
l
Channel
Deep
American River
Dee
p
Water
Man-made ChannelScour PondLight 21Spud IslandLower Roberts Is.Windmill CoveUpper Roberts Is.Rough & Ready Is.Upper Turning Basin
Dredge Reach & DMP Locations
Sacramento
Spud IslanddAntioch
el
Wat
er
San Joaquin River
DMP Locations
Stockton
Rough &Ready Island
Figure 1. Project Area Map, Dredge Reaches, and DMP Sites Adapted from USACE - SF District, LTMS Program Map

Mari-Gold Environmental Consulting Inc. Page 10
3 Methods
3.1 Sampling Methods Overview
The sampling methods followed for fish community and entrainment monitoring during the 2009 SRSC and SSC maintenance dredging were those presented in the Fish Entrainment and Fish Community Monitoring Plan (FMP) for 2007–2008 (SWCA 2007). Methods were based on their appropriateness for sampling the dredging locations (i.e., dredging in deepwater mid-channel locations with water column depths greater than 20 feet). The methods were:
� Bottom trawling against the current, to monitor the fish community in the active dredge area of the shipping channels (the channel bottom), with water quality parameters measured in conjunction with bottom trawling.
� Entrainment monitoring (end of pipe) using the portable entrainment monitoring screen.
Timing of 2009 dredging operations did not extend beyond the approved work window. As a result, observational monitoring 24 hours a day aboard the dredge was not necessary as in 2006 and 2007.
All fish encountered in the bottom trawl or entrainment screen samples, with some exceptions, were counted and identified to the species level. Preserved lamprey specimens were shipped to USFWS taxonomy experts in Arcata, California, for inclusion in ongoing genetic studies and further species identification.
Fish were identified, counted, and classified by life history stage. A subset of each fish species was measured for length. As many individual fish as possible were released back to the water with minimal harm. Stressed fish, or fish species easily injured by trawling activities, were quickly counted and released without further processing. Gross body abnormalities, injuries, fin clips, or other markings were noted. Fish were sometimes vouchered for further assessments or due to permit requirements. Fish-eating bird and sea lion activity was closely observed while monitoring during daylight sampling. Bird congregations over open water often indicate fish presence, and feeding activity by birds in DMP sites is often an indicator of the presence of entrained fish or other prey organisms. Sea lion activity is often indicative of the presence of adult salmon or other large fish that are likely sea-lion prey.
Invertebrates were, in most cases, identified to species level, and their numbers were directly counted or estimated depending on species abundance.
3.2 Sampling Effort, Timing, and Sampling Locations
An overview map of the project area including the sampling locations associated with each dredge reach is provided in Figure 1. Location data and activity periods are also summarized in Table 1. Prior to the 2009 dredge season, RISG provided MEC with a tentative dredging schedule. The schedule included the approximate timing and location of each channel location (dredge reach) to be dredged. Sampling was conducted during every day of active dredging. In general, fish community and entrainment sampling were conducted on alternating days. Due to inherent uncertainty regarding the exact timing of active dredging, fish community sampling was initiated within 24-hours of when active dredging actually commenced. Entrainment sampling was usually conducted on the second day of

Mari-Gold Environmental Consulting Inc. Page 11
dredging at each dredge reach. Both types of sampling continued at each dredge reach until dredging at that reach was completed.
Table 1. SRSC & SSC 2009 Maintenance Dredging Locations
RiverChannel
Dredge Reach
Dredge Area (RM)
Excavated Dry
Material(cy)
Estimated Material
% of Slurry
Estimated Total Slurry
Volume(gal)
DMPSite
Time Frame
From To Start End
Sacramento Man-madeChannel 30.87 32.86 65,008 9.5 125,095,921 S-31 Aug 16 Aug 26
San Joaquin ScourPond 8.81 8.90 4,454 8.5 9,685,092 Scour
Hole Aug 28 Aug 29
San Joaquin Light 21Reach 11.65 12.22 35,734 10.0 64,964,412 McCormack
Pit Aug 31 Sept 5
San Joaquin SpudIsland 31.65 32.20 30,579 15.0 35,002,762 Roberts 2 Sept 11 Sept 14
San Joaquin Lower RobertsIsland
32.20 32.95 34,890 15.0 39,937,420 Roberts 2 Sept 14 Sept 17
San Joaquin WindmillCoveArea
33.62 34.09 30,153 12.5 42,636,342 Roberts 2 Sept 17 Sept 20
San Joaquin UpperRobertsIsland
34.66 36.72 100,624 10.0 182,934,432 Roberts 1 Sept 20 Oct 4
San Joaquin Rough & ReadyIsland
38.48 39.32 61,223 12.5 86,569,322 Roberts 1 Oct 5 Oct 11
San Joaquin UpperTurningBasin
40.08 40.64 28,894 15.0 33,073,999 Roberts 1 Oct 12 Oct 16
Total 391,559 619,899,702
The methods defined in the FMP were designed to sample as many diel/tidal regimes as possible. Consequently, sampling times were varied so that diurnal fish movements, as well as tidal elevation and river flow changes, would be reflected in the sampling results, and differences in species composition and entrainment based on diurnal or tidal rhythms might be assessed. A random sample design was not employed since it was necessary for entrainment monitoring to coincide with active dredging. Sampling was performed under a variety of light conditions. Twenty-seven total trawl surveys were successfully completed. Ten were conducted during low light or nighttime conditions. Twenty-seven entrainment surveys were performed and most occurred during daylight hours due to logistical, operational, and safety issues. Seven entrainment samples were successfully conducted in low light or nighttime conditions.
As listed in Table 1, a total of approximately 391,559 cubic yards of total dredged material was placed at DMP sites during 2009. Approximately 326,551 cubic yards were dredged in the SSC and 65,008 cubic yards in the SRSC. All material was dredged using RISG Dredge No. 7, a hydraulic cutter-head suction dredge with an 18-inch (inside diameter) discharge pipe. The total estimated overall slurryoutput from the dredge was 620 million gallons. The approximate average pumping rate varied by location from 10,275 gallons per minute at Scour Pond DMP site to 15,588 gallons per minute at Roberts 2 DMP site.
Mari-Gold Environmental Consulting Inc. Page 12
The mobile entrainment screen was used at all DMP sites for the first time in 2009. Effort levels for 2009 are summarized by monitoring method and presented in Tables 2 and 3. These tables present the level of effort attempted versus results achieved during both entrainment and trawl sampling. Entrainment sampling was disrupted on several occasions in 2009, usually the result of unexpected dredge shutdowns unrelated to fish monitoring activities. The goal for entrainment sampling was to sample at least 5 percent of the overall dredge output based on an expected average dredge run time of 20 hours per day. An overall total of 5.64 percent of the dredge output was sampled in 2009, representing a significant increase over previous years; 4.4 percent of overall dredged material was sampled in 2008, compared to 0.35 percent in 2007 and 0.37 percent in 2006. Rather than an increase in sampling effort, this increase is due to abandonment of the sampling cell method entirely in 2009, due to its inability to assess significant portions of the dredge output.
Trawl survey locations within each dredging reach were either directly upriver of the dredge during an outgoing (ebb) tide or directly downriver during an incoming (flood) tide. Trawl surveys, DMP sites, and corresponding dredge reaches are displayed in Figures 13 through 21. Unsuccessful trawl tows, experienced on twelve occasions in five different dredge reaches, were usually the result of large wood or other debris hung up in the net, preventing a full 500-meter tow. In these instances, the net was hauled in prior to completion of the 500-meter target distance. If the field staff determined that a trawl was unsuccessful, any associated data was noted in the database as unsuccessful and excluded from CPUE calculations and analyses. After unsuccessful trawls, further attempts were repeated until a successful sample was made, except when the trawl net was damaged beyond the ability to affect an on-board repair.
Table 2. 2009 Entrainment Monitoring Effort at DMP Sites
DMPSite
Dredge Reach
DateStart
DateEnd
SamplingDays
SamplingAttempts
MaterialType
Sampled Vol. (gal)
Dredge Slurry
Vol. (gal) Sample
%
S-31 Man-madeChannel Aug 17 Aug 25 5 5 Mud 6,190,680 125,095,921 4.95
Scour Hole * Scour Pond -- -- 0 0 Sand 0 9,685,092 0
McCormack Pit Light 21 Sept 1 Sept 5 3 4 Sand 4,292,682 64,964,412 6.61Roberts 2 Spud Island Sept 12 Sept 14 2 2 Mud 2,692,860 35,002,762 7.70Roberts 2 Lower Roberts
Island Sept 16 Sept 16 1 1 Mud 1,988,568 39,937,420 4.98
Roberts 2 Windmill Cove Area Sept 18 Sept 18 1 1 Mud/Silt 1,431,480 42,636,342 3.35
Roberts 1 Upper Roberts Island Sept 20 Oct 3 8 8 Mud/Silt 8,791,632 182,934,432 4.81
Roberts 1 Rough & ReadyIsland Oct 5 Oct 11 4 4 Mud 6,569,674 86,569,322 7.49
Roberts 1 Upper Turning Basin Oct 14 Oct 15 2 4 Mud 2,974,521 33,073,999 8.99
Total 26 29 34,932,127 619,899,702 5.64
* Scour Hole dredge operations less than 24 hours total duration. Monitored fish community by otter trawl sampling only, entrainment screen monitoring not conducted.

Towing Warp
Otter Board
Cod End
Float
Ground G ear
Drawn by Robin Amaral (Not to Scale)
Figure 2. Otter Trawl Net Diagram
)Source: C oonamessett Farm, 2001

Mari-Gold Environmental Consulting Inc. Page 14
Table 3. 2009 Fish Community Monitoring Effort by Dredging Reach
Dredge Reach RiverChannel DMP Site
Time Frame SamplingDays
Trawl Tows DistanceTowed (m) * Start End Attempted Successful
Man-made Channel SRSC S-31 Aug 16 Aug 26 6 17 16 9,480
Scour Pond/Antioch SSC Scour Hole Aug 28 Aug 29^ 1 5 5 2,760
Light 21 SSC McCormack Pit Aug 31 Sept 4 3 15 15 7,295
Spud Island SSC Roberts 2 Sept 12 Sept 15 3 14 9 4,917 Lower Roberts Island SSC Roberts 2 Sept 17 Sept 19 2 6 5 3,046 Windmill Cove Area SSC Roberts 2 Sept 21 Sept 21 1 5 5 3,004
Upper Roberts Island SSC Roberts 1 Sept 23 Oct 4 5 18 16 8,652
Rough & Ready Island SSC Roberts 1 Oct 6 Oct 12 4 20 20 9,621
Upper Turning Basin SSC Roberts 1 Oct 14 Oct 16 2 7 5 2,047
Totals: 27 107 96 50,822
* Successful trawl tows only ^ Night sampling began night of Aug 28 and ended early morning of Aug 29
3.3 Fish Community Sampling
Fish community sampling followed all relevant regulations and protocols to ensure ESA and CESA compliance, prevent accidents, and avoid in-channel obstructions. These practices are summarized below. Required federal and state scientific research permits were obtained from CDFG and the IEP through IEP Program Element Number 2009-113. Prior to the onset of the 2009 dredge season, CDFG wardens were notified of the intended collection schedule and planned collection locations. Notification requirements for ESA-listed species contact followed those in Appendix F of the FMP (SWCA 2007) and included weekly reporting through the IEP website. Communication with the dredge was maintained on fish community sampling days through use of VHF marine band radio or cell phone to ensure that the timing, methods, and location of trawling efforts did not hinder or compromise the dredge’s operations or endanger personnel. Other information exchanged included vessel traffic, tidal phase, and any other important details concerning the sampling effort. An additional VHF radio monitored USCG and Vessel Traffic Information channels for the duration of surveys. The channel bottom in each dredge location was briefly surveyed using sonar and National Oceanographic and Atmospheric Administration charts to attempt to identify and avoid potential obstructions that might foul the net.
Fish community sampling was conducted up current of the working dredge, in the main navigation channel. An otter trawl, which is a semi-balloon type shrimp and fish trawl, was fished on the riverbed to target fish species assumed to be most susceptible to entrainment by the dredge. Each otter trawl used for 2009 sampling was a green, funnel-shaped net constructed with a 7-meter-long floating head-rope, a weighted foot-rope, and otter-doors attached just ahead of the net mouth to spread the net (Figure 2). The mouth of each trawl net used in 2009 measured approximately 1.25 by 7.9 meters with the body stretched; the mesh of each trawl net was 3 centimeters square, with a cod-end inner liner of 1 centimeter (stretched) mesh. The inner liner was composed of a soft nylon delta-style weave designed to be protective of fish scales and slime. The volume of water fished was determined as the product of net mouth area and overall linear distance towed, under the assumption that the mouth
Mari-Gold Environmental Consulting Inc. Page 15
area during a tow is 80 percent of the maximum stretched mouth area. The stretched mouth area was calculated as a rectangular shape totaling 9.875 square meters, with an 80 percent sampling size of 7.9 square meters.
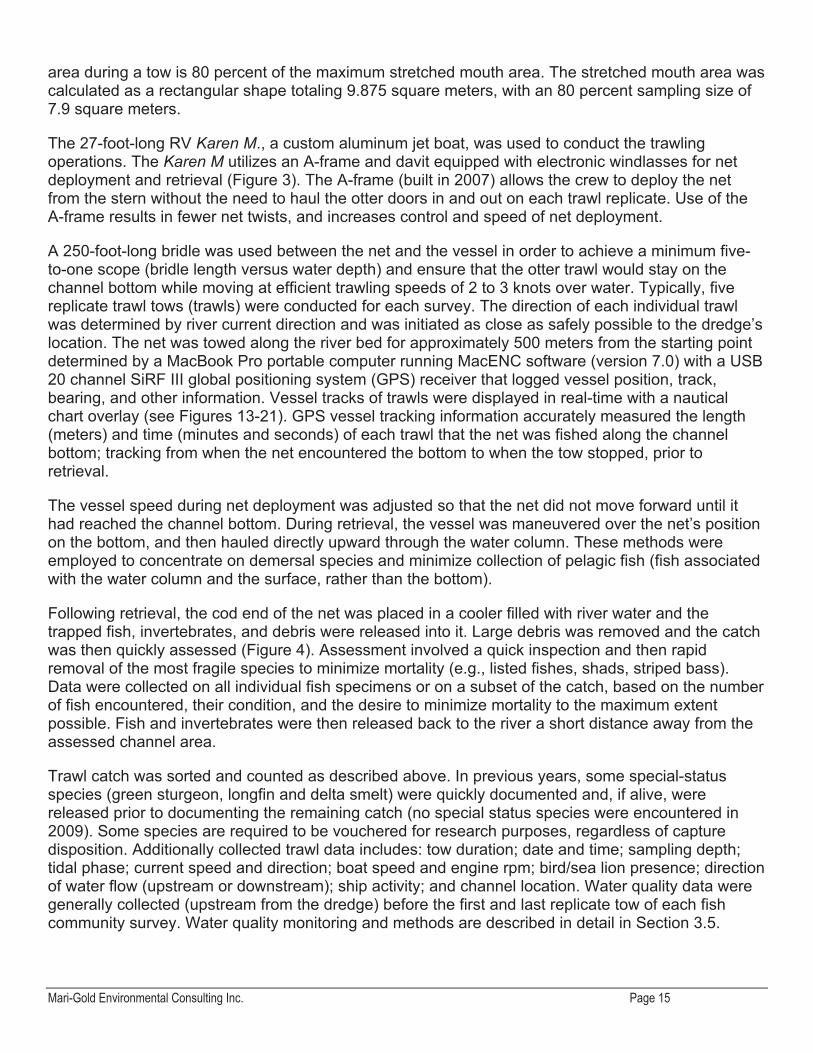
The 27-foot-long RV Karen M., a custom aluminum jet boat, was used to conduct the trawling operations. The Karen M utilizes an A-frame and davit equipped with electronic windlasses for net deployment and retrieval (Figure 3). The A-frame (built in 2007) allows the crew to deploy the net from the stern without the need to haul the otter doors in and out on each trawl replicate. Use of the A-frame results in fewer net twists, and increases control and speed of net deployment.
A 250-foot-long bridle was used between the net and the vessel in order to achieve a minimum five-to-one scope (bridle length versus water depth) and ensure that the otter trawl would stay on the channel bottom while moving at efficient trawling speeds of 2 to 3 knots over water. Typically, five replicate trawl tows (trawls) were conducted for each survey. The direction of each individual trawl was determined by river current direction and was initiated as close as safely possible to the dredge’s location. The net was towed along the river bed for approximately 500 meters from the starting point determined by a MacBook Pro portable computer running MacENC software (version 7.0) with a USB 20 channel SiRF III global positioning system (GPS) receiver that logged vessel position, track, bearing, and other information. Vessel tracks of trawls were displayed in real-time with a nautical chart overlay (see Figures 13-21). GPS vessel tracking information accurately measured the length (meters) and time (minutes and seconds) of each trawl that the net was fished along the channel bottom; tracking from when the net encountered the bottom to when the tow stopped, prior to retrieval.
The vessel speed during net deployment was adjusted so that the net did not move forward until it had reached the channel bottom. During retrieval, the vessel was maneuvered over the net’s position on the bottom, and then hauled directly upward through the water column. These methods were employed to concentrate on demersal species and minimize collection of pelagic fish (fish associated with the water column and the surface, rather than the bottom).
Following retrieval, the cod end of the net was placed in a cooler filled with river water and the trapped fish, invertebrates, and debris were released into it. Large debris was removed and the catch was then quickly assessed (Figure 4). Assessment involved a quick inspection and then rapid removal of the most fragile species to minimize mortality (e.g., listed fishes, shads, striped bass). Data were collected on all individual fish specimens or on a subset of the catch, based on the number of fish encountered, their condition, and the desire to minimize mortality to the maximum extent possible. Fish and invertebrates were then released back to the river a short distance away from the assessed channel area.
Trawl catch was sorted and counted as described above. In previous years, some special-status species (green sturgeon, longfin and delta smelt) were quickly documented and, if alive, were released prior to documenting the remaining catch (no special status species were encountered in 2009). Some species are required to be vouchered for research purposes, regardless of capture disposition. Additionally collected trawl data includes: tow duration; date and time; sampling depth; tidal phase; current speed and direction; boat speed and engine rpm; bird/sea lion presence; direction of water flow (upstream or downstream); ship activity; and channel location. Water quality data were generally collected (upstream from the dredge) before the first and last replicate tow of each fish community survey. Water quality monitoring and methods are described in detail in Section 3.5.
Figure 3. Karen M Research Vessel

Figure 4. Examples of Fish Community Survey Tools and Methods
Mari-Gold Environmental Consulting Inc. Page 18
Trawl survey and water quality data was entered into the customized MS Access database running on a second MacBook Pro portable computer as the information was acquired. Large catches of fish during individual trawls required the use of paper forms (Appendix C) to document the catch as the need to minimize fish mortality outweighed the need to document the data electronically. When this occurred, the catch data was entered into the database at a later date.
3.4 Entrainment Sampling
Entrainment monitoring methods were selected based on the likelihood of their success to:
� Avoid and minimize take (damage or mortality) to entrained fish, particularly ESA-listed species.
� Quantitatively sample the dredge disposal stream, which is not uniform throughout the discharge pipe cross-section.
� Avoid or minimize dredge shutdowns or head loss resulting from sampling.
Two entrainment monitoring alternatives were presented in the 2007-2008 FMP (SWCA 2007). Both alternatives were modifications of methods that have been used to successfully monitor fish entrainment in Pacific Northwest dredging projects. The two alternatives were the sampling cell method and the collection basket (screen) method. In 2008, the prototype mobile entrainment screen was completed and used at all DMP sites, except the Bradford and Decker Island sites. In 2009, all of the entrainment sampling was conducted using the mobile entrainment screen. It is the intention to use this device at all sites during future monitoring efforts, as this prototype has proven its efficacy during the last two sampling seasons. However, there are DMP sites with access issues that may make it difficult to utilize the screen. If there are active sites in future years where the mobile entrainment screen cannot be used, then the sampling cell method will again be utilized at these sites. Information on this sampling cell method is only briefly presented in this year’s report, as the method was not used during 2009. However, interested parties can read the 2006-2008 annual reports or FMPs for more information on this method. The mobile entrainment screen system addresses goals stated above in the following ways:
� The grain size of the majority of dredged material is small enough to pass through the screen while fish and invertebrates are retained. Organisms not apparently damaged by their passage through the dredge are easily collected and returned alive to the shipping channel.
� The entire output of the dredge is passed over the screen, effectively sampling all cross-sections of the discharge pipe.
� Operating the valve that switches the dredge discharge from the main DMP pond to the screen does not normally require any action by the dredge, thus minimizing dredge shutdowns or head loss resulting from sampling.
3.4.1 Sampling Cells The sampling cell method used for fish entrainment monitoring was based on a method employed by Buell (1992). Entrainment monitoring with the sampling cell method involved discharge of the dredge slurry into a relatively small earthen cell isolated from the overall DMP site pond by a temporary berm. Sampling cells used prior to 2009 varied in size from 0.055 acres at the SRSC Sandy Beach DMP site to 0.57 acres at the SSC Roberts 1 DMP site. Overall sampling cell geometry, size, and placement were determined by the geography of the DMP site, its storage capacity, and the logistics of material placement. Due to inherent inefficiencies of the sampling cell method, only a small
Mari-Gold Environmental Consulting Inc. Page 19
percentage of the dredge’s overall output was sampled this way: 0.35 percent and 0.62 percent in 2007 and 2008, respectively. Use of the mobile sampling screen allows an order of magnitude more dredged material to be assessed than with the sample cell method, given a similar level of effort. Due to the increased efficiency of the mobile entrainment screen, sampling cells will only be used for future monitoring if DMP sites preclude the use of the mobile screen due to access issues.
3.4.2 Mobile Entrainment Screen The prototype mobile entrainment screen system was used at most of the DMP sites during the 2008 monitoring season. This system was used with the project goals of retaining all life stages of entrained organisms, except larval fishes, while also allowing large volumes of sediment to pass through the mesh. It achieved these goals last season (SWCA 2009) and so was also used at all sites during the 2009 maintenance dredging season.
The screen was built on trailer axles, enabling transport by road from site to site. Once on site, the screen was positioned in a stable location appropriate for discharge of the dredged material (Figure 5). The dredge output pipe was connected to the top of the screen with a Y-valve (Figure 6) operated by the dredge’s on-shore (fill) crew. When the dredge output was not directed to the screen, it flowed directly to the DMP site pond. When in use, the slurry passes over the screen to allow sorting and observation of all entrained materials and organisms that do not pass through the screen. Track hoes and or bulldozers were used to clear material below the screen at DMP sites where necessary due to large grain size of material, lack of sufficient elevation for material flow, or other logistical considerations.
An entrainment survey began by switching the Y-valve to direct the entire dredge discharge onto the screen. The length of time that the valve directed flow to the screen was used to calculate the sampled percentage of dredge output. Two biologists trained in handling ESA-listed fish were stationed on either side of the screen to observe and collect organisms as the slurry stream filtered through the screen mesh. Dredged material was allowed to flow over the screen until the screen clogged with material, the sampling period expired, or the dredge itself shut down. Small pumps, with intakes in the river, supply the screen with pressure water to wash the accumulated material and organisms that do not pass through the 3/8-inch diameter screen. Large rubber squeegees, small nets, and various rakes and shovels are also employed to keep the screen clear, thereby allowing longer periods of continuous monitoring of the discharge stream without directing the flow back to the main DMP pond. After the accumulated material is sorted, it is swept off the end of the screen.
The ability of the screen to pass dredged material through the mesh is dependent on the grain size of the dredged material. A general description of the dredged material at each dredge location in 2009 is provided in Table 2. For the most part, the dredged sediments consist of sand and silt sized particles. However, a high degree of overall variation in grain size exists among dredge reaches as well as within each dredge reach. The commonly found “U” shape of the channel in cross-section can explain the within-channel variation in sediment load experienced on the entrainment screen. The dredge does not vary the height of the cutter head as it sweeps across the bottom, effectively dredging more material from each side of the channel due to its “U” shape. This results in pulses of heavy sediment loads on the screen corresponding to the dredge being near the side of the channel that are then interspersed with lighter sediment loads combined with more shell and debris from the surface.
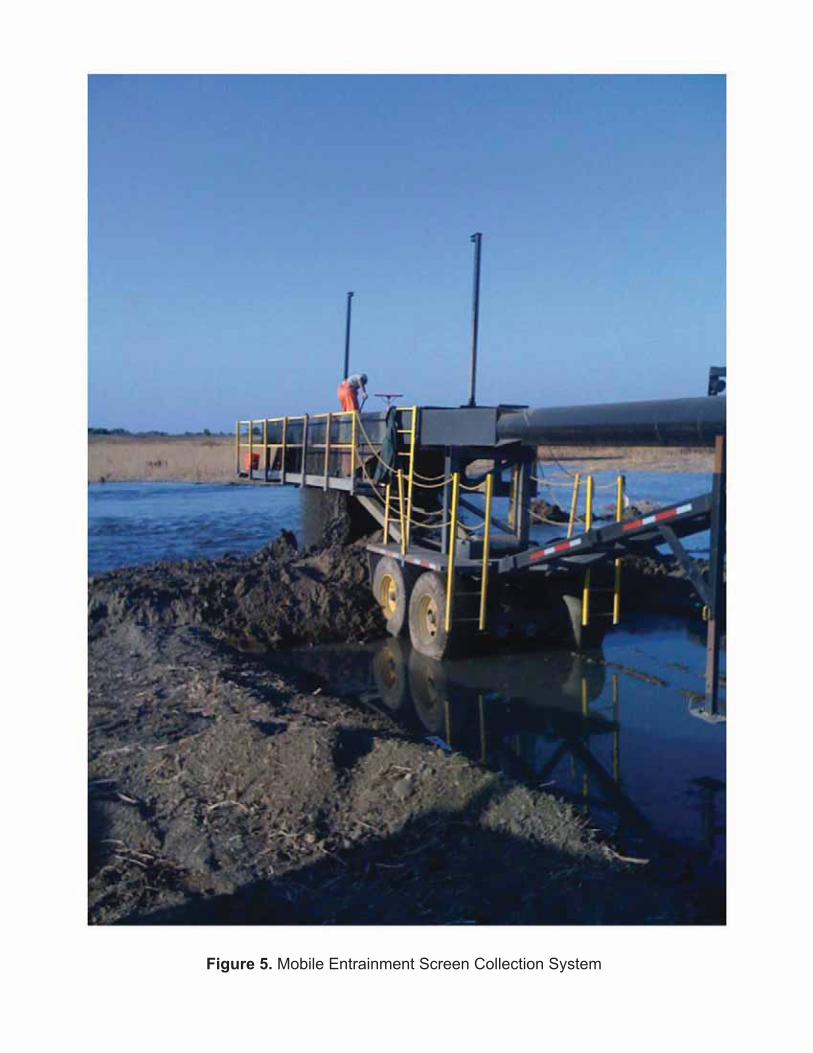
Figure 5. Mobile Entrainment Screen Collection System

.)
Figure 6. Photographs of Discharge Pipeline Y-valve

Mari-Gold Environmental Consulting Inc. Page 22
There are vast shoals of Asian clams (Corbicula fluminea) in many locations in both channels, with wide variation in shell size and live to dead (empty shell) clam ratio. All but the smallest of the shells are retained by the screen. Many locations also have a percentage of larger grain size sediments in addition to the predominant sand or silt, ranging from pea gravel to large rock. Trash, bones, clay balls, golf balls, fishing gear and other items are among the things that do not pass through the screen. In 2009, more than in previous years, Brazilian water weed (Egeria densa) was very common among the retained material.
All of the material retained by the screen was sorted through to determine and document what organisms were present. This process could be completed without diverting the material flow back to the main DMP pond as long as the grain size was appropriate and the percentage of retained material to organisms was low. When this process could not be completed because the grain size was inappropriate or the percentage of retained organisms was high (example shown in Figure 7), the flow was diverted until the screen was cleared.
High dredge pumping rates also overwhelmed the screen on occasion during 2009, generally when the dredge was working very close to the DMP site and using a short discharge pipe. When this occurred, it was usually only for a small but significant portion of the dredge’s swing across the channel bottom. These periods were timed, and not counted as sampling time, as any entrained organisms could have been carried off the end of the screen by the high flows and undocumented.
The screen surface is 20 feet long by 6 feet wide. Modifications to the prototype screen were made during the 2008 season to:
� Maximize the length of time the screen could be operated without powering down the dredge. � Prevent erosion under the axles. � Prevent splashing over the sides of the screen box. � Replace the mesh style screen with punched steel plate to minimize loss of small organisms,
reduce debris clogging, and increase survival of entrained fish.
The 3/8-inch woven wire mesh screen that was initially used during 2008 monitoring was replaced with 3/8-inch punch-hole steel plate, with an effective open area of 51 percent (Figure 8). Thepunched plate did not clog as quickly as the woven wire mesh and remained in use throughout 2009. In addition to clogging less quickly, the punched plate is smoother and easier to clear. It appears to be more fish friendly as well, as the entrained fish slide easily along the smooth plate, rather than bumping over wire-mesh. Additional improvements to the screen were suggested in the 2008 Fish Monitoring Report (SWCA 2009) and should be incorporated prior to initiation of sampling in 2010. These improvements are further discussed in the recommendations section of this report.
All fish either retained by the screen or observed passing through it were documented (a few lamprey and gobies were observed but not netted before escaping). Both live and dead retained fish were collected, examined, measured, and then released back into the river or vouchered for further examination.
3.5 Water Quality Monitoring
In situ water quality data were collected from the surface and near bottom twice during each trawl survey event, generally prior to the first and after the final trawl replicates of the day. Measurements were made and collected using a Horiba U-52 portable water quality meter (Figure 9). Parameters

Mari-Gold Environmental Consulting Inc. Page 23
measured included water temperature, dissolved oxygen (DO), pH, conductivity, turbidity, and salinity. The comparative measure of percent DO was later calculated from the direct DO (ppm) and temperature measures using a nomogram (Hutchinson in Bell 1991). Water quality readings were made within the same channel area as the trawl surveys.
3.6 Reporting, Data Management, Quality Assurance and Quality Control
3.6.1 Fish Entrainment Overall entrainment rates were estimated for each species by extrapolating from the numbers of entrained fish per gallon of dredge slurry sampled, to the total number of gallons of slurry deposited at each DMP site. Pumping rate and volume information were provided by RISG. Conversion from dry dredged material amount to end of pipe slurry volume was made using the RISG provided estimate that final deposited material comprised 8.5 percent to 15 percent of total slurry volume per DMP site.
Entrainment rates for specific species were extrapolated for each location where entrainment occurred during 2009 monitoring. This data should be assessed cautiously considering the small percentage of dredge output used to calculate the overall entrainment rates. The overall percentage of dredged sediment from both shipping channels that was sampled in 2009 was 5.64 percent, versus 4.4 percent in 2008 and 0.35 percent in 2007.
3.6.2 Fish Community Sampling Relative population abundance by species was assessed by simply ranking each species based on numbers of individuals encountered for: each sampled location, each channel, and both channels combined. The CPUE was determined by comparing numbers of individual fish caught to distance trawled. Mean CPUE for a survey was derived from the mean average of all successful trawl replicates for that day’s trawl survey.
3.6.3 Mortality Estimation Percent mortality among fish encountered during fish community sampling and fish encountered during entrainment sampling was calculated by comparing the observed or estimated mortality for each species to the total number of individuals of that species that were encountered. Mortality numbers were estimated in large trawl catches. It is possible that some fish initially counted as mortalities actually recovered after release. It is also likely that an unknown number of fish that appeared healthy at release subsequently died due to unobserved injury, predation or stress. A small number of fish were vouchered for further examination, resulting in immediate mortality of these individuals. Several adjustments to the collection and data acquisition methods designed to reduce mortality in future collections are discussed in the adaptive management and recommendations portions of the discussion section of this report.
3.6.4 Data Management Data were documented in the field on portable computers directly into the Dredge Monitoring Database created with MS Access 2003 (upgraded in 2009 to MS Access 2007), and on paper data sheets. This database was created in 2006 to provide a streamlined data entry and management system for this study. This relational database allows sizeable amounts of information to be entered, stored, managed, verified, analyzed, and retrieved. It also provides a common framework for

Mari-Gold Environmental Consulting Inc. Page 24
managing and analyzing the information from this multi-year project. The database stores information on aquatic organisms potentially vulnerable to impacts of dredge operations and provides analytical tools to assess the data based on CPUE, species composition, and overall number of fish.
3.6.5 Quality Assurance and Quality Control The MS Access database for the project provides structured, data entry forms for consistent data collection on field laptop computers. These entry forms restrict the type of information being entered into the database through focused user inputs and menus.
In addition to focused inputs and menus to control data entry, MS Access has user restrictions that provide a safeguard against multiple editors manipulating and changing the same tables and fields. These safeguards provide checks to ensure database tables and relationships are not compromised. Regular database backups were made to an external computer storage drive and copied to an additional project computer to further ensure integrity of collected data. Field crews were trained on the data collection forms before monitoring or sampling was carried out. Waterproof paper data collection forms continued in use for data verification purposes, foul weather/rough conditions, and for efficiency reasons in the case of specimen data collection. During 2009, approximately ten percent of the physical and water quality survey information was collected on paper forms providing a means to directly cross check duplicate data inputs. Few transcription errors were identified and corrected through this data verification process. Field crews made daily checks of the database to ensure accurate collection when redundant paper copies were not collected - an additional QA/QC measure specified in 2007–2008 FMP (SWCA 2007). Project biologists responsible for collecting the data checked database outputs.
As in past years, specimen data from each sampling event (species, length, anomalies, developmental stage, and disposition) were collected on waterproof paper field forms, because rapid data collection was often required when large numbers of fish and invertebrates were encountered in wet/dusty sampling conditions. These data were later entered into the MS Access database. Individual trawl replicates that had few specimens were entered directly into the database and checked for accuracy prior to leaving the survey location. Sample paper data entry and database forms are presented in Appendix C. Original field data sheets are archived at the MEC office in Canby, Oregon.
Vessel location while trawling was logged at 15-second intervals using GPS and a portable Macintosh computer running MacENC navigation software (V 7.0). The start and stop times and distance of individual vessel tracks from each trawl location were directly recorded into the MS Access database to document trawl distance and duration. The vessel tracks were checked to ensure accuracy and identify anomalies that could skew the data. Vessel tracks are documented in this report using MacENC GPX NavX software to display the tracks overlaid on raster scanned versions of NOAA navigation charts. In conjunction with this printed report, kml-formatted files from Google Earth are available at http://www.mari-gold.biz and provide an interactive display of the 2009 trawl survey locations and DMP sites using satellite imagery.

Figure 7. Example of Substrate Debris Collected during Entrainment Screen Collection

Perforated Round Screen Woven Wire Screen
Figure 8. Two Types of Screen Used for Entrainment Screen Sampling in 2008
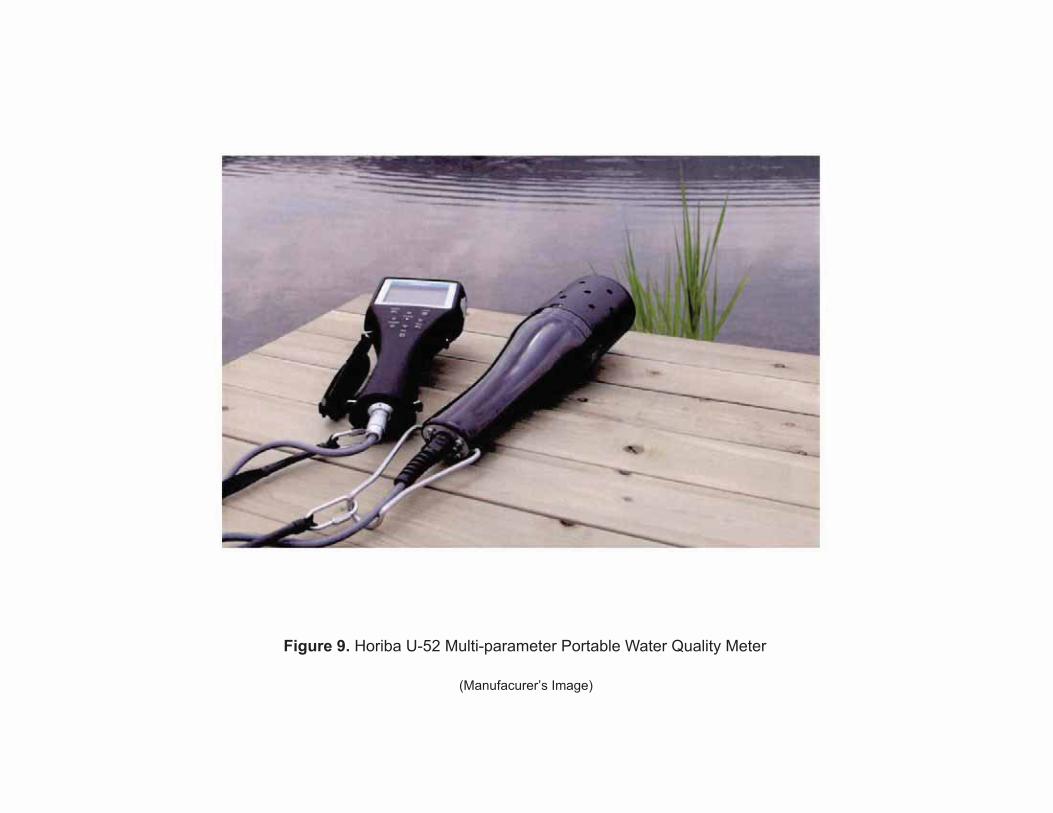
Figure 9. Horiba U-52 Multi-parameter Portable Water Quality Meter
(Manufacurer’s Image)
Mari-Gold Environmental Consulting Inc. Page 28
4 Results
4.1 Fish
A total of 6,643 individual fish representing 24 species were encountered and identified during the fish community and entrainment sampling events in 2009 (Table 4). 403 of these fish were encountered during entrainment monitoring, accounting for 6.06 percent of the total number of fish encountered overall during 2009 sampling. The rest of the fish were encountered during fish community monitoring. The fish encountered during entrainment monitoring were collected while assessing 5.4 percent of the overall output of the dredge. Extrapolated totals for each entrained species observed are presented further on in the results section of this document.
Of the 24 species encountered, 16 were introduced and 8 were native. Native fishes made up 0.66 percent of the total number of fish encountered. The three most abundant species in order of abundance were white catfish, striped bass, and threadfin shad. All three species are non-native and accounted for 82.84 percent of the total.
Lampreys were the most common native fish encountered during 2009 sampling (n = 20), all of which were encountered during entrainment sampling. Several of the individuals were clearly identified as lamprey, but eluded capture and escaped through the entrainment screen. All but one of the live encountered lampreys were released back to the river channel as a conservation measure. The retained ammocoete was vouchered and was later positively identified through morphological analysis as a Pacific lamprey. This was the first positively identified Pacific lamprey encountered during this study.
Mari-Gold Environmental Consulting Inc. Page 29
Table 4. Ranked List of Fish Encountered from All 2009 Sites from Trawl & Entrainment Monitoring
Rank Percent Number Common Name Genus Species Origin Demersal / Pelagic Rule: Status
1 52.46 3,485 white catfish Ameiurus catus Introduced Demersal 2 21.29 1,414 striped bass Morone saxatilis Introduced Pelagic 3 9.09 604 threadfin shad Dorosoma petenense Introduced Pelagic 4 4.88 324 channel catfish Ictalurus punctatus Introduced Demersal 5 4.40 292 shimofuri goby Tridentiger bifasciatus Introduced Demersal 6 3.70 246 American shad Alosa sapidissima Introduced Pelagic 7 2.06 137 wakasagi Hypomesus nipponensis Introduced Pelagic 8 0.62 41 yellowfin goby Acanthogobius flavimanus Introduced Demersal 9 0.50 33 shokihaze goby Tridentiger barbatus Introduced Demersal 10 0.29 19 lamprey Lampetra spp. Native Demersal *11 0.15 10 warmouth Lepomis gulosus Introduced Pelagic 12 0.11 7 starry flounder Platichthys stellatus Native Demersal MSA: MEC-EFH 12 0.11 7 white sturgeon Acipenser transmontanus Native Demersal IUCN: LC 13 0.06 4 splittail Pogonichthys macrolepidotus Native Pelagic DFG: SSC; IUCN: EN 13 0.06 4 bluegill Lepomis macrochirus Introduced Pelagic 13 0.06 4 brown bullhead Ameiurus nebulosus Introduced Demersal 13 0.06 4 prickly sculpin Cottus asper Native Demersal 14 0.03 2 common carp Cyprinus carpio Introduced Demersal 15 0.01 1 black crappie Pomoxis nigromaculatus Introduced Pelagic 15 0.01 1 largemouth bass Micropterus salmoides Introduced Pelagic 15 0.01 1 Pacific lamprey Entosphenus tridentata Native Demersal AFS:VU15 0.01 1 redear sunfish Lepomis microlophus Introduced Pelagic 15 0.01 1 Sac. pikeminnow Ptychocheilus grandis Native Pelagic 15 0.01 1 tule perch Hysterocarpus traskii Native Pelagic
Total Fish: 6,643 Native Composition: 0.66%, Native Species: 8, Introduced Species: 16 *Unidentified individuals of genera Lampetra are treated as one species under common name lamprey. Likely species and respective status listings include: western brook lamprey (Lampetra richardsoni); river lamprey (Lampetra ayresii) AFS:VU & DFG:SSC; and Kern brook lamprey (Lampetra hubbsi) AFS:TH; DFG:SSC; IUCN:NT.;
* Status Key
ESA: federal Endangered Species Act FPT Federally proposed for listing as Threatened FT Federally listed as Threatened
CESA: California Endangered Species Act ST State-listed as Threatened SE State-listed as Endangered
CDFG: California Dept of Fish and Wildlife SSC Species of Special Concern MSA: Magnuson-Stevens Sustainable Fisheries Act
MEC-EFH Marine Estuarine Composite – designated Essential Fish Habitat
IUCN: International Union for Conservation of Nature
EN Endangered LC Least Concern
AFS: American Fisheries Society TH Threatened VU vulnerable

Mari-Gold Environmental Consulting Inc. Page 30
Including fish that this monitoring is mandated to assess, native fish captured during 2009 sampling continued to comprise a very small percentage of fish encountered. There are also several species of native fish that were encountered in previous years but were absent this year. Those species are: green sturgeon, longfin smelt, delta smelt, Sacramento blackfish (Orthodon microlepidotus), and Pacific staghorn sculpin (Leptocottus armatus). Some of the species encountered during 2009 community sampling are shown in Figure 10.
One juvenile largemouth bass represented the only new fish species captured in 2009 that had not been encountered in prior years’ monitoring. By comparison, new non-native fish species captured in 2008, but not in 2007, consisted of: shokihaze goby, wakasagi, warmouth, bluegill, bigscale logperch (Percina macrolepida), and Mississippi silverside (Menidia beryllina).
The most common fish in the trawl monitoring was the white catfish (55.02%). However, the most common fish observed in entrainment monitoring was the shimofuri goby (64.76%). Shimofuri goby comprised only 0.5 percent of the trawl monitoring samples.
Introduced species of fishes have dominated the fish community samples from almost all locations during all years of this study (2006-2009). The top five species (white catfish at 57.33%, threadfin shad at 15.67%, striped bass at 9.61%, American shad at 6.96% and channel catfish at 4.67%) are all introduced and together comprise 94.24 percent of the catch. SRSC and lower SSC locations continue to have higher percentages of native fish than upper SSC locations. Figure 11 graphs the percentage of native fishes encountered in each dredge reach during 2009 fish community surveys.
4.1.1 Special-status Species Eight species of native fish were encountered in 2009, compared to ten species in 2008, six in 2007, and nine in 2006. Green sturgeon have not been encountered since 2006. Longfin smelt were encountered in 2006, 2007, and 2008, and delta smelt were encountered in 2007 and 2008, but neither was encountered in 2009. Table 41 provides location and additional information for these encounters. CNDDB status information for all special status species encountered in 2009 is provided in Table 4. Additional status and life history information for these species and all other special-status species that use the DWSCs during some or all of their life cycle is provided in Appendix A.
No state or federally threatened or endangered fish was encountered during either fish community or entrainment sampling during 2009, as has occurred during all the previous years of this study.
Starry flounder was the twelfth most commonly encountered fish species in 2009 and the second most common native fish. Starry flounder is a special-status species under the Magnuson-Stevens Fishery Conservation and Management Act, as an estuarine composite species with essential fish habitat within the project area as described in Amendment 11 of the Pacific Coast Groundfish Fisheries Management Plan (PFMC 1998).
4.2 Entrainment Monitoring
Entrainment monitoring was conducted with the mobile entrainment screen at all sites for the first time in 2009, dispensing with the sample cell method due to its inability to sample significant amounts of the dredge’s output. A total of 403 fish were captured using the entrainment screen while assessing 5.64 percent of dredge output and thus achieving the project goal of sampling at least 5 percent of dredge output. Table 5 presents a ranked list of all fish encountered during 2009 entrainment monitoring, while Tables 6 and 7 present the list of fish segregated by river channel. Shimofuri goby

Mari-Gold Environmental Consulting Inc. Page 31
were the most commonly entrained species in 2009, comprising almost 64.76 percent of the entrained individuals, and white catfish and channel catfish were second and third. In 2008, channel catfish and white catfish were first and second, while shimofuri goby were a distant seventh, comprising only 2.16 percent of all fish encountered.
Table 5. Ranked List of Fish Encountered From All Sites During 2009 Entrainment MonitoringRank Percent Number Common Name Genus Species Native
1 64.76 261 shimofuri goby Tridentiger bifasciatus Introduced 2 12.90 52 white catfish Ameiurus catus Introduced 3 7.44 30 channel catfish Ictalurus punctatus Introduced 4 4.96 20 shokihaze goby Tridentiger barbatus Introduced 5 4.71 19 lamprey Lampetra *spp. Native 6 2.98 12 yellowfin goby Acanthogobius flavimanus Introduced 7 0.50 2 prickly sculpin Cottus asper Native 8 0.25 1 American shad Alosa sapidissima Introduced 8 0.25 1 bluegill Lepomis macrochirus Introduced 8 0.25 1 brown bullhead Ameiurus nebulosus Introduced 8 0.25 1 Pacific lamprey Entosphenus tridentata Native 8 0.25 1 striped bass Morone saxatilis Introduced 8 0.25 1 wakasagi Hyposmesus nipponensis Introduced 8 0.25 1 warmouth Lepomis gulosus Introduced
Total 403 Native Percent: 5.46%, Native Species: 3, Introduced Species: 11, *Lampetra species are lumped as in Table 4
Table 6. Summary Results of Entrainment Monitoring Events for All SSC Locations
Rank Percent Number Common Name Origin 1 65.06 216 shimofuri goby Introduced 2 15.06 50 white catfish Introduced 3 9.04 30 channel catfish Introduced 4 5.42 18 shokihaze goby Introduced 5 2.71 9 yellowfin goby Introduced 6 0.60 2 lamprey Native 6 0.60 2 prickly sculpin Native 7 0.30 1 American shad Introduced 7 0.30 1 bluegill Introduced 7 0.30 1 brown bullhead Introduced 7 0.30 1 striped bass Introduced 7 0.30 1 warmouth Introduced
Total 332 Native Percent = 1%, Native Species = 2, Introduced Species = 10

Figure 10. Examples of Specimens Collected during 2009 Fish Community Surveys

Figure 11. Percent Native Fish Collected at Each Fish Community Monitoring Location in 2009
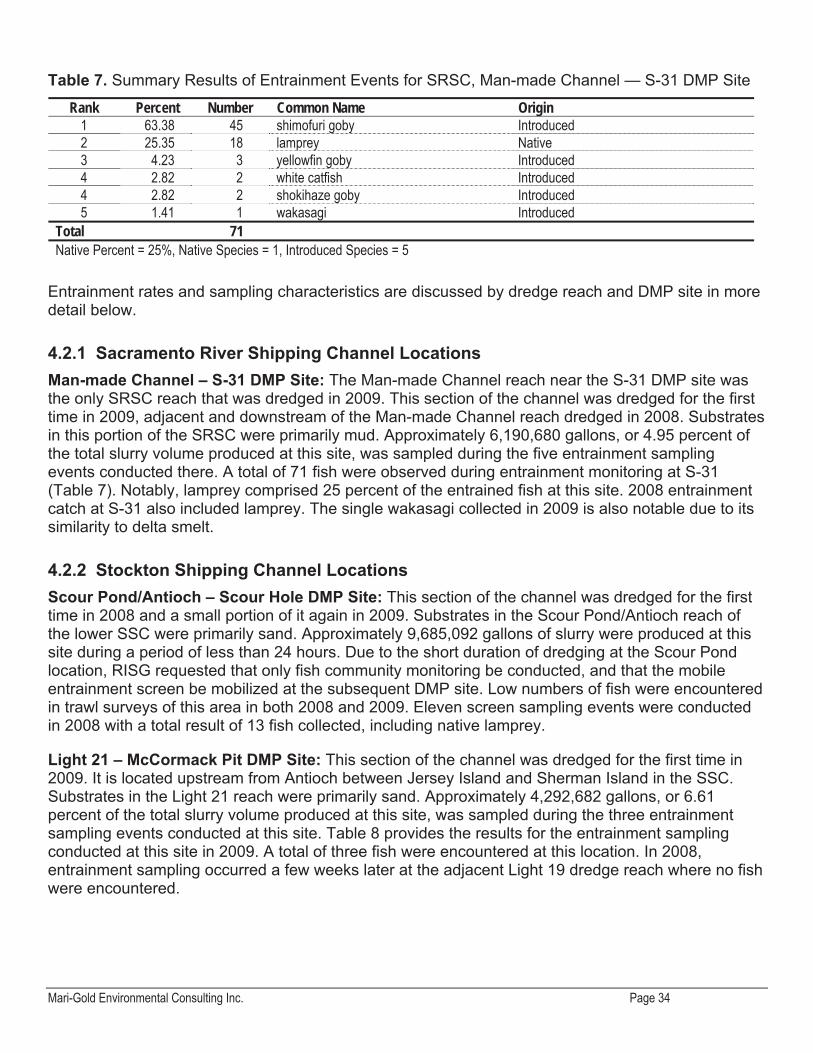
Mari-Gold Environmental Consulting Inc. Page 34
Table 7. Summary Results of Entrainment Events for SRSC, Man-made Channel — S-31 DMP Site
Rank Percent Number Common Name Origin 1 63.38 45 shimofuri goby Introduced 2 25.35 18 lamprey Native 3 4.23 3 yellowfin goby Introduced 4 2.82 2 white catfish Introduced 4 2.82 2 shokihaze goby Introduced 5 1.41 1 wakasagi Introduced
Total 71 Native Percent = 25%, Native Species = 1, Introduced Species = 5
Entrainment rates and sampling characteristics are discussed by dredge reach and DMP site in more detail below.
4.2.1 Sacramento River Shipping Channel Locations Man-made Channel – S-31 DMP Site: The Man-made Channel reach near the S-31 DMP site was the only SRSC reach that was dredged in 2009. This section of the channel was dredged for the first time in 2009, adjacent and downstream of the Man-made Channel reach dredged in 2008. Substrates in this portion of the SRSC were primarily mud. Approximately 6,190,680 gallons, or 4.95 percent of the total slurry volume produced at this site, was sampled during the five entrainment sampling events conducted there. A total of 71 fish were observed during entrainment monitoring at S-31 (Table 7). Notably, lamprey comprised 25 percent of the entrained fish at this site. 2008 entrainment catch at S-31 also included lamprey. The single wakasagi collected in 2009 is also notable due to its similarity to delta smelt.
4.2.2 Stockton Shipping Channel Locations Scour Pond/Antioch – Scour Hole DMP Site: This section of the channel was dredged for the first time in 2008 and a small portion of it again in 2009. Substrates in the Scour Pond/Antioch reach of the lower SSC were primarily sand. Approximately 9,685,092 gallons of slurry were produced at this site during a period of less than 24 hours. Due to the short duration of dredging at the Scour Pond location, RISG requested that only fish community monitoring be conducted, and that the mobile entrainment screen be mobilized at the subsequent DMP site. Low numbers of fish were encountered in trawl surveys of this area in both 2008 and 2009. Eleven screen sampling events were conducted in 2008 with a total result of 13 fish collected, including native lamprey.
Light 21 – McCormack Pit DMP Site: This section of the channel was dredged for the first time in 2009. It is located upstream from Antioch between Jersey Island and Sherman Island in the SSC. Substrates in the Light 21 reach were primarily sand. Approximately 4,292,682 gallons, or 6.61 percent of the total slurry volume produced at this site, was sampled during the three entrainment sampling events conducted at this site. Table 8 provides the results for the entrainment sampling conducted at this site in 2009. A total of three fish were encountered at this location. In 2008,entrainment sampling occurred a few weeks later at the adjacent Light 19 dredge reach where no fish were encountered.

Mari-Gold Environmental Consulting Inc. Page 35
Table 8. Summary Results of Entrainment Events at Light 21 — McCormack Pit DMP Site
Rank Percent Number Common Name Origin 1 33.33 1 lamprey, unidentified species Native 1 33.33 1 prickly sculpin Native 1 33.33 1 striped bass Introduced
Total 3 Native Percent = 66.7%, Native Species = 2, Introduced Species = 1
Spud Island – Roberts 2 DMP Site: This section of the channel was dredged for the first time during 2009. Substrates from this dredge reach were primarily mud. Approximately 2,692,860 gallons, or 7.70 percent of the total slurry volume produced at this site, was sampled during the two entrainment sampling events conducted. Table 9 provides the results for the entrainment sampling conducted at this site in 2009.
Table 9. Summary Results of Entrainment Events at Spud Island — Roberts 2 DMP Site
Rank Percent Number Common Name Origin 1 54.22 45 shimofuri goby Introduced 2 39.76 33 white catfish Introduced 3 3.61 3 channel catfish Introduced 4 2.41 2 yellowfin goby Introduced
Total 83 Native Percent = 0%, Native Species = 0, Introduced Species = 4
Lower Roberts Island – Roberts 2 DMP Site: This section of the channel was dredged for the first time during 2009. Substrates from this dredge reach were primarily mud. Approximately 1,988,563 gallons, or 4.98 percent of the total slurry volume deposited at this site, was sampled during one entrainment sampling event. Table 10 displays the results of entrainment sampling conducted at this reach in 2009.
Table 10. Summary Results of Entrainment Events at Lower Roberts Island — Roberts 2 DMP Site
Rank Percent Number Common Name Origin 1 66.67 2 shimofuri goby Introduced 2 33.33 1 white catfish Introduced
Total 3 Native Percent = 0%, Native Species = 0, Introduced Species = 2
Windmill Cove – Roberts 2 DMP Site: This section of the SSC was dredged for the first time during 2009. Substrates from this dredge reach were primarily mud and silt. In 2009, approximately 1,431,480 gallons, or 3.35 percent of the total volume of dredged slurry, was sampled during the single entrainment event. Table 11 provides the results for 2009 entrainment sampling conducted at this site.

Mari-Gold Environmental Consulting Inc. Page 36
Table 11. Summary Results of Entrainment Events at Windmill Cove — Roberts 2 DMP Site
Rank Percent Number Common Name Origin 1 76.47 26 shimofuri goby Introduced 2 11.76 4 white catfish Introduced 3 8.82 3 shokihaze goby Introduced 4 2.94 1 yellowfin goby Introduced
Total 34 Native Percent = 0%, Native Species = 0, Introduced Species = 4
Upper Roberts Island – Roberts 1 DMP Site: This channel section was dredged for the first time during 2009. Substrates from this dredge reach were primarily mud and silt. Approximately 8,791,632 gallons, or 4.81 percent of the total slurry volume produced, was sampled during the eight entrainment surveys conducted at this site. Table 12 provides the 2009 entrainment sampling results for this dredge reach.
Table 12. Summary Results of Entrainment Events at Upper Roberts Island — Roberts 1 DMP Site
Rank Percent Number Common Name Origin 1 86.00 129 shimofuri goby Introduced 2 6.00 9 white catfish Introduced 2 5.33 8 shokihaze goby Introduced 3 2.00 3 yellowfin goby Introduced 4 0.67 1 prickly sculpin Native
Total 150 Native Percent = 0.67%, Native Species = 1, Introduced Species = 4
Rough and Ready Island – Roberts 1 DMP Site: This section of the channel was first dredged in 2006 and then again in 2009. Substrates from this dredge reach were primarily mud and silt. In 2009 approximately 6,569,674 gallons, or 7.49 percent of the total dredged slurry volume, was sampled during the four entrainment sampling events conducted at this site. Table 13 displays the results for the entrainment sampling conducted at this site in 2009.
Table 13. Summary Results of Entrainment Events at Rough & Ready Island —Roberts 1 DMP Site
Rank Percent Number Common Name Origin 1 35.71 15 channel catfish Introduced 2 26.19 11 shimofuri goby Introduced 3 16.67 7 shokihaze goby Introduced 4 7.14 3 white catfish Introduced 4 7.14 3 yellowfin goby Introduced 5 2.38 1 bluegill Introduced 5 2.38 1 brown bullhead Introduced 5 2.38 1 warmouth Introduced
Total 42 Native Percent = 0%, Native Species = 0, Introduced Species = 8
Upper Turning Basin – Roberts 1 DMP Site: This section of the channel was dredged for the first time in 2009. It is adjacent to the East Complex of the Port of Stockton. Substrates from this dredge reach were primarily mud. Approximately 2,974,521 gallons, or 8.99 percent of the total slurry volume

Mari-Gold Environmental Consulting Inc. Page 37
produced at this site, was sampled during the two entrainment sampling events conducted. Table 14 provides the entrainment sampling results for the surveys conducted at this site in 2009.
Table 14. Summary Results of Entrainment Events at Upper Turning Basin — Roberts 1 DMP Site
Rank Percent Number Common Name Origin 1 70.59 12 channel catfish Introduced 2 17.65 3 shimofuri goby Introduced 3 5.88 1 American shad Introduced 3 5.88 1 Pacific lamprey Native
Total 17 Native Percent = 5.88%, Native Species = 1, Introduced Species = 3
Extrapolated entrainment totals for each species encountered in each dredge reach enables estimation of overall numbers of fish entrained. These extrapolations were created by simply dividing the number of individuals encountered in each dredge reach by the percentage of material sampled in that reach. The totals were estimated without regard to the high likelihood of fish density patchiness throughout the length of each dredge reach, simply assuming that the fish density (or entrainment likelihood) for each species for the entire reach was the same as that in the sub-set of material assessed from that reach. Table 15 displays the extrapolated counts for each species for each dredge reach in 2009.
Table 15. Extrapolated Fish Entrainment Catch for 2009 by Event Location & Fish Species River SRSC SSC
Man-made
Channel Scour Pond Light 21
SpudIsland
Lower Roberts Island
WindmillCove
UpperRoberts Island
Rough & ReadyIsland
UpperTurning Basin
Total S-31Scour Hole
McCormackPit Roberts 2 Roberts 2 Roberts 2 Roberts 1 Roberts 1 Roberts 1
[% Sampled] [4.95%] DNS [6.61%] [7.70%] [4.98%] [3.35%] [4.81%] [7.49%] [8.99%] [5.64%] shimofuri goby 909 584 40 776 2,682 147 33 5,171white catfish 40 429 20 119 187 40 835lamprey spp. 364 16 380shokihaze goby 40 90 166 93 389channel catfish 39 200 133 372yellowfin goby 61 26 30 62 40 219prickly sculpin 16 21 37wakasagi 20 20striped bass 16 16warmouth 13 13bluegill 13 13brown bullhead 13 13American shad 11 11Pacific lamprey 11 11
Total 1,434 DNS 48 1,078 60 1,015 3,118 559 188 7,500Note: Gray shading indicates introduced species.
Based on these extrapolations, a total of approximately 7,500 fish may have been entrained by dredging operations in 2009. Shimofuri goby comprised the vast majority of the entrained individual fish, making up 65 percent of the estimated entrained fish while white catfish comprised 11 percent. Lamprey species combined comprised 5 percent and prickly sculpin, the only other native species
Mari-Gold Environmental Consulting Inc. Page 38
entrained in 2009, comprised 0.5 percent. Channel catfish comprised 5 percent of the encountered fish in 2009. In 2008, they comprised 62 percent while white catfish comprised 14 percent of encountered fish.
4.3 Fish Community Monitoring
The following sub-sections describe the fish community sampling results for all locations and by shipping channel and individual dredge reach/DMP site. Table 16 summarizes the catch. Figure 11 graphs the percentage of native fish encountered during 2009 fish community sampling in each dredging reach. Table 17 summarizes the effort data for 2009 fish community sampling and provides a description of relative fish density at the trawl locations through the CPUE metric of number of fish collected per linear meter towed along the bottom. A graph of the mean CPUE for each trawl survey by dredge reach and river is provided in Figure 12.
2009 data are compared with previous years when relevant. Caution should be applied, though, when comparing the data across years as timing, exact locations (dredge reaches), effort, and environmental factors all varied significantly. In 2009, only 10.7 percent of the locations (river miles) had been previously dredged since monitoring began in 2006. Comparisons within DMP sites are made between years even though the exact dredging reaches and trawl locations change from year to year for each DMP site.

Figure 12. Mean CPUE for Each Fish Community Survey (Note: Shaded bars indicate dusk/night/dawn surveys)
Man-made Channel Scour/ Antioch
Light 21 Spud Island
Lower Roberts Island
WindmillCove
Sacramento River San Joaquin River
Upper Roberts Island
Rough and Ready Island
Upper TurningBasin

Mari-Gold Environmental Consulting Inc. Page 40
Table 16. Ranked Catch of Fish from All Sites during 2009 Trawl Monitoring Surveys
Rank Percent Number Common Name Origin 1 55.02 3,433 white catfish Introduced 2 22.64 1,413 striped bass Introduced 3 9.68 604 threadfin shad Introduced 4 4.71 294 channel catfish Introduced 5 3.93 245 American shad Introduced 6 2.18 136 wakasagi Introduced 7 0.50 31 shimofuri goby Introduced 8 0.46 29 yellowfin goby Introduced 9 0.21 13 shokihaze goby Introduced 10 0.14 9 warmouth Introduced 11 0.11 7 starry flounder Native 11 0.11 7 white sturgeon Native 12 0.06 4 splittail Native 13 0.05 3 bluegill Introduced 13 0.05 3 brown bullhead Introduced 14 0.03 2 common carp Introduced 14 0.03 2 prickly sculpin Native 15 0.02 1 black crappie Introduced 15 0.02 1 largemouth bass Introduced 15 0.02 1 redear sunfish Introduced 15 0.02 1 Sacramento pikeminnow Native 15 0.02 1 tule perch Native
Total 6,240 Native Percent = 0.35%, Native Species = 6, Introduced Species = 15
Table 17. Summary Catch & Effort Data for Fish Encountered in 2009 Trawl Monitoring Surveys
River Dredge Reach
CPUETrawlTows
CPUE Trawl
Distance (m)
CubicMeters
Sampled
% Total TrawlEffort
Number ofFish
% of TotalCatch
CPUE(fish/m)
CPUE (fish/10,000m3)
Sacramento Man-made Chan 17 9,480 74,892 18.7 450 7.3 0.05 60
San Joaquin
Scour/Antioch 5 2,760 21,804 5.4 21 0.3 0.01 10 Light 21 15 7,295 57,631 14.4 217 3.5 0.03 38 Spud Island 9 4,917 38,844 9.7 148 2.4 0.03 38 Lower Roberts 5 3,046 24,063 6.0 401 6.5 0.13 167 Windmill Cove 5 3,004 23,732 5.9 902 14.6 0.30 380 Upper Roberts 16 8,652 68,351 17.0 1,656 26.8 0.19 242 Rough & Ready 20 9,621 76,006 18.9 2,094 33.9 0.22 276 Upper Turn Basin 5 2,047 16,171 4.0 287 4.6 0.14 177
Total 9 97 50,822 401,494 6,176
4.3.1 Sacramento River Shipping Channel Locations Man-made Channel – S-31 DMP Site: Dredging and monitoring took place in this section of the Sacramento River Man-made Channel downstream from the Port of Sacramento, between RM 30.87 and 32.86, just downstream of last year’s reach. Figure 13 displays the trawl surveys and DMP site for this sampling location. This section of the channel was sampled for the first time in 2009. Two of
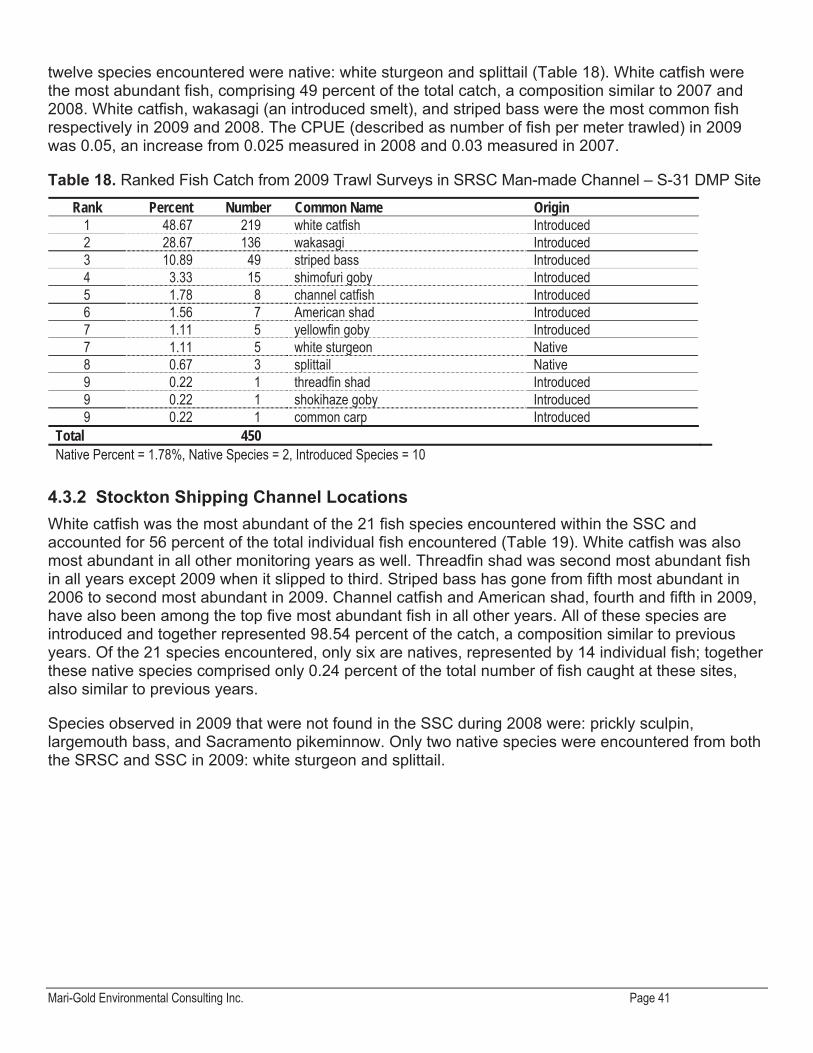
Mari-Gold Environmental Consulting Inc. Page 41
twelve species encountered were native: white sturgeon and splittail (Table 18). White catfish were the most abundant fish, comprising 49 percent of the total catch, a composition similar to 2007 and 2008. White catfish, wakasagi (an introduced smelt), and striped bass were the most common fish respectively in 2009 and 2008. The CPUE (described as number of fish per meter trawled) in 2009 was 0.05, an increase from 0.025 measured in 2008 and 0.03 measured in 2007.
Table 18. Ranked Fish Catch from 2009 Trawl Surveys in SRSC Man-made Channel – S-31 DMP Site
Rank Percent Number Common Name Origin 1 48.67 219 white catfish Introduced 2 28.67 136 wakasagi Introduced 3 10.89 49 striped bass Introduced 4 3.33 15 shimofuri goby Introduced 5 1.78 8 channel catfish Introduced 6 1.56 7 American shad Introduced 7 1.11 5 yellowfin goby Introduced 7 1.11 5 white sturgeon Native 8 0.67 3 splittail Native 9 0.22 1 threadfin shad Introduced 9 0.22 1 shokihaze goby Introduced 9 0.22 1 common carp Introduced
Total 450 Native Percent = 1.78%, Native Species = 2, Introduced Species = 10
4.3.2 Stockton Shipping Channel Locations White catfish was the most abundant of the 21 fish species encountered within the SSC and accounted for 56 percent of the total individual fish encountered (Table 19). White catfish was also most abundant in all other monitoring years as well. Threadfin shad was second most abundant fish in all years except 2009 when it slipped to third. Striped bass has gone from fifth most abundant in 2006 to second most abundant in 2009. Channel catfish and American shad, fourth and fifth in 2009, have also been among the top five most abundant fish in all other years. All of these species are introduced and together represented 98.54 percent of the catch, a composition similar to previous years. Of the 21 species encountered, only six are natives, represented by 14 individual fish; together these native species comprised only 0.24 percent of the total number of fish caught at these sites, also similar to previous years.
Species observed in 2009 that were not found in the SSC during 2008 were: prickly sculpin, largemouth bass, and Sacramento pikeminnow. Only two native species were encountered from both the SRSC and SSC in 2009: white sturgeon and splittail.

Chart - Sacramento River Andrus Island To Sacramento Mercator 18662_1 1:40,000 Soundings: Feet
S-31 DMP
N2.00 KM
TR0904
TR0902
TR0903
SA
CRAM
ENTO
RI
VER
DE
EP
WAT
ER
SH
IP C
HANN
EL
TR0906N
TR0905
TR0906S
TR0901
MAP SCALE
Marsh
Figure 13. 2009 Fish Community Surveys for Man-made Channel Dredge Reach and S-31 DMP SiteMap projection 1:25,000

Mari-Gold Environmental Consulting Inc. Page 43
Table 19. Ranked Fish Catch from 2009 Trawl Surveys at All SSC Sites
Rank Percent Number Common Name Origin 1 56.13 3214 white catfish Introduced 2 23.44 1342 striped bass Introduced 3 10.08 577 threadfin shad Introduced 4 4.75 272 channel catfish Introduced 5 4.14 237 American shad Introduced 6 0.40 23 yellowfin goby Introduced 7 0.28 16 shimofuri goby Introduced 8 0.21 12 shokihaze goby Introduced 9 0.16 9 warmouth Introduced
10 0.12 7 starry flounder Native 11 0.05 3 bluegill Introduced 11 0.05 3 brown bullhead Introduced 12 0.03 2 white sturgeon Native 12 0.03 2 prickly sculpin Native 13 0.02 1 black crappie Introduced 13 0.02 1 common carp Introduced 13 0.02 1 largemouth bass Introduced 13 0.02 1 redear sunfish Introduced 13 0.02 1 Sacramento pikeminnow Native 13 0.02 1 splittail Native 13 0.02 1 tule perch Native
Total 5,726 Native Percent = 0.24%, Native Species = 6, Introduced Species = 15
Scour Pond/Antioch – Scour Hole DMP Site: Maintenance dredging and fish community monitoring were conducted in the main navigation channel from RM 8.81 to 8.90, between Light 16 and Light 18, upstream of Antioch Bridge (Figure 14). This section of the channel was sampled for the first time in 2009. American shad was the most abundant fish species caught in this reach, representing over 47 percent of the total catch (Table 20). American shad was also most abundant at this site in 2008. Three delta smelt were encountered nearby in 2008, and one each of delta smelt and longfin smelt in 2007. Smelt were not encountered in 2009. Native fish comprised a higher percent of the overall catch in both 2007 and 2009 than 2008, mostly due to the high numbers of starry flounder relative to the other (introduced) species. This reach was not sampled in 2006. Few fish have been encountered in all years of trawl and entrainment monitoring of the SSC near the Antioch Bridge and Scour Pond. Salinity here is consistently the highest recorded at any of the SSC dredge locations. The CPUE for the Scour Pond reach in 2009 was 0.01 fish/m, the lowest of all SSC reaches. While a greater number of trawl surveys were conducted near Scour Pond in prior years, the CPUE was also lowest at this site in 2007 and second lowest in 2008.
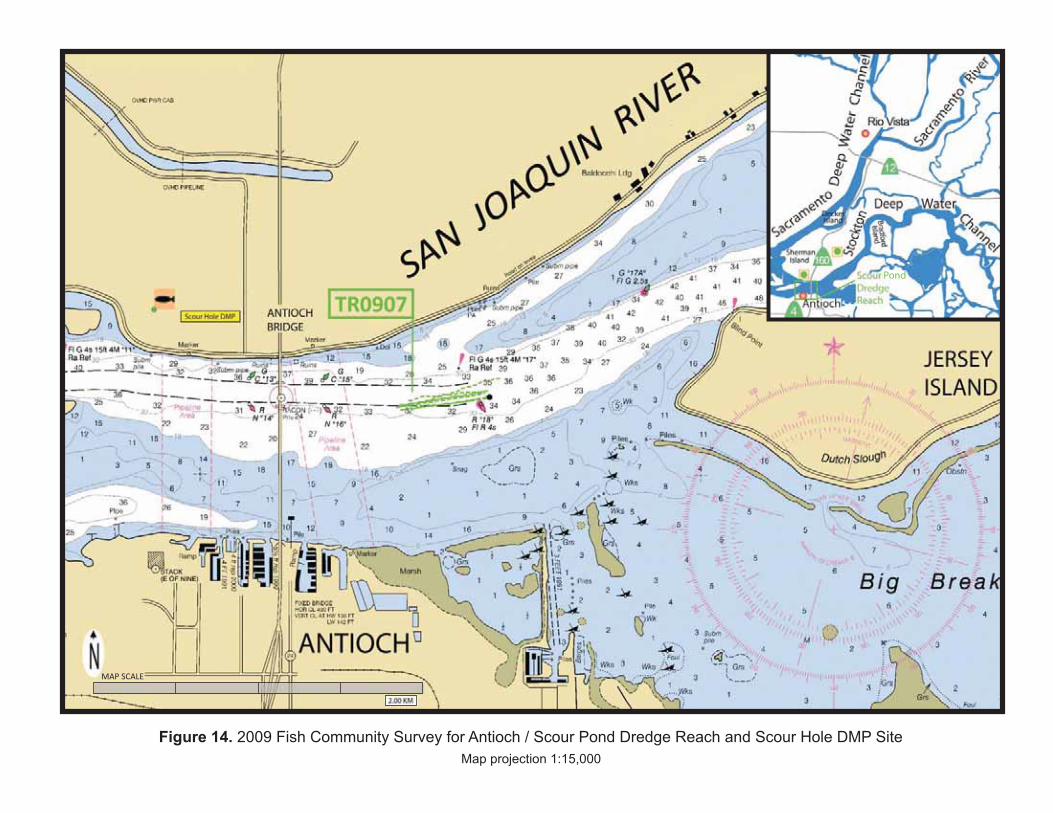
Pond
MAP SCALE
Figure 14. 2009 Fish Community Survey for Antioch / Scour Pond Dredge Reach and Scour Hole DMP SiteMap projection 1:15,000

Mari-Gold Environmental Consulting Inc. Page 45
Table 20. Summary Results of Trawl Surveys at Scour Pond/ Antioch — Scour Hole DMP Site
Rank Percent Number Common Name Origin 1 47.62 10 American shad Introduced 2 23.81 5 starry flounder Native 3 19.05 4 striped bass Introduced 4 4.76 1 channel catfish Introduced 4 4.76 1 threadfin shad Introduced
Total 21 Native Percent = 24% Native Species = 1, Introduced Species = 4
Light 21 – McCormack Pit DMP Site: Dredging and fish community monitoring were conducted upstream of the Antioch Bridge between Jersey Island and Sherman Island, from RM 11.65 to 12.22 in the SSC (Figure 15). This section of the channel was sampled for the first time in 2009. Table 21 provides a summary of the fish encountered during community sampling. American shad was the most abundant fish species captured in this reach, comprising over 51 percent of the total catch. Two native species, white sturgeon and starry flounder, were encountered. Introduced species represented over 98.5 percent of fish encountered, very similar to 99.6 percent collected at the nearby Light 19 reach in 2008. This reach was sampled in 2008, but not prior. CPUE at this site during 2009 and 2008 was 0.03, among the lowest in the SSC.
Table 21. Summary Results of Trawl Surveys at Light 21 — McCormack Pit DMP Site
Rank Percent Number Common Name Origin 1 51.29 139 American shad Introduced 2 23.25 63 striped bass Introduced 3 1.85 5 threadfin shad Introduced 4 1.48 4 white catfish Introduced 5 0.74 2 starry flounder Native 5 0.74 2 white sturgeon Native 6 0.37 1 yellowfin goby Introduced 6 0.37 1 channel catfish Introduced
Total 271 Native Percent = 1.5% Native Species = 2, introduced Species = 6
Spud Island – Roberts 2 DMP Site: Dredging and fish community monitoring were conducted from RM 31.65 to 32.20 (Figure 16). This year was the first time that the Roberts 2 DMP site has been used since fish community monitoring commenced in 2006; thus, background fish monitoring data for nearby portions of the channel is not available. Table 22 provides a summary of the fish encountered during fish community sampling near the Spud Island dredge reach. Striped bass was the most abundant species encountered, comprising nearly 59 percent of the total catch. Two native species were encountered: tule perch and prickly sculpin. The single tule perch was the only one encountered at any location in 2009. In prior years, only four of the 62 encountered tule perch were from SSC trawl locations. The prickly sculpin was one of two encountered in 2009. The 27 previously encountered prickly sculpin were found in the SSC. CPUE at this site during 2009 was 0.03 fish/m, among the lowest in the SSC.
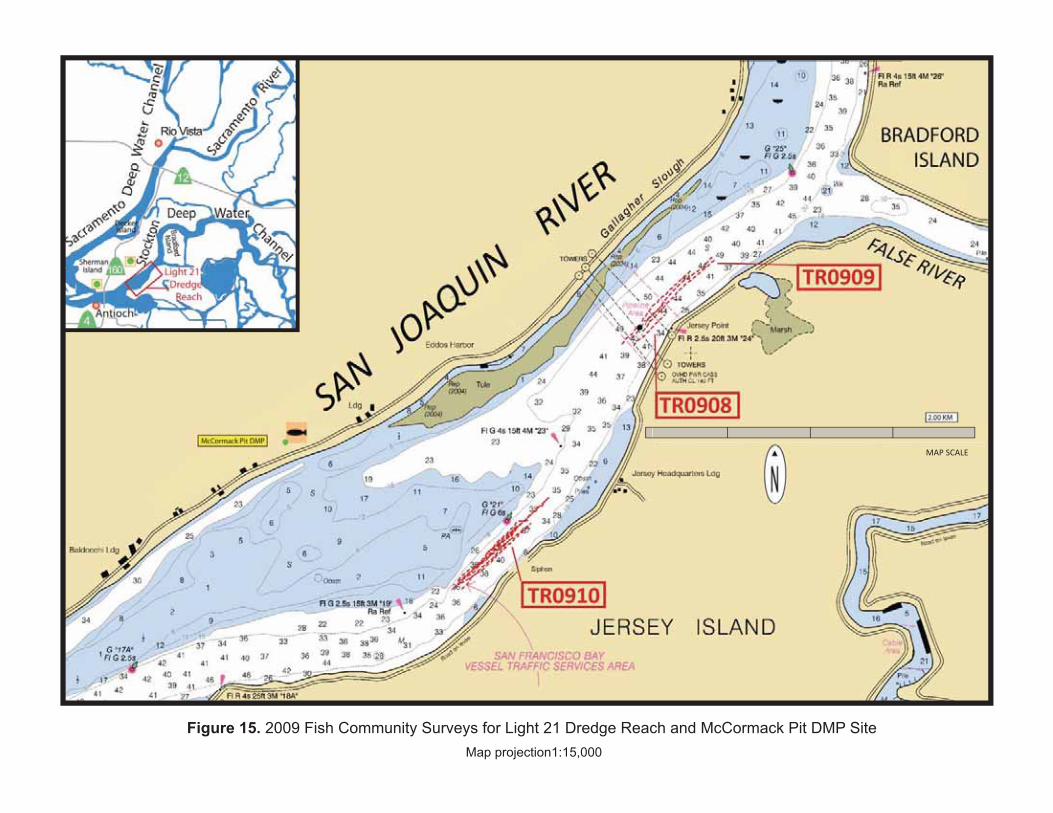
MAP SCALE
Figure 15. 2009 Fish Community Surveys for Light 21 Dredge Reach and McCormack Pit DMP SiteMap projection1:15,000
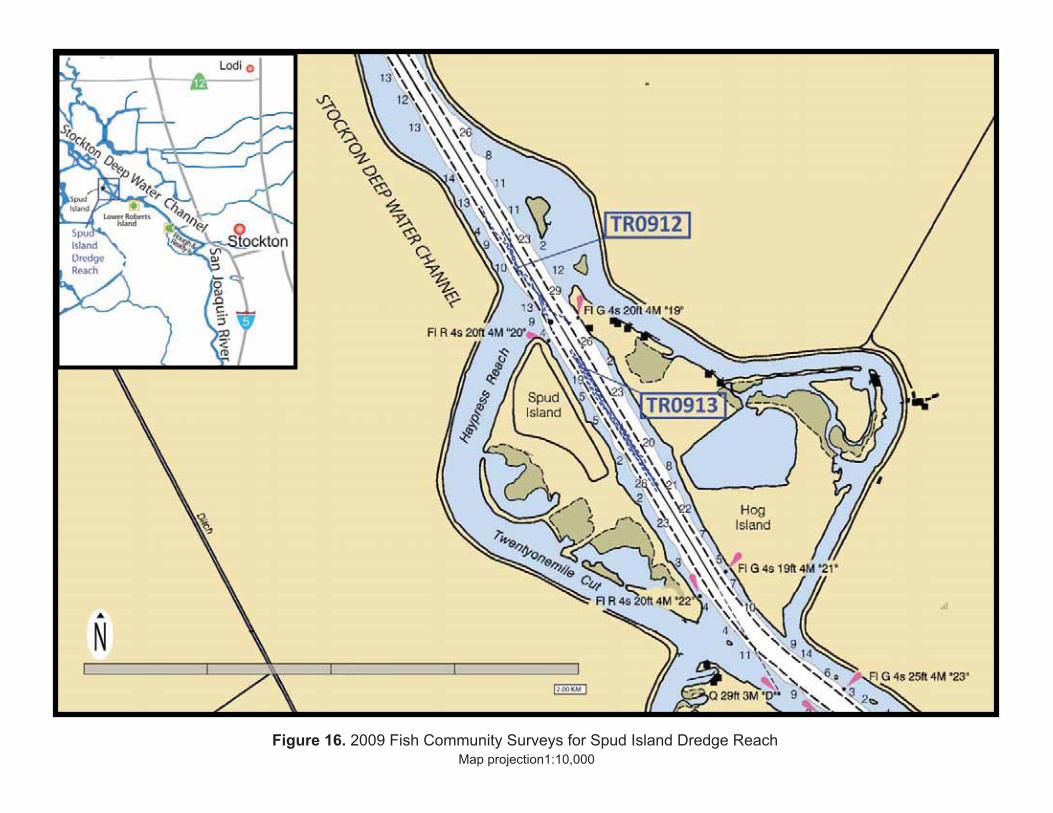
Figure 16. 2009 Fish Community Surveys for Spud Island Dredge ReachMap projection1:10,000

Mari-Gold Environmental Consulting Inc. Page 48
Table 22. Summary Results of Trawl Surveys at Spud Island — Roberts 2 DMP Site
Rank Percent Number Common Name Origin 1 58.78 87 striped bass Introduced 2 23.65 35 white catfish Introduced 3 7.43 11 American shad Introduced 4 2.70 4 channel catfish Introduced 4 2.70 4 shimofuri goby Introduced 5 2.03 3 bluegill Introduced 6 0.68 1 largemouth bass Introduced 6 0.68 1 prickly sculpin Native 6 0.68 1 shokihaze goby Introduced 6 0.68 1 tule perch Native
Total
148 Native Percent = 1.4% Native Species = 2, introduced Species = 8
Lower Roberts Island – Roberts 2 DMP Site: Dredging and fish community monitoring were conducted from RM 32.20 to 32.95, upstream from the Spud Island reach (Figure 17). This year was the first time Roberts 2 DMP site has been used since fish community monitoring commenced in 2006, so prior bottom trawl data for this reach is not available. Table 23 provides a summary of the fish encountered during community sampling. White catfish was the most abundant species collected, comprising 79 percent of the total catch. One Sacramento pikeminnow was the only native fish encountered at this trawl location. Pikeminnow have been extremely rare in the trawl catch, with only one previously encountered from the SRSC. CPUE at this site was 0.13 fish/m.
Table 23. Summary Results of Trawl Surveys at Lower Roberts Island — Roberts 2 DMP Site
Rank Percent Number Common Name Origin 1 79.05 317 white catfish Introduced 2 15.71 63 striped bass Introduced 3 3.24 13 threadfin shad Introduced 4 1.00 4 channel catfish Introduced 5 0.50 2 shimofuri goby Introduced 6 0.25 1 Sacramento pikeminnow Native 6 0.25 1 American shad Introduced
Total 401 Native percent = 0.25% Native species = 1, introduced species = 6
Windmill Cove – Roberts 2 DMP Site: Dredging and fish community monitoring were conducted from RM 33.62 to 34.09 with material placed at the Roberts 2 DMP site (Figure 18). Prior fish community monitoring of dredge operations has not occurred in this reach. Table 24 provides a summary of the fish encountered during community sampling. White catfish was the most abundant species encountered, comprising nearly 96 percent of the total catch. CPUE was 0.30 fish/m, the highest density of fish among all trawl locations in 2009. Native fish species were absent from the trawl catch at this location.
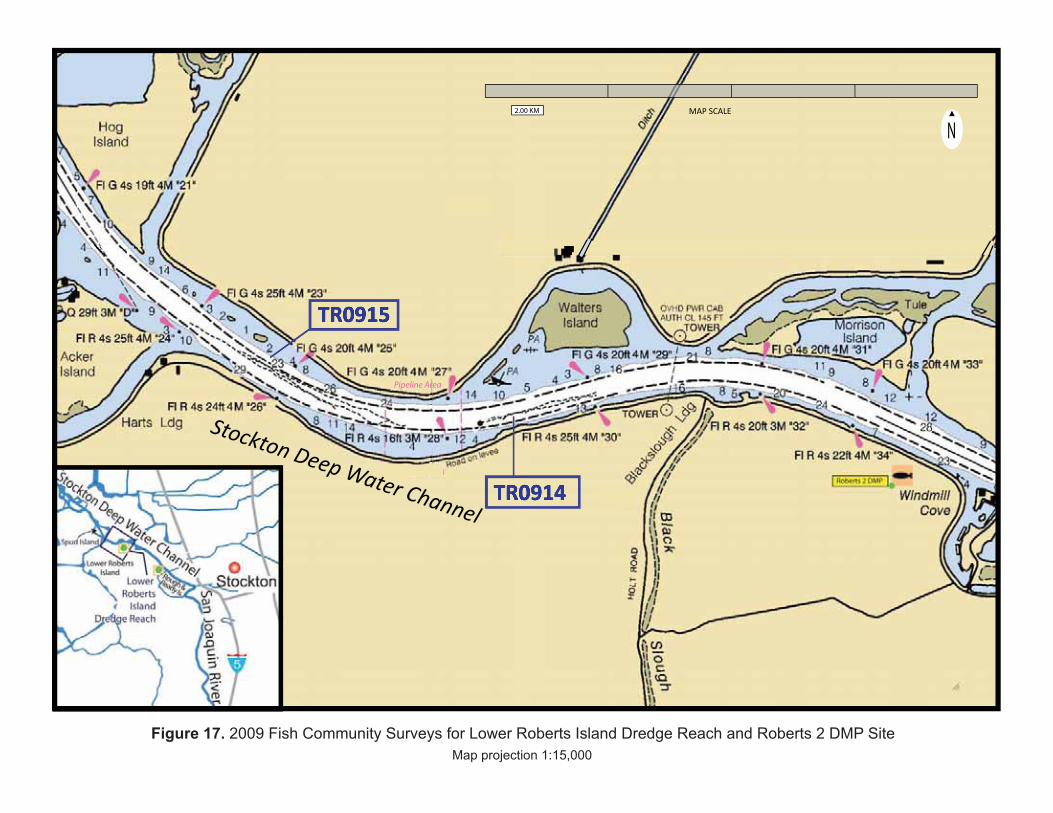
r
2.00 KM
NMAP SCALE
Pipeline Area
Stockton Deep Water Channel
Figure 17. 2009 Fish Community Surveys for Lower Roberts Island Dredge Reach and Roberts 2 DMP SiteMap projection 1:15,000

Map projection 1:10,000
Figure 18. 2009 Fish Community Surveys for Windmill Cove Dredge Reach and Roberts 2 DMP Site
Mari-Gold Environmental Consulting Inc. Page 51
Table 24. Summary Results of Trawl Surveys at Windmill Cove — Roberts 2 DMP Site
Rank Percent Number Common Name Origin 1 95.68 863 white catfish Introduced 2 3.55 32 striped bass Introduced 3 0.33 3 shimofuri goby Introduced 4 0.22 2 channel catfish Introduced 5 0.11 1 threadfin shad Introduced 5 0.11 1 yellowfin goby Introduced
Total 902 Native Percent = 0% Native Species = 0, introduced Species = 6
Upper Roberts Island – Roberts 1 DMP Site: Dredging and fish community monitoring were conducted from RM 34.66 to 36.72 (Figure 19). This year was the first time that this section of the channel was sampled, though nearby channel areas have been sampled in previous years. The Roberts 1 DMP site has been used each year since fish community monitoring commenced in 2006. Table 25 provides a summary of the fish encountered during community sampling. White catfish was the most abundant species encountered, comprising nearly 79 percent of the total catch. White catfish has been the most abundant species at dredge reaches using the Roberts 1 DMP site since sampling commenced in 2006. CPUE at this location in 2009 was 0.19 fish/m. Native species were represented by a single splittail, the only one encountered in the SSC among the four caught in 2009. Splittail have been encountered in all years in both shipping channels, though never in high numbers.
Table 25. Summary Results of Trawl Surveys at Upper Roberts Island — Roberts 1 DMP Site
Rank Percent Number Common Name Origin 1 78.62 1302 white catfish Introduced 2 12.74 211 striped bass Introduced 3 3.80 63 channel catfish Introduced 4 1.87 31 threadfin shad Introduced 4 1.87 31 American shad Introduced 5 0.36 6 warmouth Introduced 6 0.30 5 shimofuri goby Introduced 7 0.24 4 yellowfin goby Introduced 8 0.06 1 splittail Native 8 0.06 1 redear sunfish Introduced 8 0.06 1 Shokihaze goby Introduced
Total 1,656 Native Percent = 0.06% Native Species = 1, introduced Species = 10
Rough and Ready Island – Roberts 1 DMP Site: Maintenance dredging and fish community monitoring occurred within the deepwater navigation channel between RM 38.48 and 39.32, near Rough and Ready Island in the West Complex of the Port of Stockton (Figure 20). This portion of the channel was sampled once before in 2006, and a portion sampled in 2008. Table 26 provides a summary of the fish encountered during community sampling. Striped bass was the most abundant fish species encountered in trawl sampling, representing almost 38 percent of the catch, followed closely by white catfish. The CPUE at this location was 0.22 fish/m, second highest of all locations in 2009. Native species were represented by a single prickly sculpin, the second of two captured in the SSC in 2009.

STOCKTON DEEP WATER CHANNEL
MAP SCALE
Map projection 1:15,000Figure 19. 2009 Fish Community Surveys for Upper Roberts Island Dredge Reach, Roberts 1 and Roberts 2 DMP Sites

MAP SCALE
Roberts 1 DMP
Figure 20. 2009 Fish Community Surveys for Rough and Ready Island Dredge Reach and Roberts 1 DMP SiteMap projection 1:15,000

TR0927 TR0926
Figure 21. 2009 Fish Community Surveys for Upper Turning Basin Dredge Reach
Map projection 1:10,000

Mari-Gold Environmental Consulting Inc. Page 55
Table 26. Summary Results of Trawl Surveys at Rough & Ready Island — Roberts 1 DMP Site
Rank Percent Number Common Name Origin 1 37.78 791 striped bass Introduced 2 32.33 677 white catfish Introduced 3 19.10 400 threadfin shad Introduced 4 8.02 168 channel catfish Introduced 5 1.24 26 American shad Introduced 6 0.76 16 yellowfin goby Introduced 7 0.48 10 shokihaze goby Introduced 8 0.01 2 shimofuri goby Introduced 9 0.005 1 warmouth Introduced 9 0.005 1 common carp Introduced 9 0.005 1 brown bullhead Introduced 9 0.005 1 prickly sculpin Native
Total 2,094 Native Percent = .005% Native Species = 1, introduced Species = 11
Upper Turning Basin – Roberts 1 DMP Site: Maintenance dredging and fish community monitoring were conducted within the deepwater navigation channel between RM 40.08 and 40.64 off the West Complex of the Port of Stockton (Figure 21). This is the furthest upstream area to have yet been assessed. Table 27 provides a summary of the fish encountered during community sampling. Threadfin shad and striped bass were the most abundant fish species encountered at this dredging location in 2009, representing almost 44 percent and 32 percent of the overall catch, respectively. CPUE at this location was 0.14 fish/m. Native fish were not encountered at this location in 2009.
Table 27. Summary Results of Trawl Surveys at Upper Turning Basin — Roberts 1 DMP Site
Rank Percent Number Common Name Origin 1 43.90 126 threadfin shad Introduced 2 31.71 91 striped bass Introduced 3 10.10 29 channel catfish Introduced 4 6.62 19 American shad Introduced 5 5.57 16 white catfish Introduced 6 0.70 2 brown bullhead Introduced 6 0.70 2 Warmouth Introduced 7 0.35 1 yellowfin goby Introduced 7 0.35 1 black crappie Introduced
Total 287 Native Percent = 0% Native Species = 0, introduced Species = 9
4.4 Fish Length
For 13 of the 21 species encountered during fish community monitoring, 100 percent of the fish encountered were measured for length prior to release. Species encountered in large numbers such as striped bass, white catfish, and threadfin shad are sub-sampled to determine the sizes of the encountered fish. This is done to minimize mortality by returning fish to the river as quickly as possible. Table 28 provides the summary length statistics for all measured fish encountered in the 2009 trawl surveys. Overall, 1,242 fish out of 6,240 (20%) were measured for length (total length [TL], standard length, or fork length, depending on species).

Mari-Gold Environmental Consulting Inc. Page 56
Table 28. Summary Size Statistics for Fish Encountered during 2009 Trawl Surveys
Length (mm) SD of Mean
Mean Total Length n Measured n Captured % Measured Common Name Minimum Maximum
Native Species prickly sculpin 114 126 8.49 120.00 2 2 100 Sacramento pikeminnow 224 224 224.00 1 1 100 splittail 104 386 147.04 246.50 4 4 100 starry flounder 95 241 52.35 130.71 7 7 100 tule perch 215 215 215.00 1 1 100 white sturgeon 525 670 45.28 617.00 7 7 100
Introduced Species American shad 45 310 68.74 127.18 97 245 40 black crappie 213 213 213.00 1 1 100 bluegill 135 152 12.02 143.50 2 3 67 brown bullhead 119 332 111.05 207.33 3 3 100 channel catfish 45 460 84.85 223.67 116 294 39 common carp 330 670 240.42 500.00 2 2 100 largemouth bass 85 85 85.00 1 1 100 redear sunfish 183 183 183.00 1 1 100 shimofuri goby 24 87 19.37 53.86 29 31 94 Shokihaze goby 25 107 23.07 87.85 13 13 100 striped bass 44 690 72.24 158.27 319 1,413 23 threadfin shad 52 198 31.85 125.82 129 604 21 wakasagi 63 130 8.86 94.05 120 136 88 warmouth 124 194 20.09 169.22 9 9 100 white catfish 15 506 67.67 174.65 349 3,433 10 yellowfin goby 73 194 24.19 131.10 29 29 100
Total 1,242 6,240 20
The majority of entrained fish were retained, examined, measured and returned to the river. Occasionally, fish were observed but not measured. There were a few reasons why individual entrained fish went unmeasured. There were fish that were visually identified to species but escaped collection over the end of the entrainment screen or through the screen mesh. These fish were documented in the entrainment results. Typically, they were individuals of the most common species (gobies and catfish), for which an abundance of length data has been collected. A few fish were dropped on their way to the collection bucket and there were also a few partial (un-measurable) fish showing signs of damage from the dredge. Table 29 provides the summary length statistics for all entrained fish that were measured. Overall, 75 percent of fish encountered during 2009 entrainment screen monitoring were measured prior to release or vouchering.

Mari-Gold Environmental Consulting Inc. Page 57
Table 29. Summary Size Statistics for Fish Encountered during 2009 Entrainment Screen Events
Common Name Length (mm)
SDMean Total
Length n Measured n Collected % Measured Minimum Maximum Native Species
lamprey (undet. spp.) 103 147 12.8 137 20 20 100 prickly sculpin 52 123 50.2 87.5 2 2 100
Introduced Species shimofuri goby 26 83 12.4 51.6 189 261 72.4 white catfish 37 170 31.2 77.8 47 52 90.4 channel catfish 55 248 63.7 137 30 30 100 shokihaze goby 34 108 26 71 19 20 95 yellowfin goby 107 166 19.4 136 12 12 100 American shad 75 75 -- -- 1 1 100 bluegill 134 134 -- -- 1 1 100 brown bullhead 180 180 -- -- 1 1 100 striped bass 267 267 -- -- 1 1 100 wakasagi 91 91 -- -- 1 1 100 warmouth 167 167 -- -- 1 1 100
Total 303 403 75.2
4.5 Invertebrates
Invertebrates have been encountered during both fish community and entrainment sampling since the project’s inception, even though the sampling methods employed were designed specifically for collection of fish. Information on the numbers and species of invertebrates encountered continues to be collected due to its potential utility in assessments of the indirect impacts of maintenance dredging in the shipping channels. A total of 139,523 invertebrates were encountered during entrainment sampling in 2009 and 10,001 were encountered during fish community monitoring. These numbers are estimates (as described in the methods) for most invertebrate species. Estimates are necessitated in large part due to the large number of individuals encountered and the practical need to focus on fish as opposed to invertebrates as the project’s central objective.
The most commonly encountered species for both types of sampling were, as in previous years, Asian clams and Siberian prawns (Exopalaeomon modestus), both introduced species. Large populations of these clams and shrimp exist in many of the sampled locations in the shipping channels. Clam shells persist long after death and are frequently a large percentage of the detritus left on the entrainment screen or mixed with the fish in the cod-end of the trawl. Live clams and shrimp are also very common on the screen and in the cod-end of the trawl net. The S-31 reach in the SRSC was remarkable for both the number and large size of the clams in the entrainment samples, as well as the amount of shell. The SSC Light 21 reach off the McCormack Pit DMP site was remarkable for the high numbers of small Corbicula with very little other detritus whatsoever.
More crayfish were captured than in previous years, with presence at the Spud Island and Upper Roberts Island reaches. The crayfish were of two species: the native Californian, or signal, crayfish (Pacifasticus leniusculus) and the red swamp crayfish (Procambarus clarkii) not previously documented by this sampling program. The individual species were not documented in the field and so crayfish are grouped in the data. However, the two species were of approximately equal density.

Mari-Gold Environmental Consulting Inc. Page 58
The increased abundance of crayfish seemed to coincide in these locations with noticeably more Brazilian pond weed (Egeria densa) in sampling gears.
The California floater (Anodonta californiensis), a native freshwater mussel, was again encountered in the entrainment samples from Man-made Channel reach in the SRSC, but more often from the upper reaches of the SSC. This mussel species is a federal species of concern. Samples of these mussels were provided to Dr. Jeanette Howard of the Nature Conservancy for genetic analyses. Mussels collected from the upper SSC are most closely related to other central coast populations and populations in the lower Sacramento River coastal streams of the Bay Area, south of the Russian River (Howard 2010 – in press). The presence of the native mussels in our sampling coincides with large numbers of leeches (in the SSC), lamprey ammocoetes, and fine, organic and detritus rich sediments.
The introduced overbite clam (Corbula amurensis) was found in the lower reaches of SSC in 2009. These clams are estuarine and the lower reaches of the channels are at the freshest end of their salinity tolerance. These clams were previously encountered in the lower reaches of both shipping channels. An unidentified species of jellyfish was once again present in these areas as well.
Other species of invertebrates such as mud crabs (Rhithropanopeus harrisii), and the Chinese mitten crab (Eriocheir sinensis) have been encountered previously but were not in 2009. One introduced mud snail (Cipangopaludina japonica) was entrained in 2009. These snails were observed in very low numbers in 2008 as well. Shells of native but displaced bivalves such as the bay mussel (Mytilusedulus) and the oyster (Ostrea conchaphila) are occasionally found in the entrainment samples but they have not been enumerated in 2009 as in previous years. The probable source of these shells is transfer via ship bottom. These organisms likely arrive in the fresher portions of the channel on vessel hulls, fall or are scraped off as the ships rub bottom, then die and leave their shells behind.
Invertebrates encountered in 2009 are listed in Table 30 and Table 31 by respective sampling type.
Table 30. Ranked List for Invertebrates Encountered during 2009 Entrainment Monitoring
Rank Percent Total Common Name Genus Species Origin 1 97.8 136,500 Asian clam Corbicula fluminea Introduced 2 1.5 2,078 Siberian prawn Exopalaemon modestus Introduced 3 0.3 478 leech Unknown spp. Unknown 4 0.2 229 California floater (mussel) Anodonta californiensis Native 5 0.1 205 freshwater shrimp undetermined spp. unknown 6 0.02 25 overbite clam Corbula amurensis Introduced
7 0.005 7 signal crayfish and red swamp crayfish
Pacifasticus Procambarus
Leniusculus clarkii
Native introduced
8 ~0 1 mud snail Cipangopaludina japonica introduced Total 139,523

Mari-Gold Environmental Consulting Inc. Page 59
Table 31. Ranked List for Invertebrates Encountered during 2009 Trawl Surveys
Rank Percent Total Common Name Genus Species Origin 1 70.7 7071 Siberian prawn Exopalaemon modestus Introduced 2 23.6 2360 Asian clam Corbicula fluminea Introduced 3 5.0 500 amphipods** unknown unknown Unknown 4 0.5 55 shrimp, freshwater all spp. Unknown
5 0.1 10* signal crayfish red swamp crayfish
Pacifasticus Procambarus
Leniusculus clarkii
Native introduced
6 0.04 4 freshwater mussel Anodonta californiensis Native 7 0.01 1 jellyfish undetermined spp. Unknown
Total 10,001 * Species about equally split. **The amphipods were on a piece of wooden piling that was stuck in the trawl
Based on the collected data, the authors extrapolate the total numbers of entrained invertebrates as well as entrained fish, and provide the details in Table 21. The extrapolation is presented because indirect impacts of dredging are in part based on impacts to the benthic ecology such as community disturbance and prey removal. Though not directly addressed by this sampling program, entrainment rates of invertebrates by dredge may be useful to assess indirect impacts. Total extrapolated counts predict that 2,437,184 invertebrates were entrained by the dredge operations in 2009 (Table 32) and the introduced Asian clam was the dominant taxon at all DMP sites. Asian clams accounted for almost 98 percent of the predicted total of entrained invertebrates, very similar to the 97 percent predicted in 2008.
These extrapolated data are based on numbers of invertebrates per gallon of dredged material sampled, and have not been converted into organisms per square meter (or other density measurement). The extrapolated numbers are in some cases very large. However, they describe the estimated number of entrained invertebrate organisms across the entire dredge reach.
Table 32. Extrapolated Invertebrate Entrainment Catch for 2009 by Location & Species
River SRSC SSC
Man-made Channel
ScourPond Light 21
SpudIsland
Lower Roberts Island
WindmillCove
UpperRoberts Island
Rough & ReadyIsland
UpperTurning Basin
Total S-31ScourHole
McCormackPit Roberts 2 Roberts 2 Roberts 2 Roberts 1 Roberts 1 Roberts 1
[% Sampled] [4.95] DNS [6.61] [7.70] [4.98] [3.35] [4.81] [7.49] [8.99] [5.64] Asian clam 468,687 756,430 129,870 914,760 86,782 31,146 2,387,675Siberian prawn 14,444 2,597 60 8,731 6,341 4,060 36,253leech 325 161 1,975 267 3,671 6,399CaliforniaFloater 101 728 2,363 133 3,325freshwatershrimp 3101 3,101overbite clam 378 378crayfish 39 83 122mud snail 21 21
Total 483,232 DNS 759,909 132,831 221 0 926,298 95,753 39,010 2,437,184 Note: Gray shading indicates introduced species.

Mari-Gold Environmental Consulting Inc. Page 60
4.6 Bird Activity Observations
Observations of piscivorous birds were made at all 2009 trawl and DMP site locations during active monitoring periods. Few, if any piscivorous birds were observed during either entrainment or trawl surveys at the Man-made Channel, Scour Pond, Light 21, Spud Island, Lower Roberts, and Windmill Cove dredge reach locations and their associated DMP sites. Observations of piscivorous gulls and terns, cormorants, and an occasional western griebe or heron became more numerous at the end of September at Upper Roberts Island. Larger flocks (12-50 individuals) of gulls and terns were commonly observed perched on Port of Stockton buildings or drifting in the channel during trawl surveys at the Rough and Ready Island and the Upper Turning Basin dredge reaches. One brown pelican was observed on the last day of monitoring for the season in the Upper Turning Basin reach. Swainson’s hawks were not observed during monitoring activities.
Piscivorous wading birds (egrets and herons of 1-10 birds) were more frequently observed in the Roberts 1 DMP site for the Upper Roberts, Rough and Ready, and Upper Turning Basin dredge reaches. During two different entrainment surveys at the Roberts 1 DMP site large mixed flocks of approximately 100-200 gulls, terns, crows, egrets and herons were observed at the far end of the DMP site ½ to ¾ miles distant from the pipeline discharge point. On these occasions, bare soils had been newly exposed in preparation to receive additional decanting water from the DMP site. Piscivorous birds were absent or rare at all other DMP sites and their associated dredge reaches prior to late September.
One sea lion was observed at the Scour Pond dredge reach hauled out on a navigation buoy near the Antioch Bridge in late August. Sea lions were observed in the channel and hauled out, for nearly the full duration of trawl sampling, at Rough and Ready Island dredge reach in the SSC. In one instance, 3 sea lions had hauled out together under Berth B on Rough and Ready Island.
4.7 Comparison of Monitoring Method Results
Assessments of relationships between the species, habits, and relative abundance of the fish encountered in the community and entrainment monitoring are made where enough data exists. Making these comparisons helps answer questions about the suitability of the fish community sampling methodology for testing the hypotheses about the subset of species most susceptible to entrainment.
Fish were categorized into demersal (benthic and epi-benthic) and non-demersal (pelagic) fish types based descriptions in Moyle (2002), Wydoski and Whitney (2003), Nobriga et al. (2005), and Brown and May (2006). During 2009, demersal species comprised 62 percent of the individual fish in the fish community trawl catch, varying by dredge location from 4.6 percent at Light 21 to over 96 percent at Windmill Cove (Table 33). The percentage of demersal fishes in the entrainment samples was much higher than in the fish community catch at all locations where both sampling methods were conducted (Figure 22). This was true for 2008 as well. Only five of the 403 entrained fish in 2009 (1.24%) were pelagic species.

Mari-Gold Environmental Consulting Inc. Page 61
Table 33. Percent Demersal Fishes by Location in 2009 Trawl & Entrainment Sampling
LocationEntrainment Trawl % Demersal Mean CPUE (fish/100m) % Demersal
Man-made Channel/S-31 98.6 5 56.4 Scour Pond not sampled 1 33.3 Light 21/McCormack 66.7 3 4.6 Spud Island 100 3 42.6 Lower Roberts Island 100 13 80.8 Windmill Cove 100 30 96.3 Upper Roberts Island 100 19 83.0 Rough and Ready Island 95.3 22 41.8 Upper Turning Basin 94.1 14 16.7
Presence in the fish community samples predicates presence in the entrainment samples with few exceptions as might be expected. However, relative abundance of species in the fish community samples does not directly correlate with relative abundance in the entrainment samples. In 2009, lamprey (n = 20, 4.96% of entrainment) were the only fish to be encountered in entrainment, but not in fish community monitoring. They have been part of the fish community catch in the past, though never in high numbers (one in 2007 and 13 in 2006). Ten additional fish species were encountered in community monitoring but not in entrainment, which included: threadfin shad, starry flounder, white sturgeon, splittail, common carp, black crappie, largemouth bass, redear sunfish, Sacramento pikeminnow, and tule perch. The more pelagic striped bass, shads, and wakasagi have been entrained, but rarely (only once each in 2009). Additionally, demersal species that are rare in the entrainment samples tend to be rare in the community samples. Pelagic species are also rare in the entrainment samples overall. Only two fish species, the introduced shimofuri and shokihaze gobies (both demersal), were more common in the entrainment samples than in the community samples. Shimofuri goby was also the most commonly entrained fish species for the first time in 2009. Table 34 provides additional details about species encountered during both types of sampling. American shad and wakasagi were added to this list in 2009. Though the relative abundances changed between years, the fish species encountered in both types of sampling were the same in 2008 with the exception of threadfin shad in place of American shad.
Figure�22.�Percent�Demersal�Fishes�in�Overall�Catch�by�Survey�Method�for�Each�Dredge�Reach�

Mari-Gold Environmental Consulting Inc. Page 63
Table 34. Trawl & Entrainment Percentage for Fish Species Observed in Both Sampling Methods
TrawlCount
Percent Catch of Trawl
Percent Catch ofEntrainment
Entrainment Count Common Name Origin
Demersal/ Pelagic
3,433 55.02 12.90 52 white catfish Introduced Demersal 1,413 22.64 0.25 1 striped bass Introduced Pelagic
294 4.71 7.44 30 channel catfish Introduced Demersal 31 0.51 64.76 261 shimofuri goby Introduced Demersal
245 3.93 0.25 1 American shad Introduced Pelagic 136 2.18 0.25 1 wakasagi Introduced Pelagic
29 0.46 2.98 12 yellowfin goby Introduced Demersal 13 0.21 4.96 20 shokihaze goby Introduced Demersal 9 0.14 0.25 1 warmouth Introduced Pelagic 2 0.03 0.50 2 prickly sculpin Native Demersal 3 0.05 0.25 1 brown bullhead Introduced Demersal 3 0.05 0.25 1 bluegill Introduced Demersal
The total lengths of fishes were collected in both entrainment and fish community monitoring. The difference in mean size among species encountered in both survey types allows testing of correlations between the size of fish present around the dredge and the likelihood of entrainment. In 2009, twelve fish species were encountered in both monitoring methods. However, for entrainment monitoring, six species of fish were represented by only one individual each. Figure 23 displays a bar chart comparison of the mean size of fishes encountered by survey type.
4.8 Water Quality Monitoring
Surface and bottom measurements were acquired for all parameters except Secchi depth and were generally taken at the beginning and end of each fish community sampling event. A total of 40 surface and 37 bottom water quality readings were made in 2009. The complete multi-parameter results are presented in Appendix B. The water quality data discussed below are near bottom measurements.
Dissolved oxygen measurements ranged between 77 percent and 115 percent with two bottom readings below 80 percent (Light 21 and Lower Roberts Island dredge reaches). Bottom water temperature readings exceeded 20°C in all monitoring locations until October. The maximum water temperature recorded for 2009 was 25.36°C in the Upper Roberts Island reach on September 23. The minimum temperature of17.92°C was found in the Upper Turning Basin, recorded on October 14th, two days prior to completion of 2009 monitoring. Salinity readings near 1.0 salinity units showed slightly brackish conditions at the two lowest SSC dredge reaches of Scour Pond and Light 21 with freshwater readings below 0.3 at all other reaches. The highest turbidity readings (generally above 100 ntu) were recorded in the Man-made Channel reach. Additional water quality data can be downloaded at the California Data Exchange Center (CDWR 2009) for Antioch, Rough and Ready Island and other areas in the Delta. Data on the website include river stage, pH, temperature, DO, conductivity, turbidity and other parameters taken on an hourly basis.

��� Note: Error bars represent one standard deviation based on the measured number of individuals; no bars indicate only one specimen collected
Figure 23. Mean Size of Fish Species Collected in both Trawl and Entrainment in 2009 (+/- one standard deviation)
0
50
100
150
200
250
300
American shad bluegill brown bullhead channel catfish prickly sculpin shimofuri goby shokihaze goby striped bass wakasagi warmouth white catfish yellowfin goby
Mean
Tota
l Len
gth
(mm)
Trawl Entrainment

Mari-Gold Environmental Consulting Inc. Page 65
4.9 Level of Take
A stated objective of the monitoring program is to improve take estimates for maintenance dredging operations in the Delta. Original take estimates for the 2006 FMP (Table 35) were based on the estimates developed for the Stockton DWSC and the Sacramento DWSC maintenance dredging BOs (NMFS 2006a,b). It was assumed that exposure of listed fish to sampling gear would be less than 25 percent of the potential exposure to dredging activities and associated shipping, a very conservative overestimate, since no salmon or steelhead, and only two green sturgeon have been encountered during monitoring of dredging operations over the past four years.
Table 35. ESA & CESA Incidental Take Allotments for 2009 & 2010
Potential annual incidental take for NMFS jurisdiction listed fish for fish monitoring of the Stockton DWSC Maintenance Dredge Project (original estimate 2006)
Species Juveniles Adults
No. % of Total ESU/DPS* No. % of Total
ESU/DPS*Sacramento River winter-run Chinook salmon 650 0.85 1 <1 Central Valley spring-run Chinook salmon 1,250 0.32 1 <1 Central Valley steelhead 70 0.15 2 <1 North American green sturgeon, Southern DPS 25 juveniles and adults combined (2% = 1 mortality) Potential annual incidental take for NMFS jurisdiction listed fish for fish monitoring of the Sacramento DWSC Maintenance Dredge Project (original estimate 2006)
Species Juveniles Adults
No. % of Total ESU/DPS* No. % of Total
ESU/DPS*Sacramento River winter-run Chinook salmon 650 0.85 1 <1 Central Valley spring-run Chinook salmon 1,250 0.32 1 <1 Central Valley steelhead 70 0.15 2 <1 North American green sturgeon, Southern DPS 25 juveniles and adults combined (2% = 1 mortality)
Incidental take for USFWS jurisdiction listed fish for fish monitoring of the SRSC and SSC
Species Juveniles Adults non-lethal lethal non-lethal lethal
delta smelt 10 per week, lethal and non-lethal, no life history differentiation
IEP-ESA incidental annual take allotments for fish community sampling in the SRSC and SSC 2010
Species Juveniles Adults non-lethal lethal non-lethal lethal
longfin smelt 150 150 * ESU = evolutionarily significant unit . DPS = distinct population segment.
Estimates of take of delta smelt and longfin smelt were not included in the original take estimates, as NMFS does not provide take estimates for these fish species, nor were they established during previous informal consultations with the USFWS. Additional consultation with USFWS resulted in a letter amendment (reference number 81420-2008-F-1775-1) to the prior USFWS Informal Consultation decision for maintenance dredging (Service File Number 1-1-04-F-0345), allowing the take of up to ten delta smelt per week during normal dredging operational windows. Incidental and lethal take for longfin smelt during fish community monitoring was authorized under Program Element

Mari-Gold Environmental Consulting Inc. Page 66
Number 2009-113 for inclusion in the amended IEP Scientific Collecting Permit 1440. The IEP permit allowed 150 adults and 150 juvenile longfin smelt in this study’s take allotment for 2009 monitoring.
None of the listed species above were encountered or observed while conducting fish community or dredge entrainment monitoring in 2009.
Sampling Mortality
Some mortality among encountered fish is an unavoidable result of fish community and entrainment sampling, although in the case of the entrainment sampling, all entrained fish are assumed to die as a result of being entrained and then placed in a DMP site. De-watering of DMP sites is not conducted in an effort to save entrained fish that are still alive when de-watering occurs. Rather, it is conducted out of necessity to remove the water from the sites. Entrainment sampling probably reduces overall dredge entrainment mortality as live fish collected during sampling are returned to the river. In this sense, documentation of entrainment mortality serves a separate purpose than that of community sampling mortality.
Estimation of mortality during fish community sampling is presented due to the interest in documenting the “costs” of sampling. Many types of fisheries sampling methods result in mortality to some or all of the sampled fish. Sampling mortality is weighed and justified from the standpoint of research need, government mandate, species conservation measures, as well as cultural and ethical considerations. The investigators conducting this monitoring program seek to minimize sampling mortality wherever and whenever possible, and have in some cases decided to reduce the amount of data gathered based on the desire to minimize mortality to non-target species. Data gathered by this monitoring study on non-special status species may prove useful to this and other studies. However, in large part, this data is not central to the requirement to conduct the monitoring. The monitoring mandate is related to a very small subset of the species encountered due to, and required by their currently rare occurrence in the environment. The project faces an area of compromise between gathering data and increasing the mortality of encountered fish by delaying their release. The investigators address this by sorting the catch based on data needs, data availability from this and other studies, and interspecies variability in survival rate. The result is that the field biologists immediately remove and return to the river (without measuring) most striped bass, American shad, threadfin shad, and channel and white catfish. In the case of the catfish, the field biologists continue to gather ample data on a subset of these abundant introduced fishes. In the case of the other fishes that rapidly exhibit handling stress, only a quick return to the river can help minimize mortality. No rare and or special status species (if not vouchered) is ever returned to the river without acquiring length measurements and making other observations. Mortality is estimated by directly counting dead fish with a re-correction after observing released fish. Table 36 provides the mortality data for fish from the fish community samples and Table 37 provides the mortality data from the entrainment samples.
Lamprey experienced some mortality during entrainment sampling. Seven unidentified lamprey fell through the entrainment screen or escaped upon transfer to the live-well and were counted as mortalities. Shimofuri goby had the highest entrainment mortality rates (63 individuals), accounting for 64 percent of all entrainment mortalities. Overall, entrainment monitoring resulted in 99 mortalities, or 24.6 percent of the fish entrained by the dredge. Native fish (lamprey) comprised 1.28 percent of all sampling mortality, not including vouchered specimens.
A total of 598 individuals, or 9.58 percent of the total catch, were recorded as mortalities during fish community sampling. The highest mortality rates were observed among striped bass, threadfin shad,
Mari-Gold Environmental Consulting Inc. Page 67
wakasagi, and American shad. These four species accounted for 94.4 percent of total mortality during community sampling (not including vouchered specimens).
Portions of the man-made channel of the SRSC and possibly other delta channel locations may contain populations of delta smelt, wakasagi, and or hybrids of the two. Field identification and differentiation is possible but non-trivial following Wang, 2007. Hybridization of wakasagi and delta smelt has become an important ecological concern. It is a regulatory concern also, as hybrids are not due special status while delta smelt are. Minimizing fish community sampling effort when these fish are present due to the difficulty of positive differentiation in the field was employed in 2008 and 2009. All delta smelt, potential hybrids and wakasagi are now required to be vouchered for further analysis by CDFG. In 2009, nine smelts were vouchered for such additional analysis and identification. All of these fish were determined to be wakasagi by CDFG. The vouchered wakasagi are included in the mortality data presented in Table 36.
Table 36. Total Mortality for 2009 Fish Community Sampling
Common Name Total Mortalities Percent Trawl Mortality Origin striped bass 226 37.8 Introduced threadfin shad 136 22.7 Introduced wakasagi 119 19.9 Introduced American shad 84 14.0 Introduced white catfish 17 2.8 Introduced shimofuri goby 8 1.3 Introduced yellowfin goby 6 1.0 Introduced bluegill 1 0.2 Introduced shokihaze goby 1 0.2 Introduced Total 598
Table 37. Total Mortality for 2009 Entrainment Sampling
Common Name Total Mortalities Percent Entrainment Mortality Origin shimofuri goby 63 64 Introduced channel catfish 11 11 Introduced white catfish 8 8 Introduced lamprey, unidentified species 4 4 Native shokihaze goby 3 3 Introduced American shad 1 1 Introduced bluegill 1 1 Introduced striped bass 1 1 Introduced wakasagi 1 1 Introduced Total 99
Vouchered Specimens
Overall, 11 fish specimens were vouchered in 2009 (Table 38). One Pacific lamprey ammocoete was preserved for further examination and submitted to the USFWS in Arcata, CA. Nine wakasagi were sent to CDFG for positive identification and examination. California floaters were provided to The Nature conservancy for inclusion in an investigation of West Coast mussels being conducted for the US Forest Service. (Howard 2010). One prickly sculpin and one mud snail were also retained for further examination and confirmation of identification.
Mari-Gold Environmental Consulting Inc. Page 68
Table 38. Vouchered Specimens Collected during 2009 Monitoring
Species Total
Vouchered River Method of Collection Reason Location Origin
wakasagi 9 SRSC Otter Trawl Positive ID, further study CDFG Stockton, CA Introduced
prickly sculpin 1 SSC Screen Positive ID Mari-Gold Environmental Native Pacific lamprey, ammocoete 1 SSC Screen Positive ID USFWS-Arcata office Native
California floater (mussel) 45 SSC Screen Genetic Study Dr. J. Howard, Nature
Conservancy - SF Native
Mud snail 1 SSC Screen Positive ID Dr. J. Howard, Nature Conservancy - SF Introduced
Total 57
4.10 All Years Combined Data
Tables 39 and 40 present the combined fish community and entrainment catch for all years (2006-2009) without regard to inter-annual differences in effort, location, method or timing. The basic information presented in this manner provides a description of the Delta fish species that have been present in the shipping channels while maintenance dredging was occurring, and the subset of those species most susceptible to entrainment. Introduced species greatly outnumbered natives both by species and by number of individuals. The proportion of demersal to pelagic species was higher both in species and in numbers of individuals in the entrainment samples than it was in the fish community samples. All native species entrained were demersal, while half of the native species encountered in the fish community samples were pelagic.
Table 39. Combined Fish Catch for Entrainment Sampling during All Years of Study
Rank Number Proportion Common Name Origin Demersal/Pelagic 1 267 0.3683 shimofuri goby Introduced Demersal 2 226 0.3117 channel catfish Introduced Demersal 3 92 0.1269 white catfish Introduced Demersal 4 67 0.0924 lamprey spp. Native Demersal 5 29 0.0400 Shokihaze goby Introduced Demersal 6 23 0.0317 yellowfin goby Introduced Demersal 7 5 0.0069 brown bullhead Introduced Demersal 7 5 0.0069 striped bass Introduced Pelagic 8 2 0.0028 bluegill Introduced Pelagic 8 2 0.0028 Pacific staghorn sculpin Native Demersal 8 2 0.0028 prickly sculpin Native Demersal 8 2 0.0028 warmouth Introduced Pelagic 9 1 0.0014 American shad Introduced Pelagic 9 1 0.0014 threadfin shad Introduced Pelagic 9 1 0.0014 wakasagi Introduced Pelagic
Total: 725 90.21% introduced Species: 15 (3 Native)
Mari-Gold Environmental Consulting Inc. Page 69
Table 40. Combined Fish Catch for Trawl Sampling during All Years of Study
Rank Number Proportion Common Name Origin Demersal/Pelagic 1 18,383 0.5733 white catfish Introduced Demersal 2 5,025 0.1567 threadfin shad Introduced Pelagic 3 3,082 0.0961 striped bass Introduced Pelagic 4 2,233 0.0696 American shad Introduced Pelagic 5 1,499 0.0467 channel catfish Introduced Demersal 6 918 0.0286 longfin smelt Native Pelagic 7 154 0.0048 wakasagi Introduced Pelagic 8 137 0.0043 yellowfin goby Introduced Demersal 9 106 0.0033 white sturgeon Native Demersal 10 94 0.0029 shokihaze goby Introduced Demersal 11 89 0.0028 shimofuri goby Introduced Demersal 12 72 0.0022 starry flounder Native Demersal 13 63 0.0020 tule perch Native Pelagic 14 36 0.0011 delta smelt Native Pelagic 15 29 0.0009 prickly sculpin Native Demersal 16 19 0.0006 splittail Native Pelagic 17 17 0.0005 warmouth Introduced Pelagic 18 15 0.0005 common carp Introduced Demersal 19 14 0.0004 blue catfish Introduced Demersal 20 13 0.0004 lamprey spp. Native Demersal 21 10 0.0003 Sacramento blackfish Native Pelagic 22 9 0.0003 bluegill Introduced Pelagic 22 9 0.0003 brown bullhead Introduced Demersal 23 5 0.0002 unidentified goby Introduced Pelagic 24 4 0.0001 Pacific staghorn sculpin Native Demersal 25 3 0.0001 black crappie Introduced Pelagic 25 3 0.0001 white crappie Introduced Pelagic 26 2 0.0001 green sturgeon Native Demersal 26 2 0.0001 redear sunfish Introduced Pelagic 26 2 0.0001 Sacramento pikeminnow Native Pelagic 27 1 0.0000 bigscale logperch Introduced Demersal 27 1 0.0000 Mississippi silverside Introduced Pelagic 27 1 0.0000 largemouth bass Introduced Pelagic
Total: 32,067 95.97% introduced Species: 33 (12 Native)
Green sturgeon, longfin smelt and delta smelt are the only special status (listed) species that have been encountered over all years of this monitoring program. White sturgeon collection data are included here as surrogate data due to lack of green sturgeon data. Encounters with special status species are further detailed in Table 41. All of these fish were encountered during fish community sampling.
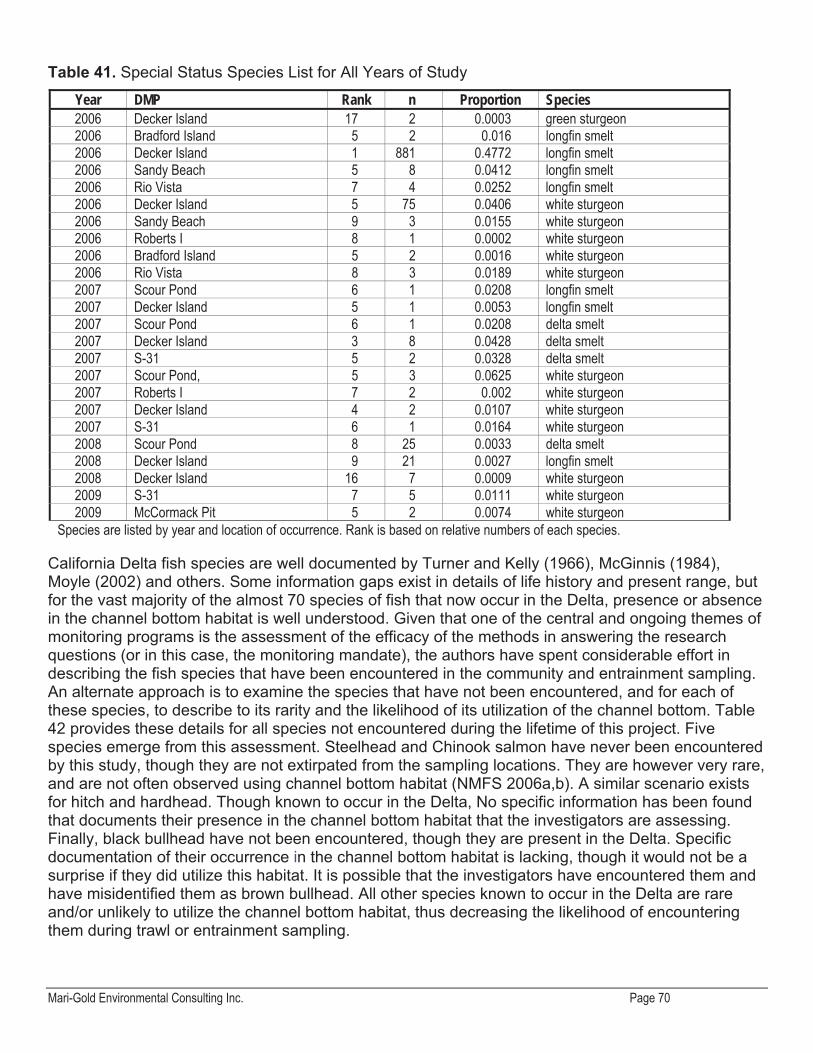
Mari-Gold Environmental Consulting Inc. Page 70
Table 41. Special Status Species List for All Years of Study
Year DMP Rank n Proportion Species 2006 Decker Island 17 2 0.0003 green sturgeon 2006 Bradford Island 5 2 0.016 longfin smelt 2006 Decker Island 1 881 0.4772 longfin smelt 2006 Sandy Beach 5 8 0.0412 longfin smelt 2006 Rio Vista 7 4 0.0252 longfin smelt 2006 Decker Island 5 75 0.0406 white sturgeon 2006 Sandy Beach 9 3 0.0155 white sturgeon 2006 Roberts I 8 1 0.0002 white sturgeon 2006 Bradford Island 5 2 0.0016 white sturgeon 2006 Rio Vista 8 3 0.0189 white sturgeon 2007 Scour Pond 6 1 0.0208 longfin smelt 2007 Decker Island 5 1 0.0053 longfin smelt 2007 Scour Pond 6 1 0.0208 delta smelt 2007 Decker Island 3 8 0.0428 delta smelt 2007 S-31 5 2 0.0328 delta smelt 2007 Scour Pond, 5 3 0.0625 white sturgeon 2007 Roberts I 7 2 0.002 white sturgeon 2007 Decker Island 4 2 0.0107 white sturgeon 2007 S-31 6 1 0.0164 white sturgeon 2008 Scour Pond 8 25 0.0033 delta smelt 2008 Decker Island 9 21 0.0027 longfin smelt 2008 Decker Island 16 7 0.0009 white sturgeon 2009 S-31 7 5 0.0111 white sturgeon 2009 McCormack Pit 5 2 0.0074 white sturgeon
Species are listed by year and location of occurrence. Rank is based on relative numbers of each species.
California Delta fish species are well documented by Turner and Kelly (1966), McGinnis (1984), Moyle (2002) and others. Some information gaps exist in details of life history and present range, but for the vast majority of the almost 70 species of fish that now occur in the Delta, presence or absence in the channel bottom habitat is well understood. Given that one of the central and ongoing themes of monitoring programs is the assessment of the efficacy of the methods in answering the research questions (or in this case, the monitoring mandate), the authors have spent considerable effort in describing the fish species that have been encountered in the community and entrainment sampling. An alternate approach is to examine the species that have not been encountered, and for each of these species, to describe to its rarity and the likelihood of its utilization of the channel bottom. Table 42 provides these details for all species not encountered during the lifetime of this project. Five species emerge from this assessment. Steelhead and Chinook salmon have never been encountered by this study, though they are not extirpated from the sampling locations. They are however very rare, and are not often observed using channel bottom habitat (NMFS 2006a,b). A similar scenario exists for hitch and hardhead. Though known to occur in the Delta, No specific information has been found that documents their presence in the channel bottom habitat that the investigators are assessing. Finally, black bullhead have not been encountered, though they are present in the Delta. Specific documentation of their occurrence in the channel bottom habitat is lacking, though it would not be a surprise if they did utilize this habitat. It is possible that the investigators have encountered them and have misidentified them as brown bullhead. All other species known to occur in the Delta are rare and/or unlikely to utilize the channel bottom habitat, thus decreasing the likelihood of encountering them during trawl or entrainment sampling.

Mari-Gold Environmental Consulting Inc. Page 71
Table 42. Delta Fish Species Not Encountered in Trawl or Entrainment Sampling during Lifetime of StudySpecies Origin Utilizes Channel Bottom Habitat Rare in the Delta Sacramento sucker Catostomus occidentalis Native No No steelhead Oncorhynchus mykiss Native No Yes Chinook salmon Oncorhynchus tshawytscha Native No Yes hitch Lavinia exilicauda Native No Yes riffle sculpin Cottus gulosus Native No No hardhead Mylopharodon conocephalus Native No Yes threespine stickleback Gasterosteus aculeatus Native No No topsmelt Atherinops affinis Native No No California roach Hesperoleucus symmetricus Native No No speckled dace Rhinichthys osculus Native No No American eel Anguila rostrata Introduced Questionable Yes black bullhead Ameiurus melas Introduced Questionable No pumpkinseed Lepomis gibbosus Introduced No No green sunfish Lepomis cyanellus Introduced No No smallmouth bass Micropterus dolemieu Introduced No No spotted bass Micropterus punctulatus Introduced No No goldfish Carrasius auratus Introduced No No western mosquitofish Gambusia affinis Introduced No No rainwater killifish Lucania parva Introduced No No fathead minnow Pimephales promelas Introduced No No red shiner Cyprinella lutrensis Introduced No No golden shiner Notemigonus crysoleucas Introduced No No

Mari-Gold Environmental Consulting Inc. Page 72
5 Discussion
5.1 Hypotheses
This monitoring program’s methodologies were developed to assess the assumptions in the NMFS BO’s incidental take statement for listed salmonids and green sturgeon. NMFS assumed that take of these species would be low and required that a monitoring program be developed and conducted to determine level of take. This monitoring program allows the continued development of measures to avoid, minimize, and monitor the impacts of maintenance dredging on listed salmonids, green sturgeon and their habitat.
The hypotheses were developed prior to the initiation of 2006 monitoring as the means to convert the monitoring requirements into heuristically testable assumptions and questions. They are repeated here again for clarity:
� H1: Maintenance dredging of the SSC and SRSC will result in take of listed and other fishes through direct dredge entrainment.
� H2: There is a correlation between presence of fish in the dredging areas and entrainment by the dredge.
� H2a: Differential use of the water column will result in different entrainment levels among fishes present in the project areas; that is, demersal fish that are associated with the channel bottom (benthic and epibenthic species) will be entrained at higher levels than pelagic fish, which are associated with the water column.
H1: This hypothesis has been tested during all years of this monitoring program. In 2009, H1 again proved to be partially correct. Fish species were entrained, though none were listed species. In 2009, the overall amount of dredge discharge sampled during entrainment monitoring again increased substantially. At the same time that effort increased, greater species diversity and abundance were observed. The sampled proportion of dredged material increased from 4.4 percent in 2008 to 5.64 percent in 2009. A total of 403 fish from 14 different taxa were observed in 2009, an increase from 11 in 2008, including three natives – lamprey from genus Lampetra, Pacific lamprey, and prickly sculpin.
When these numbers are extrapolated, based on percent of total dredge output sampled, the total number of fish entrained from this project across all sites is approximately 7,500 fish. This figure is likely to vary from year to year as both the number and composition of species change. These changes may come about as a result of future unforeseeable environmental perturbations/changes, and as a result of (planned) changes to the monitoring methods, effort, and locations. The low fish entrainment rates observed since the inception of monitoring continue to indicate low overall impacts (via direct effects) from direct entrainment of special status and other Delta species.
To date, no listed species have been observed in entrainment. This does not ensure that listed species have not been entrained over this time period, nor does it guarantee that listed species have not been subjected to take from dredging impacts other than direct entrainment. Fish community monitoring has shown that listed fish species occasionally occur within the dredging reach, although in relatively low numbers. Therefore, these fish are potentially subjected to take in the form of harm or harassment from dredge and monitoring activities.
H2 and H2a: These hypotheses are important because a goal of this monitoring program is to provide information to management agencies about both susceptibility to entrainment and presence of listed
Mari-Gold Environmental Consulting Inc. Page 73
and other species utilizing the dredged areas. The data set has gained strength through the use of the mobile entrainment screen by allowing assessment of an order of magnitude more of the dredge’s output than was previously possible with the sampling cell method. Increasing the amount of dredge material sampled increases the accuracy of the comparison between the species utilizing the channel bottom and those that are entrained. Fish community assessments conducted in conjunction with entrainment monitoring provides information useful for determining the likelihood of entrainment. Simply stated, rarity in the environment decreases entrainment rates. However, rarity in the environment also confounds our ability to assess likelihood of entrainment based on described behavioral differences among species of interest. The investigators have been faced so far with interpreting potential for incidental take based on data from of non-special status species. NMFS predicted that take of green sturgeon would be higher than listed salmonids based partly on the differential (demersal vs. non-demersal or pelagic) habits of these fish. Thus, H2 and H2a provide the framework to assess whether demersal fish actually are entrained at higher rates than pelagic fish.
Classification of fish species as demersal or pelagic was based on general feeding habit and habitat preferences, following Moyle (2002), Wydoski and Whitney (2003), Nobriga et al. (2005), and Brown and May (2006). Other environmental factors that may affect whether a species occupies demersal habitat, such as altered habitat and altered predator-prey relationships, were not considered due to lack of site specific information. These altered environmental and ecological factors may affect migratory, diel, and feeding behavior of Delta fishes with potential for greater overlap of pelagic and demersal behaviors (Feyrer and Healey 2002, 2003; Norbriga et al. 2005).
With the exception of lamprey, entrained fish continue to represent a subset of those species observed in the community samples, though relative abundance of species varies dramatically between entrained species and species utilizing the channel around the dredge. Pelagic fish are comparatively rare in the entrainment samples, but not in the fish community samples.
River lamprey, Pacific lamprey and other lamprey spp. were again observed in entrainment sampling but not in fish community sampling. Ammocoete stage lamprey may be buried in the sediment with only their heads sticking out to filter-feed. This might result in the trawl passing over rather than entrapping them as it moves by. Some of the lampreys encountered have exhibited characteristics of the free swimming macropthalamic juvenile phase of development as well. These fish, though smaller than adults, share some of their characteristics: large, well developed eyes, developing teeth, white/silver side and ventral coloration and bluish to black dorsal coloration. Most importantly, they are strong swimmers and an ideal size and shape to escape through the trawl mesh. Although one specimen was encountered in 2007 using the same-sized trawl net, the mesh size of the trawl net is larger than the hole size of the entrainment screen. This may increase the odds of small lampreys escaping through the trawl that would be retained by the entrainment screen. Thus, for lamprey it can be assumed that fish community monitoring, as currently conducted, may not be capable of establishing a relationship between abundance in the channel and entrainment rates.
In addition, several demersal species were encountered during community sampling that were not observed in entrainment sampling in 2009. These species consisted of white sturgeon, starry flounder, and common carp. This difference between entrainment and fish community sampling may be due to: a low occurrence of these species; low sampling efficiency at the corresponding DMP site; and/or avoidance behavior around the dredge. Together, these fish only made up 0.17 percent of the total fish encountered in trawl sampling (ten individuals). Only one white sturgeon has been observed as entrained since 2006. This fish was observed by one of RISG’s crew during 2006 operations at the Bradford Island DMP site. The fish appeared unharmed after traveling through the dredge pipeline and was returned to the river by the fill crew. No sturgeon, starry flounder, or common carp have

Mari-Gold Environmental Consulting Inc. Page 74
been observed during entrainment sampling. During fish community sampling, starry flounder are occasionally encountered, and common carp are rarely encountered. Both of these species are considered demersal, though the flounder probably is more demersal than the carp. Because both species are strong swimmers, they may be able to avoid the dredge and both can grow large enough to afford some protection from entrainment as well.
In 2009, among all of the more commonly encountered entrained fish species, mean length was smaller than that of those same species encountered in fish community sampling. In 2008, a test of significance was performed for channel catfish and white catfish to determine if the size of the fish being entrained was significantly different from the size of fish in trawl sampling (SWCA 2009). An unequal variance t-test was performed and indicated a significant difference in sizes. According to the data, smaller channel catfish and white catfish were more susceptible to entrainment than larger fish of the same species (SWCA 2009). This relationship is also likely to be stronger than reported, as the larger catfish are more able to avoid the trawl net and thus are not represented in the fish community data. Reports from fisherman and observations of sea lion predation have indicated that larger catfish are present in the areas sampled.
In order to fully test H2a, more knowledge of the fish inhabiting the dredging sites is needed. This knowledge will be provided by future sampling efforts from this monitoring program and by other studies of Delta fish. The IEP sponsors several long-term status and trends studies, such as the Estuarine and Marine Fish Abundance and Distribution Survey and the Fall Midwater Trawl Survey. There are also other recent studies such as those initiated by the Pelagic Organism Decline (POD) work team. These and other studies will continue to be used to assess the vulnerability of Delta fishes to dredge entrainment. Comparing data across studies will always be problematic since there are substantial differences in sampling timing, methods, and locations. Substantial data gaps still exist in many critical areas of the life history and population biology of listed and other Delta fish species. The lack of basic biological information for some Delta species is compounded by the rapid changes (declines) that some populations are currently experiencing (Bennett 2005; IEP 2008).
Several other factors add additional complications to the hypothesis testing and analysis of vulnerability to entrainment. Among the 33 fish species encountered in all years, only 15 can be readily defined as demersal rather than pelagic. These species include: sculpin, goby, catfish, sturgeon, flounder, lamprey, and carp. The trawl net samples from the channel bottom up into the water column while it is open during the tow. The exact height of the cork-line above the bottom has not been determined, but may approach one-third of the total water column height at times and so reach into the zone that pelagic fish may be utilizing. In comparison, the dredge cutter head stays buried in or very close to the channel bottom while entrainment sampling is conducted. The pelagic species may utilize the entire water column in some cases and others may engage in diurnal migrations to the surface or the bottom. Within species, behavioral differences based on life stage also hamper generalized discussion of water column usage. Additionally, the described behaviors for individual species are often based on observations from all of the inland California water bodies in which they occur (Moyle 2002), rather than at specific Delta locations. There is some knowledge of which specific areas of the Delta are used by individual species and of how seasonal fluctuations impact species presence in the shipping channel. Yet, many gaps remain for specific Delta locations and groups of fishes (Moyle 2002; Feyrer and Healey 2002, 2003; Bennett 2005; Nobriga et al. 2005; Brown and May 2006).

Mari-Gold Environmental Consulting Inc. Page 75
5.2 Sampling Design Efficiency
The magnitude of increase in percent of total volume sampled by entrainment sampling compared to prior years may be attributed to the exclusive use of the entrainment screen in 2009 at all DMP sites. With continued use of the pneumatic-assisted Y-valve (installed in 2008) and refinement of its operation during initial uses in 2009, the dredge’s pumping rate could usually remain unaltered while the output was diverted from the DMP site to the monitoring screen. The efficiency of entrainment monitoring has thus improved over prior years; when there was more need to idle the dredge to divert material for entrainment monitoring.
The entrainment sampling goal of 5 percent of dredge output was not achieved at all sites, though an average 5.64 percent of the overall output was sampled. Dredge slurry with abundant organic debris created, at times, a short-term build-up of mixed sediment and debris on the screen’s surface. Occasionally, the flow of organic material caused the discharge to over-top the sides and/or run off the dump-end of the screen. Also in 2009, there were several occurrences of rapid overwhelming of the screen due to excessive volume of clams and clam shells, clay balls, and at times gravel and rock. These incidences of over-topping or overwhelming were infrequent and short-lived, usually lasting between 15 to 60 seconds in the case of the over-topping. Because the discharge stream could not be adequately screened or observed for potential organisms during these occurrences, screen operators noted the duration of the event and reduced the total time for that entrainment sample accordingly. During incidences of overwhelming, the dredge material was diverted and sampling discontinued until the screen could be cleared and sampling resumed.
Improvements to the entrainment screen slated for 2010 should improve the predictive ability of the sampling. More robust entrainment estimates will help identify trends and further test the study’s hypotheses. Improvements slated for the sampling screen and changes related to these improvements are discussed in the adaptive management and recommendations sections.
A maximum of five daily trawls were performed during each day that fish community sampling was conducted. No additional trawls were conducted at any sites. Based on an assessment of the species that have not been encountered during fish community surveys, we believe that five trawls accurately sample the community structure in the shipping channel, recognizing the possibility that sampling on a more random basis, or across a broader time window may help understand the changes to fish community that are continually occurring. Increases to the level of effort would increase our understanding of the presence of the rare species, as well as refine our understanding of relative abundance and other population parameters of fishes that utilize the shipping channels. However, any increase in fish community sampling effort would increase sampling costs as well as increase mortality among sampled fish. Any increases to sampling frequency, tow duration, or change of sampling location must first be approved by CESA administrator Kelly Souza (CDFG).
Statistical tests conducted in 2008 indicated that demersal, and particularly smaller fishes, were more vulnerable to entrainment than the larger and non-demersal fishes present in the navigation channels during active dredging. These results helped confirm H2a, in that fish associated with the channel bottom (demersal) were entrained at higher levels than species associated with the water column (pelagic). The percentage of demersal fish entrained in 2009 was higher than 2008, again lending strength to this hypothesis. An additional but related hypothesis is that smaller and/or juvenile fishes are likely to be entrained at greater rates than larger and/or adult fishes. This related hypothesis was first confirmed in 2008 for channel catfish and white catfish by statistical tests of these data sets (at least for locations where sample sizes were robust enough). Smaller fishes were shown to be significantly more vulnerable to entrainment than larger fishes. Though the relationship
Mari-Gold Environmental Consulting Inc. Page 76
between juvenile and adult life history stages for each species encountered was not examined due to low numbers of individuals entrained, the results implied that juveniles were more vulnerable to dredge entrainment than adult fish. Results of these statistical tests underscored the continued need to collect length data for all fishes encountered in entrainment and also demonstrated that the current proportion of fishes measured for length from trawl sampling appeared adequate to test the significance of sampling relationships based on fish size.
These analyses were not repeated in 2009 for two primary reasons: 1) Comparatively lower numbers of channel and white catfish decreased the ability of investigators to repeat the analyses. 2) Potential bias in size of fish selected for sub-samples used in 2008 may have resulted in over-representation of larger fish within the length frequency data set. The high catch of shimofuri goby for the first time in 2009 corroborates the idea that smaller fishes are subject to higher entrainment rates than larger fish. Nonetheless, investigators feel that repetition of size assessment analyses, if requested, will need to be accompanied by changes in the sub-sampling protocol to ensure all size classes are equally represented.
5.3 Overview
The fish species encountered during 2009 and previous year’s fish community and entrainment monitoring are a subset of those described by Moyle (2002) for the Central Valley subprovince. The majority of the species described by Moyle as being present in the Delta but have not been encountered while monitoring are species with the following traits: rare species; species not known to inhabit the channel bottoms, such as largemouth bass, red shiner, and western mosquitofish; or species not known to occur in the areas being dredged, such as Sacramento sucker or topsmelt. Pelagic fish species with relatively high abundances in the Delta (i.e., striped bass and threadfin shad) have been commonly encountered during fish community monitoring but are rarely observed in the entrainment samples. Although 14 different native species including river lamprey and other possible but unconfirmed Lampetra spp. have been encountered in the community sampling, the only native fish so far observed in the entrainment samples have been river lamprey and possibly other Lampetra spp., Pacific lamprey, Pacific staghorn sculpin and prickly sculpin.
Recent precipitous population declines in several species of Delta fish such as delta smelt, longfin smelt, threadfin shad, striped bass (CDFG 2009a,b,c), listed salmonids, and green sturgeon (NMFS 2006a,b) document the need for ongoing assessments of Delta fish populations. Since the 2006 inception of fish community monitoring for this study, several findings have come to light that either corroborate similar observations or, instead, contrast with those of others. These trends, observations, and monitoring outcomes are listed below.
� The introduced shokihaze goby was not previously described as inhabiting the upper Delta by Moyle (2002), but this species ranked seventh in overall abundance in 2008 and twelfth overall during 2006 monitoring. In 2009, it was the ninth most common fish. The introduced shimofuri goby was eighth most common fish in 2008 and advanced to fifth most common in 2009.
� The white sturgeon to green sturgeon ratio was approximately 40:1 in 2006, much higher than the 5:1 ratio described by Moyle (2002). No green sturgeon have been encountered since 2006 and white sturgeon have been less common as well. Encounters with white sturgeon have occurred in both channels near the confluence of the two river systems, at Roberts I in the SSC and at S-31 in the SRSC (Man-made Channel). This may provide useful surrogate data for the presence of green sturgeon in these locations.

Mari-Gold Environmental Consulting Inc. Page 77
The ranking of longfin smelt from lower SRSC locations was very high in 2006 (895 were encountered, ranked first among native species and fourth among all species), as opposed to other locations in the Delta and SF Bay estuary where steep declines had been observed. In 2007, only two longfin smelt were encountered, mirroring the low catch of the Fall Midwater Trawl Survey (CDFG 2008d). The 2006 sampling appears to have coincided with the reported center of abundance of spawning adults near Rio Vista (Moyle 2002). In 2008, 21 longfin smelt were encountered, all from the SRSC in late August and early September. The (CDFG) summer tow net survey (CDFG 2009b) documented presence of longfin smelt primarily from lower SF Bay sites between June and mid-August, and as well as up to the lower end of Sherman Island during the last week in July. The Bay Study (CDFG 2009c) conducted both mid-water and otter (bottom) trawl surveys throughout the SF Bay and in limited Delta locations over each month of the year. There are three months that the Bay Study overlaps with this monitoring study. The Bay Study’s mid-water trawl survey found areas of higher longfin smelt abundance occurred at, or downstream of, Chipps Island in October and November, with presence at Decker Island in October. In contrast, the trawl surveys of this project found longfin smelt distributed downstream of Sherman Lake until November with presence near Decker Island in December.
� No longfin smelt were encountered in 2009. The Bay Study data showed that longfin smelt were present downstream of dredging locations during the 2009 season. Some longfin smelt did move into the western Delta area that corresponds with some dredging locations in both channels in January of 2010, but had moved downstream again in February. This data set is available at: http://www.dfg.ca.gov/delta/projects.asp?ProjectID=BAYSTUDY
� In 2007 the PODS progress report (IEP 2008) described the highest (worst) bloom on record of the algae (Microcystis aeruginosa) centered near Antioch. Significant efforts from the fish monitoring for maintenance dredging also took place in this region during fall 2007, and the CPUEs were at least an order of magnitude lower than previously measured by this study at any other location. The 2008 CPUE at the Antioch dredge reach was higher than that of 2007 and similar to other lower river sites monitored this year. In 2009, very little monitoring was conducted in these locations, however CPUE’s were again lowest among all sites.
� The 2008 CDFG Fall Midwater Trawl Survey collected 12 delta smelt in November and 4 in December (CDFG 2009a). The 2008 Fall Midwater Trawl delta smelt index was the lowest recorded index since inception of the study in 1967. The Bay Study did not report collection of any delta smelt throughout 2008 sampling either in their monthly midwater trawl or in otter trawl surveys (CDFG 2009c). The summer tow net survey, which sampled earlier in the summer, found relatively higher abundances at their survey stations in the SRSC near Decker Island and occasionally in the SSC downstream of Bradford Island (CDFG 2009b).
� No delta smelt were encountered in 2009. In 2008, 25 delta smelt were encountered during community sampling; 22 of the specimens were caught in the SRSC between August and early September. Of these 25 specimens, 21 were caught in the vicinity of Decker Island, one was from the Man-made Channel early in August, and the remaining three individuals were encountered near Antioch during a single night tow on September 21. Delta smelt were not encountered during 2006. However, in 2007, 11 delta smelt were encountered during November and December trawls. Of these 11 individuals, nine were from locations near the confluence of the San Joaquin and Sacramento rivers, and two were from the SRSC Man-made Channel near the Port of Sacramento. In comparison, the delta smelt index produced from CDFG’s Fall Midwater trawl survey is down again in 2009 and has

Mari-Gold Environmental Consulting Inc. Page 78
once reached a new low of 17 individual fish. This data set is available at: http://www.dfg.ca.gov/delta/projects.asp?ProjectID=FMWT
� The studies referenced above indicate that delta smelt and longfin smelt populations remain very depressed and are typically found further downstream in the SF Bay-Delta system. However, documented presence in the lower river miles of both channels and areas of the Man-made Channel indicates the potential their continued presence during maintenance dredging operations.
� The absence of listed salmonid encounters is not surprising given their very low populations, and the timing and location of maintenance dredging during 2006-2009.
� The novel (for 2009) assessment of species present in the Delta but not encountered during monitoring provided additional confidence in the appropriateness of the monitoring methods.
5.4 Bird Activity Monitoring
As a monitoring requirement for this project, observation of bird activity in the dredge area and DMP site must be documented. Piscivorous bird activity in the dredge area is an indication of the presence of near surface fish or potentially fish being disturbed or injured by dredging activities. Fish or invertebrates entering the DMP site via dredge operations are thought to attract predaceous birds. Sea lion presence has also been documented, since their presence in large freshwater rivers can indicate presence of large fish not successfully sampled by the trawl, such as salmonids. This is particularly true if feeding behavior can be observed.
Bird activity in the DMP site may also be a result of fish or other invertebrates being entrained by the dredge. However, it may also be an attraction response to sources of flowing water, or, as was observed in 2008, predation of birds on newly displaced terrestrial prey previously occupying the DMP site, such as rodents or insects. In 2009 the largest congregations of piscivorous gulls, egrets, herons, and crows were again observed on newly tilled terrestrial areas over ½ mile from the pipeline’s discharge into the DMP site. A few egrets and an occasional heron were observed near the entrainment screen for sampling at Roberts 1 for the Upper Roberts, Rough and Ready, and Upper Turning Basin dredge reaches. Trawl sampling CPUE values for these same reaches were also relatively high.
Piscivorous bird activity increased in dredge reaches as the dredge season progressed. Few of these birds were observed until reaching the Upper Roberts Island dredge reach in late September. Piscivorous gulls, terns, cormorants, and an occasional heron, were more frequently observed and numerous in the Rough and Ready Island and Upper Turning Basin dredge reaches.
Sea lions were present during most of the monitoring at the Rough and Ready Island dredge reach. Up to three sea lions were observed hauled out under Berth B on Rough and Ready Island. While trawling in the upstream end of Rough and Ready Island a large head of a carp was recovered, apparently the result of sea lion predation.
5.5 Adaptive Management Strategies
NMFS requires that adaptive management strategies be employed and discussed as part of this monitoring program. This has been done since the project’s inception with focus on testing and

Mari-Gold Environmental Consulting Inc. Page 79
improving the project methodologies through constant evaluation while monitoring is underway, followed by careful analysis of the annual monitoring results that includes comparisons with other available data. Adaptive management in past years specifically focused on improvements to the entrainment monitoring methods and responding to presence of delta smelt and longfin smelt in the fish community samples.
5.5.1 Entrainment Monitoring Modifications to monitoring methods for the 2009 monitoring incorporated the following recommendations from the 2008 monitoring report (SWCA 2009):
� The mobile entrainment device was used successfully at all DMP sites, dispensing completely with the entrainment cell methodology and allowing a significant increase in sampled dredge output with no increase in sampling effort.
� Two of the cross bars on the screen were removed based on analysis of structural integrity impacts of removal that were deemed minimal versus vastly improved ease in material clearance off the screen.
5.5.2 Fish Community Monitoring The following modifications to fish community monitoring methods were incorporated in 2009:
� Upgrades were made to the sampling vessel’s computers and software, allowing improved navigation in the shipping channels and improved data acquisition and manipulation.
� A water quality meter capable of high precision turbidity measurements was utilized. While providing synoptic measurements of turbidity at both surface and bottom this meter streamlined the water quality sampling through elimination of Secchi depth measurements and use of an additional turbidity meter.
5.6 Recommendations
5.6.1 Entrainment Monitoring The following steps should be taken to improve the effectiveness of entrainment monitoring. Specific recommendations for entrainment sampling screen improvements have been provided previously and are provided here again for clarity and continuity. When implemented, these improvements should allow an assessment of an increased percentage of the dredge output without increasing sampling effort or cost. They will also provide significantly greater ease of use and allow much needed increases in nighttime sampling:
� The first section of screen was removed and replaced with steel plate early during 2008 sampling due to washout of the axles under the screen by slurry dropping down from this forward section of the device. This decreased the effective area of the screen by approximately 20 percent. Frequent entrainment screen over-loading in some locations during 2009 sampling demonstrated the need to return to the originally engineered screen capacity. This section of plate should be removed and replaced with the current screen type. Additional modifications to channel the dredge slurry away from the trailer axels will also be required.
Mari-Gold Environmental Consulting Inc. Page 80
� Install hinged steel plate lids on the forward sections of the screen to eliminate splash-over during periods of high discharge. These lids need to be hinged so that they can be opened during periods of low discharge and for cleaning the organic debris that accumulates on the screen- a daily maintenance chore.
� Install a new valve to replace the y-valve currently in use. While this valve does work, is sometimes problematic and does not allow rapid diversion of the slurry to the main DMP. This became a serious problem and limited sampling effort at times during 2009 due to frequent screen inundation at some locations. The new valve will be controllable by the biologists working on the device and will allow seamless switching of the slurry flow between the screen and the main DMP without requiring attention or activity by the dredge or DMP site (fill) crew.
� Install a second lifting arm for the tailgate/final screen section on the other side of the tailgate section to allow for both monitoring staff to lift this screen section safely and efficiently when under a load.
� Re-work the dump gate at the end of the screen allowing it to be raised and locked into its fully closed position again and devise and install a device allowing incremental locking positions for the dump-gate to be easily locked in more than one raised position.
� Improve the lighting system on the screen. 2009 nighttime sampling again demonstrated the inadequacy of the current lights. The light plant provided by RISG while very bright, cannot be placed directly over the top of the screen. The result is substantial areas of shadow in the corners of the screen. These shadowed areas do not allow confidence that all entrained fish are documented.
� Provide a high pressure water system that will allow use of a variety of hoses and sprayers for cleaning and clearing the accumulated material off of the screen. This system need to be adjustable due to the variety and volume of material.
� Conduct mortality studies on entrained fish such as holding them in a tank full of recirculating river water for 24 hours prior to release to provide greater accuracy to the estimation of mortality to entrained fish. This would provide information cogent to the evaluation of use of the entrainment screen as a conservation tool via salvage and return of entrained fish. This may prove important for conservation of lamprey as well as other entrained species.
� Develop specific sampling metrics and triggers for management change through coordination with USACE and NMFS prior to 2010 monitoring to determine the appropriate level of entrainment sampling effort required to meet agency needs.
5.6.2 Fish Community Monitoring The following recommendations are made in order to maximize sampling efficiency, gather better information about the sampling target area, minimize impacts to ESA-listed and sensitive species, and increase the potential for future statistically valid comparisons of fish community monitoring data:
� Frequent changes of water and aeration of holding bins will be used when sensitive and ESA-listed species are encountered.
� In future collections of lamprey, particularly of the genus Lampetra, specimens will be carefully preserved for morphological examination, with a portion of, or all, body tissue

Mari-Gold Environmental Consulting Inc. Page 81
collected for submittal to USFWS for mitochondrial DNA analysis to improve taxonomy and field identification characteristics.
� The individual specimen label system will continued to be used and further refined to meet project needs. The project database will continue to be modified for ease of real-time data collection, including specimen label identification information. These steps will increase the efficiency of future data acquisition and management.
� A dissecting microscope has been purchased and will be present on the research vessel to allow clear distinction between introduced wakasagi and listed delta smelt in the field. During 2009, presence of wakasagi and lack of confidence in the field differentiation between the two species resulted in some curtailment of fish community monitoring at S-31 in the Man-made Channel of the SRSC. The increased ability to differentiate these species in the field should allow us to better manage sampling effort. This microscope will also be used to differentiate lamprey species (Entosphenus vs. Lampetra) and other difficult to identify species.
5.7 Conclusions
Key conclusions of the 2009 monitoring program were:
� Fisheries monitoring requirements stipulated by the NMFS BOs (NMFS 2006a,b) for the SSC and SRSC were successfully met during the 2009 dredge season.
� The fish community in the Delta continues to be dominated by non-native fish and the fish community and entrainment monitoring data continues to exhibit significant inter-annual variation.
� Entrainment sampling efficiency and the quantitative capability of entrainment monitoring was increased substantially by use of the mobile entrainment screen.
� Take of listed and other species during future dredging events may be predicted by presence of these species in the fish community samples.
� Lamprey species are particularly susceptible to dredge entrainment and should be a focus of management agency attention due to their sensitive status. Though not currently listed, likelihood of future listing is high.

Mari-Gold Environmental Consulting Inc. Page 82
6 References Bell, M.C. 1991. Fisheries handbook of engineering requirements and biological criteria. U. S. Army
Corps of Engineers, North Pacific Division. Fish Passage Development and Evaluation Program. Portland, OR.
Bennett, B. 2005. Critical assessment of the delta smelt population. San Francisco Estuary and Watershed Science. 3(2): article 1 (September 2005).
Brown, L. R., and J. T. May. 2006. Variation in spring nearshore resident fish species composition and life histories in the lower Sacramento-San Joaquin watershed and delta (California). San Francisco Estuary and Watershed Science. 4(2): article 1 (September 2006). Available: http://repositories.cdlib.org/jmie/sfews/vol4/iss2/art1. (2007).
Buell, J. W. 1992. Fish entrainment monitoring of the Western-Pacific Dredge R W Lofgren during operations outside the preferred work period. Report of Buell and Associates to Western-Pacific Dredging Company.
California Department of Fish and Game (CDFG). 2008a. IEP endangered species take reporting. Resources Agency, Department of Fish and Game. Available: http://www.delta.dfg.ca.gov./data/esa/. (March 2008).
———. 2008b. California natural diversity database, special animals (865 taxa), February 2008. Available: http://www.dfg.ca.gov/biogeodata/cnddb/pdfs/SPAnimals.pdf. (February 2008).
———. 2008c. CDFG Biogeographic Data Branch and Habitat Conservation Branch webpages. Available: http://www.dfg.ca.gov/bdb/pdfs/TEAnimals.pdf and http://www.dfg.ca.gov/hcpb/species/ssc/sscfish/sscfish.shtml. (February 2008).
———. 2008d. Bay-Delta region fall midwater trawl indices. Available: http://www.delta.dfg.ca.gov/ data/mwt/charts.asp. (January 29, 2008).
———. 2009a. Bay-Delta region fall midwater trawl indices. Available: http://www.delta.dfg.ca.gov/ data/projects/?ProjectID=FMWT. (January 12, 2009).
______. 2009b. Bay-Delta region summer townet survey – delta smelt indices and fish distribution maps. Available: http://www.delta.dfg.ca.gov/data/projects/?ProjectID=TOWNET. (January 12 and February 9, 2009).
______. 2009c. Bay-Delta region San Francisco Bay study – Otter trawl survey and mid-water trawl survey delta smelt and longfin smelt indices and fish distribution maps. Available: http://www.delta.dfg.ca.gov/data/projects/?ProjectID=BAYSTUDY. (January 12 and February 12, 2009).
California Department of Water Resources (CDWR). 2009. California data exchange center. Available: http://cdec.water.ca.gov/. (April 23, 2009).
Dean, S., and B. Illowsky. Hypothesis testing of single mean and single proportion: assumptions. Available at: http://cnx.org/content/m17002/1.7/. (February 7, 2009).

Mari-Gold Environmental Consulting Inc. Page 83
Feyrer, F., and M. P. Healey. 2002. Structure, sampling gear and environmental associations, and historical changes in the fish assemblage of the southern Sacramento-San Joaquin delta. California Fish and Game 88(3):126–138.
———. 2003. Fish community structure and environmental correlates in the highly altered southern Sacramento-San Joaquin delta. Environmental Biology of Fishes 66:123–132.
Goodman, D. H., Kinziger, A. P., Reid, S. B., and Docker, M. F. 2009. Morphological diagnosis of Entosphenus and Lampetra ammocoetes (Petromyzontidae) in Washington, Oregon, and California. American Fisheries Society Symposium. 72: 223-232, 2009.
Howard, J. 2010. USFS California Western States Freshwater Mussel Study (In Press, Citation Pending)
Interagency Ecological Program (IEP). 2008. Pelagic organism decline progress report: 2007 synthesis of results. California Environmental Protection Agency, State Water Resources Control Board. Available: http://www.waterrights.ca.gov/baydelta/pelagicorganism.html. (January 15, 2008).
McGinnis, S. M. 1984. Freshwater fishes of California. University of California Press.
Moore, D. S. 1995. The basic practice of statistics. W.H. Freeman. New York.
Moore, D. S. and G. P. McCabe. 1993. Introduction to the practice of statistics. W.H. Freeman. New York.
Moyle, P. B. 2002. Inland fishes of California, revised and expanded. University of California Press. Berkeley.
Moyle, P. B., Brown, L. R., Chase, S. D., and Quinones, R. M. 2009. Status and conservation of lampreys in California. American Fisheries Society Symposium 72:279 -292, 2009.
Nobriga, M. L., F. Feyrer, R. D. Baxter, and M. Chotkowski. 2005. Fish community ecology in an altered river delta: spatial patterns in species composition, life history strategies, and biomass. Estuaries 28(5):776–785.
NMFS (National Marine Fisheries Service). 2006a. Biological and conference opinion for the Stockton deep water ship channel maintenance dredging and levee stabilization project. SWR-2004-SA-9121:JSS, April 4, 2006. Prepared for the U.S. Army Corps of Engineers, Sacramento District.
———. 2006b. Biological opinion for the Sacramento deep water ship channel (SDWSC) maintenance dredging and bank protection project. SWR-2006/00041, August 29, 2006. Prepared for the U.S. Army Corps of Engineers, Sacramento District.
Pacific Fishery Management Council (PFMC). 1998. Final environmental assessment/regulatory impact review for Amendment 11 to the Pacific Coast Groundfish Fishery Management Plan. October 1998.
SWCA Environmental Consultants (SWCA). 2007. 2007–2008 fisheries monitoring plan for the Stockton and Sacramento deepwater ship channel ID/IQ maintenance dredging operations

Mari-Gold Environmental Consulting Inc. Page 84
and IEP program element 2007-113. Report to U.S. Army Corps of Engineers, Sacramento District. Submitted to IEP/CDFG and USACE July 31, 2007. SWCA, Portland.
———. 2008. Stockton and Sacramento deepwater ship channel maintenance dredging project 2007 fish community and entrainment monitoring report. Report to U.S. Army Corps of Engineers, Sacramento District. Submitted March 2008. SWCA, Portland.
———. 2009. Stockton and Sacramento deepwater ship channel maintenance dredging project 2008 fish community and entrainment monitoring report. Report to U.S. Army Corps of Engineers, Sacramento District. Submitted March 2008. SWCA, Portland.
Turner, J. L., and D. W. Kelly. 1966. Ecological studies of the Sacramento-San Joaquin Delta - Part 2, Fishes of the Delta. California Department of Fish and Game.
U.S. Fish and Wildlife Service (USFWS). 2004. 90-day finding on a petition to list three species of lampreys as threatened or endangered, Notice of Petition Finding. Federal Register 69:270 (December 27, 2004):77158–77167.
Wang, J.C.S. 2007. Spawning, early life stages, and early life histories of the Osmerids found in the Sacramento-San Joaquin Delta of California. Tracy Fish Collection Facility Studies. Volume 38. U.S. Bureau of Reclamation, Mid-Pacific Region and Denver Technical Service.
Wydoski, R. S., and R. R. Whitney. 2003. Inland fishes of Washington, 2nd edition. American Fisheries Society. Bethesda, Maryland.

Mari-gold Environmental Consulting Inc. Appendix A-1
Appendix A. Special Status SpeciesLife History Information

Mari-gold Environmental Consulting Inc. Appendix A-2
Appendix A. Special Status Species Life History InformationDesignated Critical Habitat The designated critical habitat of Sacramento River winter-run Chinook salmon occurs at the origin of the SRSC adjacent to Kimball, Browns, and Winter Islands near RM 4 of the San Joaquin River and is inclusive of the aquatic habitat below the ordinary high water mark surrounding these islands. The winter-run Chinook ESU has designated critical habitat in the SRSC beginning at Chipps Island, the western margin of the Sacramento-San Joaquin Delta. Designated critical habitat for Central Valley spring-run Chinook salmon borders the northern edge of the San Joaquin River from the confluence of the Mokelumne River west to the boundaries of Suisun Bay and the Delta hydrologic sub units at approximately RM 4 of the San Joaquin River. This includes the waters of Three Mile Slough and New York Slough. Critical habitat for CV Chinook salmon includes the Sacramento River from Keswick Dam in Shasta County through the San Francisco Bay. Individuals of both Chinook salmon Evolutionarily Significant Units (ESUs) can occupy waters within the SSC and SRSC action area. Designated critical habitat for the Central Valley steelhead ESU occurs along the entire length of the SSC and SRSC below the ordinary high water mark. The recently listed Southern Distinct Population Segment (DPS) of green sturgeon’s critical habitat Final Rule was published in the Federal Register (74 FR 52300) on October 9, 2009 and includes the entire Sacramento and San Joaquin Delta.
Recent state and federal petitions have requested that delta smelt be up-listed from threatened to endangered under CESA and ESA. California up-listed delta smelt to endangered status on March 4, 2009 (Final Statement issued on November 10, 2009). USFWS had not yet commented on the petition to up-list delta smelt from threatened to endangered status at the time of this writing, though they did announce the initiation of a five-year status review on March 24, 2009.
The California Fish and Game Commission enacted protections for longfin smelt in 2008, which was a CESA candidate species at that time. Incidental take of longfin smelt while conducting fish community monitoring was restricted to 150 juveniles and 150 adults for the entire year. Longfin smelt were accepted as threatened under CESA by the Commission on March 4, 2009. Federal protection of the longfin smelt was recently denied by the USFWS following review of the petition to list the longfin smelt under the ESA (April 9, 2009). The USFWS found that the San Francisco Bay-Delta longfin smelt did not qualify as a distinct population segment (DPS). The USFWS has initiated (April9, 2009) a status review for the entire longfin smelt population from Alaska to California. Other key species of interest that are at least seasonally present in the action area include: Sacramento splittail, and Pacific and river lamprey.
Sacramento River winter-run Chinook salmon (Oncorhynchus tshawytscha)ESA status: Endangered, critical habitat designated California status: Endangered Sources: CalFed 2005; Fry 1961, 1973; Hallock and Fry 1967; Hallock et al. 1970; Miller and Lea 1972; Moyle 1976; Sasaki 1966; Wang 1986
Use of project area waters by this ESU of Chinook salmon is primarily for adult spawning migrations, and juvenile rearing and outmigrations. Winter-run Chinook adults migrate upstream from December to July with spawning in accessible upper reaches of the Sacramento River basin occurring from April through July. Chinook alevins have been collected from Suisun Bay in January and February. Larger parrjuveniles have been found from April to June. Juvenile life stages are commonly found inshore, in

Mari-gold Environmental Consulting Inc. Appendix A-3
shallow water and throughout estuarine habitat. Some Chinook salmon delay their downstream migration until the early smolt stage. Juvenile outmigration peaks from May to June. Juvenile Chinook salmon feed primarily on various aquatic and terrestrial insects, crustaceans, chironomid larvae and pupae, and caddisflies when they are in fresh water. When found in saline waters, the Chinook smolt diet changes to mainly Neomysis spp., Gammarus spp., and Crangon spp. Juvenile salmon are prey for many animals, including birds and other fishes.
Central Valley spring-run Chinook salmon (O. tshawytscha)ESA status: Threatened, critical habitat designated California status: Threatened Sources: CalFed 2005; Fry 1961, 1973; Hallock and Fry 1967; Hallock et al. 1970; Miller and Lea 1972; Moyle 1976; Sasaki 1966; Skinner 1972; Wang 1986
Uses of the project areas by spring-run Chinook salmon are of the same types as described for the winter-run ESU. Spawning migration timing differs with spring-run Chinook moving upstream from April to October, and spawning from August through October. Juvenile usage in the areas of concern is similar to that described for winter-run Chinook.
Central Valley steelhead (O. mykiss)ESA Status: Threatened, critical habitat designated. Sources: CalFed 2005; Hallock et al. 1970; Hallock and Fry 1967; Moyle 1976; Wang 1986
After an ocean residence of 2–3 years, anadromous adults of the Central Valley steelhead ESU make their upstream migrations beginning in July (peaking in September and October), and spawn from December through April. Steelhead primarily use the project areas as a migration corridor, with some juvenile rearing overlapping with their smoltification and outmigrations. Spawning and incubation, along with the majority of rearing, occurs farther upstream than for Chinook salmon. Juveniles feed on diverse aquatic and terrestrial insects and other small invertebrates, primarily occupying the water column and near surface when over deeper waters. Though juvenile Central Valley steelhead outmigrate to the ocean from December through August, most are found migrating through the project areas in spring.
Delta smelt (Hypomesus transpacificus)ESA status: Threatened, critical habitat designated California status: Endangered Sources: Bennett 2005; CDFG 2009, CalFed 2005; Ganssle 1966; Herald 1961; McAllister 1963; Messersmith 1966; Moyle 1976, 2002; Moyle et al.1995; Radtke 1966; Wang 1986
The endemic delta smelt is a euryhaline fish that ranges from the lower reaches of the Sacramento and San Joaquin Rivers, through the Delta, and into Suisun Bay. They have been found in the SRSC and SSC in low abundance. The abundance of this fish is closely associated with salinities between 0 and 7 practical salinity units (psu), with an upper tolerance of 19 psu and a significant preference centered near or upstream of the 2 psu zone. They are not present in waters over 25°C, and are rarely found in water temperatures above 22°C. Delta smelt spawn in dead-end sloughs, near-inshore areas of the Delta, and shallow fresh water channels of the Delta and Suisun Bay. In the fall, prior to spawning, delta smelt congregate in upper Suisun Bay and the lower reaches of the Delta. The spawning period is estimated to be from February to June. Eggs are demersal and adhesive. Delta smelt may prefer spawning over vegetation, if present, but often deposit their eggs over submerged tree branches and stems, or in open water over sandy and rocky substrate, and may even use the

Mari-gold Environmental Consulting Inc. Appendix A-4
shallower areas of Delta levees. Newly hatched larvae float near the surface of the water column in both inshore and channel areas. Larval movements are variable and follow tides and discharge. Data from trawl and trap net catches show that larger juveniles and adults are abundant during spring and summer in Suisun Bay and the Delta. Seasonal migrations occur within a short section of the upper estuary. Juvenile smelt move downstream to San Pablo Bay and Carquinez Strait before turning back to Suisun Bay or upstream sloughs for spawning. During average and high outflow years, delta smelt congregate from upper Suisun Bay to the Sacramento River near Decker Island. During low outflow and drought years their pre-spawning congregations are centered in the channel of the Sacramento River and are rarely further downstream in Suisun Bay. Juvenile delta smelt primarily eat planktonic crustaceans, small insect larvae, and mysid shrimp. Delta smelt mature quickly, with most adults dying after spawning their first year. The few adults that survive to their second year have vastly higher fecundity. Delta smelt was listed as threatened under the ESA on March 5, 1993 (FR 58, 12854). Final critical habitat designation for delta smelt (Federal Register 59, 65256; December 19, 1994) includes the Stockton and Sacramento DWSCs. On March 24, 2009, the USFWS initiated a five-year status review of delta smelt. The state status of delta smelt under CESA was recently elevated from threatened to endangered (March 4, 2009).
Green sturgeon (Acipenser medirostrus)ESA status: Threatened (July 6, 2006), Southern DPS, Critical Habitat designated on October 9, 2009 California Status: none Sources: Adams et al. 2002; CDFG 2009; CalFed 2005; Fry 1973; Gisbert (2006); Klimley 2007; NOAA 2009; Radtke 1966; Van Eenenaam (2005); Wang 1986.
The little studied green sturgeon occurs within the project area the Sacramento and San Joaquin Rivers and the Delta. The Southern DPS consists of fish in the San Francisco Bay and Delta that spawn in the Sacramento River basin. A number of presumed spawning populations of green sturgeon have been lost since the 1960s and 1970s — from the Eel River, South Fork Trinity River, and San Joaquin River. Green sturgeon inhabit near shore oceanic waters, bays, and estuaries. Early life-history stages(<4 years old) reside in fresh water, with adults returning to freshwater to spawn when they are more than 15 years of age and more than 130 cm in size. Spawning occurs in spring and summer in reported locations of the upper Sacramento River and tributaries to the Sacramento River such as the Feather, Yuba, and American Rivers. Recent studies have improved the knowledge of the biology and ecology of this fish, though substantial gaps still exist regarding its habits in the project area and elsewhere in its range. Juveniles of two apparent size groups (fork length range of 20–58 cm) have been collected in the Sacramento and San Joaquin Rivers and Suisun Bay. The diet of juvenile sturgeon consists mostly of amphipods and mysid shrimps in the Delta. Additional information on green sturgeon is available at NMFS web site (http://www.nmfs.noaa.gov/pr/species/fish/greensturgeon.htm).
Estuarine Composite Species with Essential Fish Habitat The following fishes, though not listed under ESA, are included here as they are part of the estuarine composite species with essential fish habitat (EFH) protections under the Magnuson- Stevens Fishery Conservation and Management Act (MSA); and are the most likely of their composite to utilize the portions of the Delta within the project area. These species were included in the EFH assessment for the Stockton SSC Maintenance Dredging and Levee Stabilization Project (NMFS 2006a).
Starry flounder (Platyichthys stellatus)ESA status: None, MSA species, estuarine composite EFH

Mari-gold Environmental Consulting Inc. Appendix A-5
Sources: CalFed 2005; Fry 1973; PFMC 1998; McCain et al. 2005; NMFS 2006; Radtke 1966; Wang 1986; Wydoski and Whitney 2005
The starry flounder is a marine flatfish with both eyes on the same side of its head. Starry flounder are white on the ventral side and have conspicuous ventral black and orange bands on their dorsal and anal fins. They have a tolerance for a variety of salinities and are found along the coast and in estuaries and the lower portions of rivers. Juveniles and adults are demersal and prefer sandy to muddy substrates. Starry flounder have been recorded at a depth of 900 feet. Studies have shown starry flounder can move a considerable distance between estuarine and ocean habitats (440 nautical miles). Juveniles and sub-adult life stages extend the upstream freshwater use to the Bay and lower reaches of the Delta. Adults may reach a length of 3 feet and a weight of 20 pounds. Females grow faster than males and are heavier at a given length. Males mature at 2 years and females at 3 years. They spawn in winter with water temperatures averaging 11°C (51.8°F). Eggs and larvae are epipelagic and occur near the surface over water that ranges from 20 to 70 m (65 to 30 feet) deep. They feed on copepods, amphipods and annelid worms and, as adults, include crabs, mollusks, and echinoderms. Feeding slows in winter as temperatures drop. Starry flounder provide both recreational and commercial fisheries. One juvenile flounder was collected near the Port of Stockton in 2009 and this may represent an extension of its known range in the Delta.
English sole (Pleuronectes vetulus)ESA status: None MSA species, estuarine composite EFH Sources: McCain et al. 2005; NMFS 2006; PFMC 1998; Wang 1986; Wydoski and Whitney 2005
English sole are an inner shelf-mesobenthal flatfish species that ranges from Mexico to Alaska and is abundant in the San Francisco Bay-Estuary system. Adults generally spawn during late fall to early spring in inshore waters over soft mud bottoms to 70 m (230 feet). Epipelagic larvae are carried by wind and near-surface tidal currents into bays and estuaries where they metamorphose to demersal juveniles. Juveniles rear in the inshore areas and in the bays and estuaries moving offshore as they age. Juvenile English sole seek food and shelter in shallow near-shore, inter-tidal, and estuarine waters. Prey items include small crustaceans (e.g., copepods and amphipods) and polychaete worms. English sole provide commercial and recreational fisheries. Bottom-oriented juveniles may occur in the lower portion of the SSC and SRSC. However, none have been encountered during monitoring of dredge operations.
Species of Special ConcernThe following fishes, though not listed under ESA, nor protected under the MSA, have been listed or petitioned for listing in the recent past, and are presently considered species of special concern by the State of California. Information on these species is being sought by NMFS and USFWS. This background information is provided here because these species were encountered during fish community and or entrainment monitoring.
Lamprey, Pacific and river (Lampetra (Entosphenus) tridentata and L. ayresii, respectively)ESA status: Not warranted (decision 2005) California Status: Watch list – river lamprey Sources: Kostow 2002; Moyle 2002; Wydoski and Whitney 2005
Anadromous Pacific and river lamprey co-occur in SSC and SRSC. Little is known about population trends for the river lamprey at the southern end of its distribution. Most records of this species in
Mari-gold Environmental Consulting Inc. Appendix A-6
California are from the Feather River and the lower Sacramento-San Joaquin River system. Adult lamprey of both species migrate upstream in early spring and spawn during late spring and early summer in gravel substrates upstream of the Delta and lower Sacramento-San Joaquin river system. Adult Pacific lamprey generally hibernate for a year in freshwater after their initial spawning migration. During this time they hide in substrates near their spawning area and do not feed prior to spawning the following year. The filter-feeding ammocoetes develop for years burrowed into soft substrates in freshwater. River lamprey begin their transformation from ammocoete to adult form at about 120 mm total length, Pacific lamprey at approximately 140 to 160 mm. Metamorphosis lasts from 9 to 10 months in river lamprey, the longest known in this family of fishes. During this time, both lamprey species congregate close to the saltwater-freshwater interface in estuaries. Macropthalmia have large, well-developed eyes, and their body coloration is silvery on the lateral and ventral aspects with blue to dark gray coloration along the dorsal aspect. During this stage, mouth dentition forms adult teeth used to prey or parasitize other fishes. It is noted in Pacific lamprey that full development of the middle tooth of the supraoral lamina develops during the transforming adult stage, complicating field identification at the macropthalmic stage. Following complete transformation, macropthalmia migrate downstream to the ocean, likely in the winter and spring, when outflow is high. River lamprey may spend their entire life history in freshwater and are more parasitic in freshwater than Pacific lamprey. Adult river lamprey spend less time in the ocean, migrating back to freshwater in the fall and winter. Adult Pacific lamprey generally migrate from stream to spawning areas in winter and spring.
Sacramento splittail (Pogonichthys macrolepidotus)ESA status: species of concern (2003), formerly listed as threatened (1999) Sources: Moyle 2002; USFWS 2003; Wang 1986
The Sacramento splittail is found only in California’s Sacramento-San Joaquin Delta, streams of the Central Valley, and the Napa and Petaluma rivers. This native minnow (family Cyprinidae) received protection as a threatened species in February 1999 (64 FR 5963). The USFWS delisted the splittail on September 22, 2003 (68 FR 55140). The relatively long-lived splittail (up to 9 years) can grow up to 400 mm long. The upper part of the tail is enlarged and appears to be split, hence its common name. Historically, the splittail occurred in the Sacramento River as far north as Redding, as far south in the San Joaquin River as Friant Dam near Fresno, and as far west as the Petaluma River. They are adapted to living in estuarine systems and are tolerant of salinities from 10 to 18 ppt. Young-of-year and yearling splittail are most abundant in shallow water and are able to swim in strong current. Adults exhibit slow upstream movement during winter and spring to forage and spawn in flooded areas. Their small, subterminal mouth with barbels and pharyngeal teeth, along with the large upper tail lobe, reflect their preference for feeding on bottom invertebrates in low to moderate current strength. Splittail reach adulthood at approximately 170 mm in their second year. Splittail populations have declined as dams and diversions have prevented fish from access to upstream areas of large rivers. Reclamation and modification of flood basins also have reduced the species’ spawning grounds.
Longfin smelt (Spirinchus thaleichthys)ESA status: none, Bay-Delta DPS denied petitioned for listing California status: State Threatened Sources: CDFG 2009, 2007, 2000; Moyle 2002; Moyle et al. 1995
Longfin smelt are a euryhaline and anadromous fish that was historically one of the most abundant fish in the San Francisco estuary and the Delta, but have since declined precipitously throughout its range. Longfin smelt can be distinguished from other California smelts by their long pectoral fins,

Mari-gold Environmental Consulting Inc. Appendix A-7
which reach or nearly reach the base of their pelvic fins. These fish reach a maximum size of about 150 mm (total length) and mature near the end of their second year. As they mature in the fall, adults found throughout San Francisco Bay migrate to brackish or freshwater in Suisun Bay, Montezuma Slough, and the lower reaches of the Sacramento and San Joaquin Rivers. They congregate for spawning at the upper end of Suisun Bay and in the lower and middle Delta, especially in the Sacramento River channel and adjacent sloughs. In April and May, juveniles are believed to migrate downstream to San Pablo Bay; juvenile longfin smelt are collected throughout the Bay during the late spring, summer, and fall and occasionally venture offshore as far as the Gulf of the Farallones. Juveniles tend to inhabit the middle and lower portions of the water column. Their decline is likely due to multiple factors including: reduction in outflows, entrainment losses to water diversions, climactic variation, toxic substances, predation and introduced species.
References
Adams, P. B., C. B. Grimes, J. E. Hightower, S. T. Lindley, and M. L. Moser. 2002. Status review for North American green sturgeon, Acipenser medirostris. National Marine Fisheries Service, Southwest Fisheries Science Center, Santa Cruz, California.
Bennett, W. A. 2002. Critical assessment of the delta smelt population in the San Francisco estuary, California. California Bay Delta Authority and John Muir Institute for the Environment, University of California, Davis.
CalFed (US Bureau of Reclamation and California Department of Water Resources). 2005. South delta improvements program draft environmental impact statement/environmental impact report. October 2005.
California Department of Fish and Game (CDFG). 2000. Fish species of special concern in California, Bay-Delta monitoring, San Francisco Bay monitoring, fish, longfin smelt. California Department of Fish and Game, Central Valley Bay-Delta Branch, 2000.
CDFG. 2007. Longfin smelt in San Francisco Bay. California Department of Fish and Game, Bay Delta Region. Available: http://www.delta.dfg.ca.gov/baydelta/monitoring/lf.asp. (August 10, 2007).
CDFG. 2009. State and Federally Listed Endangered and Threatened Animals of California. Department of Fish and Game. Available: http://www.dfg.ca.gov/biogeodata/cnddb/pdfs/TEAnimals.pdf. (January 2010).
Federal Register. 2008. 50 CFR Part 226. Vol. 73, No. 174 / Monday September 8, 2008.
Fry, D. H., Jr. 1961. King salmon spawning stocks of the California Central Valley, 1940-1959. California Fish and Game 47(1):55–71.
———. 1973. Anadromous fishes of California. California Department of Fish and Game, Sacramento.

Mari-gold Environmental Consulting Inc. Appendix A-8
Ganssle, D. 1966. Fishes and decapods of San Pablo and Suisun bays. Pages 64–94 in D. W. Kelley, compiler. Ecological studies of the Sacramento-San Joaquin estuary, part 1. California Department of Fish and Game, Fish Bulletin 133, Sacramento.
Gisbert, E. and S. Doroshov. 2006. Allometric Growth in Green Sturgeon larvae. Journal of Applied Ichthology. 22 (Suppl.1) (2006), 202-207.
Hallock, R. J. and D. H. Fry, Jr. 1967. Five species of salmon Oncorhynchus, in the Sacramento River, California. California Fish and Game 53(1): 5–22.
Hallock, R. J., R. F. Elwell, and D. H. Fry, Jr. 1970. Migrations of adult king salmon Oncorhynchustshawytscha in the San Joaquin Delta. California Department of Fish and Game, Fish Bulletin 151, Sacramento.
Herald, E. S. 1961. Living fishes of the world. Doubleday, New York. Kostow, K. 2002. Oregon lampreys: natural history status and problem analysis. Oregon Department of Fish and Wildlife, Portland.
Klimley. A. P., P. J. Allen, J. A. Israel, and J. T. Kelly. 2007. The green sturgeon and its environment: past, present, and future. Environmental Biology of Fishes (2007) Volume 79, Numbers 3-4 / August, 2007.
McCain, B. B., Miller, S .D., and W. W. Wakefield II. 2005 life history, geographical distribution, and habitat associations of 82 West Coast groundfish species: a literature review, draft January 2005 in Appendix H of Essential Fish Habitat Designation and Minimization of Adverse Impacts Draft Environmental Impact Statement, Vol. 4, February 2005. National Marine Fisheries Service, Northwest Fisheries Science Center, Seattle.
McAllister, D. E. 1963. A revision of the smelt family, Osmeridae. National Museum of Canada, Bulletin 191, Ottawa.
Messersmith, J. D. 1966. Fishes collected in Carquinez Strait in 1961–1962. Pages 57–63 in D. W. Kelley, compiler. Ecological studies of the Sacramento-San Joaquin estuary, part I. California Department of Fish and Game, Fish Bulletin 133, Sacramento.
Miller, D. J., and R. N. Lea. 1972 (1976). Guide to the coastal marine fishes of California. California Department of Fish and Game, Fish Bulletin 157, Sacramento.
Moyle, P. B. 1976. Inland fishes of California. University of California Press, Berkeley.
———. 2002. Inland fishes of California (revised and expanded). University of California Press, Berkeley.s
Moyle, P.B., R. M. Yoshiyama, J. E. Williams, and E. D. Wikramanayake. 1995. Fish species of special concern in California. Final Report for Contract No. 21281F to State of California, Resources Agency, Department of Fish and Game, Inland Fisheries Division, Rancho Cordova, June 1995.

Mari-gold Environmental Consulting Inc. Appendix A-9
National Marine Fisheries Service (NMFS). 2006. Biological and conference opinion for the Stockton deep water ship channel maintenance dredging and levee stabilization project. SWR-2004-SA-9121:JSS, April 4, 2006. Prepared for the U.S. Army Corps of Engineers, Sacramento District.
NOAA 2009. 50 CFR Part 226. [Docket No. 080730953–91263–02] RIN 0648–AX04. Endangered and Threatened Wildlife and Plants: Final Rulemaking To Designate Critical Habitat for the Threatened Southern Distinct Population Segment of North American Green Sturgeon. Federal Register / Vol. 74, No. 195 / Friday, October 9, 2009.
Pacific Fisheries Management Council (PFMC). 1998. Essential fish habitat – West Coast groundfish. Modified from: Final Environmental Assessment/Regulatory Impact Review for Amendment 11 to the Pacific Coast Groundfish Fishery Management Plan, October 1998. Portland, Oregon. Available: http:/www.pcouncil.org.
Radtke, L. D. 1966. Distribution of smelt, juvenile sturgeon, and starry flounder in the Sacramento- San Joaquin Delta with observations on food of sturgeon. Pages 115–129 in J. L. Turner and D. W. Kelley, compilers. Ecological studies of the Sacramento-San Joaquin delta, part II. California Department of Fish and Game, Fish Bulletin 136, Sacramento.
Sasaki, S. 1966. Distribution and food habits of king salmon, Oncorhynchus tshawytscha, and steelhead rainbow trout, Salmo gairdnerii, in the Sacramento-San Joaquin Delta. Pages 108–114 in J. L. Turner and D. W. Kelley, compilers. Ecological studies of the Sacramento-San Joaquin delta, part II. California Department of Fish and Game, Fish Bulletin 136, Sacramento.
Skinner, J. E. 1972. Ecological studies of the Sacramento-San Joaquin Estuary. California Department of Fish and Game, Delta Fish Wildlife Protection Study Report 8, Sacramento. United States Fish and Wildlife Service (USFWS). 2001. Annual progress report: abundance and survival of juvenile Chinook salmon in the Sacramento-San Joaquin estuary. Stockton, California.
Van Eenenaam, J. P., J. Linares-Casenave, X. Deng, and SI. Doroshov. 2005. Effect of incubation temperature on green sturgeon embryos, Acipenser medirostris. Environmental Biology of Fishes. Volume 72, Number 2 / February, 2005
Wang, J. C. S.1986. Fishes of the Sacramento-San Joaquin estuary and adjacent waters, California: a guide to the early life histories. Interagency Ecological Study Program for the Sacramento-San Joaquin Estuary, Technical Report 9 (FS/B10-4ATR 86-9), Sacramento.
Wydoski R., and R. Whitney. 2003. Inland fishes of Washington. University of Washington Press, Seattle.

Appendix B. Water Quality Data
Mari-gold Environmental Consulting Inc. Appendix B-1
Survey_ID Dredge Reach Date Time Depth Temp DO DO pH ORP Cond Sal Turb(m/d/year) (hh:mm) (ft) (*C) (ppm) (%) (mV) (uS) (ppt) (ntu)
WQ0901 Man-made Channel 8/16/2009 15:45 2 24.63 8.58 106 8.17 77 776 0.2 44.4WQ0902 Man-made Channel 8/16/2009 19:54 2 24.68 9.40 114 8.26 66 816 0.2WQ0903 Man-made Channel 8/18/2009 14:58 3 24.15 8.08 99 7.99 108 740 0.2 61.8WQ0904 Man-made Channel 8/24/2009 18:12 2 22.75 8.85 115 8.16 177 577 0.3 122.0WQ0905 Man-made Channel 8/26/2009 11:07 2 22.40 8.22 98 8.24 152 595 0.3 114.0WQ0906 Scour/Antioch 8/28/2009 15:35 2 23.51 9.21 116 8.12 168 2110 1.1 11.8WQ0907 Scour/Antioch 8/28/2009 17:55 2 23.43 9.78 120 8.13 162 1880 1.0 11.9WQ0908 Light 21 8/31/2009 19:07 2 22.84 7.38 88 8.11 157 1540 0.8 9.9WQ0909 Light 21 8/31/2009 21:37 2 22.83 8.25 162 1170 0.6 8.3WQ0910a Light 21 9/2/2009 19:27 2 23.07 7.95 156 1430 0.7 12.6WQ0910b Light 21 9/2/2009 17:08 2 23.16 8.56 104 7.81 163 1400 0.7 10.1WQ0911 Light 21 9/4/2009 12:45 2 22.83 8.33 101 7.92 198 104 0.5 9.7WQ0912 Light 21 9/4/2009 15:04 2 22.90 8.65 106 8.03 200 126 0.6 11.0WQ0913 Spud Island 9/12/2009 19:17 2 24.05 7.06 90 7.65 189 260 0.1 4.8WQ0914 Spud Island 9/12/2009 21:22 2 23.49 7.58 192 260 0.1 5.9WQ0915 Spud Island 9/13/2009 14:36 2 23.79 7.38 91 7.37 207 262 0.1 7.6WQ0916 Spud Island 9/13/2009 17:15 2 23.67 7.72 97 7.69 209 262 0.1 7.5WQ0917 Lower Roberts Island 9/15/2009 12:56 2 24.51 10.34 122 7.29 187 390 0.2 8.4WQ0918 Lower Roberts Island 9/15/2009 15:49 2 24.24 6.91 89 7.18 212 281 0.1 9.4WQ0919 Lower Roberts Island 9/19/2009 13:40 2 25.35 6.46 84 7.42 210 521 0.2 14.3WQ0920 Windmill Cove 9/21/2009 10:52 2 25.06 7.27 195 531 0.3 13.7WQ0921 Windmill Cove 9/21/2009 17:17 2 25.69 6.87 89 7.21 210 465 0.2 13.6WQ0922 Upper Roberts Island 9/23/2009 8:59 2 24.82 6.20 101 7.17 167 497 0.2 12.8WQ0923 Upper Roberts Island 9/23/2009 12:10 2 26.15 7.41 99 7.54 247 531 0.3 13.9WQ0924 Upper Roberts Island 9/26/2009 19:41 2 26.08 10.81 135 7.04 225 533 0.3 17.5WQ0925 Upper Roberts Island 9/30/2009 8:31 2 23.63 9.56 117 6.74 191 519 0.2 16.1WQ0926 Upper Roberts Island 10/2/2009 12:39 2 22.95 10.18 112 7.70 148 501 0.2 16.3WQ0927 Upper Roberts Island 10/2/2009 15:33 2 23.47 9.04 107 7.50 153 517 0.2 17.5WQ0928 Upper Roberts Island 10/4/2009 16:10 2 21.66 9.55 111 7.85 146 502 0.2 20.0WQ0929 Rough & Ready Island 10/6/2009 11:03 2 19.70 7.98 131 492 0.2 21.4WQ0930 Rough & Ready Island 10/6/2009 14:02 2 20.83 7.91 183 485 0.2 19.0WQ0931 Rough & Ready Island 10/8/2009 13:08 2 19.65 8.81 100 7.43 171 468 0.2 16.7WQ0932 Rough & Ready Island 10/8/2009 16:06 2 20.32 10.81 124 7.61 166 474 0.2 16.1WQ0933 Rough & Ready Island 10/10/2009 11:25 2 19.12 8.49 97 7.62 171 477 0.2 28.5WQ0934 Rough & Ready Island 10/10/2009 15:47 2 20.05 9.16 105 7.73 170 468 0.2 17.0WQ0935 Rough & Ready Island 10/12/2009 15:24 2 19.36 9.10 105 7.91 115 474 0.2 15.8WQ0936 Rough & Ready Island 10/12/2009 17:42 2 19.36 9.90 111 7.98 171 479 0.2 14.8WQ0937 Upper Turning Basin 10/14/2009 14:35 2 19.23 8.58 96 7.93 136 471 0.2 6.4WQ0938 Upper Turning Basin 10/16/2009 12:03 2 19.08 7.38 84 7.19 146 459 0.2 9.0WQ0939 Upper Turning Basin 10/16/2009 14:12 2 19.54 7.44 87 7.52 134 466 0.2 14.6
Surface Water Quality Readings

Survey ID Dredge Reach WQ_Date Time Depth Temp DO DO pH ORP Cond Sal Turb(hh:mm) (ft) (*C) (ppm) (%) (mV) (uS) (ppt) (ntu)
WQ0901 Man-made Channel 8/16/2009WQ0902 Man-made Channel 8/16/2009WQ0903 Man-made Channel 8/18/2009WQ0904 Man-made Channel 8/24/2009 18:09 31 22.71 9.53 115 8.21 171 580 0.3 119WQ0905 Man-made Channel 8/26/2009 11:11 30 22.22 8.52 102 8.16 163 600 0.3 112WQ0906 Antioch 8/28/2009 15:39 37 22.04 9.39 112 7.94 172 2360 1.2 16.6WQ0907 Antioch 8/28/2009 17:58 33 22.08 8.38 100 7.97 163 2240 1.1 15.2WQ0908 Light 21 8/31/2009 19:12 37 22.85 6.13 77 8.11 154 1560 0.8 11.9WQ0909 Light 21 8/31/2009 21:43 45 22.86 8.08 174 1190 0.6 10.5WQ0910a Light 21 9/2/2009 19:31 45 23.11 7.94 161 1480 0.7 11.2WQ0910b Light 21 9/2/2009 17:13 38 23.10 7.36 92 7.87 172 1840 0.9 13.1WQ0911 Light 21 9/4/2009 12:49 45 22.82 9.19 110 7.93 190 100 0.5 9.8WQ0912 Light 21 9/4/2009 15:07 36 22.90 8.25 100 7.93 199 123 0.6 10.5WQ0913 Spud Island 9/12/2009 19:20 33 23.83 8.27 103 7.58 192 258 0.1 13.9WQ0914 Spud Island 9/12/2009 19:24 38 23.58 7.12 90 7.48 202 263 0.1 4.4WQ0915 Spud Island 9/13/2009 14:48 36 23.44 7.09 87 7.42 217 260 0.1 7.3WQ0916 Spud Island 9/13/2009 17:13 34 23.47 7.23 89 7.30 33 261 0.1 6.4WQ0917 Lower Roberts Island 9/15/2009 13:01 38 23.67 6.11 77 7.56 190 336 0.2 13.8WQ0918 Lower Roberts Island 9/15/2009 15:53 36 23.51 6.90 85 7.58 187 281 0.1 10.5WQ0919 Lower Roberts Island 9/19/2009 13:44 30 24.90 6.98 89 7.50 237 520 0.2 19.7WQ0920 Windmill Cove 9/21/2009 10:56 30 24.78 7.28 187 532 0.3 28.9WQ0921 Windmill Cove 9/21/2009 17:19 30 24.99 6.11 82 7.13 217 494 0.2 16.0WQ0922 Upper Roberts Island 9/23/2009 9:02 30 24.81 6.02 80 7.20 141 499 0.2 13.6WQ0923 Upper Roberts Island 9/23/2009 12:13 30 25.36 7.30 258 531 0.3 26.8WQ0924 Upper Roberts Island 9/26/2009 19:45 35 25.28 9.12 115 7.15 215 531 0.3 18.5WQ0925 Upper Roberts Island 9/30/2009 8:35 31 23.72 8.79 108 7.10 179 521 0.3 17.2WQ0926 Upper Roberts Island 10/2/2009 12:45 35 22.50 9.74 116 7.41 175 500 0.2 21.4WQ0927 Upper Roberts Island 10/2/2009 15:31 35 22.75 8.79 107 7.30 162 513 0.2 24.6WQ0928 Rough & Ready Island 10/4/2009 16:18 36 21.43 9.49 112 7.17 191 510 0.2 17.7WQ0929 Rough & Ready Island 10/6/2009 11:07 35 19.06 7.59 175 490 0.2 47.5WQ0930 Rough & Ready Island 10/6/2009 14:06 36 19.37 7.79 193 487 0.2 27.4WQ0931 Rough & Ready Island 10/8/2009 13:11 36 18.45 8.77 98 7.34 179 459 0.2 38.7WQ0932 Rough & Ready Island 10/8/2009 16:10 37 18.94 8.64 100 7.48 168 472 0.2 16.0WQ0933 Rough & Ready Island 10/10/2009 11:27 37 18.99 8.23 95 7.53 181 480 0.2 68.0WQ0934 Rough & Ready Island 10/10/2009 15:49 37 19.12 9.09 102 7.48 182 475 0.2 43.9WQ0935 Rough & Ready Island 10/12/2009 15:27 38 18.83 9.15 103 7.69 130 492 0.2 15.9WQ0936 Rough & Ready Island 10/12/2009 17:44 35 18.62 9.20 104 7.72 177 490 0.2 15.9WQ0937 Upper Turning Basin 10/14/2009 14:45 37 17.92 9.84 107 7.59 147 444 0.2 27.6WQ0938 Upper Turning Basin 10/16/2009 12:09 35 18.06 7.00 100 7.17 148 471 0.2 36.2WQ0939 Upper Turning Basin 10/16/2009 14:15 35 18.04 7.20 142 466 0.2 60.1
Bottom Water Quality Readings
Mari-gold Environmental Consulting Inc. Appendix B-2
Mari-gold Environmental Consulting Inc. Appendix B-3
Survey ID Dredge Reach Date Comments(m/d/year)
WQ0901 Man-made Channel 8/16/2009 No near bottom measurement due to rental unit cable only 2m long.WQ0902 Man-made Channel 8/16/2009 No near bottom reading as rental unit cable was only 2 m long.WQ0903 Man-made Channel 8/18/2009 No bottom measurement due to too short of probe cable on rental unit. Associate w/ TR0902-01WQ0904 Man-made Channel 8/24/2009 First reading with new Horiba Model 52 multi-parameter WQ meter.Associate w/ TR0905-1WQ0905 Man-made Channel 8/26/2009 Asssociate w/ TR0906-01WQ0906 Antioch 8/28/2009WQ0907 Antioch 8/28/2009 Associate w/ TR0907-04 and -05.WQ0908 Light 21 8/31/2009 QC the DO onWQ0909 Light 21 8/31/2009 Dark; associate w/ TR0908, DO readings suspectWQ0910a Light 21 9/2/2009 DO not reading correctly, will check.WQ0910b Light 21 9/2/2009 Assoc w/ TR0909WQ0911 Light 21 9/4/2009 WQ meter cleaned/DO repaired and fully recalibrated; San Joaquin Green Light 21; Associate with TR0910-1WQ0912 Light 21 9/4/2009 Associate with TR0910WQ0913 Spud Island 9/12/2009 WQ recalibrated, however DO not w/in range. Assoc w/ TR 0911WQ0914 Spud Island 9/12/2009 Assoc w/ TR0911-04 and -05. Note DO not calibrated w/in range; all other parameters calibrated priorWQ0915 Spud Island 9/13/2009 Assoc w/ TR0912 at Spud Island Red Light 20.WQ0916 Spud Island 9/13/2009 Assoc w/ TR0912-03 and -04. Near high slack tide.WQ0917 Lower Roberts Island 9/15/2009 Associate w/ TR0913 (replicate 1 & 2)WQ0918 Lower Roberts Island 9/15/2009 Assoc w/ TR0913 rep 04&05WQ0919 Lower Roberts Island 9/19/2009 reach location is Walters Island; rechecked 1st set of measurements for 2' depthWQ0920 Windmill Cove 9/21/2009 reach location is Windmill Cove; DO probe has bubble, so no DO readings takenWQ0921 Windmill Cove 9/21/2009 reach location is Windmill CoveWQ0922 Lower Roberts Island 9/23/2009 reach location is Upper Roberts but near Windmill CoveWQ0923 Lower Roberts Island 9/23/2009 reach location is Upper Roberts but near Windmill Cove, bottom DO out of range. WQ0924 Lower Roberts Island 9/26/2009 Dark. Associate w/ TR091, Upper Roberts near Windmill CoveWQ0925 Lower Roberts Island 9/30/2009 Associate w/ TR0919, Upper Roberts, Red Light 36, approximately 100 yds upstream of Dredge 7. Weak outgoing tide (shifts around 10:00).WQ0926 Lower Roberts Island 10/2/2009 Assoc w TR0920, reps 1 & 2WQ0927 Lower Roberts Island 10/2/2009 Associate w/ TR0920, replicates 3 & 4.WQ0928 Rough & Ready Island 10/4/2009 Dredge 7 just finished dredging this reach and will move up to Rough & Ready (Port Stockton W). Associate w/ TR0921.WQ0929 Rough & Ready Island 10/6/2009 1st trawl sampling at d/s end of Rough & Ready; Assoc w/ TR0922, reps 1-3. DO reading in question. Slack tide. Ship "Star Kirkeness" recently passed u/sWQ0930 Rough & Ready Island 10/6/2009 Assoc w/ TR0922, reps 4 & 5. DO not reading correctly.WQ0931 Rough & Ready Island 10/8/2009 Meter calibrated prior to use today. Port of Stockton Berth B area; Associate with TR0923, reps 1 & 2WQ0932 Rough & Ready Island 10/8/2009 Assoc w. TR0923, reps 3 - 5; Near Green Light 43.WQ0933 Rough & Ready Island 10/10/2009 Ship "Star Kirkenes" just departed Stockton within 10 minutes of this reading. Associate w/ TR0924, rep 1.WQ0934 Rough & Ready Island 10/10/2009 Assoc w/ TR0924, reps 2-5.WQ0935 Rough & Ready Island 10/12/2009 Assoc w/ TR0925, reps 1&2; Dredge 7 currently mobilizing to Sed Trap reach.WQ0936 Rough & Ready Island 10/12/2009 Assoc w/ TR0925, reps 3-5.
WQ0937 Upper Turning Basin 10/14/2009Upstream of Sediment Trap/Old San Joaquin River in Port of Stockton water along concrete plant/ship "Golden Arrow 1"; Associate w/ TR0926; Recorded on Horiba meter
WQ0938 Upper Turning Basin 10/16/2009 Last day of dredge ops for 2009; Dredge 7 finished at 11:40. Assoc w/ tr0927, reps 1-3; wq PROBE CALIBRATED AND CHECKED W/IN RANGE.WQ0939 Upper Turning Basin 10/16/2009 Associate with TR0927, replicates 4 and 5. DO reading on bottom not available;
Water Quality Comments

Appendix C. Field Data Collection Forms and Database
�


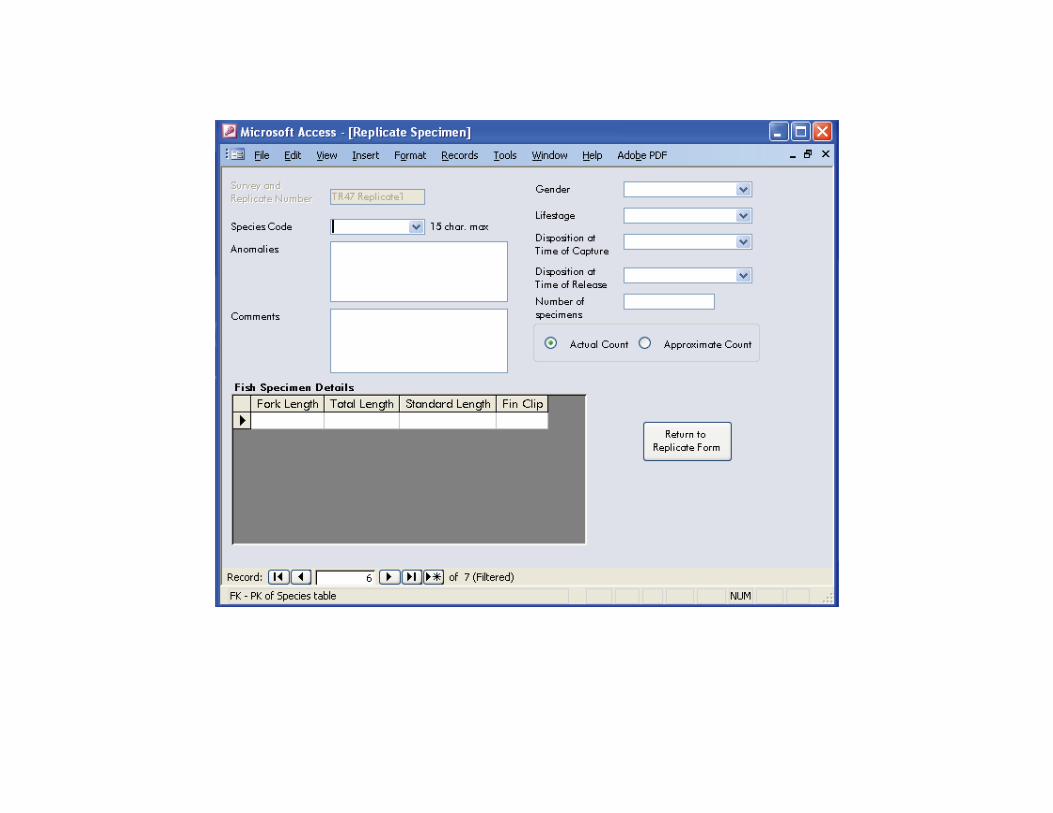

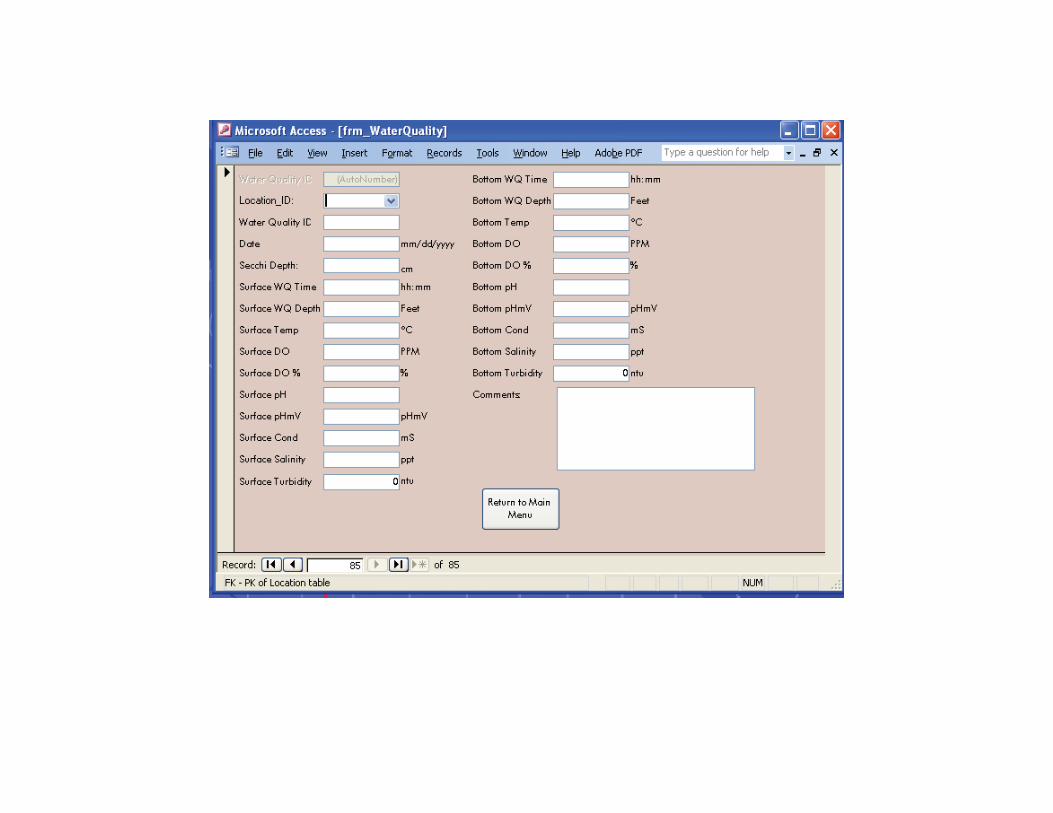


Stockton and Sacramento Deepwater Ship Channel Maintenance Dredging2009 Fish Community and Entrainment Monitoring
Fish Sampling Data Sheet 2009
Sampling Method (survey type): Dredge Reach:
Sample ID: DMP Site:
Tow Replicate: Location Markers/Aids:
Date: Tidal Phase: ebb / flood / slack
Start Time: Flow Direction: upstream / downstream
End Time: Current Direction [° True North]:
GPS: Track ID start # Current Speed [kts]:
Track ID end # Boat Speed [kts]:
Survey Depth_Lower [ft]: Speed over ground [kts]:
Survey Depth_Upper [ft]: Boat Power [rpms]:
Tow distance [m]: Weather:
Subsample? yes / no Piscivorous Bird Activity:
* Subsample percent (estimate): River bed description:
Gear Status: good / bad Daylight Conditions:
Sampling Staff / Recorder (circle):
Gear Comments
Appendix C. Database and Paper Data Entry Forms
Paper Data Entry Forms

Stockton and Sacramento Deepwater Ship Channel Maintenance Dredging2009 Fish Community and Entrainment Monitoring
Entrainment Sampling Data Sheet (Screen) Page ____of_____
Date: Sample Area Description:
DMP Location: Survey Start Time:
GPS Survey End Time:
GPS location at DMP: Total Elapsed Survey Time [hh:mm:ss]:
Weather: Dredge Pumping Rate [gpm]:
Water Temperature: Sampled Volume [gallons]:
Substrate Description:
Sampling Staff / Recorder: Bird Activity at DMP Site:
Gear Status / Notes:

Stockton and Sacramento Deepwater Ship Channel Maintenance Dredging2009 Fish Community and Entrainment Monitoring
Specimen Collection Datasheet (2009)
Date Page ofSurvey IDSurvey Replicate
[tally_count]SPECIES_ SPECIMEN_CODE
LIFE HX STAGE
CAPTURE DISPOSITION
RELEASE DISPOSITION FL (mm) TL (mm) SL (mm) SEX FIN CLIP EXTERNAL ANOMALIES COMMENTS
Notes:
Stockton and Sacramento Deepwater Ship Channel Maintenance Dredging2009 Fish Community and Entrainment Monitoring
Water Quality Monitoring Datasheet (2009)
Location: Location:Sampling Crew: Sampling Crew:
Recorder: Recorder: Associated Survey ID: Associated Survey ID:
Date: Date: Secchi Depth [cm]: Secchi Depth [cm]:
Near Surface Near Bottom Near Surface Near BottomWQ Time: WQ Time: WQ Depth: WQ Depth: Temp [°C]: Temp [°C]:DO [ppm]: DO [ppm]:
DO [% saturation]: DO [% saturation]:pH: pH:
���������� ���� ���������� ����Salinity: Salinity:
ORP [mV]: ORP [mV]:TDS [g/L]: TDS [g/L]:
Turbidity [ntu]: Turbidity [ntu]:Gear Status / Notes: Gear Status / Notes: