stock splits to profit insider trading lessons from … 2-22-17.pdf · 1 stock splits to profit...
TRANSCRIPT

1
Stock Splits to Profit Insider Trading Lessons from an Emerging Market
Vinh Nguyen†, Anh Tran‡, and Richard Zeckhauser§
December 30, 2016
Abstract
Stock splits have long presented financial puzzles: Why are they undertaken? Why are they associated with abnormal returns? Abnormal returns, particularly those coming shortly before a split’s announcement date, should raise strong suspicions of insider trading, particularly in nations with weak regulatory structures. We examined the 718 split events in the emerging stock market of Vietnam from 2007 through 2011. We found evidence consistent with illegal insider trading, particularly in firms that were vulnerable to insider manipulation and, therefore, more likely to split their stocks. When vulnerable firms’ stocks did split, they provided significant excess short-term returns. Tellingly, the abnormal returns on those stocks prior to the split announcements were also extremely high, indeed higher than their abnormal post-announcement returns. Moreover, trading volume increased prior to the split announcement date. This suspicious pattern is what we would expect if insiders were trading on their knowledge. We propose that illegal insider trading in contexts where it is possible to escape serious penalty provides a previously undiscussed and cogent explanation for both stock splits and abnormal short-term returns.
Keywords: insider trading, stock split, state ownership, emerging market, corporate governance.
JEL Classifications: G32, G15, G34
_______________________________
* We thank StockPlus Corporation for providing extensive and reliable data for this study.
† Boston College, Tel: ((857) 206-5576, Email: Vinh Nguyen <[email protected]>.
‡ Indiana University Bloomington, Tel: (812) 855-0563, Email: [email protected]. § Harvard University, Tel: (617) 354-6136, Email: [email protected]
2
1. Introduction
In recent years, insider trading has received increased attention from regulatory agencies, the
investment public, and academics. In the United States, for example, a number of high-profile cases
have been prosecuted and widely publicized.1 Official regulatory policies have also tightened
considerably worldwide. From 1990 to 2002, the number of developed countries that had insider-
trading laws governing their stock exchanges increased from 55 percent to 100 percent
(Bhattacharya and Daouk, 2002). Over the same period, the number of developing countries with
insider-trading laws increased from 39 percent to 80 percent.
A literature has started to emerge on both legal and illegal insider trading. On legal insider
trading, empirical evidence has linked insider transactions to market-timing, liquidity, and
diversification motivations (Lakonishok and Lee, 2001; and Jeng, Metrick, and Zeckhauser, 2003).
Illegal insider trading has proven much harder to study, given that perpetrators try to cover their
tracks and that broadly effective detection methods are not available. Thus, direct data on such
trades is lacking. Nevertheless, some existing studies have creatively detected evidence of illegal
trades (Bhattacharya, Daouk, Jorgenson, and Kehr, 2000; and Cheng, Nagar and Rajan, 2007).2
Typically, inside traders unfairly--and in most nations illegally--exploit their informational advantage
about upcoming corporate events, such as mergers and acquisitions. However, inside traders have
1 The U.S. Securities and Exchange Commission prosecuted about 50 cases each year from 2004 to 2011. High-profile insider trading cases involved Samuel Waksal, the former CEO of ImClone, convicted in 2002, as was his famous investor Martha Stewart; Jeffrey Skilling, the former Enron president, convicted in 2006; Mark E. Lenowitz, hedge fund manager at Chelsey Capital, convicted in 2007; and Raj Rajaratnam, founder of hedge fund firm Galleon Group, convicted in 2011. In November 2013, SAC Capital Advisors was the first large Wall Street firm to plead guilty in a large illegal insider trading case. SAC agreed to pay a record fine of 1.2 billion dollars and stop managing money for outside clients.
2 Bhattacharya et al. (2000) identified unrestricted insider trading as the cause of the non-reaction of share-price to corporate news in the Bolsa Mexicana de Valores. Cheng et al. (2007) proved that insiders took advantage of Form 5 to delay the disclosure of their share sales prior to unfavorable earnings announcements.
3
not been accused of creating such events to generate profitable trade opportunities. Our study will
provide evidence that illegal inside traders in Vietnam, a nation with weak regulatory enforcement,
actually created and manipulated stock-split events in order to secure profits.3
Stock splits have received extensive examination for a long time, but the reasons for splits
and their associated abnormal returns remain unclear. (We use the terms “abnormal returns” and
“excess returns” interchangeably to indicate stock price movements above market returns.) Stock
splits apparently affect neither the cash flows nor the capital structures of firms, although those
factors could boost stock prices. Despite this, a stock split can produce significant positive abnormal
returns, both when the split is announced and when it is executed (Dolley, 1933; Barker, 1956; and
Hausman, West, and Largay, 1971). The current literature provides three explanations for such
excess returns. The trading-range explanation posits that a firm splits its stocks to slice the stock price
so that it falls within a lower price range, which is preferred by many investors (Copeland, 1979; and
Amihud, Mendelson, and Uno, 1999). The liquidity explanation posits that a stock split increases the
liquidity of a firm’s stock, which in turn increases its split-adjusted price (Muscarella and Vetsuypens,
1996; and Lin, Singh, and Yu, 2009). The signaling explanation asserts that split decisions overcome
informational asymmetries by disseminating good information that previously was known only to
the firm’s management (Fama, Fisher, Jensen, and Roll, 1969; Byun and Rozeff, 2003; and
Ikenberry, Rankine, and Stice, 1996). However, these theories have been debated by Copeland
(1979); Lamoureux and Poon (1987); and Desai, Nimalendran, and Venkataraman (1998).4
Our study proposes a new explanation for why stocks are split. If stock splits can be
expected to produce excess returns, at least over some period, they become an attractive strategy for
3 World Bank (2006) “Vietnam--Report on the Observance of Standards and Codes (ROSC): corporate governance country assessment.” 4 In an ongoing project, we study how emerging markets with weak legal system react to stock splits differently from developed markets.
4
illegal insider trading. However, to date, no link between stock splits and insider trading has been
discussed in the literature. We know of only three studies that look at stock splits and insiders; those
studies do not consider insider trading. Han and Suk (1998) show that greater insider ownership
correlates positively with stock splits. They explain this as a use of signaling: when insiders own a
great deal of stock, the firm’s signal of good performance to the market should be more credible.
Ma, Sun, and Yur-Austin (2000) find that insiders tend to sell before splits, but the authors conclude
that these sales are not related to the insiders’ private information. Devos, Elliott, and Warr (2010)
show that executives who have option-based compensation tend to split their companies’ stocks
more frequently, and the characteristics of their option-based compensation influence the magnitude
of the split factor. In this paper, we will demonstrate that insider trading provides a major
motivation for stock splits, at least in markets where it is unlikely to be punished.
Vietnam is such a market. The stock exchanges in Ho Chi Minh City and Hanoi were
opened in 2000 and 2006, respectively. The regulations there, in principle, prohibit insider trading;
but the implementation of these regulations is lax, as in many other emerging markets. During the
first decade of the Vietnamese market’s existence, insider trading is believed to have been
widespread; however, no case was ever prosecuted.5
In Vietnam’s market, on average, a stock’s price increases by 8.4 percent in the 30 trading
day period before a split announcement, and increases another 7.4 percent after the announcement,
though it subsequently falls back to its initial level. This bubble has an average cycle of around 270
days, but the length varies greatly across both splits and firms (Please see Figure 1). The surprising
fact is that this bubble reappears for each new split; the market does not seem to learn to avoid
overpaying in the bubble after a split. About eighty percent of participants in this stock market are
5 According to Tuoi Tre News Paper, June 29, 2011, the case of Le Van Dung, CEO of Vien Dong Pharmaceutical JSC, in 2011, was the first criminal prosecution of illegal insider trading and stock manipulation activities over the eleven-year history of the Vietnam stock market.

5
individual investors, mostly unsophisticated,6 with limited ability to evaluate the effect of stock-split
news on the values of the firms (Saigon Tiep Thi, 2010). Instead, they rely on past experience and
the behavior of other investors to make their trade decisions. This leads to momentum-investment
behavior and to repeated bubbles. Given the market’s consistent behavior, insiders can simply buy a
stock at prevailing prices, announce a stock split, wait for the price to rise, sell the stock before it
reverts, and reap a handsome profit.
What might prevent insiders from orchestrating stock splits for their own benefit? First,
vigorous prosecution of insider trading would be a strong deterrent. Vietnam, like many emerging
markets, lacks such prosecution. Second, good corporate governance would prevent splitting to
benefit insiders. Given the bubble that follows, stock splits bring a short-term stock price increase at
a cost of higher volatility. That volatility raises the long-term risk profile for a stock.7 In fact, after a
split, the standard volatility measure of these stocks increases by 13% on average. Thus, long-term
investors, if they understood the situation, would discourage the management from conducting
stock splits. In many firms, investors, who may be ill–informed, make few or unsuccessful efforts to
discourage this practice.
Our study focuses on two measurable characteristics of firms that affect their governance:
their ownership and their capitalization levels. Ownership structure has been demonstrated, both
theoretically and empirically, to be a predictor of corporate governance quality (Shleifer and Vishny,
1997; and Boubakri, Cosset, and Guedhami, 2005). In emerging markets, the link between state
ownership and market value and performance of public companies has been identified in the
literature. Political connections prove important and valuable. They lead to more favorable pricing in
6 According to Capon, Pasini, Phuong, Anh, and Chi (2011), about 90% of trading accounts in Vietnam were opened from 2007 to 2010. This means that most investors joined the market at the height of the stock bubble and only had 3 or 4 years of experience, at most. 7 As we discuss below, current stockholders also lose from stock splits because of taxes mistakenly imposed on the new shares received.

6
an IPO (Francis, Hasan and Sun, 2009), and to superior performance in a merger (Ma, Sun,
Waisman and Zhu, 2016). State ownership has been shown to be associated with poor governance
(Bushman, Piotroski, and Smith, 2004; Wang, Wong, and Xia, 2008; Aharony, Lee, and Wong, 2000;
and Qian, 1996). (Bushman et al. looks across countries, both developed and developing. The other
six studies cited for emerging markets focus on China.) Government officials, who represent the
state’s share in a firm, often also own some shares of the firm, either directly or indirectly through
family members. They enjoy substantial voting power thanks to their control of the state’s share,
which they can deploy to benefit their own relatively small positions. Additionally, they can engage
in a strategy of buying additional shares shortly before they announce a split. This asymmetry leads
to a problem: officials can use their voting power to manipulate a stock split to benefit themselves at
the expense of the other owners of the firm’s shares.
The capitalization level of a firm affects the likelihood of insider trading, through at least
three mechanisms. First, small capitalization means that the number of investors and analysts who
know the firm well will be small. This magnifies the informational asymmetry between the firm’s
insiders and its outside investors. Second, small capitalization implies that a small group of investors
can hold enough voting power to promote a stock split. Third, small capitalization makes it easier
for a small group of investors to buy and sell a stock as a means to create momentum in its price.
Indeed, size has long been used as an indicator of corporate governance, with bigger being better
(Diamond and Verrecchia, 1991; and Black, Jang, and Kim, 2006). The current study uses state
ownership and capitalization size as two markers of a firm’s vulnerability to insider trading. We will
refer to firms with large state ownership and/or small capitalization as vulnerable firms.
If stock splits at vulnerable firms are more likely to be exploited by insiders, the evidence
would manifest itself in several ways. First, vulnerable firms would be more likely to split their
stocks because insiders in these firms would promote that. In fact, we find that a state-owned firm is
7
12.5 percent more likely to split its stock than a privately owned firm.8 Second, vulnerable firms
would experience greater short-term abnormal returns from splits than non-vulnerable firms. The
inside traders would endeavor to increase short-term returns to provide a source of personal profits.
In fact, we find that switching from predominantly private ownership to 50% state ownership
increases short-term abnormal returns by 9.8 percentage points in the period from 30 days before
split announcements to 30 days after split announcements. Focusing on the firms in the lower half
of capitalization boosts short-term abnormal returns by 3.9 percentage points. Third, in comparison
to other firms, vulnerable firms would have their stock prices increase relatively more before, rather
than after, the split. This is because before the split, insiders at vulnerable firms would start buying
stock in anticipation of the split that they would soon be creating. We investigate these hypotheses
using standard event-study methods. To preview results, our analyses indicate that, on average, the
differences between pre-split and post-split returns for state-owned firms in the study periods of 15
days before and after (-15, +15) and 30 days before and after (-30, +30) are 15.25 and 21.6
percentage points, while the respective figures for private firms are 6.8 and 11.4 percentage points.
Halving capitalization increases the differences between pre-split and post-split returns by 3.2 and
6.2 percentage points.
Studies on illegal insider trading generally rely on creative and indirect measures of that
activity, given the lack of access to confidential trade-log data. We follow in this tradition. We show
that stock prices surrounding splits at vulnerable firms behave in ways that are highly consistent with
insider trading. We also discuss alternative interpretations of such behavior and their plausibility.
The remainder of the paper is organized as follows. Section 2 briefly describes Vietnam’s
stock market and key patterns in our data sample. Section 3 presents our hypotheses about insider
8 In this study, firms with state ownership of over 50% are considered state-owned firms. Firms with less state ownership are considered private firms.

8
trading, our empirical strategy, and our results. Section 4 explores alternative interpretations of the
results. Section 5 discusses the study’s limitations and offers our conclusions.
2. Vietnam’s context and descriptive analysis
2.1. Vietnam’s stock market
Vietnam’s first bourse, the Ho Chi Minh Stock Exchange (HOSE), was established in Ho
Chi Minh City in 2000. Its second bourse, the Hanoi Stock Exchange (HNX), was opened in Hanoi
in 2006. The operations of the two exchanges are overseen by the State Securities Commission
(SSC), the government agency primarily responsible for enforcing the securities laws and regulating
the securities industry in Vietnam.
During the fourteen-year period January 2000 through December 2013, Vietnam’s stock
exchanges have experienced three main phases. From 2000 to 2004, the market was in a nascent
stage, with fewer than ten firms having their shares listed. The total market capitalization of the
listed firms represented less than 1% of the nation’s GDP. In the period from 2005 to 2007, the
market boomed; the stock index tripled during that period. The number of listed firms increased to
240 by the end of 2007. At its peak in 2007, the total market capitalization of the listed firms was
equal to about 30% of the GDP. A speculative bubble built up; it burst in early 2008, as Vietnam’s
economy experienced its most severe crisis since the early 1990s. By March 2009, the market had
declined 80% from its peak in 2007. The market rallied briefly in the second half of 2009. From
2010 to the end of 2013, Vietnam’s stock index moved sideways within a narrow band, at about 50%
of its 2007 peak.
Stock trading on HOSE and HNX is conducted via automated order-matching systems.
Caps on price movements have been in effect since the first day of the market’s operations. On the

9
first trading day, a newly listed stock on the HOSE can only trade within a 40% band of the
registered listing price. On subsequent trading days, trading limits (for bonds and equities) of 5% of
the previous closing price apply. For firms listed on HNX, there are no price limits on the first
trading day; but trading limits of 7% of the previous average price apply on subsequent trading days.
Besides the price limits, Vietnam’s securities laws also restrict other important trading practices, such
as intraday trading, leverage, and short sales. Intraday trading of the same stock was totally
prohibited in the past and has only been allowed since August 8, 2011. Leverage had not been
allowed until recently; and short sales are strictly banned in Vietnam’s stock market, which makes
upward price manipulation easier to achieve and less risky, since arbitrageurs are prohibited from
participation on the sell side.
These trading restrictions in Vietnam’s stock market are intended to promote the growth of
the market and to prevent market manipulation. However, Bhattacharya and Daouk (2009) show
that, in many countries, a stock market lacking securities laws functions more effectively than can a
stock market with poorly enforced securities laws. This finding is particularly relevant to Vietnam’s
stock market. Vietnam’s regulators place strict regulations on the books, but the minimal
enforcement of those regulations indirectly enables fraudulent activities. Deceitful traders are able
to take advantage of the law-abiding traders, who follow the regulations, and to take even greater
advantage of naïve traders, who unrealistically feel protected by the regulations. For example, the
intraday trading restriction does not allow traders to execute both buy and sell transactions on a
single trading day. Additionally, the required waiting time before settlement for buy/sell orders,
except for block trades of over 100,000 shares, is four trading days. This means that a law-abiding
trader who opens a long or short position for a stock during a bubble will have to wait for four days
to close the position. Deceitful traders, on the other hand, usually maintain multiple accounts under
10
different identities, and thereby circumvent the regulations, selling stocks illegally before the 4-day
minimum and outmaneuvering law-abiding traders.
In this lax legal environment, insider trading on private information has emerged as a
significant and prevalent problem. Under the laws, insiders and large shareholders (those holding
more than 5% of common shares) are required to disclose their trades 7 days before executing the
transactions, and again within 7 days after completing them. However, the fine for violating these
trade-disclosure requirements is minimal, normally ranging from several hundred dollars to several
thousand dollars per case. As a result, insiders can afford to trade illegally at optimal times and pay
any fines later. In some cases, insiders even use the trade-disclosure requirements to ambush the
market, by declaring a false intent to buy as a way of masking their actual plan to sell, and vice versa.
In a well-known 2010 masking maneuver, Phuong Nguyen, holding 8.7% of VICEM
Materials Transport Cement JSC (ticker symbol: VTV), declared her plan to buy another 20.3%
share interest of the firm at a 10% premium over the market price. In the month after the
announcement, VTV’s share price zoomed up 57%. In the meantime, Phuong sold her entire 8.7%
holding of VTV without disclosure. VTV’s share price then fell back to the pre-announcement level
(Thanh Nien, 2010), and Phuong and her co-conspirators gained at least $500,000 from the
transactions. She later paid an $18,500 fine for violations associated with her patently false
“disclosure.”
Individual investors dominate Vietnam’s stock market. Indeed, such investors, mainly short-
term speculators, account for about 80% of the trading volume by value of the two exchanges in
Vietnam. These investors are typically government employees, small business owners, or farmers;
they may have reaped some windfall money from the recent real estate boom or borrowed from
banks. Most individual investors lack professional investment knowledge and simply follow the
11
herd. My and Truong (2011) showed that “… given the structure of Vietnamese stock market,
investors are more likely to follow the actions of others believed to be better informed about the
market.” The herding behavior and the lack of investment knowledge make individual investors an
easy target for market manipulators, including inside traders. These problems are compounded
because the large securities firms that might bring prices into line do not exist.
The high level of state ownership in a number of public firms magnifies the insider-trading
problem. Managers of state-owned firms often represent the state at board of director and investor
meetings. However, the government has no effective mechanism for supervising its representatives.
The managers usually have significant control power but only a small share interest in the firms. This
leads to principal-agent problems and to unfair treatment of outside shareholders in most state-
owned firms. Compared to private firms, the management of state-owned firms is less likely to focus
on shareholder value, and more likely to engage in self-dealing and insider trading.
In recent years, the media and the SSC have uncovered a number of insider-trading
violations and stock-price manipulations in Vietnam. Illegal inside traders usually are firm managers,
brokerage firms, large investors, or groups of large investors; these possess informational and
trading advantages over the investment public.9 The most common trading violations in Vietnam
are failures to disclose insiders’ transactions, pump-and-dump-practices, and rumor spreading.
Although these deceptive practices are common, few cases have been investigated; only one case
was criminally prosecuted.10
9 According to the SSC, on average, there were 4 to 5 trading-disclosure violations per month from 2007 to 2010 in Vietnam. 10 In the prosecuted case, Dung Le, chairman of Vien Dong Pharma JSC (ticker symbol: DVD), and three other people were arrested for manipulating the stock price of DVD and Ha Tay Pharmaceutical JSC (ticker symbol: DHT). From Jan 2010 to Sept 2010, with the help of 4 brokerage firms, Dung and his brother conducted 1,725 trades among 12 different accounts to drive up DVD’s price 120% and DHT’s price 300%. He then used false revenue figures to inflate DVD’s income and started acquisition rumors to sell his stock holdings. DVD went bankrupt after his arrest ( Son, 2010; Ha, 2010; and Linh, 2011A).

12
In 2010, the prevalence of illegal trading activities induced the government and the National
Assembly to make major changes in the securities laws and regulations. In December of that year,
the government and the National Assembly passed new amendments to the securities law[s] to
impose higher penalties and conduct more criminal prosecutions of violations. For illegal insider-
trading activities, the new laws allow all related profits to be confiscated and further penalties to be
imposed. Criminal prosecutions can now be undertaken for illegal insider trading, rumor spreading,
and fraudulent accounting practices (Capon et al., 2011). In several notable cases since then, the
SSC has imposed new penalties on inside-information traders and manipulators (Linh, 2011B).
The first stock-split event in Vietnam’s stock market took place in 2002. Refrigeration
Electrical Engineering Corp. (REE) executed a 1.2/1 split (1.2 new shares for 1 old share). Its
market-adjusted excess return in the week after the split announcement was 20%. In their first 4
years, the stock markets of Vietnam only recorded 3 other stock splits. Since 2006, however, stock
splits have become a frequent corporate event in the stock market of Vietnam. From January 2007
to May 2011, 718 split events were conducted by 393 of the 686 firms listed on the HOSE and the
HNX, implying that, on average, nearly a quarter of the firms split their stocks in a year. By
contrast, in the United States, on average only about 10 percent of the firms split their stocks in a
year (Desai et al., 1998).
In developed stock markets, Easley, O’Hara, and Saar (2001) noticed that stock splits often
attract uninformed traders and small investors. In Vietnam’s developing stock market, stock splits
have far greater impacts, due in part to the naiveté of investors and regulators as to the nature of the
underlying corporate events. For example, in 2010, Vietnam’s Ministry of Finance incorrectly
categorized the new shares that shareholders receive after stock splits as gains; it even imposed a 5%
income tax on the new stock received in splits. The increase in the number of shares is still being
treated as a gain for the shareholders. In addition, the effects of nominal prices on investors’
13
securities preferences, as noted by Baker, Greenwood, and Wurgler (2009), are also significant in
Vietnam’s stock market. All stocks in Vietnam are required by law to have a par value of
VND10,000. For naïve individual investors, that regulation creates an illusion that the lower the
stock’s nominal price is, especially below VND10,000, the greater a bargain the stock is. Given the
attraction of stock splits to investors, strategic splits prove to be an attractive mechanism by which
insiders exploit investor naiveté.
2.2. The data sample
The data for this study were provided by StoxPlus Corporation, a major provider of financial
data on Vietnam’s stock market. The data sample includes all stock splits and stock dividends during
the period from January 2007 to May 2011, a total of 718 splits. This time span includes an initial
period of high growth in stock prices in Vietnam, followed by a period of decline. Stock split, stock
dividend, and bonus shares are the terms which firms in Vietnam use interchangeably to indicate a stock
split, a terminology that we adopt. The sample excludes discount share issuances to current
shareholders, a hybrid form of stock sale and stock split.
The dates of the split announcements and executions were recorded in detail by StoxPlus.
We cross checked a random sample of this information with SSC’s database of firm filings and
verified its accuracy. We employ a panel dataset on stock prices, with 426,931 daily observations for
all firms listed on the exchanges. This dataset includes daily trading data, firms’ financial ratios, and
stock-split information. For the pre-split periods, stock prices and trading volumes are adjusted by
the split factors. Stock prices and trading volumes are also adjusted for other events, such as cash
dividends and discount issuances to shareholders, that occurred throughout the period under
examination. Financial ratios are calculated by StoxPlus according to the standard methods
suggested by the CFA Institute.
14
Data on market indices (called the VN Index and the HNX Index) are provided daily by
each exchange. These are market-value-weighted indices that include all listed stocks on their
respective exchanges. The indices include shares eligible for free transfer; they exclude restricted
shares.11
2.3. Descriptive Analysis
The sample means for the variables used in our analysis are shown in Table 1. The first
column reports the means for all firms in the sample; the next three columns present values for the
25th, 50th and 75th percentiles. The fifth column shows the number of observations for each variable.
Because most of the regressions in our analysis use the dataset of split announcements, the greatest
number of observations is 718, which is the total number of stock splits in our sample.
[Table 1 about here]
Vietnamese firms are quite small compared to those in developed-nation markets. The mean
and median firm sizes, as measured by market capitalization, are VND1,880 billion and VND342
billion, respectively. This is equivalent to US$89.5 million and US$16.3 million, respectively. The
government holds a significant proportion of shares in many of the stocks. The mean and median of
state-ownership percentages are 23.2% and 17.0% among the firms that split stocks.
Among the 718 stock splits, we have data on the realized leading earnings growth on 352.
The remaining 366 splits lack this data because they occurred within one year from the start or the
end of the data period. The mean and median of the realized leading earnings growth are -1.2% and
0.3%. The liquidity standard measure is the one-month share turnover, that is, the ratio of 30-day
average trading volume to the total number of outstanding shares. We measure a stock’s return
11 Some high market-capitalization firms such as Vietcombank (ticker symbol: VCB) or Sai Gon-Quy Nhon Mining Corporation (ticker symbol: SQC) account for insignificant parts of the indices because only a small portion of the firms’ common shares can be transferred freely. Therefore, the impacts of these stocks on the indices are smaller than those of firms which have similar market capitalization but more free-transfer shares.
15
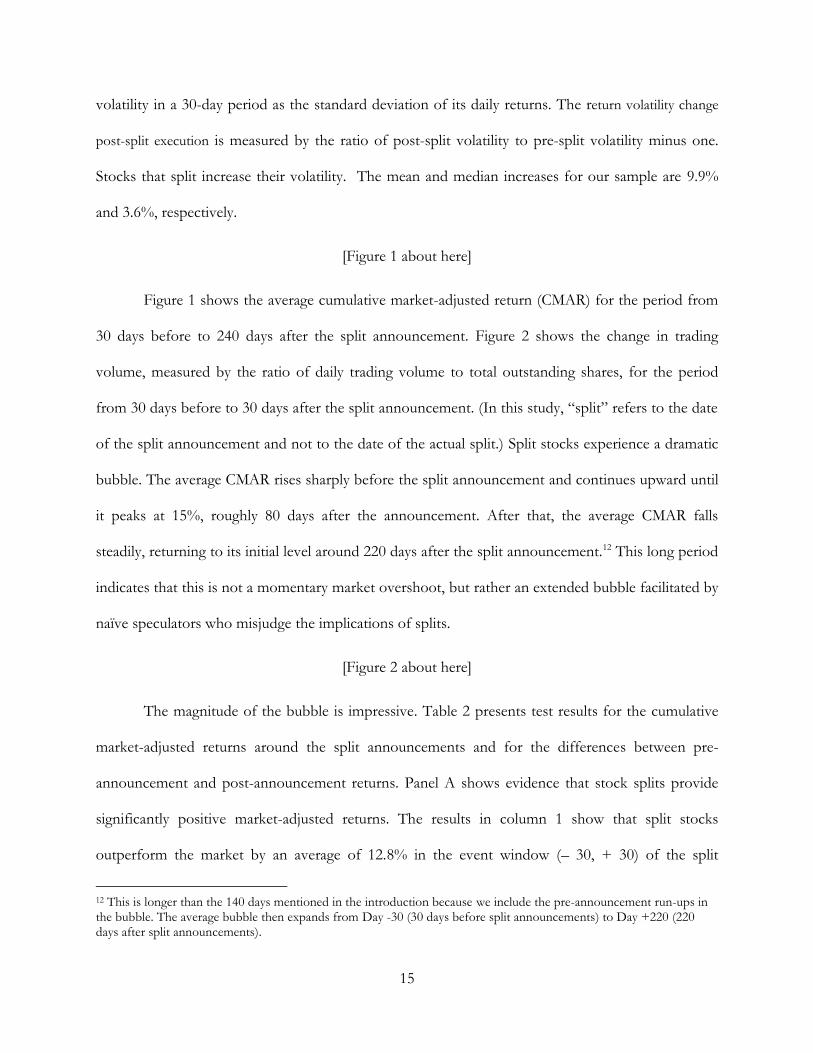
volatility in a 30-day period as the standard deviation of its daily returns. The return volatility change
post-split execution is measured by the ratio of post-split volatility to pre-split volatility minus one.
Stocks that split increase their volatility. The mean and median increases for our sample are 9.9%
and 3.6%, respectively.
[Figure 1 about here]
Figure 1 shows the average cumulative market-adjusted return (CMAR) for the period from
30 days before to 240 days after the split announcement. Figure 2 shows the change in trading
volume, measured by the ratio of daily trading volume to total outstanding shares, for the period
from 30 days before to 30 days after the split announcement. (In this study, “split” refers to the date
of the split announcement and not to the date of the actual split.) Split stocks experience a dramatic
bubble. The average CMAR rises sharply before the split announcement and continues upward until
it peaks at 15%, roughly 80 days after the announcement. After that, the average CMAR falls
steadily, returning to its initial level around 220 days after the split announcement.12 This long period
indicates that this is not a momentary market overshoot, but rather an extended bubble facilitated by
naïve speculators who misjudge the implications of splits.
[Figure 2 about here]
The magnitude of the bubble is impressive. Table 2 presents test results for the cumulative
market-adjusted returns around the split announcements and for the differences between pre-
announcement and post-announcement returns. Panel A shows evidence that stock splits provide
significantly positive market-adjusted returns. The results in column 1 show that split stocks
outperform the market by an average of 12.8% in the event window (– 30, + 30) of the split
12 This is longer than the 140 days mentioned in the introduction because we include the pre-announcement run-ups in the bubble. The average bubble then expands from Day -30 (30 days before split announcements) to Day +220 (220 days after split announcements).

16
announcements. The t-statistic of 7.16 indicates that the average cumulative market-adjusted return
is significant at the 99.95% level. The non-parametric Wilcoxon test confirms this result. The
majority of the run-up occurs before the split announcement, which suggests insider [trading/
buying]. The pre-announcement CMAR for the period (– 30,+ 0) is 9.27%. However, we cannot
disentangle the three potential contributors to this run up: insiders who are buying to profit from
further price increases, leakage (perhaps purposeful) of information to non-insiders, and a
momentum response to an initial run-up resulting from insider purchases.
[Table 2 about here]
This short-term abnormal return from splits reverts to zero over an extended period, as
indicated in Figure 1. Panel A also shows that the cumulative market-adjusted returns for the periods
(– 30, + 210) and (– 30, + 240) do not differ significantly from zero. This reversion behavior is
important because it supports the insider-trading explanation over alternative explanations, such as
the liquidity and signaling theories, or, indeed, any theory that suggests that stock splits enhance
long-run stock values. The liquidity and signaling theories rely on fundamental changes, such as a
decreased cost of equity (Lin et al., 2009), or revealed information about long-term outperformance
(Byun and Rozeff, 2003). Such changes would produce sustained value increases around stock splits
rather than short-term abnormal returns followed by full reversion, the pattern seen in Vietnam.
Such reversion suggests some mode of manipulation to achieve stock splits, rather than fundamental
changes, such as improved liquidity or positive signals.
The pre-announcement abnormal returns have often been used both by market regulators
and scholars to detect trades on private information. Meulbroek (1992) shows that the stock market
recognizes informed trading and incorporates a major proportion of the information into the stock
price before the information becomes public. Olmo, Pilbeam, and Pouliot (2011) point out that a

17
large part of suspected insider trading occurs in the 25 days prior to the release of market-sensitive
information. Building on these studies, we use the difference between pre-announcement return and
post-announcement return to indicate the magnitude of illegal insider trading around each split
announcement. Specifically, we employ the following formula to calculate this difference in the
period (– j, + j):
Dif( – j, + j) =
(Formula 1)
Here P(j) is the share price at time (j); and Index(j) is the value of the relevant market index at
time (j). The expression in the first pair of brackets indicates the pre-announcement market-adjusted
return. The expression in the second pair indicates the post-announcement market-adjusted return.
In both bracket pairs, the growth in share price and in the index’s value are respectively divided by
the share price and the index’s value on the benchmark date (–j). This division eliminates concerns
about units for share prices and the market index. Using the same benchmark date (-j) for the two
components of the calculation ensures that, if pre-announcement market-adjusted returns are higher
than post-announcement market-adjusted returns, the indicator Dif(-j, +j) will always be positive, and
vice versa.
An alternative approach would employ the ratio, instead of the difference, of the two
components above. However, this ratio would be difficult to interpret when it takes a negative value.
In that case, we would not know whether the stock price falls before or after the split
announcement. Therefore, we use the difference indicator, which allows us to deal with the cases
where the post-announcement returns continue to increase and the cases where the post-
announcement returns start to decline. The greater the difference, the greater is the impact of buying

18
that takes place before the announcement associated with the split. We refer to this as inside buying,
since all of it is launched by insiders; however, some is, no doubt, due to information leakage or
momentum buying in response to insiders boosting the stock price.
Using this formula, Panel B in Table 2, column 1, provides strong evidence of insider
buying. It also shows that returns from illegal insider trading are significant. In the period (– 15,+
15), on average, the pre-announcement return is higher than the post-announcement return by 10.08
percentage points. This difference is significant at the 99% confidence level, using either a t-test or a
non-parametric Wilcoxon test. Similarly, in the period (– 30,+ 30), the pre-announcement return is
higher than the post-announcement return by 7.28 percentage points, also significant at the 99%
confidence level in both tests. In line with the findings by Meulbroek (1992) and Olmo et al. (2011),
the fact that stock prices move sharply higher before stock splits is consistent with the insider-
trading explanation. Next, by analyzing stock splits by firms vulnerable to insider problems, we will
show further evidence of insider trading. That is, we find insider buying where we would expect to
find it.
3. Insider Trading in Vulnerable Firms
3.1. Hypotheses
If inside traders in vulnerable firms are particularly able to exploit stock splits, there should
be at least three disparate tracings of evidence. First, vulnerable firms should be more aggressive
than non-vulnerable firms in splitting their stocks. Second, abnormal returns from splits by
vulnerable firms should be higher due to more active manipulation. Third, the differences between
the pre-split and post-split abnormal returns should be greater for vulnerable firms than for non-
vulnerable firms. These expectations are developed into three corresponding hypotheses below.

19
Each hypothesis helps support our overall proposition that illegal insider trading induces stock
splits; each explains the splits’ abnormal returns in the markets of Vietnam.
Hypothesis 1: Vulnerable firms are more likely than non-vulnerable firms to split their stocks.
Vulnerable firms, as mentioned, are defined above as having high state ownership and/or
small market capitalization levels. Firms with high state ownership tend to be bureaucratic and
should, therefore, other factors being equal, be less active than private firms in conducting a broad
array of corporate events, such as stock splits. Also, firms with small market capitalization tend to
have low unit stock prices and should, therefore, be less likely to split their stocks for trading-range
reasons.13
However, the potential for insiders to promote personally beneficial stock splits fosters the
opposite tendency. High state ownership or small market capitalization gives a small group of
insiders enough voting leverage to push for a stock split that, in the long term, does not benefit, and
indeed slightly harms,14 the shareholders as a whole, while benefiting the insiders personally since
they can trade before the split is announced.15 Cheng et al. (2007) used the case of delayed-disclosure
trades to show that strong corporate governance can reduce information-based insider trading.
Expanding this finding to the specific case of stock splits, the test of our Hypothesis 1 will indicate
whether vulnerable firms are more likely than non-vulnerable firms to split their stocks.
13 In our sample, share prices of 69.1% of firms whose market capitalization is below the market median are below the market-median share price. 14 We refer to the loss due to increased volatility. Since 2010, shareholders also incurred a tax on the new shares received. 15 Our test of this hypothesis follows the approach of Bertrand and Mullainathan (2001), which detects insiders’ opportunism in a corporate event by testing the relationship between the quality of corporate governance and the frequency of the event. Cheng, Nagar, and Rajan (2007) also apply this approach to show that strong corporate governance can reduce information-based insider trading in Form-5 sales.

20
Hypothesis 2: Vulnerable firms will have higher abnormal returns around stock splits than non-vulnerable
firms.
As described in the previous section, insiders typically start by secretly buying stocks, then
announce the split decision, and then sell their stocks when the price reaches their expected
appreciated level in response to the split announcement. This strategy alone would be sufficient if
naïve outsiders were highly likely to believe that a stock would rise in response to a split
announcement. But some of the naïve outsiders may respond solely or predominantly to momentum
in the stock price. Recognizing this, the inside traders who initially promote a split may undertake to
manipulate the stock price after the announcement. In a strategy that is referred to as “pump and
dump,” they actively buy and sell to themselves or each other to increase the trading volume, boost
the short-term price, and thereby attract momentum traders. Pump-and-dump schemes are much
cheaper to accomplish in firms with smaller market capitalizations, because the illiquidity of these
stocks make the stock prices very sensitive to supply or demand surges. Similarly, it is easier to boost
prices and trade volumes in firms with high state ownership because the government rarely buys or
sells its holdings. Therefore, we expect that the stock prices of firms with high state ownership
and/or low market-capitalization levels will be manipulated upward more intensely after a split, and
we conclude that significant run-ups that eventually collapse reveal pump-and-dump traders at work.
Hypothesis 3: Vulnerable firms will exhibit a greater difference between pre-split and post-split returns
than non-vulnerable firms.
Before the split date, inside traders know about the split; outsiders do not. After the split
date, everyone has similar information, at least about the split itself. Consequently, net insider-
buying activity should be more intense before, rather than after, the split date. As discussed in
Section 2, if stock prices increase significantly prior to the split date, that is highly suspicious.

21
Further, if the pre-split price increase as compared to the post-split increase is greater for vulnerable
firms than for non-vulnerable firms, that provides further evidence for insider trading in the
vulnerable firms.
3.2. Computing abnormal returns
A key element of our analyses requires the computation of abnormal returns in response to
stock splits. There are two established methods for calculating these returns. The market-adjusted-
return method computes the abnormal returns as the difference between the stock’s actual return and
the market’s returns. The market-model-residual method computes the abnormal returns as the
difference between the stock’s actual return and the predicted returns using the stock’s historical
returns. The main advantage of the market-model-residual method is that it permits a different
relationship between each stock’s returns and the market’s average returns. However, this method
suffers two major limitations when assessing returns over an extended period. First, the relationship
between a firm’s stock price and the market average (as measured by the regression beta coefficient)
may not be stationary, particularly around stock splits. This renders unreliable the estimates of
expected returns after split announcements. Brennan and Copeland (1988) report that firms’ betas
increase about 20% after split announcements, and about 30% after split executions. They find that,
seventy-five days after split executions, betas remain about eighteen percent above their pre-split
levels. Second, the market-model-residual method would significantly reduce the size of our data
sample, because this method would exclude a number of stock splits which were conducted by
newly listed firms. Out of 718 stock split events, slightly more than 200 would have enough
observations for our tests of hypotheses. This small sample size would reduce the reliability of those
tests.
22
We choose the market-adjusted return method to measure the abnormal returns of split
stocks in our analysis. This method, which is appropriate to an extended study period and allows for
a larger sample size than the market-model residual method, has previously been used in other
studies addressing similar contexts (De Bondt and Thaler, 1985; and Charitou, Vafeas, and
Zachariades, 2005). The market-adjusted return is calculated as the difference between the stock’s
raw return and the return of the market. Although the model is based on the simple assumption that
the normal return is equal to the market return, Brown and Warner (1980, 1985) show that the
model often provides estimates similar to those of more sophisticated models that control for other
factors. 16
In each study period, intraday market-adjusted returns are accumulated to find the
cumulative market-adjusted return for the period. The market-adjusted returns and the cumulative
market-adjusted returns are then used for tests throughout this study. Figure 1 graphically displays
the average cumulative market-adjusted returns for all split announcements under study.
3.3. Testing for Hypothesis 1
Hypothesis 1 states that vulnerable firms are more likely than non-vulnerable firms to split
their stocks. To test this hypothesis, we need to identify the relationship between the vulnerability of
a firm and the probability that it will split its stock in a certain period. To do so, we need to choose a
certain period and then study firms that exist for that whole period. We recognize that a longer
study period would offer both advantages and disadvantages. For example, an earlier starting date
would cover more splits but would reduce the sample of firms, since few firms were listed on the
Vietnamese market in its early years. Given this tradeoff, we choose to count splits from January 1,
16 We also conducted our tests using the market-model residual method. Stock splits of firms which had been traded on the market for less than one year are excluded from the data sample. This reduced the sample size by roughly 40%. Hypotheses 1 and 2 were sustained using this alternative method. Hypothesis 3 lost significance. Results are available from the authors.
23
2010, through April 28, 2011, which is the last date in the dataset. (We later vary this study window
to test the robustness of our results.) It allows us to test Hypothesis 1 on all 462 firms listed on the
HOSE or the HNX as of January 1, 2010. The sample eliminates 224 firms which were listed after
January 1, 2010. This period covers 219 of the total 718 splits that are recorded in the dataset. To
test for Hypothesis 1, we run the following regression:
Spliti,k =a1 STATEi + a2 SIZEi + β1 FirmCharacteristicsi + γk + εi,k (1)
Here i and k index firm and industry. Spliti,k is a binary variable that turns from 0 to 1 if the
firm conducted at least one stock split with a split factor of 1.3 or greater in the period from January
1, 2010, to April 28, 2011. STATEi is the percentage of the shares held by the government. SIZEi is
the natural logarithm of the firm’s market capitalization. FirmCharacteristicsi is a vector of control
variables, γk is the industry fixed-effects.
All independent and control variables are measured as of January 1, 2010. The control
variable vector FirmCharacteristicsi includes the foreign-ownership percentage, realized leading
earnings growth, liquidity (measured by the ratio of average 30-day trading volume to total
outstanding shares), a dummy variable indicating whether the stock price is higher than the median
stock price, and the trailing twelve-month P/E ratio. Because foreign investors, mostly institutional
investors, often can significantly impact both share prices and the corporate-governance quality of
firms and because they may be more reluctant than Vietnamese investors to invest in poorly
governed firms, the model controls for the foreign-ownership percentage.
The model also controls for traditional explanations for stock splits. Thus, it includes a
firm’s realized leading earnings growth to account for the possibility that firms split stocks to signal
positive information to the market. Liquidity is included in the model to account for the possibility
that firms split stocks to increase their stocks’ trading liquidity. To account for the price-range effect,

24
we control for whether the firm’s stock price is higher/lower than the median stock price in the
market. P/E ratio, a popular valuation criterion in Vietnam’s stock market, is included in the model
to account for the possibility that high P/E stocks are considered expensive by the market.
If the more vulnerable firms are more likely to split their stocks, as Hypothesis 1 predicts, we
should expect the relationship with state-ownership percentage to be positive and significant, and
the relationship with firm size to be negative and significant.
[Table 3 about here]
Table 3 reports the results of the tests for Hypothesis 1. Columns (1) to (4) present the
specification in Model (1) that focuses on the simple relationship between stock splits and the two
main independent variables. The relationship with state ownership STATEi is positive and
significant consistently across all specifications. A state-owned firm is shown to be 10.6, 13.2, 14.8
and 13.7 percentage points (50% times the coefficients of the state-ownership percentage in
columns 2, 4, and 6) more likely to split its stock over the study periods than is a private firm.
Column (5) presents the test results for Hypothesis 1 using propensity score matching (PCA). The
treated firms are those which have one standard deviation higher than the average state ownership.
Each treated firms is matched with the nearest-neighbor firms in the same industry and date of
consideration based on foreign ownership percentage, the natural logarithm of market capitalization,
market to book ratio, and trailing P/E ratio. The PCA result shows that the propensity to split
stocks of treated firms is 9.4 percentage points higher than that of the matched firms. The
coefficient is significant at the 99% level. The results in this table are consistent with the prediction
of Hypothesis 1.
Putting the results together, we find that state ownership clearly makes it more likely a stock
will split, and that smaller firms are somewhat more likely to split than larger firms. These results

25
support Hypothesis 1, which posits a positive relationship between firm vulnerability and stock-
splitting frequency. However, the level of significance in both specifications is only at the 90% level.
Therefore, this provides only suggestive evidence for Hypothesis 1.
None of the control variables is statistically significant in explaining firms’ tendencies to split
their shares. The second model shows that a stock’s trading volume, realized leading earnings
growth, and price range do not have a statistically significant relationship with that firm’s tendency
to split its shares. This result suggests that liquidity improvement, information signaling, and price
range--the principal factors in established theories of stock splits--are not prime incentives for
Vietnamese firms to split their stocks. It also shows that neither foreign ownership nor its P/E ratio
affects a firm’s propensity to split its stock.
We vary the study window to check the robustness of our results. Columns 1 to 4 present
the results of the model where we use the study windows from January 1, 2009, through April 28,
2011, and from July 1, 2010, through April 28, 2011. Although longer study windows reduce the size
of our sample, the correlation between a firm’s state-ownership percentage and its propensity to split
stocks is consistently positive and significant in these alternative study windows (though only
borderline significant in column 6). The control variables are insignificant in explaining firms’
propensities to split stocks. These results provide moderate support for our hypothesis that the
vulnerability of a firm increases its likelihood of splitting its stock.
3.4. Testing for Hypothesis 2
Hypothesis 2 states that the vulnerability of a firm increases the abnormal return from its
stock split. We will test whether split stocks of vulnerable firms outperform split stocks of other
firms in the period after the split. If so, that would suggest some form of manipulation. To conduct
this test, we run the following regression:
CMARi, j, k, t = a1STATEi, t + a2SIZEi,t + β1 FirmCharacteristicsi,t

26
+ β2 SplitCharacteristicsj, t + γk, t + εi, j, k, t (2)
CMAR i, j, k, t is the cumulative market-adjusted return for firm i, split j, in industry k, and in
year t. As in Model (1), STATEi,t, state ownership percentage, and SIZEi,t, firm size, are two
explanatory variables in the models. We can vary this window to see if the results remain significant
for the four different windows (-30, -15), (-30, +0), (-30,+15), and (-30,+30). FirmCharacteristicsi,t is a
vector of control variables for firm characteristics. SplitCharacteristicsj, t is a vector of control variables
for split characteristics. γj, t is the industry-by-year fixed-effects.
Model 2 does not restrict the analysis to one period and, therefore, allows us to use all the
data sample of stock splits. However, we still cannot use either the very early or very late splits
because they lack the data necessary for our control variables. More specifically, splits conducted
toward the end of the study period do not have data for the realized leading earnings growth; splits
executed within one month after the stocks were listed do not provide data on trading liquidity. This
leaves us with 252 splits in the middle period, which provides sufficient observations for an effective
test.
The control variable vector FirmCharacteristicsi,t includes the foreign-ownership percentage,
liquidity, and trailing twelve-month P/E ratios. The control variable SplitCharacteristicsj,t is a vector
that includes the stock’s split factor, the elapsed time between the split’s announcement and its
execution, earnings growth in the one-year period after the split announcement, liquidity ratio
change post-split execution (measured by the ratio of post-split one-month share turnover to pre-
split one-month share turnover), return volatility change post-split execution (measured by the ratio of
post-split standard deviation of stock returns to pre-split standard deviation of stock returns), and a
binary variable indicating whether the firm’s stock price is higher than the median stock price of the
market.

27
Realized leading earnings growth, return volatility change post-split execution, liquidity ratio
change post-split execution, and the dummy indicating whether the stock price is higher than the
median stock price are included in the model to control, respectively, for the possibility of a
signaling effect, volatility effect, liquidity effect, or price-range effect of stock splits. After controlling
for these four factors, if the vulnerability of a firm truly increases the abnormal return from its stock
split, we should expect the coefficient for state-ownership percentage to be positive and significant,
and the coefficient for firm size to be negative and significant.
[Table 4 about here]
Table 4 reports the results of our regression model. Columns 1 to 4 present the results in
study windows (-30, -15), (-30, +0), (-30, +15), and (-30, +30). These results do not control for
realized leading earnings growth, return volatility change post-split execution, liquidity ratio change
post-split execution, and whether the stock price is higher than the median stock price.
The results indicate a positive relationship between state ownership and the cumulative
market-adjusted returns in all four study windows. The coefficients are statistically significant at the
95%, 99%, 99%, and 90% levels, respectively, in the four models. Switching from private to state
ownership increases short-term abnormal returns in the study periods (-30,-15), (-30, 0), (-30, +15)
and (-30, +30) by 3.6, 10.1, 13.3 and 9.8 percentage points (50% times the coefficients of the state-
ownership percentage), respectively. These results support the Hypothesis 2 proposition that stocks
of vulnerable firms tend to outperform those of other firms around split announcements.
Firm size also shows a significantly negative relationship with cumulative market-adjusted
returns in all four study periods. This relationship is also economically significant. When a firm’s
market capitalization doubles, short-term abnormal returns in the study periods (-30,-15), (-30, 0),

28
(-30, +15) and (-30, +30) decrease by 1.0, 3.7, 6.5, and 7.9 percentage points, respectively. This result
is also consistent with Hypothesis 2, which posits that smaller (and thus more vulnerable) firms
would offer higher cumulative market-adjusted returns than would larger firms.
Foreign ownership has a positive relationship with the cumulative market-adjusted returns in
all windows. A possible explanation for this result, if further substantiated, is that foreign ownership
of a firm reduces the supply of shares on the market, and thus makes it easier for the inside traders
to trade up the stocks in the period surrounding splits. Liquidity also has a significant positive
relationship with the firm’s cumulative market-adjusted returns in all windows. If the share turnover
increases by one percent, the cumulative returns increase by 4.9, 8.8, 10.1, and 9.1 percentage points
in the respective study windows. We had expected this result and believe that it reflects the large
number of noise traders--who often rely strongly on momentum--who increase both the returns
from and the trading volumes of split stocks. None of the other control variables, including split
factor, trailing P/E ratio, and split announcement-execution time gap, has a significant relationship
with the firm’s cumulative market-adjusted returns.
In Table 5, we re-estimate Model (2) in the same study windows, with the inclusion of four
control variables: realized leading earnings growth, return volatility change post-split execution,
liquidity ratio change post-split execution, and the split’s abnormal returns. Including the four
control variables affects neither the findings nor the significance levels of our analyses. The
coefficient on realized leading earnings growth is positive and statistically significant in the (-30,+15)
and (-30,+30) windows. This suggests that the signaling effect may be important. The coefficient on
liquidity ratio change post-split execution is negative and significant at the 95% and 90% levels in
the (-30,+15) and (-30,+30) windows. This result could not be explained by firms’ incentive to
increase stock liquidity by splitting stocks. This explanation awaits future research.

29
[Table 5 about here]
In Table 6, we use PCA to check the robustness of the results in Table 4 and Table 5. The
treated firms are those having one standard deviation higher than the average state ownership.
Matched firms are in the same industry and are the nearest-neighbors based on foreign ownership
percentage, the natural logarithm of market capitalization, market to book ratio, liquidity, and trailing
P/E ratio. The results in this analysis are consistent with those in Table 4 and Table 5. Compared
with matched firms, cumulative abnormal returns of treated firms in the study periods (-30,-15), (-
30, 0), (-30, +15) and (-30, +30) increase by 2.9, 5.4, 11.7, and 12.4 percentage points, respectively.
The coefficient is significant at the 90% and 95% levels.
These results in this part support for our hypothesis that vulnerable firms will have higher
abnormal returns around stock splits than non-vulnerable firms.
3.5. Testing for Hypothesis 3
Hypothesis 3 states that vulnerable firms will show a greater difference between pre- and
post-split returns than non-vulnerable firms. Our regression equation tests this relationship:
Dif i, j, k, t = a1STATEi, t + a2SIZEi,t + β1 FirmCharacteristicsi,t + β2 SplitCharacteristicsj, t + γk, t + εi, j, k, t (3)
Here the outcome variable is the difference between pre-announcement return and post-
announcement return. Dif i, j, k, t is computed using Formula (1), and serves as a proxy for the level of
illegal insider trading around each split because pre-split returns rise when knowledge about the split
is private; post-split, the information is obviously public. As with Hypothesis 2, we will use two
windows (-15, +15) and (-30, +30). If Hypothesis 3 is supported, the coefficient on STATEi, t will be
positive and significant, and the coefficient on SIZEi,t will be negative and significant.
[Table 7 about here]
30
Table 7 reports the results for this test. Columns 1 and 3 respectively show the results of our
regression model in two windows (-15, +15) and (-30, +30). Columns 2 and 4 present the regression
results, with controls for realized leading earnings growth, return volatility change post-split execution,
liquidity ratio change post-split execution, and whether the stock price is above the median stock
price. State-owned firms experience a greater difference between pre-split and post-split returns in
all windows. This difference is statistically significant at the 95% and 99% confidence levels in
windows (-15, +15) and (-30, +30). This relationship is also economically significant. Switching our
focus from private to state ownership increases this difference in periods (-15, +15) and (-30, +30)
by 15.3 and 21.7 percentage points (50% times the coefficients of the state-ownership percentage in
columns 2 and 4), respectively.
Smaller firms also exhibit a larger pre-post return difference, which is statistically significant
in all four windows, respectively at the 99% level. Firm size has an economically large effect on this
difference. Focusing on firms of doubled size decreases the pre-post return difference by 6.4 and
12.3 percentage points, respectively (columns 2 and 4). This result suggests that insider trading
related to stock splits is more effective in smaller firms. These results regarding state ownership and
firm size are predicted by Hypothesis 3.
Neither foreign-ownership percentage nor trailing P/E ratio has a significant effect on the
dependent variable in any of our models. Liquidity, however, helps to explain the pre- and post-
difference, reaching the 90% and 95% significance levels in three of the four specifications. The
relationship detected between liquidity and Dif i, j, k, t may provide some evidence that insider trading
activity is more profitable in the presence of noise traders. Bhattacharya and Daouk (2009) present a
related explanation for the presence of noise traders and insider-trading profits. They show that
inside traders can successfully execute their trades only if noise traders counter their trades and
provide liquidity to the market. Our results remain significant with the inclusion of control variables
31
for realized leading earnings growth, return volatility change post-split execution, liquidity ratio change
post-split execution, and whether the stock price is above the median stock price.
As in the previous section, we also use principal component analysis to test Hypothesis 3.
Table 8 presents the results of this analysis. Treated firms are those which have one standard
deviation higher than the average state ownership. Matched firms are chosen from the same industry
and are the nearest-neighbors based on foreign ownership percentage, the natural logarithm of
market capitalization, market to book ratio, liquidity, and trailing P/E ratio. Consistent with the
results in Table 7, the difference between pre-split and post-split returns of treated firms, estimated
by PCA method, is higher than that of the matched firms. In the window (-30, +30), the average Dif
of treated firms is 12.1 percentage points higher than that of matched firms. The estimated
coefficient is significant at the 95% level.
Overall, the results in this part are consistent with our hypotheses about illegal insider
trading incentive of stock splits among vulnerable firms in the Vietnamese stock market.
4. Alternative interpretations
When a stock-price increase precedes a corporate event, we should not immediately leap to
the conclusion of insider trading. Research by market participants might have uncovered conditions
that were likely to lead to the event, or information may merely have leaked into the market. For
example, if a merger is pending, information could leak if the two companies’ CEOs were observed
meeting together. These alternative explanations present a challenge to any study that infers, rather
than directly documents, insider trading. Concerns that market research or sleuthing is the
explanation for such anticipatory run-ups will be allayed if we focus on a corporate event that can
neither be researched by market participants nor inadvertently revealed. Stock splits would seem to
serve splendidly. They are overwhelmingly discretionary, and outsiders’ mere observations are not

32
likely to provide hints. Thus splits differ from most corporate events, such as mergers, which entail
big changes and high transactions costs, or dividend increases and stock repurchases, which require
dispersing cash. Market participants may predict the possibility that firms will split stocks in the
next year or two, but would not be able to predict the timing of split announcements with sufficient
precision to produce the run-ups in the brief windows that we observe. Therefore, market
participants can only take advantage of the coming split announcements if they either are insiders or
get tipped off by insiders.
A second possible interpretation of the relationship between a stock split and abnormal
returns would reverse the pattern of causality. The reverse causality problem would arise if a rapid
increase in its stock price would induce a firm to execute a stock split to bring the price back to the
preferred range. To test for the possible problem of reverse causality in our analysis, we developed a
panel regression model to assess the significance of the reverse causal direction in our data sample.
Our regression equation is as follows:
Spliti,k,t = a1 Returni,t + β1 FirmCharacteristicsi,t + γk + εi,k,t (4)
Here i and k index firm and industry. Spliti,k,t is a binary variable which turns from 0 to 1 if
firm i announces a split decision at the end of time period t, and Return is the stock price return in
the time period t. FirmCharacteristicsi,t is a vector of control variables for firm characteristics. γk is the
industry fixed-effects. The control variable vector FirmCharacteristicsi,t includes three control variables:
the probability that the stock price is higher than the market median, realized leading earnings
growth, and liquidity. These controls address the possibility that firms would announce stock splits
[in/on] the observed trading day to improve liquidity or to send positive signals to the market. If
stock price increases induce firms to split stocks, we would expect that the coefficient for Return
would be positive and statistically significant. Columns 1, 2, and 3 in Table 6 present the results for

33
the regressions on stock returns in 30, 20, and 10 days, respectively. The results in all these windows
clearly show that rapid price rises do not lead to stock-split announcements.
[Table 9 about here]
A third alternative explanation could challenge our argument that insider trading is a prime
promoter of stock splits. We have shown that, on the overall market level, stock splits do not
significantly increase trading liquidity or signal positive information about the firms. However, if it
were also shown that, in the subgroup of vulnerable firms, stock splits significantly enhance trading
liquidity or signal positive information, our argument would have to be qualified, since the splits may
have served these more traditional purposes. To address this potential problem, we employ two
tests. First, we test the effect on liquidity with the regression:
∆LIQUIDITYi,j,k,t = a1STATEi,t + a2SIZEi,t + β1FirmCharacteristicsi,t + β1SplitCharacteristicsj,t + γk + εi,k,t
(5)
∆LIQUIDITYi,j,k,t denotes the growth in the trading liquidity after split execution of firm i,
split j, in industry k, and in year t. ∆LIQUIDITYi,j,k,t is measured by the ratio of post-split one-month
share turnover to pre-split one-month share turnover. STATEi,t is the state-ownership percentage,
and SIZEi,t is the natural logarithm of the firm’s market capitalization. The control variable vector
FirmCharacteristicsi,t includes the trailing P/E ratio, whether the stock price is higher than the market
median, return volatility change post-split execution, and realized leading earnings growth. The
control variable vector SplitCharacteristicsj,t includes the split factor and the announcement-execution
time gap. γk is the industry fixed-effects. If vulnerable firms split stocks to improve their trading
liquidity, we should expect the coefficient for STATE (SIZE) to be positive (negative) and
statistically significant.

34
Our second test addresses the possibility that vulnerable firms may split stocks to signal
positive information to the market, as indicated by realized real earnings growth. The regression
equation for that test is:
Realized Leading Earnings Growthi = a1STATEi,t + a2SIZEi,t + β1FirmCharacteristicsi,t +
β1SplitCharacteristicsj,t + γk + εi,k,t (6)
Besides the change in the dependent variable, equation (6) replaces two control variables
from equation (5) (trailing P/E ratio and realized leading earnings growth) with two other control
variables (liquidity and liquidity ratio change post-split execution) in the firm-characteristics vector.
If vulnerable firms split stocks to signal positive information to the market, we would expect the
coefficient for STATE (SIZE) to be positive (negative) and statistically significant.
[Table 10 about here]
In Table 10, columns 1, 2, and 3 present the results for model (5), the regressions on the
state-ownership percentage and firm size, utilizing different control variables. None of the three
regressions shows any significant relationship between the state-ownership percentage or firm size
and the growth in liquidity after split executions. This helps to allay the concern that vulnerable
firms may split stocks to improve the trading liquidity of their stocks.
In Table 10, the right three columns (4, 5, and 6) test whether stock splits at vulnerable firms
signal private information. The regressions have the state-ownership percentage and firm size, along
with different control variables, as the independent variables. The dependent variable is each firm’s
realized leading earnings growth. The results of all three regressions show no significant relationship
between either state-ownership percentage or firm size and realized leading earnings growth. This
suggests that vulnerable firms are unlikely to split stocks to signal positive information to the
market.

35
A fourth alternative explanation focuses only on the post-split run up. It conjectures that
the presence of irrational investors, rather than insider trading, drives the run-ups of stock prices
after stock-split announcements at vulnerable firms. In our analysis, we cannot rule out the
possibility that vulnerable firms, which usually have high-volatility stock returns, might differentially
attract irrational investors. However, the presence of irrational investors could hardly explain why
vulnerable firms have much greater pre-announcement returns than more secure firms. If irrational
investors were playing a role, it would only be to increase the size and/or duration of the stock
bubbles after split announcements.
The evidence rules out each of the four alternative explanations from prior literature for the
stock splits we observe. However, the evidence is strongly consistent with insider trading as a prime
promoter of stock splits in our sample.
5. Conclusion
Stock splits are a widely observed phenomenon in stock markets, particularly in emerging
ones. The motivations for splits in emerging markets are often unclear. The conditions in those
markets differ so markedly from those in developed nations’ markets that non-traditional
motivations should be considered. This analysis addresses the hypothesis that, in Vietnam, insiders
use stock splits to generate personal profits. Vietnam is a nation that shows evidence of substantial
insider trading, yet where that illegal activity has been subject to little prosecution.
We use the sample of all 718 stock splits by firms in the Vietnamese stock market during a
recent period. The pattern of stock run-ups prior to a split, followed by gains after the split
announcement, and then a return to the stock price’s initial level raises suspicions that splits are
manipulated activities. This suspicion is reinforce given heightened trading activity prior to a split
announcement. Moreover, firms that would be more vulnerable to insider trading undertake many

36
more splits. Finally, the principal alternative explanations for splits—as a search for liquidity or as a
signal of positive news--find no support.
We focus on the split patterns by firms vulnerable to insider activity. These are firms with
some combination of large state ownership and small market capitalization. We find that vulnerable
firms split stocks much more frequently, and that those splits yield higher abnormal returns both
before and after the split announcement than do splits in less vulnerable firms. Substantial price
increases before split announcements are a strong indicator of insider trading. Interestingly, and
suspiciously, though prices rise significantly before and after a split announcement, in the long run
prices revert to their original levels. This suggests that stock splits in Vietnam’s markets yield no
lasting value. It simultaneously argues against the liquidity or signaling explanations.
The limitations of our study should be noted. First, Vietnam has a very young, emerging
stock market, which caters overwhelmingly to individual investors and is regulated in a lax manner
by an inexperienced authority. Hence, our findings may apply in only limited fashion or not at all to
developed markets, where regulation is generally much more rigorous. However, our findings may
be applicable to many other emerging stock markets, such as those in China.17 Second, we did not
have access to transaction data for individual traders. Thus, we had to follow the approach of most
studies on stock markets in general and on insider trading in particular: we used price data to infer
the behaviors of traders. Third, we did not have a randomized or natural experiment to estimate
effects precisely. Fortunately, we were able to control for important factors that might affect the
results. We were also able to show that reverse causality is an unlikely explanation in this case.
17 Compustat Global records over 2,200 splits executed by Chinese firms in the period 2005-2013.

37
This study identified a troubling pattern for stock price movements surrounding stock splits
in Vietnam. The 30-day period before the announcement is often marked by a sharp rise in price,
with the rise persisting for roughly 50 days after the announcement. The stock price then drifts
down; 140 days after the announcement, it has fallen back to its level at the announcement. None
of the traditional explanations for stock splits, built on experience from developed nations, could
explain this pattern. However, it is precisely the pattern that insider purchasing, followed by
manipulation schemes to bolster the stock price, would produce. The enhance volume of trading
just before the split announcement reinforces the insider trading explanation.
Our analysis moved beyond merely looking at stock price movements to identify firms that
would be particularly vulnerable to insider trading schemes. That work showed a clear link between
a firm’s vulnerability to insider trading and its propensity to split its stock. It also provided an
explanation for the widespread use of stock splits in emerging markets. Insider trading will always be
with us, particularly in emerging markets, and is sure to be difficult to detect. But understanding the
stratagems likely to be used by insiders--in this instance splitting stocks--can help to expose their
activities.

38
References
Aharony, Joseph, Chi-Wen Jevons Lee, and T. J. Wong (2000). “Financial Packaging
of IPO Firms in China.” Journal of Accounting Research, Vol. 38, No. 1, p. 103-
126.
Amihud, Yakov, Haim Mendelson, and Jun Uno (1999). “Number of Shareholders
and Stock Prices: Evidence from Japan.” Journal of Finance, Vol. 54, No. 3, p.
1169-1184.
Baker, Malcolm, Robin Greenwood, and Jeffrey Wurgler (2009). “Catering through
Nominal Share Prices.” Journal of Finance, Vol. 64, No. 6, p. 2559–2590.
Barker, Austin. (1956) “Effective Stock Splits.” Harvard Business Review, Vol. 34, p.
101-106.
Bertrand, Marianne, and Sendhil Mullainathan (2001). “Are CEOs Rewarded for
Luck? The Ones Without Principals Are.” Quarterly Journal of Economics, Vol.
116, No. 3, p. 901-932.
Bhattacharya, Utpal, and Hazem Daouk (2002). “The World Price of Insider
Trading.” Journal of Finance, Vol. 57, No. 1, p. 75-108.
Bhattacharya, Utpal, and Hazem Daouk (2009). “When No Law is Better Than a
Good Law.” Review of Finance, Vol. 13, No. 4, p. 577-627.
Bhattacharya, Utpal, Hazem Daouk, Brian Jorgenson, and Carl-Heinrich Kehr
(2000). “When an Event is Not an Event: The Curious Case of an Emerging
Market.” Journal of Financial Economics, Vol. 55, No. 1, p. 69-101.
Black, Bernard S., Hasung Jang, and Woochan Kim (2006). “Predicting Firms'
Corporate Governance Choices: Evidence from Korea.” Journal of Corporate
Finance, Vol. 12, No. 3, p. 660–691.
Boubakri, Narjess, Jean-Claude Cosset, and Omrane Guedhami (2005).
“Postprivatization Corporate Governance: The Role of Ownership Structure
and Investor Protection.” Journal of Financial Economics, Vol. 76, No. 2, p. 369-
399.
Brennan, Michael J., and Thomas E. Copeland (1988). “Stock Splits, Stock Prices,
and Transaction Costs.” Journal of Financial Economics, Vol. 22, No. 1, p. 83-
101.
Brown, Stephen J., and Jerold B. Warner (1980). “Measuring Security Price
Performance.” Journal of Financial Economics, Vol. 8, No. 3, p. 205–258.
Brown, Stephen J., and Jerold B. Warner (1985). “Using Daily Stock Returns: The
Case of Event Studies.” Journal of Financial Economics, Vol. 14, No. 1, p. 3-31.

39
Bushman, Robert M., Joseph D. Piotroski, and Abbie J. Smith (2004). “What
Determines Corporate Transparency?” Journal of Accounting Research, Vol. 42,
No. 2, p. 207-252.
Byun, Jinho, and Michael S. Rozeff (2003). “Long-run Performance after Stock
Splits: 1927 to 1996.” Journal of Finance, Vol. 58, No. 3, p. 1063-1086.
Capon, Andrew, Federico Lupo Pasini, Duong Thi Phuong, Nguyen Thi Thuc Anh,
and Nguyen Van Chi (2011). “Securities Market Liberalization in Vietnam -
Key Issues For Securities Regulator and the Domestic Securities
Companies.” EU-Vietnam Mutrap III, 2011.
Charitou, Andreas, Nikos Vafeas, and Charis Zachariades (2005). “Irrational Investor
Response to Stock Splits in an Emerging Market.” International Journal of
Accounting, Vol. 40, No. 2, p. 133–149.
Cheng, Shijun, Venky Nagar, and Madhav V. Rajan (2007). “Insider Trades and
Private Information: The Special Case of Delayed-Disclosure Trades.” Review
of Financial Studies, Vol. 20. , No. 6, p. 1833-1864.
Copeland, Thomas E. (1979). “Liquidity Changes Following Stock Splits.” Journal of
Finance, Vol. 34, No. 1, p. 115-141.
De Bondt, Werner F. M., and Richard Thaler (1985). “Does the Stock Market
Overreact?” Journal of Finance, Vol. 40, No. 3, p. 793-805.
Desai, Amand, M. Nimalendran, and S. Venkataraman (1998). “Changes in Trading
Activity Following Stock Splits and their Effect on Volatility and the
Adverse-Information Component of the Bid-Ask Spread.” Journal of Financial
and Quantitative Analysis, Vol. 21, p. 159-183.
Devos, Erik, William B. Elliott, and Richard S. Warr (2010). “The Role of CEO
Compensation in Stock Splits.” Working Paper. November 2010.
Diamond, Douglas W., and Robert E. Verrecchia (1991). “Disclosure, Liquidity, and
the Cost of Capital.” Journal of Finance, Vol. 46, No. 4, p. 1325-1359.
Dolley, James C. (1933). “Common Stock Split-Ups, Motives and Effects.” Harvard
Business Review, Vol. 12, p. 70–81.
Easley, David, Maureen O’Hara, and Gideon Saar (2001). “How Stock Splits Affect
Trading: A Microstructure Approach.” Journal of Financial and Quantitative
Analysis, Vol. 36, No. 1, p. 25-51.
Fama, Eugene F., Lawrence Fisher, Michael C. Jensen, and Richard Roll (1969).
“The Adjustment of Stock Prices to New Information.” International Economic
Review, Vol. 10, February 1969.

40
Francis, Bill B., Hasan, Iftekhar, and Sun, Xian (2009) “Political connections and the
process of going public: Evidence from China.” Journal of International Money
and Finance, Vol. 28, No. 4, p. 696-719.
Ha, Oanh (2010). “Vietnam Arrests Pharmaceuticals Executive In First Securities-
Fraud Case.” Bloomberg News, November 30, 2010.
Han, Ki C., and David Y. Suk (1998). “Insider Ownership and Signals: Evidence
from Stock Split Announcement Effects.” Financial Review, Vol. 33, No. 2, p.
1-18.
Hausman, Warren H., R. R. West, and J. A. Largay (1971). “Stock Splits, Price
Changes, and Trading Profits: A Synthesis.” Journal of Business, Vol. 44, No.1,
p. 69-77.
Ikenberry, David L., Graeme Rankine, and Earl K. Stice (1996). “What Do Stock
Splits Really Signal?” Journal of Financial and Quantitative Analysis, Vol. 31, No.
3, p. 357-375.
Jeng, Leslie A., Andrew Metrick, and Richard Zeckhauser (2003). “Estimating the
Returns to Insider Trading: A Performance-Evaluation Perspective.” Review of
Economics and Statistics, Vol. 85, No. 2, p. 453-471.
Lakonishok, Josef, and Inmoo Lee (2001). “Are Insider Trades Informative?” Review
of Financial Studies, Vol. 14, No. 1, p. 79-111.
Lamoureux, Christopher G., and Percy Poon (1987). “The Market Reaction to Stock
Splits.” Journal of Finance, Vol. 42, No. 5, p. 1347-1370.
Lin, Ji-Chai, Ajai K. Singh, and Wen Yu (2009). “Stock Splits, Trading Continuity,
and the Cost of Equity Capital.” Journal of Financial Economics, Vol. 93, No. 3,
p. 474-498.
Linh, Hai (2011A). “Ernst & Young Vietnam Role to be Examined.” Vietnam
Investment Review, September 14, 2011.
Linh, Hai (2011B). “SSC Slaps Record Fine on Traders.” Vietnam Investment Review,
November 15, 2011.
Ma, Ming, Xian Sun, Maya Waisman, and Yan Zhu (2016) “State ownership and
market liberalization: evidence from china's domestic M&A market” Journal of
International Money and Finance, Forthcoming.
Ma, Yulong, Huey-Lian Sun, and Jasmine Yur-Austin (2000). “Insider Trading
Around Stock Split Announcements.” Journal of Applied Business Research, Vol.
16, No. 3, p. 13-25.
Meulbroek, Lisa K. (1992). “An Empirical Analysis of Illegal Insider Trading.”
Journal of Finance, Vol. 47, No. 5, p. 1661-1699.

41
Muscarella, Chris J., and Michael R. Vetsuypens (1996). “Stock Splits: Signaling or
Liquidity? The Case of ADR ‘Solo-splits’.” Journal of Financial Economics, Vol.
42, No. 1, p. 3-26.
My, Tran Ngo, and Huy Huynh Truong (2011). “Herding Behavior in an Emerging
Stock Market: Empirical Evidence from Vietnam.” Research Journal of Business
Management , Vol. 5, No. 2, p. 51-76.
Olmo, Jose, Keith Pilbeam, and William Pouliot (2011). “Detecting the Presence of
Insider Trading Via Structural Break Tests.” Journal of Banking & Finance, Vol.
35, No. 11, p. 2820–2828.
Qian, Yingyi (1996). “Enterprise Reform in China: Agency Problems and Political
Control.” Economics of Transition, Vol. 4, No. 2, p. 427-447.
Saigon Tiep Thi (2010). “Stock Market: Are There Any Opportunities for Long
Term Investments?” Vietnamnet. November 22, 2010.
Shleifer, Andrei, and Robert W. Vishny (1997). “A Survey of Corporate
Governance.” Journal of Finance, Vol. 52, No. 2, p. 737-783.
Son, Thai (2010). “Vietnam's Stock Tycoon in Dock for Price Manipulation.” Thanh
Nien News, June 30, 2011.
Thanh Nien (2010). “Vietnam Securities Watchdog to Seize Stock Fraud Profits.”
Thanh Nien News, April 23, 2010.
Wang, Qian, T.J. Wong, and Lijun Xia (2008). “State Ownership, the Institutional
Environment, and Auditor Choice: Evidence from China.” Journal of
Accounting and Economics,- Vol. 46, No. 1, p. 112-134.
World Bank (2006) “Vietnam - Report on the Observance of Standards and Codes (ROSC) : corporate governance country assessment.”

−.0
50
.05
.1.1
5.2
.25
.3C
umm
ulat
ive
Mar
ket−
Adj
uste
d R
etur
ns
−30
−20
−10 0 10 20 30 40 50 70 80 90 10
011
012
013
014
015
016
017
018
019
020
021
022
023
060
Day
Figure 1: Average Cumulative Market-Adjusted Returns around Split AnnouncementsThis �gure shows graphically the average cumulative market-adjusted returns and the 95 percent con-�dence interval in the period (-30, +240). The benchmark day is day -30, the thirty trading days be-fore stock-split announcements. The cumulative market-adjusted returns for each stock-split announce-ment are calculated by accumulating daily market-adjusted returns from day -30. The average cumulativemarket-adjusted returns are calculated by averaging each split?s cumulative market-adjusted return onthe corresponding trading day.
.
42

0.0
02.0
04.0
06.0
08O
usta
ndin
g S
hare
Tur
nove
r
−30 −20 −10 0 10 20 30Day
Figure 2: Average Outstanding Share Turnover around Split AnnouncementsThis �gure shows the average outstanding share turnover and the 95 percent con�dence interval in theperiod (-30, +30). The outstanding share turnover is de�ned as the ratio of daily trading volume to totaloutstanding shares.
.
43

Table 1: Descriptive StatisticsThis table reports the means, the 25th, 50th and 75th percentiles, and sample sizes of all variablesused in this research. The data sample includes all 718 stock splits in the period from Jan 2007 toMay 2011. Ownership data is reported daily by the State Securities Commission. Data about splitfactors and split announcement and execution time gap is collected from companies? �lings byStockPlus Corporation. Market capitalization, realized leading earnings growth, and traling P/Eratio are calculated according to the standard methods suggested by the CFA Institute. Liquidityis measured by the ratio of average 30-day trading volume to total outstanding shares. Liquidityratio change post-split execution is measured by the ratio of post-split one-month share turnoverto pre-split one-month share turnover. Return volatility change post-split execution is measuredby the ratio of post-split standard deviation of stock returns to pre-split standard deviation ofstock returns. We include a dummy variable which is equal to one when the stock price is higherthan the median stock price. Dif(-j, +j), the di�erence between pre-announcement return andpost-announcement return, is calculated by using Formula 1. CMAR (x, y) is the cumulativemarket-adjusted returns from day x to day y.
Mean 25thpercentile
50thpercentile
75thpercentile
State ownership percentage 23.22% 0.00% 16.96% 47.56%Market Capitalization VND1,890 bn. VND121 bn. VND328 bn. VND964 bn.Foreign ownership percentage 11.59% 0.92% 4.76% 18.54%Split factor 1.44 1.01 1.27 2.31Liquidity 0.82% 0.17% 0.42% 1.05%
Split announcement 57.26 days 8.00 days 7.00 days 66.00 daysand execution time gap
Trailing P/E ratio (day -30) 17.7 5.02 8.15 14.32Realized leading earnings growth -1.18% -27.41% 0.32% 10.73%
Liquidity ratio change 1.54 0.38 0.81 1.46post-split execution
Return volatility change 9.85% -13.67% 3.62% 25.53%post-split execution
Stock price is higher than 0.69 0 1 1the market median stock price
Dif(-15, +15) 9.10% -8.31% 1.57% 12.99%Dif(-30, +30) 10.88% -10.91% 0.30% 19.46%CMAR(-30, 0) 8.60% -6.71% 1.88% 16.84%CMAR(-30, -15) 2.40% -6.32% -0.34% 8.18%CMAR(-30, +15) 11.14% -9.51% 0.66% 16.95%CMAR(-30, +30) 9.85% -11.50% 0.08% 18.58%
44

Table 2: Cumulative Market-Adjusted Return (CMAR) and Pre-Post AnnouncementReturn Di�erence(A) presents the means of the cumulative market-adjusted returns (CMAR) for the study peri-ods. The third and the fourth columns show respectively the results of a parametric t-test and anon-parametric Wilcoxon test across �rms. The last column shows the number of events thatare used in each case. Panel (B) presents the average di�erence between pre-announcementreturn and post-announcement return. Formula 1 presents the detailed calculation for the pre-announcement and post-announcement return di�erence. The third and the fourth columnsshow respectively a parametric t-test and a non-parametric Wilcoxon test across �rms. Thelast column shows the number of events in each period. * p<0.10, ** p<0.05, *** p<.01
Period AverageCMAR(t1,t2)
t-teststatistic
Wilcoxontest statistic # splits
Panel (A) Cumulative Market-Adjusted Return around Split Announcement
CMAR(t -30,t -15) 0.0231 3.95*** 1.17 670CMAR(t -30,t + 0) 0.0927 8.34*** 6.56*** 681CMAR(t -30,t +30) 0.128 7.16*** 5.45*** 650CMAR(t -30,t +60) 0.1502 7.42*** 5.72*** 620CMAR(t -30,t +120) 0.1265 6.15*** 3.37*** 538CMAR(t -30,t +210) 0.0113 0.51 -3.87 425CMAR(t -30,t +240) 0.0087 0.25 -4.36 364
Panel (B) Di�erence between Pre- and Post- Announcement Returns
Dif (t - 15, t + 15) 0.1008 7.36*** 5.15*** 681Dif (t - 30, t + 30) 0.1303 7.28*** 4.73*** 675
45

Table 3: Propensity to Split Stocks as a Function of Firm VulnerabilityThis table reports the results of linear probability models, columns (1) to (4), and propensity scorematching (PCA), column (5), examining the impact of �rm vulnerability on �rms’ propensity to splitstocks. The dependent variable in these models is a binary variable which turns from 0 to 1 if the �rmconducted at least one stock split with a split factor of over 1.3 during the study periods, all endingon April 28, 2011. In columns (1) to (4), the independent variables are the state ownership percentage,foreign ownership percentage, the natural logarithm of market capitalization, market to book ratio,and trailing P/E ratio. In column (5), The treated group, including �rms have one standard deviationhigher than the average state ownership, are matched with the nearest-neighbor �rms based on foreignownership percentage, the natural logarithm of market capitalization, market to book ratio, and trailingP/E ratio. Standard errors are clustered at the industry level and in parentheses. * p<0.10, ** p<0.05, ***p<.01
Jan 2009 Jul 2009 Jan 2010 Jul 2010 PCA
(1) (2) (3) (4) (5)
State-ownership percentage 0.212∗∗ 0.264∗∗∗ 0.295∗∗∗ 0.273∗∗∗(0.081) (0.092) (0.079) (0.072)
Treated 0.094∗∗∗(0.023)
Foreign-ownership percentage -0.107 -0.036 -0.189 0.004(0.191) (0.184) (0.218) (0.202)
Log of market capitalization -0.026 -0.033∗ -0.022 -0.019(0.019) (0.018) (0.017) (0.017)
Market to Book 0.007 0.001 -0.027 -0.034(0.009) (0.010) (0.023) (0.023)
Liquidity -5.390 -0.840 -2.846 0.723(10.659) (3.184) (2.078) (3.874)
Trailing P/E ratio -0.081 -0.031 0.157∗∗ -0.093(0.155) (0.019) (0.060) (0.277)
Industry Fixed-E�ects Yes Yes Yes Yes YesSame Date YesNumber of Observations 311 347 411 416 989Adj. R-Square -0.010 0.007 0.043 0.016 0.016
46

Table 4: Abnormal Returns Surrounding Splits as a Function of Firm VulnerabilityThe dependent variable in these models is the cumulative market-adjusted returns in the study periods.The date of split announcements is denoted date 0. The independent variables are the state-ownershippercentage and the natural logarithm of market capitalization on the �rst day of the study periods.Control variables are foreign-ownership percentage, leading earnings growth, liquidity, trailing P/Eratio, split factor, split announcement and execution time gap, realized leading earnings growth, theliquidity ratio change post-split execution, the change in stock return volatility post stock splits, andthe dummy variable indicating whether the stock price is higher than the median stock price. Standarderrors are clustered by industries and in parentheses. * p<0.10, ** p<0.05, *** p<.01 .
(1) (2) (3) (4)CAR
t-30,t-15CAR
t-30,t-0CAR
t-30,t+15CAR
t-30,t+30
State-ownership percentage 0.072∗∗ 0.201∗∗∗ 0.265∗∗∗ 0.196∗(0.032) (0.058) (0.082) (0.108)
Foreign-ownership percentage 0.120∗∗ 0.386∗∗∗ 0.241∗ 0.088(0.055) (0.109) (0.130) (0.151)
Log of market capitalization -0.010∗∗ -0.037∗∗∗ -0.065∗∗∗ -0.079∗∗∗(0.005) (0.009) (0.017) (0.017)
Liquidity 4.930∗∗∗ 8.795∗∗∗ 10.117∗∗∗ 9.063∗∗(0.783) (1.500) (3.137) (3.686)
Trailing P/E ratio -0.129∗ -0.143∗ -0.184 -0.195(0.069) (0.071) (0.117) (0.139)
Split Factor -0.011 -0.018 -0.038 -0.044(0.015) (0.022) (0.043) (0.042)
Split announcement and 0.000 -0.000 -0.001∗∗∗ -0.001∗∗execution time gap (0.000) (0.000) (0.000) (0.000)
Industry-Year Fixed-E�ects Yes Yes Yes YesNumber of Splits 555 556 553 545Adj. R-Square 0.130 0.195 0.056 0.063
47
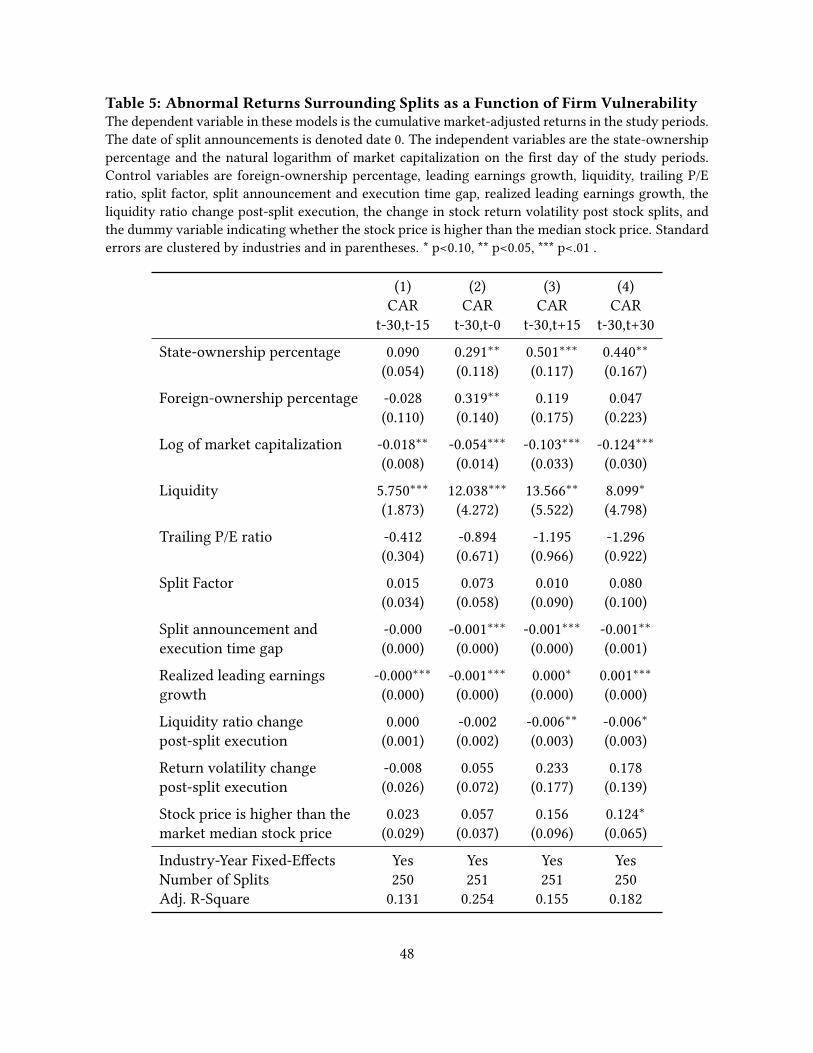
Table 5: Abnormal Returns Surrounding Splits as a Function of Firm VulnerabilityThe dependent variable in these models is the cumulative market-adjusted returns in the study periods.The date of split announcements is denoted date 0. The independent variables are the state-ownershippercentage and the natural logarithm of market capitalization on the �rst day of the study periods.Control variables are foreign-ownership percentage, leading earnings growth, liquidity, trailing P/Eratio, split factor, split announcement and execution time gap, realized leading earnings growth, theliquidity ratio change post-split execution, the change in stock return volatility post stock splits, andthe dummy variable indicating whether the stock price is higher than the median stock price. Standarderrors are clustered by industries and in parentheses. * p<0.10, ** p<0.05, *** p<.01 .
(1) (2) (3) (4)CAR
t-30,t-15CAR
t-30,t-0CAR
t-30,t+15CAR
t-30,t+30
State-ownership percentage 0.090 0.291∗∗ 0.501∗∗∗ 0.440∗∗(0.054) (0.118) (0.117) (0.167)
Foreign-ownership percentage -0.028 0.319∗∗ 0.119 0.047(0.110) (0.140) (0.175) (0.223)
Log of market capitalization -0.018∗∗ -0.054∗∗∗ -0.103∗∗∗ -0.124∗∗∗(0.008) (0.014) (0.033) (0.030)
Liquidity 5.750∗∗∗ 12.038∗∗∗ 13.566∗∗ 8.099∗(1.873) (4.272) (5.522) (4.798)
Trailing P/E ratio -0.412 -0.894 -1.195 -1.296(0.304) (0.671) (0.966) (0.922)
Split Factor 0.015 0.073 0.010 0.080(0.034) (0.058) (0.090) (0.100)
Split announcement and -0.000 -0.001∗∗∗ -0.001∗∗∗ -0.001∗∗execution time gap (0.000) (0.000) (0.000) (0.001)
Realized leading earnings -0.000∗∗∗ -0.001∗∗∗ 0.000∗ 0.001∗∗∗growth (0.000) (0.000) (0.000) (0.000)
Liquidity ratio change 0.000 -0.002 -0.006∗∗ -0.006∗post-split execution (0.001) (0.002) (0.003) (0.003)
Return volatility change -0.008 0.055 0.233 0.178post-split execution (0.026) (0.072) (0.177) (0.139)
Stock price is higher than the 0.023 0.057 0.156 0.124∗market median stock price (0.029) (0.037) (0.096) (0.065)
Industry-Year Fixed-E�ects Yes Yes Yes YesNumber of Splits 250 251 251 250Adj. R-Square 0.131 0.254 0.155 0.182
48

Table 6: Abnormal Returns Surrounding Splits as a Function of Firm Vulnerability -Propensity Score MatchingThis table reports the results of propensity score matching analysis estimating the impact of �rm vul-nerability on stock split announcement returns. The treated group includes �rms which have one stan-dard deviation higher than the average state ownership. Control �rms are �rms in the same industryand are the nearest-neighbors based on foreign ownership percentage, the natural logarithm of marketcapitalization, market to book ratio, liquidity, and trailing P/E ratio. T-statistics are in parentheses. *p<0.10, ** p<0.05, *** p<.01
(1) (2) (3) (4)CAR
t-30,t-15CAR
t-30,t-0CAR
t-30,t+15CAR
t-30,t+30
Treated 0.029∗ 0.054∗ 0.117∗∗ 0.124∗∗(1.907) (1.736) (2.113) (2.316)
Number of Splits 295 297 296 295Adj. R-Square 0.009 0.007 0.012 0.015
49
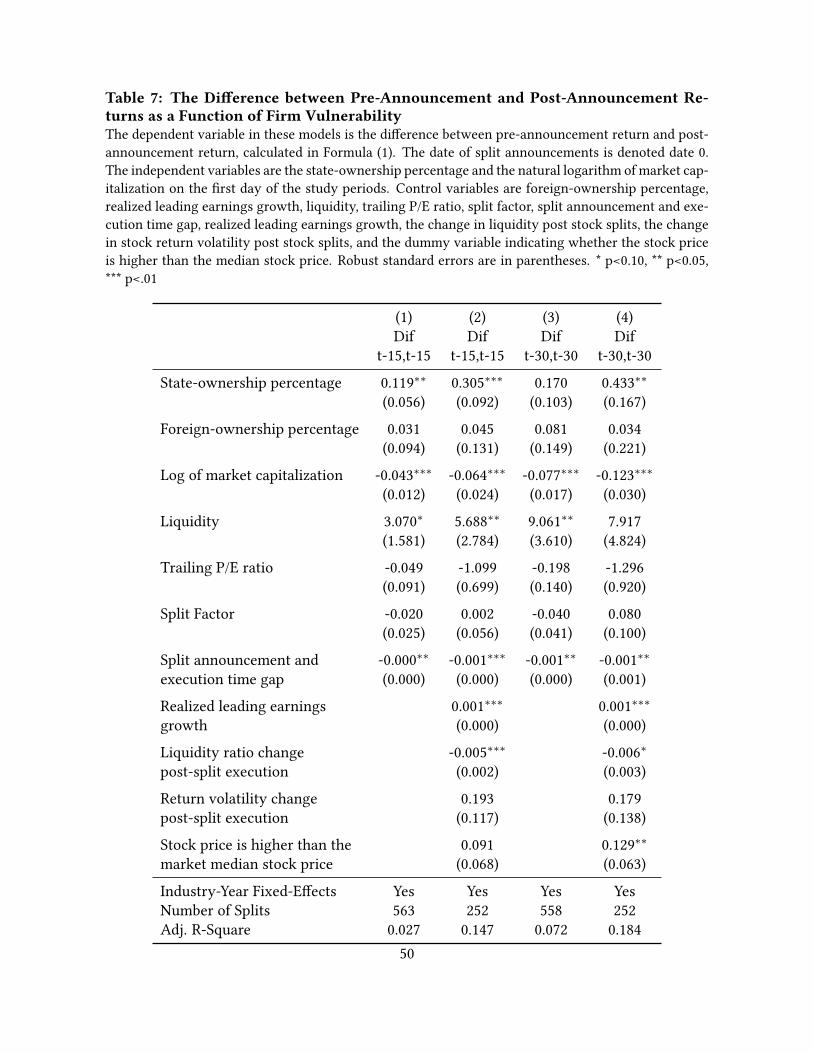
Table 7: The Di�erence between Pre-Announcement and Post-Announcement Re-turns as a Function of Firm VulnerabilityThe dependent variable in these models is the di�erence between pre-announcement return and post-announcement return, calculated in Formula (1). The date of split announcements is denoted date 0.The independent variables are the state-ownership percentage and the natural logarithm of market cap-italization on the �rst day of the study periods. Control variables are foreign-ownership percentage,realized leading earnings growth, liquidity, trailing P/E ratio, split factor, split announcement and exe-cution time gap, realized leading earnings growth, the change in liquidity post stock splits, the changein stock return volatility post stock splits, and the dummy variable indicating whether the stock priceis higher than the median stock price. Robust standard errors are in parentheses. * p<0.10, ** p<0.05,*** p<.01
(1) (2) (3) (4)Dif
t-15,t-15Dif
t-15,t-15Dif
t-30,t-30Dif
t-30,t-30
State-ownership percentage 0.119∗∗ 0.305∗∗∗ 0.170 0.433∗∗(0.056) (0.092) (0.103) (0.167)
Foreign-ownership percentage 0.031 0.045 0.081 0.034(0.094) (0.131) (0.149) (0.221)
Log of market capitalization -0.043∗∗∗ -0.064∗∗∗ -0.077∗∗∗ -0.123∗∗∗(0.012) (0.024) (0.017) (0.030)
Liquidity 3.070∗ 5.688∗∗ 9.061∗∗ 7.917(1.581) (2.784) (3.610) (4.824)
Trailing P/E ratio -0.049 -1.099 -0.198 -1.296(0.091) (0.699) (0.140) (0.920)
Split Factor -0.020 0.002 -0.040 0.080(0.025) (0.056) (0.041) (0.100)
Split announcement and -0.000∗∗ -0.001∗∗∗ -0.001∗∗ -0.001∗∗execution time gap (0.000) (0.000) (0.000) (0.001)
Realized leading earnings 0.001∗∗∗ 0.001∗∗∗growth (0.000) (0.000)
Liquidity ratio change -0.005∗∗∗ -0.006∗post-split execution (0.002) (0.003)
Return volatility change 0.193 0.179post-split execution (0.117) (0.138)
Stock price is higher than the 0.091 0.129∗∗market median stock price (0.068) (0.063)
Industry-Year Fixed-E�ects Yes Yes Yes YesNumber of Splits 563 252 558 252Adj. R-Square 0.027 0.147 0.072 0.184
50

Table 8: Abnormal Returns Surrounding Splits - Propensity Score MatchingThis table reports the results of propensity score matching analysis estimating the impact of �rm vul-nerability onthe di�erence between pre-announcement return and post-announcement return. Thedependent variable in these models is the di�erence between pre-announcement return and post-announcement return, calculated in Formula (1). The treated group includes �rms which have onestandard deviation higher than the average state ownership. Control �rms are the nearest-neighborsbased on foreign ownership percentage, the natural logarithm of market capitalization, market to bookratio, liquidity, and trailing P/E ratio. T-statistics are in parentheses. * p<0.10, ** p<0.05, *** p<.01
(1) (2)Dif
t-15,t-15Dif
t-30,t-30
Treated 0.064 0.121∗∗(1.609) (2.298)
Number of Splits 303 299Adj. R-Square 0.005 0.014
51
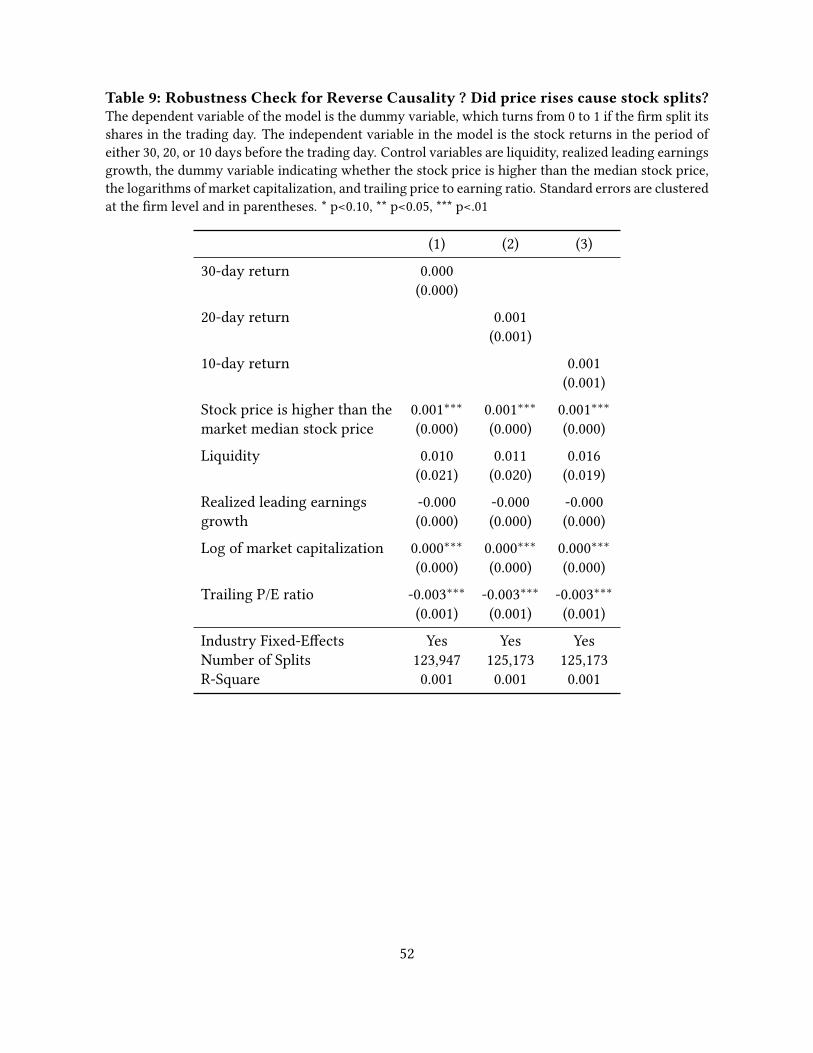
Table 9: Robustness Check for Reverse Causality ? Did price rises cause stock splits?The dependent variable of the model is the dummy variable, which turns from 0 to 1 if the �rm split itsshares in the trading day. The independent variable in the model is the stock returns in the period ofeither 30, 20, or 10 days before the trading day. Control variables are liquidity, realized leading earningsgrowth, the dummy variable indicating whether the stock price is higher than the median stock price,the logarithms of market capitalization, and trailing price to earning ratio. Standard errors are clusteredat the �rm level and in parentheses. * p<0.10, ** p<0.05, *** p<.01
(1) (2) (3)
30-day return 0.000(0.000)
20-day return 0.001(0.001)
10-day return 0.001(0.001)
Stock price is higher than the 0.001∗∗∗ 0.001∗∗∗ 0.001∗∗∗market median stock price (0.000) (0.000) (0.000)
Liquidity 0.010 0.011 0.016(0.021) (0.020) (0.019)
Realized leading earnings -0.000 -0.000 -0.000growth (0.000) (0.000) (0.000)
Log of market capitalization 0.000∗∗∗ 0.000∗∗∗ 0.000∗∗∗(0.000) (0.000) (0.000)
Trailing P/E ratio -0.003∗∗∗ -0.003∗∗∗ -0.003∗∗∗(0.001) (0.001) (0.001)
Industry Fixed-E�ects Yes Yes YesNumber of Splits 123,947 125,173 125,173R-Square 0.001 0.001 0.001
52

Table 10: Robustness Check for the Liquidity and Signaling Incentives for Stock SplitsThe dependent variable in models (1), (2), and (3) is the growth in the trading liquidity after split executions.The dependent variable in models (4, (5), and (6) is the �rm?s realized leading earnings growth. Columns1, 2, and 3 present the regressions of model (5), the estimation of the relationship between the post-splittrading-liquidity growth and �rm vulnerability. Columns 4, 5, and 6 present the regressions of model (6),the estimation of the relationship between �rms’ realized leading earnings growth and their vulnerability.Standard errors are clustered at the �rm level and in parentheses. * p<0.10, ** p<0.05, *** p<.01
(1) (2) (3) (4) (5) (6)
State-ownership percentage 0.488 0.074 -0.810 -0.075 -0.091 -0.177(0.668) (0.651) (2.263) (0.078) (0.096) (0.188)
Foreign-ownership percentage 1.660 1.240 0.125 -0.058 -0.061 -0.140(1.272) (1.399) (1.816) (0.049) (0.057) (0.149)
Log of market capitalization -0.086 -0.104 0.134 0.020 0.019 0.020(0.173) (0.197) (0.422) (0.019) (0.019) (0.022)
Split Factor 0.137 0.278 0.026 0.028(0.226) (0.365) (0.027) (0.030)
Split announcement and -0.001 -0.000 0.000 0.000execution time gap (0.001) (0.003) (0.000) (0.000)
Liquidity -54.971∗∗∗ -100.482∗∗∗ -1.247 -1.416(12.460) (31.853) (1.350) (1.407)
Trailing P/E ratio -0.396 2.039 0.103∗ 0.144(3.100) (13.195) (0.057) (0.335)
Stock price is higher than the -0.135 0.068market median stock price (0.475) (0.066)
Return volatility change 1.263∗∗ 0.058post-split execution (0.566) (0.061)
Realized leading earnings -0.002growth (0.004)
Liquidity ratio change -0.001post-split execution (0.002)
Industry Fixed-E�ects Yes Yes Yes Yes Yes YesNumber of Splits 528 464 245 329 327 245R-Square 0.068 0.113 0.144 0.079 0.084 0.145
53