stock market liberalization and the information environment
TRANSCRIPT

Journal of International Money and Finance 25 (2006) 404e428www.elsevier.com/locate/econbase
Stock market liberalization and the informationenvironment*
Kee-Hong Bae a, Warren Bailey b,*, Connie X. Mao c
a Queen’s School of Business, Queen’s University, Kingston, Ontario K7L 3N6, Canadab Johnson Graduate School of Management, Cornell University, Sage Hall, Ithaca, NY 14853-6201, USA
c Fox School of Business and Management, Speakman Hall, Philadelphia, PA 19122-6083, USA
Abstract
We document beneficial associations between the information environment in emerging stock marketsand changes in openness to foreign equity investors reflected in legal, regulatory, and cross-listing events,the fraction of stock available to foreign investors, and the size of U.S. portfolio flows. Increased opennessis associated with increases in firm-specific information, analyst coverage, and analyst value-added, anddecreases in earnings management. In particular, foreign analysts increase their presence, activity, andcontribution to the information environment after openness increases. Across a detailed sample of Koreanfirms, however, such effects are dampened for firms that rate poorly on governance.� 2006 Elsevier Ltd. All rights reserved.
JEL classification: D82; F02; F36; G15
Keywords: Stock market liberalization; International portfolio flows; Emerging markets
* We thank Vidhi Chhaochharia, Helen Choy, Jean-Claude Cosset, Vihang Errunza, Andrew Karolyi, Dong-Cheol
Kim, Haitao Li, Alfredo Mendiola, Randall Morck, Dilip Patro, Kate Phylaktis (the editor), Mark Seasholes, Hyun-Han
Shin, Bernard Yeung, and workshop participants at Fordham, Korea University, Korean Finance Association, McGill,
Rutgers, Ohio State, University of California at Riverside, Waseda University, the 2004 Western Finance Association
meetings in Vancouver, and the 2004 Northern Finance Meetings in St. John’s for comments or other assistance. Special
thanks to WFA discussant Campbell Harvey for many detailed and helpful comments. We are grateful to Thomson Fi-
nancial for access to their Institutional Brokers Estimate System (I/B/E/S) provided as part of a broad academic program
to encourage earnings expectations research. Bae acknowledges financial support from the Asian Institute of Corporate
Governance at Korea University.
* Corresponding author. Tel./fax: þ1 607 255 4627.
E-mail address: [email protected] (W. Bailey).
0261-5606/$ - see front matter � 2006 Elsevier Ltd. All rights reserved.
doi:10.1016/j.jimonfin.2006.01.004

405K.-H. Bae et al. / Journal of International Money and Finance 25 (2006) 404e428
1. Introduction
A key theme in restructuring economies in the developing world is opening stock markets toforeign portfolio investment. This can be accomplished by permitting foreign investors to enterthe local stock market directly or by allowing local assets to trade in overseas stock markets.Global economic developments have sometimes raised doubts about the benefits of foreignportfolio investment. For example, in the wake of the Asian economic crisis that began in1997, Malaysia’s outspoken former Prime Minister Mahathir has argued that, ‘‘All in all, thepresent system, if there is a system at all, is messy, unreliable and destructive’’.1 However,a growing body of empirical evidence strongly suggests that openness to foreign stock marketinvestors is beneficial, permitting developing economy firms to tap the global pool of capital toundertake useful investments that generate profits and employment. In particular, the cost ofcapital appears to decline significantly after market liberalizations (Henry, 2000; Bekaert andHarvey, 2000) and after cross-listings of individual foreign securities on U.S. exchanges (Foer-ster and Karolyi, 1999; Miller, 1999; Errunza and Miller, 2000).
In addition to lowering the cost of capital, the scrutiny of foreign investors, foreign equityanalysts, and foreign stock market listing standards can help resolve information and agencyproblems, effectively transmitting higher quality disclosure and governance standards2 todeveloping-country firms (Obstfeld, 1998; Stulz, 1999). Better information contributes to thedecision-making processes of investors and managers, facilitates corporate discipline, andadds value.3 By listing overseas and adopting foreign standards of reporting, regulation, andlaw, a company can benefit by submitting to what Admati and Pfleiderer (2000) call ‘‘voluntarydisclosure’’. Country-wide liberalization can pressure an entire economy to adopt higher legal,regulatory, and disclosure standards desired by foreign investors from more developedenvironments.
In this paper, we explore the relationship between openness to foreign equity investment andthe information environment. Our study is the first to comprehensively investigate the changesin the information environment that result from increased access by foreign investors. We createan array of indicators of the information environment of emerging-market firms based on mar-ket, disclosure, and analyst activity. We study associations between these indicators and threemeasures of openness to foreign stock market investment based on explicit official liberaliza-tions and equity cross-listings, the fraction of the local stock market available to foreigners, andthe flow of U.S. equity investment in and out of the local stock market. While most previousstudies focus on ADRs, we study both cross-listings of individual foreign companies and sev-eral measures of changes in openness to direct foreign participation in the local stock market.
We also conduct a case study of firms from one country, Korea, for which we have partic-ularly detailed data on firm characteristics which allow us to examine associations betweenopenness, information environment, and corporate governance. We focus on emerging marketsbecause the contribution of increased openness to the quality of the capital market is likely tobe most dramatic and significant in less developed countries. While earlier studies detect a few
1 Excerpt from his speech entitled ‘‘Revitalization of Japanese and East Asian Economies’’ at the Fifth Symposium of
the Institute for International Monetary Affairs, in Tokyo, 2 June 1998.2 Doidge (2004), for example, finds that cross-listing in the U.S. affords greater protection to minority shareholders.3 Wurgler (2000) and Durnev et al. (2004), for example, find that an enhanced information environment for a firm
contributes to efficient capital allocation decisions.

406 K.-H. Bae et al. / Journal of International Money and Finance 25 (2006) 404e428
facets of the relationship between openness and the information environment,4 our range ofopenness measures, information indicators, and emerging market environments offers a compre-hensive view of the importance of foreign portfolio flows to improving disclosure, informationproduction, and other facets of the information environment in emerging economies.
We find much evidence that increased openness to foreign equity investors improves the in-formation environment. Our findings are robust across a variety of univariate tests, regressionspecifications, and control variables. Two of our results are particularly novel and notable. First,foreign analysts increase their presence, activity, and contribution to the information environ-ment after openness increases. Second, our Korean sub-sample indicates that the associationbetween openness and the information environment depends on corporate governance. Thus,our work plainly demonstrates that an enhanced information environment is another benefitthat increased openness to foreign portfolio investment brings to developing economies.
The paper is organized as follows. Section 2 details our hypotheses while Section 3 describesour data. Section 4 presents empirical results while Section 5 is a summary, discussion, and out-line for further research.
2. Testable hypotheses
Our null hypothesis is that increased openness to foreign portfolio investment conveys sub-stantial benefits to an emerging market economy by improving the quality of the information en-vironment faced by local firms. Previous authors report evidence that the quality of corporatedisclosure increases. For example, Leuz et al. (2003) show that the quality of reported earningsis higher in environments that impose higher legal, regulatory, and disclosure standards on localfirms. Lang et al. (2003) find that non-U.S. firms newly cross-listed in the U.S. supply higherquality disclosures that result in larger market responses. Cross-listed firms may offer lesssmooth, more immediate reporting of economic losses to stave off the threat of legal or regulatorypenalties (Ball et al., 2000). Increased market-wide openness may prompt local firms to supplybetter disclosure to attract and retain foreign investors, even among firms that are not cross-listed.
Our first specific prediction is as follows. As an emerging market opens to foreign invest-ment, increased foreign investor access and interest spur more research by analysts, brokerages,traders, and other local and foreign participants. Therefore:
H1: The number of analysts following local firms increases as an emerging economy be-comes more open to foreign portfolio investment.
The resources devoted to analyzing local firms should increase when an emerging stock mar-ket becomes more open to foreign portfolio investment. Increased foreign investor access andinterest spur more information production by analysts, brokerages, traders, and other local andforeign participants in an emerging stock market. This prompts local firms to produce more dis-closures and adhere more strongly to international norms of corporate governance, spurring lo-cal interest and investment in the local stock market as well.
4 Baker et al. (2002) and Lang et al. (2003) report increased analyst coverage, forecast accuracy, and news stories after
individual firms cross-list. Doidge et al. (2004) document the importance of cross-listing for companies from countries
with poor disclosure standards while Bailey et al. (in press) explore the impact of earnings announcements on ADR and
non-ADR firms. Li et al. (in press) suggest that firm-specific information is related to a proxy for openness to capital
flows.

407K.-H. Bae et al. / Journal of International Money and Finance 25 (2006) 404e428
Our second prediction is that more resources devoted to studying local companies by explor-ing and processing information yield more firm-specific information. Thus, the firm-specificcomponent of return volatility, a proxy for firm-specific information, increases:
H2: Firm-specific return volatility increases as an emerging economy becomes more open toforeign portfolio investment.
Firm-specific volatility can be measured by regressing individual stock returns on com-mon economic factors, and Roll (1988) suggests that the resulting low r-squared coefficientsfor U.S. firms represent substantial private firm-specific information. However, a large‘‘firm-specific volatility’’, that is, one minus the r-squared as discussed by Roll (1988),may also represent noise trading. Morck et al. (2000) relate country-average firm-specificvolatility cross-sectionally to country characteristics. They find that firm-specific return vol-atility is larger in countries with better investor protection, disclosure, and overall marketquality. This suggests that a higher quality environment offers greater incentives to producefirm-specific information and trade on it. Their evidence confirms the interpretation of thefirm-specific volatility as a measure of firm-specific information, rather than a measure ofnoise trading. They argue that higher firm-specific volatility can indicate the willingnessof analysts and other market participants to produce firm-specific information. Indeed, Xuand Malkiel (2003) find that firm-specific volatility typically increases with the proportionof a firm that is owned by institutional investors, suggesting that firm-specific volatility isassociated with the scrutiny and trading of professional investors. Furthermore, Durnevet al. (2003) find that high firm-specific return volatility is associated with stronger corre-lation between stock returns and future earnings while Xu and Malkiel (2003) find a gener-ally positive association between firm-specific volatility and earnings growth. This againconfirms an association between firm-specific return volatility and firm-specific disclosureand analysis.
Our third prediction is that higher quality disclosures imply that earnings management andmanipulation are less prevalent and earnings are less smooth, therefore:
H3a: Reported earnings become more volatile as an emerging economy becomes more opento foreign portfolio investment.H3b: Earnings management decreases as an emerging economy becomes more open to for-eign portfolio investment.
H3 is a consequence of the notion that increased openness spurs the release of more accurateand useful information. If earnings management or other practices become less acceptable inthe presence of foreign investors, aggressive earnings management becomes less prevalentand earnings releases supply more genuine surprises to the market. This implies that the abso-lute value of time-series earnings forecast errors (that is, na€ıve forecasts based on historicalearnings) increases as an emerging economy becomes more open to foreign portfolioinvestment.
Fourth, in response to increased openness of an emerging stock market to foreign equity in-vestment, listed firms may supply more pre-announcement disclosures to guide analysts’ fore-casts. Therefore, analysts can produce more accurate earnings forecasts, and thereby decreaseforecast errors. While the absolute value of time-series earnings forecast errors increases (H3),the absolute value of analyst forecast errors might decrease if the impact of more diligent

408 K.-H. Bae et al. / Journal of International Money and Finance 25 (2006) 404e428
research and increased disclosure outweighs the increased volatility of raw earnings after anincrease in market openness:
H4: The analyst information advantage improves as an emerging economy becomes moreopen to foreign portfolio investment.
The analyst information advantage is defined as the difference between na€ıve and analystforecasts. It measures the ‘‘value added’’ by analysts (Bailey et al., 2003).
Fifth, we formulate two competing predictions using the intuition from models such as thoseof Kim and Verrecchia (1991, 1994). These models balance the greater precision and greaterdisagreement or ‘‘difference of opinion’’ resulting from more information and informationprocessing:
H5a: Earnings forecast dispersion decreases with openness because better disclosure and in-formation processing increase the precision and unanimity of analyst forecasts.H5b: Earnings forecast dispersion increases with openness because better disclosure and in-formation processing increase disagreement and ‘‘difference of opinion’’ among analysts.
As in Harris and Raviv (1993), volatility can indicate a healthy, competitive information en-vironment in the capital market. We can imagine similar competing effects for analyst forecasterrors as increased precision conflicts with increased earnings volatility and difference ofopinion.
3. Data
We begin with the component firms of the Standard and Poor’s Emerging Markets Database(EMDB). They represent significant firms from a cross-section of over 40 emerging economies.However, data restrictions, as discussed subsequently, limit the number of countries we are ableto use. For example, the lack of sufficient Datastream or I/B/E/S records for such countries asBahrain, Egypt, Morocco, Nigeria, Oman, Saudi Arabia, and Zimbabwe leads us to excludethem from our sample. We use as many countries, firms, and time periods as possible, and,as detailed below, check for robustness over different sub-samples of the available data.
3.1. Proxies for openness to cross-border portfolio flows
We compute several proxies for the openness of a particular developing country to foreignportfolio investment. They are based on liberalization and cross-listing events, the fraction oflocal market capitalization that is legally available to foreign investors, and the size of portfolioflows between a particular developing country and the U.S.
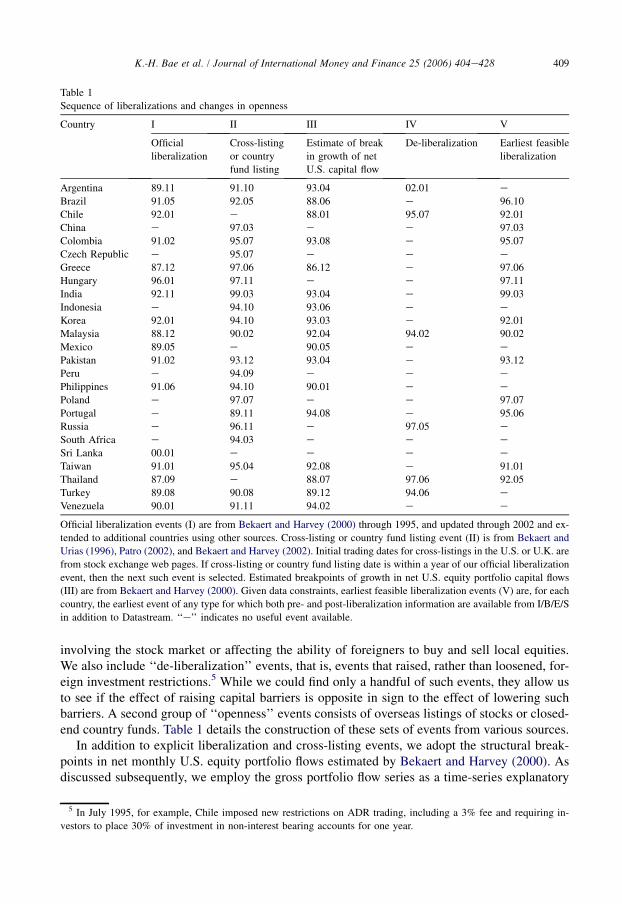
For a sample of openness events, we collect for each sample country dates of explicit officialliberalizations, cross-listing of domestic company shares on U.S. and U.K. stock markets, andlisting of closed-end country funds on U.S. and U.K. stock markets. Such events can ease ac-cess to the local stock market by foreign investors, and a variety of studies associate such eventswith decreases in the cost of capital. Table 1 lists (a detailed appendix is available upon request)our sample of official liberalization, cross-listings, and closed-end fund listing events and dates.‘‘Official liberalization events’’ are announcements of changes in legislation and regulation thatease foreign access to a country’s local stock market. We restrict events to major liberalizations
409K.-H. Bae et al. / Journal of International Money and Finance 25 (2006) 404e428
involving the stock market or affecting the ability of foreigners to buy and sell local equities.We also include ‘‘de-liberalization’’ events, that is, events that raised, rather than loosened, for-eign investment restrictions.5 While we could find only a handful of such events, they allow usto see if the effect of raising capital barriers is opposite in sign to the effect of lowering suchbarriers. A second group of ‘‘openness’’ events consists of overseas listings of stocks or closed-end country funds. Table 1 details the construction of these sets of events from various sources.
In addition to explicit liberalization and cross-listing events, we adopt the structural break-points in net monthly U.S. equity portfolio flows estimated by Bekaert and Harvey (2000). Asdiscussed subsequently, we employ the gross portfolio flow series as a time-series explanatory
Table 1
Sequence of liberalizations and changes in openness
Country I II III IV V
Official
liberalization
Cross-listing
or country
fund listing
Estimate of break
in growth of net
U.S. capital flow
De-liberalization Earliest feasible
liberalization
Argentina 89.11 91.10 93.04 02.01 e
Brazil 91.05 92.05 88.06 e 96.10
Chile 92.01 e 88.01 95.07 92.01
China e 97.03 e e 97.03
Colombia 91.02 95.07 93.08 e 95.07
Czech Republic e 95.07 e e e
Greece 87.12 97.06 86.12 e 97.06
Hungary 96.01 97.11 e e 97.11
India 92.11 99.03 93.04 e 99.03
Indonesia e 94.10 93.06 e e
Korea 92.01 94.10 93.03 e 92.01
Malaysia 88.12 90.02 92.04 94.02 90.02
Mexico 89.05 e 90.05 e e
Pakistan 91.02 93.12 93.04 e 93.12
Peru e 94.09 e e e
Philippines 91.06 94.10 90.01 e e
Poland e 97.07 e e 97.07
Portugal e 89.11 94.08 e 95.06
Russia e 96.11 e 97.05 e
South Africa e 94.03 e e e
Sri Lanka 00.01 e e e e
Taiwan 91.01 95.04 92.08 e 91.01
Thailand 87.09 e 88.07 97.06 92.05
Turkey 89.08 90.08 89.12 94.06 e
Venezuela 90.01 91.11 94.02 e e
Official liberalization events (I) are from Bekaert and Harvey (2000) through 1995, and updated through 2002 and ex-
tended to additional countries using other sources. Cross-listing or country fund listing event (II) is from Bekaert and
Urias (1996), Patro (2002), and Bekaert and Harvey (2002). Initial trading dates for cross-listings in the U.S. or U.K. are
from stock exchange web pages. If cross-listing or country fund listing date is within a year of our official liberalization
event, then the next such event is selected. Estimated breakpoints of growth in net U.S. equity portfolio capital flows
(III) are from Bekaert and Harvey (2000). Given data constraints, earliest feasible liberalization events (V) are, for each
country, the earliest event of any type for which both pre- and post-liberalization information are available from I/B/E/S
in addition to Datastream. ‘‘e’’ indicates no useful event available.
5 In July 1995, for example, Chile imposed new restrictions on ADR trading, including a 3% fee and requiring in-
vestors to place 30% of investment in non-interest bearing accounts for one year.

410 K.-H. Bae et al. / Journal of International Money and Finance 25 (2006) 404e428
variable in some of our tests. However, the Bekaert and Harvey breakpoints serve as alternativedates around which ‘‘before versus after’’ tests can be constructed, in a manner similar to whatwe do with explicit liberalization and listing events. This alternative set of ‘‘events’’ is impor-tant because the effective dates of changes in openness may differ substantially from the formaldates of explicit liberalization events. As Bekaert and Harvey (2000) and other authors haveindicated, identifying effective liberalization dates is problematic, and our use of alternativesets of events helps address this concern.
Table 1 displays our five sets of liberalization and openness events. In addition to ‘‘official’’,‘‘cross-listing or country fund listing’’, ‘‘breakpoint’’, and ‘‘de-liberalization’’ events as previ-ously described, we include a set entitled ‘‘earliest feasible liberalization’’. These are the ear-liest official liberalization dates, cross-listing or country fund listing dates, and estimatedbreakpoints in net U.S. capital flows for which both pre- and post-event information are avail-able from I/B/E/S and Datastream. In particular, data restrictions can, in some cases, cause us toexclude the earliest explicit events and structural breakpoints from our sample. Bekaert andHarvey (2000) show that the earliest cross-listing of stock from a particular country canhave more impact than subsequent listings. However, this is not a problem for our time-seriesmeasures of openness described below.
For time-series measures of openness to investment flows, the EMDB (formerly from theInternational Finance Corporation of The World Bank) reports the percentage of each firm’sequity available to foreign investors.6 Based on the sequence of legal, regulatory, and com-pany-specific restrictions on foreign ownership, the proportion of the equity of the EMDB firmsin a particular market that is available to foreign investors serves as our ‘‘investibility’’ open-ness measure. Time variation in each country’s proportion occurs as foreign ownership limitsand other controls on foreign investment vary with changes in local laws and regulations.Thus, it is a very specific indicator of the impact of legal limitations on foreign ownershipof local equities.
To represent actual portfolio flows, our final openness measure is computed from the size ofportfolio flows between the U.S. and each country in our sample. U.S. investors represent a sig-nificant fraction of the portfolio capital flows to and from emerging markets. Furthermore, com-parable data are not available from other countries. The monthly flow of portfolio capital betweenthe U.S. and virtually every country in the world is made available online by the U.S. TreasuryDepartment starting with 1988 data.7 The sum of monthly inward and outward flows of U.S. stockmarket investors (scaled by the market’s capitalization) is a proxy for the amount of foreign port-folio activity for each country-month. While the previously defined ‘‘event’’ and ‘‘investibility’’measures indicate the potential openness of the local capital market, the flow of portfolio capitalrepresents the actual capital movements across an emerging market’s borders.
3.2. Proxies for the information environment
We create several measures of the information environment faced by the emerging-marketfirms in our sample. These measures will be related to the ‘‘openness’’ measures previouslydescribed.
6 Bae et al. (2004) discuss problems such as survivorship bias and lags in updating the foreign ownership restrictions
in the EMDB database, and find that corrections to the EMDB methodology do not alter their finding that investibility is
associated with higher return volatility and higher correlation with global factors.7 The data were downloaded from http://www.treas.gov/tic/country-longterm.html. Across our sample of emerging
market countries, only Sri Lanka lacks data from this source.

411K.-H. Bae et al. / Journal of International Money and Finance 25 (2006) 404e428
To measure firm-specific volatility, we follow Morck et al. (2000) and compute the proportionof firm-specific volatility from monthly EMDB returns. For each firm-window, a regression ofreturns on local index returns is estimated. The r-squared coefficients from such regressions mea-sure how much of the stock’s return is due to market-wide influences and, therefore, one minusthe r-squared is a measure of the firm-specific volatility. We take the logarithm of one minus ther-squared to convert the figure (which is bounded by zero and one) into a suitable form for subse-quent statistical tests. To check robustness, tests involving firm-specific volatility are based ona variety of windows (ranging from 12 to 36 months), data frequencies (weekly and monthly),and currencies (local versus dollar). Also following Morck et al. (2000), we compute the firm-specific volatility from a specification including both the EMDB value-weighted local indexfor a country and either the S&P 500 index representing U.S. index returns or the MSCI Worldindex representing global stock returns, but find that these variations do not alter our empiricalresults described below that employ the ‘‘local index only’’ firm-specific volatility.
Additional information environment measures are derived from data related to earnings an-nouncements obtained from I/B/E/S. The number of analysts counts analysts providing fore-casts of the particular earnings event. It proxies for the amount of resources devoted tofollowing the firm. The absolute time-series forecast error, a proxy for na€ıve forecast precision,is the absolute value of the seasonal change in a firm’s annual earnings. The absolute consensusforecast error, a proxy for analyst forecast precision, is the absolute value of the difference be-tween reported annual earnings and the median of most recent analyst forecasts for that earn-ings release. The analyst information advantage is the difference between a particular absolutetime-series forecast error and the corresponding absolute consensus forecast error. The forecastdispersion is the standard deviation of individual analyst most recent forecasts of a firm’s an-nual earnings. It is a proxy for pre-announcement disagreement. All forecast error and forecastdispersion variables are scaled by the absolute value of median forecasts. We also scale theforecast variables using the stock price, and the results are qualitatively similar.
Finally, we adopt several earnings opacity measures to detect the extent to which companiesmanipulate earnings releases. Following Bhattacharya et al. (2004), we compute three earningsopacity measures: earnings aggressiveness (accruals scaled by lagged total assets), loss avoid-ance (ratio of number of firms with small positive earnings minus the number of firms withsmall negative earnings divided by their sum), and earnings smoothing (cross-sectional corre-lation between change in accruals and change in cash flows, both scaled by lagged total assets).Because loss avoidance and earnings smoothing are computed across all firms of a given coun-try, we have only one observation per country-year for those variables.
4. Empirical results
In this section, we report results of a variety of tests relating changes in openness to changesin the information environment.
4.1. Overview of the data
Some highlights of summary statistics (unreported but available on request) on the countryopenness measures and firm-specific volatility, the earnings-related information variables, andthe earnings opacity measures are as follows. Because investibility and portfolio flow are avail-able monthly, we compute their summary statistics using monthly data. In contrast, the firm-specific volatility, earnings-related information variables, and earnings opacity measures are

412 K.-H. Bae et al. / Journal of International Money and Finance 25 (2006) 404e428
constructed on an annual basis so their summary statistics are computed on annualobservations.
First, median investibility, the fraction of market capitalization available to foreign investors,ranges from almost 100% (Argentina, Turkey, Poland, and South Africa) to much lower levelsfor several countries (China, India, Korea, and Taiwan) with a history of substantial foreignownership restrictions.8 The cross-sectional and time variation in investibility is substantial.Second, total U.S. portfolio flow identifies the countries (Argentina, Brazil, Korea, Malaysia,and Mexico) that appear to be the dominant targets of U.S. equity portfolio investment. Taiwanis a particularly interesting case as it features low investibility but high U.S. equity portfolioflows. Aside from indicating how popular the country has been with U.S. investors in spite ofinvestment restrictions, this also shows that investibility and portfolio flows are not exactlythe same. Third, there is substantial variation in mean and median firm-specific volatility acrosscountries, confirming that the information environment differs widely across our samplecountries.
Across the information variables derived from earnings announcement related data, two no-table facts emerge. First, the median number of analysts per firm ranges widely, from 3 for Ven-ezuela to 21 for Brazil and Mexico. Korea, a relatively developed market, features a median ofonly 7 analysts per firm. Thus, there is great variation in this variable across countries, and thevariable is less than perfectly correlated with the state of economic development. Second, theRussian market displays the highest median absolute time-series forecast error and forecast dis-persion, and second and third highest median analyst information advantage and absolute time-series forecast error, respectively. Again, this suggests a rich cross-section of countrycharacteristics in the sample. In particular, data limitations do not entirely exclude volatileand interesting markets that have only recently emerged.
Finally, differences in earnings opacity are evident across our sample countries. ‘‘Earningsaggressiveness’’ is a measure of the extent to which companies use accruals to delay recogni-tion of losses or speed recognition of gains. Larger numbers indicate more manipulation, ex-pressed as a fraction of the lagged book value of assets. ‘‘Loss avoidance’’ measures thenumber of firms that report small positive earnings relative to small negative earnings. In theabsence of earnings manipulation, we would expect these numbers to be roughly equal, butthe proportion of firms that report small positive earnings is much greater in size than thosewho report small negative earnings. ‘‘Earnings smoothing’’ is measured as the correlation be-tween cash flow and accruals across companies for each country-year. If a firm tries to offsetpoor cash flow with increased accruals, their correlation will be negative. Thus, the more neg-ative is the correlation, the more a firm smoothes (or manipulates) earnings. There is much ev-idence of this practice in the summary statistics for all the countries. All of the mean andmedian correlation coefficients are negative. For some countries, earnings smoothing is closeto negative one. Across all the measures, the numbers are roughly similar in scale and signto those reported by Bhattacharya et al. (2004).
4.2. ‘‘Before versus after’’ tests
Our samples of explicit (liberalization, cross-listing, and country fund) and implicit (esti-mated portfolio flow breakpoints) events imply distinct ‘‘before’’ and ‘‘after’’ periods.
8 See Bailey et al. (1996, 1999) on foreign ownership restrictions across countries.

Table 2
t, and de-liberalization event dummy variables
4 5
0.584
(221.69)
0.587
(182.21)
�0.078
(�7.48)
0.009
(0.98)
�0.029
(�3.29)
0.047
(6.29)
�0.058
(�5.70)
0.021
(2.39)
�0.049
(�2.78)
�0.067
(�3.88)
�0.013
(0.13)
�0.018
(�1.23)
Yes Yes
Yes Yes
[0.11] [0.00]*
17 425 17 425
(continued on next page)
41
3K
.-H.
Bae
etal.
/Journal
ofInternational
Money
andF
inance25
(2006)404e
428
Regressions of individual firm information variables on liberalization, cross-listing, and portfolio flow breakpoin
1 2 3
Panel A: Dependent variable is individual firm-specific annual volatility
Intercept 0.589
(213.61)
0.579
(200.54)
0.586
(210.44)
Official event (I)
Before �0.092
(�8.80)
After 0.001
(0.06)
Listing event (II)
Before �0.028
(�3.18)
After 0.052
(6.90)
Breakpoint (III)
Before �0.076
(�7.69)
After 0.026
(3.07)
De-liberalization (IV)
Before
After
Country dummies Yes Yes Yes
Year dummies Yes Yes Yes
c2-Test: before¼ after [0.00]* [0.00]* [0.00]*
Nobs 17 425 17 425 17 425

ormation Forecast
dispersion
Earnings
Aggressiveness
2 1 2 1 2
1.050
(3.61)
0.930
(3.25)
1.116
(3.54)
�0.053
(�2.46)
�0.043
(�1.98)
�0.181
(�0.78)
�0.495
(�2.03)
�0.558
(�2.25)
�0.050
(�2.15)
�0.057
(�2.44)
0.758
(2.27)
0.622
(1.77)
0.622
(1.75)
�0.037
(�1.87)
�0.041
(�2.06)
�0.093
(�0.18)
�0.092
(�0.17)
�0.099
(�3.13)
0.028
(0.05)
�1.238
(�2.08)
�0.008
(�0.29)
Yes Yes Yes Yes Yes
Yes Yes Yes Yes Yes
[0.00]* [0.067]* [0.00]* [0.62] [0.12]
2549 2549 2549 3149 3149
firm in each country each year starting from 1986 to 2002.
variables indicating time periods at least two years before or
ated measures. Given data limitations, this panel focuses on
e pair of ‘‘before’’ and ‘‘after’’ dummy variables is equal. In
e jointly equal. Regressions are GLS corrected for autocor-
ey are inappropriate for GLS. A Monte Carlo procedure with
the p-value of the c2-test indicates simulation confirms the
41
4K
.-H.
Ba
eet
al./
Journalof
International
Money
andF
inance25
(2006)404e
428
Table 2 (continued )
Number of
analysts
Time-series forecast
error
Analyst forecast
error
Analyst inf
advantage
1 2 1 2 1 2 1
Panel B: Dependent variables are individual firm earnings-related measures of information environment
Intercept 9.633
(28.22)
8.648
(23.59)
3.838
(7.01)
4.051
(6.79)
2.395
(5.98)
2.594
(5.93)
1.039
(3.92)
Earliest feasible events (V)
Before �0.106
(�0.24)
0.470
(1.07)
�1.158
(�2.28)
�1.243
(�2.41)
�0.960
(�2.09)
�1.033
(�2.36)
�0.177
(�0.78)
After 0.830
(2.59)
1.234
(3.81)
1.992
(2.68)
2.008
(2.66)
1.137
(2.29)
1.132
(2.25)
0.769
(2.35)
De-liberalization (IV)
Before 1.7041
(1.56)
0.159
(0.14)
�0.059
(�0.08)
After 3.492
(4.31)
�1.953
(�1.57)
�1.468
(�1.72)
Country dummies Yes Yes Yes Yes Yes Yes Yes
Year dummies Yes Yes Yes Yes Yes Yes Yes
c2-Test: before¼ after [0.039]* [0.00]* [0.044]* [0.00]* [0.055]* [0.00]* [0.047]*
Nobs 3059 3059 2549 2549 2549 2549 2549
In Panel A, the dependent variable is the annual firm-specific volatility obtained from a market model run for each
Each regression uses 12 return observations in each year and is not overlapped. Independent variables are dummy
after the year of a liberalization event. In Panel B, the dependent variables are annual individual firm earnings-rel
‘‘earliest feasible events’’. t-Statistics are in parentheses while p-values are in brackets. c2-Test checks whether th
specifications with more than one pair of ‘‘before’’ and ‘‘after’’ dummies, c2-test checks that the coefficients ar
relation and country-wise heteroskedasticity following Bekaert et al. (2003). r-Squared values are unreported as th
random liberalization dates yields alternative empirical cutoffs for the t-statistics and c2-statistics. Asterisk next to
c2-test is significant at the 5% level.

415K.-H. Bae et al. / Journal of International Money and Finance 25 (2006) 404e428
Therefore, we examine the changes in firm-specific return volatility, earnings-related variables,and opacity measures using ‘‘before’’ and ‘‘after’’ dummy variables in regressions.9 To controlfor potential country-specific and time trend effects on our information variables, we includeterms for country and calendar year fixed effects. Aside from reflecting the country character-istics used by Morck et al. (2000), the fixed effects can control for differing economic growthrates across countries and time periods, and can correct for potential bias in the computation ofthe firm-specific volatility measure of the information environment.10 The regressions are esti-mated by pooling all firms and all countries in the sample. Following Bekaert et al. (2003), weestimate GLS regressions to correct for autocorrelation and country-wise heteroskedasticity.
The results are presented in Table 2. In Panel A, the dependent variable is the individualfirm-specific annual volatility. Estimated coefficients on ‘‘Official events e before’’, ‘‘Listingevents e before’’, and ‘‘Breakpoint e before’’ are all negative and significant, suggestingthat firm-specific volatility is typically lower before openness events. Coefficients on ‘‘Listingevents e after’’ and ‘‘Breakpoint e after’’ are typically positive and highly significant, suggest-ing that firm-specific volatility is higher after openness events. The table also reports a c2-testthat slopes on ‘‘before’’ and ‘‘after’’ dummies are equal (or jointly equal in regression 5). Inmost specifications (official events, listing events, breakpoints, and all sets of events included)this is strongly rejected. Even though we use GLS to correct for autocorrelation and heteroske-dasticity, there may also be issues with small sample properties. To address this concern, weadopt a Monte Carlo procedure with random liberalization dates to yield alternative empiricalcutoffs for the t-statistics and c2-statistics. Based on these Monte Carlo experiments, the nullhypothesis that the coefficients on ‘‘before’’ and ‘‘after’’ dummies are equal is significantly re-jected in most specifications. These results indicate that firm-specific volatility increases signif-icantly after various liberalization events, which supports H2. As for ‘‘de-liberalization’’ events,there is no evidence that they reduce firm-specific volatility.
In Panel B of Table 2, the dependent variables are the individual firm earnings-related infor-mation variables plus the earnings aggressiveness measure. Note that the two other earningsopacity variables (loss avoidance and earnings smoothing) cannot be included in these tests be-cause they must be computed by country, not for individual firms. Furthermore, the Panel Btests are computed over fewer types of openness events given data limitations.
For ‘‘earliest feasible liberalization’’ events, coefficients on the ‘‘before’’ dummies are oftensignificantly negative. Coefficients on the ‘‘after’’ dummies are positive and significant fornumber of analysts (H1),11 time series (H3a) and analyst forecast error, and analyst informationadvantage (H4), and marginally significant for forecast dispersion (H5b), which suggests in-creases in these information variables in the ‘‘after’’ period. c2-tests and Monte Carlo simulatedtests indicate that equality of ‘‘before’’ and ‘‘after’’ dummy coefficients is significantly rejected,except for earnings aggressiveness. These results strongly indicate that the earnings-related in-dicators increase significantly after openness events. For de-liberalizations, there is less clearevidence.
9 As indicated in the tables, we define ‘‘before’’ and ‘‘after’’ as two years before and after the event year. This is in-
tended to alleviate problems with announcement versus implementation times. One year after might not be enough time
to capture impact of liberalization.10 If a particular country has a small number of large companies, the firm-specific volatility will tend to be small as
each company comprises a large fraction of the capitalization of the local stock market, and regression of each com-
pany’s return on the index return will yield a large r-squared coefficient.11 Lang et al. (2003) report similar findings for a sample of developed and emerging countries for 1996.

416 K.-H. Bae et al. / Journal of International Money and Finance 25 (2006) 404e428
Our earnings-related data are relatively constrained in that it does not extend as far back intime as some of our other data and events used for analyzing firm-specific volatility. To assesswhether differences in data availability substantially affect our results, we also examine thechanges in firm-specific volatility over the smaller set of ‘‘feasible’’ events studied in Panel B,and find similar results as those in Panel A. Furthermore, we also test whether outliers biasour results: we confirm all results with critical variables winsorized at the 1% and 99% levels.
To understand these results further, we have estimated some additional specifications as follows.First, we rank each sample country on seven characteristics. These are the ‘‘Judicial Efficiency’’index, ‘‘English Legal Origin’’ dummy, and ‘‘Accounting Standards’’ index from La Porta et al.(1998), the ‘‘Duration of Eviction Process’’ and ‘‘Duration of Check Collection’’ from Djankovet al. (2002), and ‘‘Private Credit’’ and ‘‘Stock Market Capitalization’’ from the IMF’s InternationalFinancial Statistics and the International Finance Corporation. For each characteristic, a dummyvariable, ‘‘High Rank’’, is set to one if the country ranks among the top half of countries on thatcharacteristic. High (low) ranking means high (low) quality, e.g., high (low) accounting standardis ranked as high (low) quality, short (long) duration of check collection is ranked as high (low)quality. This rank dummy is then interacted with the ‘‘before’’ and ‘‘after’’ dummies as used inTable 2. The purpose is to examine which group of countries experiences a larger change in infor-mation variables upon changes in openness. Results (unreported but available upon request) indi-cate that the change in firm-specific volatility and number of analysts after openness events is thegreatest for countries that rank poorly on almost all of the country characteristics. Put another way,the impact of increased openness is typically greatest for countries with poor quality of legal, dis-closure, and economic environment. The changes in other information variables do not seem to dif-fer between high and low quality country groups. These results are consistent with the literature thatsuggests that poor quality countries should benefit more from market openness (Stulz, 1999).
Second, we replace the fixed and time effects of Table 2 with a set of country-specific and time-specific variables. The time-series variables are the annual OECD GDP growth and inflation rates.The cross-sectional variables are the individual country time-series average annual GDP growth rate,inflation rate, and GDP per capita. Results (unreported but available upon request) confirm that ourresults in Table 2 are robust. After controlling for the above variables, market openness is associatedwith significant increases in all the information variables except earnings aggressiveness.
On balance, these pooled regressions indicate associations between openness and the infor-mation environment. It is not just official announcements that seem to affect the informationenvironment. Portfolio flow breakpoints and cross-listing events seem important as well.This reminds us that it is useful to study a variety of proxies for changes in openness. Further-more, the results illustrate that evidence on ‘‘volatility’’ should be interpreted carefully. Whilethere is little evidence that emerging market stock volatility rises after liberalization (Bekaertand Harvey, 2000), our results indicate that firm-specific volatility rises after liberalizations andother events that increase openness to foreign investment. However, increased firm-specific vol-atility suggests a positive effect (greater firm-specific information production), and is also as-sociated with other beneficial effects (such as increases in analyst coverage and analystinformation advantage) that indicate improvements in the information environment upon fur-ther opening to foreign stock market investors.
4.3. Regressions relating information environment to time-series openness measures
Recall that the proportion of market cap available to foreigners and the flow of capital be-tween the U.S. and a particular country are monthly time series that proxy for stock market

417K.-H. Bae et al. / Journal of International Money and Finance 25 (2006) 404e428
openness. While the previously described ‘‘before and after’’ tests include structural break-points in net portfolio flows as ‘‘events’’, we can also analyze the relationship between the in-vestibility or portfolio flow variables and the information variables. Thus, our second set of testsis based on regressing time series of our information variables on time series of ‘‘investibility’’and ‘‘U.S. portfolio flows’’.
Specifically, the median value of a particular information variable is computed across allsample firms of a given country in a given year, yielding one panel of annual observationsfor each country. This dependent variable is, in turn, regressed on the ‘‘investibility’’ or U.S.portfolio flow growth matching the country-year. Other variables are added to control for po-tential confounding effects and trends. For example, the number of sample firms and their mar-ket capitalization per country-year may correct for potential bias in the median firm-specificvolatility. We use pooled country-year observations in the regressions rather than pooledcountry-firm-year observations since the openness variables are the same for all firms withina country. When firm-level observations are correlated, regression t-statistics are overstated.12
Table 3 reports pooled time-series cross-sectional GLS regressions of country median annualfirm-specific volatility, country median earnings-related variables, and country median earningsopacity measures on (contemporaneous or lagged) investibility and gross portfolio flow. Lagsare included because the impact of changes in ‘‘openness’’ on the information environmentmay be gradual, not contemporaneous. The necessity of running regressions with annual vari-ables, as described previously, may facilitate this: One lag of an openness variable providesa window of a year, rather than a month, for gradual responses of information variables.
In Panel A of Table 3, the (contemporaneous or lagged) investibility measure of openness isthe principal explanatory variable. Firm-specific volatility is not statistically significantly re-lated to the investibility openness measure. Absolute time series (H3a) and analysts’ forecasterrors, forecast dispersion (H5b), and analyst information advantage (H4) around earningsare strongly positively correlated with both contemporaneous and lagged investibility. This in-dicates that changes in the information environment are associated with increased availabilityof a country’s equities to foreigners: earnings announcements are more informative, the value ofanalyst forecasts relative to na€ıve forecasts rises, and pre-announcement disagreement is higher.Among the control variables, it is interesting to see that the number of analysts is negativelycorrelated with the number of firms in a country. The result is robust given the use of winsor-ized series, as is true throughout the paper. Larger market cap is sensibly associated with a largernumber of analysts and greater analyst information advantage. Marginally significant or signif-icant positive slopes on market capitalization suggest that there is typically more idiosyncraticinformation for larger-cap firms. This is particularly strong because we expect firm-specific vol-atility to be downward biased, given that large firms can dominate the local stock market index.Across the earnings opacity variables, there is some evidence that loss avoidance declines sig-nificantly with increased investibility. This is consistent with H3b.
In Panel B of Table 3, the (contemporaneous or lagged) gross equity portfolio flow measureof openness is the principal explanatory variable. There is evidence that absolute time series(H3a) and analyst forecast errors, analyst information advantage (H4), and forecast dispersion(H5b) increase as the amount of U.S. equity investment flowing across a country’s borders in-creases. A larger number of listed firms in a given country are associated with fewer analystsbut marginally larger forecast errors and larger forecast dispersion. Larger market capitalizationis associated with more analysts and greater analyst information advantage but marginally
12 We repeat using pooled country-firm-year data and find similar results.

Forecastdispersion
Earningsaggressiveness
Lossavoidance
Earningssmoothing
48)
0.476(1.35)
0.370(1.45)
0.573(1.93)
�0.873(�3.94)
�0.902(�3.82)
1.045(2.01)
0.975(1.64)
17)
�0.009(�0.23)
�0.096(�2.12)
0.032(0.37)
0.292(2.03)
0.034(0.82)
�0.059(�1.65)
0.032(0.38)
41)
0.013(1.05)
0.001(0.34)
0.001(0.42)
0.001(0.54)
0.001(0.26)
�0.020(�1.20)
�0.022(�1.07)
074.07)
�0.066(�1.73)
�0.027(�0.98)
�0.050(�1.59)
0.001(0.03)
0.004(0.17)
0.004(0.06)
0.011(0.17)
Yes Yes Yes Yes Yes Yes Yes
Yes Yes Yes Yes Yes Yes Yes
126 209 187 135 135 179 156
97)
0.355(0.85)
0.342(1.55)
0.468(1.79)
�0.780(�3.75)
�0.840(�3.81)
1.064(2.36)
0.987(1.91)
079)
�13.620(�4.53)
�7.683(�2.65)
0.919(0.12)
12.845(2.28)
�11.053(�3.43)
�5.341(�1.79)
7.907(2.15)
85)
0.008(1.92)
0.001(0.33)
0.012(0.57)
0.003(�0.29)
0.002(0.23)
�0.022(�1.13)
�0.013(�0.87)
086.97)
�0.079(�1.78)
�0.013(�0.56)
�0.031(�1.12)
�0.001(�0.04)
0.001(0.03)
�0.001(�0.02)
�0.001(�0.01)
Yes Yes Yes Yes Yes Yes Yes
Yes Yes Yes Yes Yes Yes Yes
126 209 187 152 135 179 156
s are the investibility measure (Panel A) or total portfolio flow (Panel B),d average market capitalization are natural logs. Total portfolio flow is thetocorrelation and country-wise heteroskedasticity following Bekaert et al.
Table 3Regression of country median information variables on investibility and portfolio flows
Firm-specificvolatility
Number ofanalysts
Time-seriesforecast error
Analystforecast error
Analystinformation advantage
Panel A: Investibility proxy for opennessIntercept �0.414
(�1.19)�0.209(�1.20)
�21.475(�4.49)
�16.604(�3.18)
1.122(1.81)
1.092(1.76)
0.617(1.62)
0.558(1.36)
0.433(2.52)
0.453(2.65)
0.61(1.8
Investibility 0.029(0.17)
0.385(0.45)
0.718(3.57)
0.405(2.79)
0.126(2.16)
0.41(2.7
Investibilitylagged
�0.209(�1.20)
0.163(0.19)
0.605(3.47)
0.306(2.23)
0.120(2.38)
Numberof firms(�10)
0.007(0.53)
�0.004(�0.35)
�0.763(�4.71)
�0.691(�3.89)
�0.011(�0.47)
�0.001(�0.03)
�0.007(�0.51)
0.003(0.19)
�0.001(�0.11)
0.001(0.19)
0.00(0.3
Marketcapitalization
0.074(1.93)
0.109(3.08)
3.437(6.91)
2.988(5.49)
�0.120(�1.81)
�0.121(�1.82)
�0.067(�1.62)
�0.066(�1.53)
0.048(2.61)
0.050(2.75)
�0.(�2
Countrydummies
Yes Yes Yes Yes Yes Yes Yes Yes Yes Yes Yes
Yeardummies
Yes Yes Yes Yes Yes Yes Yes Yes Yes Yes Yes
Nobs 303 281 160 144 142 126 142 126 142 126 142
Panel B: Portfolio flow proxy for opennessIntercept 0.583
(1.31)0.065(0.13)
�21.231(�2.51)
�15.797(�1.99)
0.552(0.76)
0.781(1.07)
0.431(0.98)
0.398(0.86)
0.326(1.84)
0.370(2.06)
0.38(0.9
Portfolio flow 1.093(0.26)
84.308(1.33)
29.508(2.38)
15.436(2.42)
5.475(2.19)
15.6(2.3
Portfolio flow lagged 5.710(1.20)
33.650(0.52)
22.084(2.12)
13.456(2.16)
3.395(1.39)
Numberof firms(�10)
0.006(0.36)
�0.006(�0.37)
�0.574(�4.23)
�0.498(�3.15)
0.007(1.51)
0.008(1.86)
0.004(1.01)
0.009(1.97)
0.004(1.15)
0.011(1.73)
0.00(1.2
Marketcapitalization
�0.026(�0.54)
0.033(0.63)
3.274(6.71)
2.783(5.15)
�0.124(�1.61)
�0.133(�1.72)
�0.081(�1.69)
�0.077(�1.56)
0.045(2.41)
0.047(2.46)
�0.(�1
Countrydummies
Yes Yes Yes Yes Yes Yes Yes Yes Yes Yes Yes
Yeardummies
Yes Yes Yes Yes Yes Yes Yes Yes Yes Yes Yes
Nobs 317 292 160 144 142 126 142 126 142 126 142
The dependent variables are the median information variables for each country-year across all firms by country. Independent variablenumber of firms, average market capitalization of stocks, country dummies, and year dummies. The average investibility measure anmean of 12 monthly total flows, divided by the average market capitalization during the year. Regressions are GLS corrected for au(2003). r-Squared values are unreported as they are inappropriate for GLS. t-Statistics are reported below each coefficient.
419K.-H. Bae et al. / Journal of International Money and Finance 25 (2006) 404e428
smaller forecast errors and forecast dispersion. Most interestingly, earnings aggressiveness andloss avoidance decline significantly with contemporaneous portfolio flow. Earnings smoothingbecomes less negative (more positive) as lagged portfolio flow increases, suggesting decline ofearnings smoothing behavior. These results support H3b, suggesting that earnings opacity de-clines significantly with portfolio flow. Aside from the findings specific to particular testablehypotheses, these results confirm that the use of several dimensions of the information environ-ment is valuable for understanding different dimensions of the relationship between openness toforeign investment and information production.
4.4. A robustness test
To test the robustness of these results, we have estimated an additional specification as fol-lows. We replace the fixed and time effects of Table 3 with a set of country-specific and time-specific variables. The time-series variables are the annual OECD GDP growth and inflationrates. The cross-sectional variables are the individual country time-series average annualGDP growth rate, inflation rate, and GDP per capita. Results (unreported but available uponrequest) are qualitatively similar to those reported in Table 3.
4.5. More evidence on earnings forecasts and analysts
In this subsection, we present a few additional empirical facts about the changes in analystcoverage and output around events implying greater openness to foreign portfolio investment.We wish to understand, in as much detail as possible, the nature of the changes in the informa-tion environment that are associated with increased openness to foreign portfolio investors inour sample of emerging markets.
Table 4 breaks down previous statistics on changes in numbers of analysts, forecast errors,information advantage, and forecast dispersion by ‘‘local’’ versus ‘‘foreign’’ analysts. The num-ber of foreign analysts grows more than the number of local analysts, as is also true for the an-alyst information advantage. This suggests that openness increases the amount of skilledforeign resources applied to the local capital market. At the same time, the tension between‘‘precision’’ and ‘‘difference of opinion’’ (H5a versus H5b) is evident. Increases in forecast dis-persion and forecast errors after openness events are greater for foreigners too.13
Table 5 presents two sets of results. On the left side of the table, we repeat previous calcu-lations for forecast errors, information advantage, and forecast dispersion for ‘‘old’’ analystsonly. By ‘‘old’’, we mean those analysts who were providing forecasts for a particular companyboth before and after the particular openness event being examined. Most notable are the insig-nificant changes in analyst information advantage for these ‘‘old’’ analysts. This suggests thatmuch of the contribution to the local information environment’s quality after increased open-ness is due to new entrants, possibly the foreign analysts identified in Table 4.
On the right side of the table, we present measures of changes in the number of forecasts perearnings event and the number of forecasts per event per analyst. Each analyst can provide morethan one forecast regarding a particular firm’s annual earnings, depending on how often the an-alyst revises the forecast over time. There are significantly more forecasts per annual earnings
13 Note that our sample consists only of analysts covered by the I/B/E/S records. Omissions may be possible. For ex-
ample, I/B/E/S analyst coverage of mainland Chinese companies is often more extensive for those companies which
offer a class of equity to foreign investors.

Table 4
Changes in nu
No r Analyst information advantage Forecast dispersion
Lo Local Foreign Local Foreign
dian Mean Median Mean Median Mean Median Mean Median
Earliest feasib
Before 25 1 0.211 0.058 0.209 0.067 0.158 0.112 0.239 0.142
After 28 1 0.760 0.087 1.513 0.157 0.181 0.132 0.437 0.179
p-Value 0.02 0.06 0.01 0.02 0.02 0.15 0.01 0.04
Earliest feasib
Before 19 0 0.089 0.077 0.317 0.069 0.198 0.176 0.272 0.109
After 19 8 0.127 0.138 0.542 0.136 0.231 0.219 0.458 0.207
p-Value 0.07 0.05 0.05 0.02 0.06 0.08 0.01 0.01
ADR or closed
Before 26 3 0.169 0.071 0.275 0.063 0.187 0.146 0.287 0.148
After 25 7 0.583 0.113 1.324 0.151 0.220 0.161 0.571 0.183
p-Value 0.03 0.05 0.02 0.02 0.05 0.27 0.01 0.05
This table repo atistics into local and foreign analyst categories. See previous tables for def-
initions of vari local or foreign analysts only.
42
0K
.-H.
Ba
eet
al./
Journalof
International
Money
andF
inance25
(2006)404e
428
mbers of local and foreign analysts and their effectiveness
bs Number of analysts Absolute consensus forecast erro
cal Foreign Local Foreign Local Foreign
Mean Median Mean Median Mean Median Mean Me
le liberalization events (V)
4 258 1.296 1.000 5.163 2.000 0.322 0.079 0.324 0.05
6 295 1.911 2.000 6.807 5.000 1.413 0.114 0.660 0.07
0.00 0.00 0.00 0.00 0.01 0.04 0.01 0.03
le liberalization events, matched pairs (V)
5 195 1.435 1.000 5.747 4.000 0.551 0.071 0.323 0.09
5 195 1.827 1.000 6.517 6.000 0.902 0.112 0.487 0.12
0.01 0.00 0.00 0.00 0.01 0.05 0.01 0.01
-end fund listing events (II)
8 278 1.402 1.000 5.623 2.000 0.463 0.075 0.349 0.07
1 259 1.991 2.000 6.982 5.000 0.127 0.124 0.586 0.09
0.00 0.00 0.00 0.00 0.02 0.06 0.04 0.03
rts further statistics on the total sample of earnings events by breaking down st
ables. Nobs can differ from previous tables because some events are covered by

421K.-H. Bae et al. / Journal of International Money and Finance 25 (2006) 404e428
event after openness events. Furthermore, each analyst on average provides significantly moreannual earnings forecasts each year after liberalization. These results indicate that increasedopenness brings more analysis to bear on annual earnings event and compels each analyst towork harder in collecting information and revising earnings forecasts on firms they cover.Put another way, increased openness to foreign portfolio flows draws ‘‘new blood’’ into the pro-duction and processing of information. This contributes substantially to the improved informa-tion environment that we document.
4.6. A closer look at a cross-section of individual firms from one country
Our tests to this point largely feature variables that have been aggregated across firmsand months within a year. For example, we use country medians of individual firm-specificvolatility, rather than the individual firm-specific volatilities. While this aggregation hasmany advantages, it also limits our ability to control for individual firm characteristicswhen we relate information variables to indicators of liberalization or openness to foreignportfolio investment. To address this concern, we produce additional results for a cross-section of individual firms from Korea. The Korean market has several characteristicsthat make it particularly suited to our investigation. First, there have been significantchanges in foreign equity investment restrictions. The first Korean closed-end fund waslisted in the U.S. in 1984, convertible eurobonds of Korean issuers appeared at about thesame time (Bailey et al., 1996), and direct access by foreigners to the Korean stock marketwas gradually widened starting in January 1992. Second, the Korean market is a major tar-get of foreign portfolio investors, ranking third among our sample countries in terms of U.S.equity portfolio flows. Third, detailed firm-level data are readily available. In particular, we
Table 5
Additional measures of the impact of openness events on earnings-related variables
‘‘Old’’ analysts only Average number of forecasts for all analysts
Nobs Absolute
time-series
forecast
error
Absolute
consensus
forecast
error
Analyst
information
advantage
Forecast
dispersion
Nobs Per
earnings
event
Per analyst
per earnings
event
Earliest feasible liberalization events (V)
Before 248 0.479 0.361 0.118 0.223 262 26.726 1.782
After 277 0.983 1.043 �0.06 0.314 295 34.882 1.995
p-Value 0.06 0.03 0.35 0.04 0.00 0.00
Earliest feasible liberalization events, matched pairs (V)
Before 186 0.598 0.474 0.124 0.338 195 27.259 1.818
After 186 1.385 1.129 0.256 0.479 195 35.137 1.987
p-Value 0.06 0.05 0.08 0.05 0.00 0.04
ADR or closed-end fund listing events (II)
Before 255 0.509 0.434 0.075 0.384 283 27.046 1.764
After 279 0.930 0.808 0.122 0.517 299 35.629 1.979
p-Value 0.08 0.09 0.11 0.04 0.00 0.00
‘‘Old’’ analysts are those who, for the particular liberalization or listing event, were supplying forecasts both before and
after the event. The affiliation of each analyst is determined by the I/B/E/S Translations File. The table reports averages
for each variable. Inference drawn from (unreported) medians is very similar.

422 K.-H. Bae et al. / Journal of International Money and Finance 25 (2006) 404e428
have access to a variety of governance-related variables, such as foreign ownership andbusiness group affiliation, that have been used by previous researchers (Bae et al., 2002;Baek et al., 2004; Joh, 2003) and, as documented below, can help us understand interactionsbetween governance and the firm’s information environment. In particular, Korea’s businessgroups, referred to as chaebol, are thought to have substantial implications for governanceand performance. We use the Korea Securities Research Institute (KSRI) database for stockreturns and the Listed Company Database of the Korean Listed Companies Association forfinancial statements and ownership information.
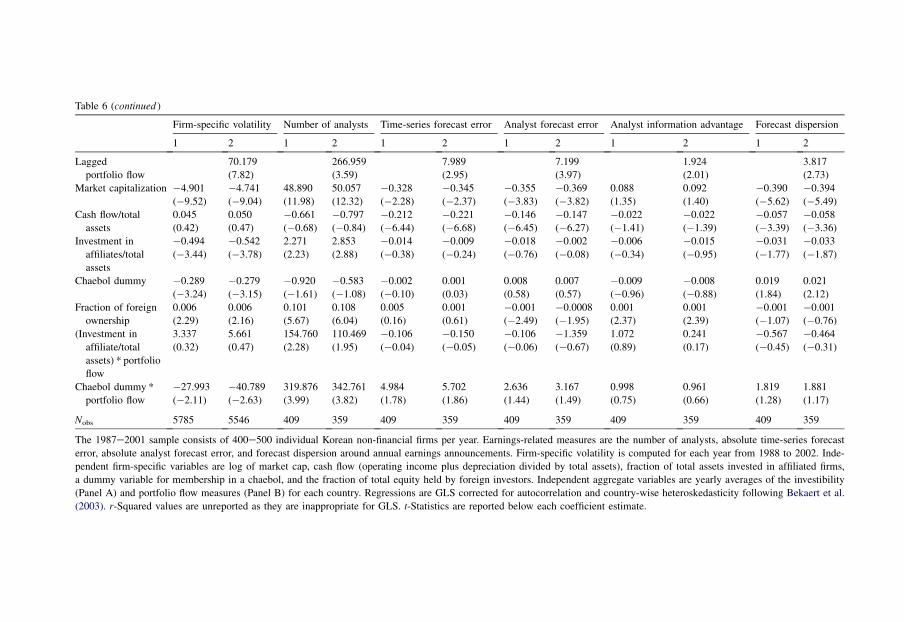
We estimate GLS regressions of individual firm information variables (that is, the firm-specific volatility and the earnings-related measures) on openness variables and firm characteris-tics.14 From all Korean firms listed during 1987e2001, we select non-financial firms with fiscalyear ending in December. This yields approximately 400e500 firms for each sample year. Foreach firm-year, we compute individual firm information variables and the following firm-spe-cific characteristic variables: the log of market cap, cash flow (operating income plus depreci-ation divided by total assets), the fraction of total assets invested in affiliated firms, a dummyvariable for membership in a chaebol business group, and the fraction of total equity held byforeign investors. These data are then merged with the annual portfolio flow and investibilitymeasures. The regression specifications also include interactive explanatory variables. Theyare investment in affiliates (converted to a dummy variable to identify firms that rank abovethe median on this measure) or chaebol dummy times either the investibility or portfolioflow measures of openness. Previous research suggests that poorly governed firms may discloseless useful information. Alternatively, listed firms that comprise a complex collection of busi-nesses or opaque control structures may be more difficult for financial analysts and other invest-ment professionals to understand.
Panel A of Table 6 reports pooled time-series cross-sectional regressions of individual firm-specific volatility on (contemporaneous or lagged) annual investibility. The results are consis-tent with our predictions and with our earlier results on aggregated variables. The individualfirm-specific volatility is very strongly positively correlated with the contemporaneous andlagged investibility measures (H2). The individual firm earnings-related measures are also typ-ically significantly positively correlated with contemporaneous and lagged investibility: Greateropenness appears to increase the number of analysts (H1), the informativeness of earnings re-leases (H3), the value-added by analysts (H4), and forecast dispersion (H5b).
There are also associations between information measures and firm characteristics. Firm-specific volatility is typically smaller for large-cap firms,15 when holdings of shares of affiliatedfirms are substantial, or for firms that are chaebol members. This is sensible: previous authorshave shown that such firms are more likely to suffer from relatively poor governance and dis-closure. In contrast, firm-specific volatility is higher when foreign ownership is higher, suggest-ing that foreign owners produce (or demand) more firm-specific information. Among theearnings-related variables, large market cap is associated with more analysts, smaller time se-ries and analyst forecast errors and forecast dispersion. Higher profitability (that is, cash flow
14 The use of the same investibility and flow variables for each firm can bias t-statistics upward because the same ob-
servations of explanatory variables enter the regressions many times while regression analysis assumes that every time
they enter they provide new information.15 As noted previously, relatively large firms comprise a relatively large fraction of aggregate stock market capitaliza-
tion and, therefore, their firm-specific volatility may be biased downward. In results on individual Korean firms, we
attempt to control for this by including the log of the square of the individual firm’s proportion in the Korean market
capitalization as an explanatory variable. Results are robust to this control.

ctive variables
rror Analyst information advantage Forecast dispersion
1 2 1 2
�0.272
(�1.29)
�0.269
(�1.27)
1.344
(5.99)
1.333
(5.73)
0.124
(2.69)
0.479
(3.02)
0.104
(2.26)
0.378
(1.87)
2
4)
0.086
(1.31)
0.087
(1.31)
�0.407
(�5.83)
�0.402
(�5.53)
1
1)
�0.022
(�1.37)
�0.028
(�1.77)
�0.058
(�3.41)
�0.063
(�3.62)
2
6)
�0.016
(�1.03)
�0.021
(�1.47)
�0.028
(�1.74)
�0.037
(�2.30)
�0.006
(�0.70)
�0.004
(�0.50)
0.023
(2.63)
0.024
(2.81)
1
0)
0.001
(2.44)
0.001
(2.84)
0.001
(�0.57)
0.001
(�0.47)
6
1)
0.002
(0.15)
0.012
(0.61)
�0.011
(�0.66)
�0.001
(�0.01)
0.007
(0.45)
0.002
(0.14)
0.207
(1.85)
0.247
(1.99)
505 486 505 486
�0.283
(�1.34)
�0.292
(�1.38)
1.284
(5.76)
1.299
(5.65)
1.777
(1.94)
4.008
(3.25)
(continued on next page)
Table 6
Regressions of individual Korean firm-specific volatility on investibility, portfolio flow, firm characteristics, and intera
Firm-specific volatility Number of analysts Time-series forecast error Analyst forecast e
1 2 1 2 1 2 1 2
Panel A: Investibility proxy for openness
Intercept 16.832
(10.37)
16.468
(10.12)
�149.118
(�11.36)
�155.800
(�11.65)
1.237
(2.66)
1.185
(2.51)
1.274
(4.25)
1.233
(3.98)
Investibility 0.921
(8.75)
2.821
(3.14)
0.092
(2.97)
0.085
(4.12)
Lagged investibility 1.570
(12.47)
3.202
(2.92)
0.073
(1.88)
0.099
(3.76)
Market capitalization �4.853
(�9.47)
�4.747
(�9.23)
47.229
(11.52)
49.362
(11.82)
�0.374
(�2.58)
�0.354
(�2.40)
�0.386
(�4.13)
�0.37
(�3.8
Cash flow/total assets 0.043
(0.40)
0.091
(0.86)
�1.004
(�1.03)
�1.183
(�1.22)
�0.223
(�6.73)
�0.235
(�7.04)
�0.147
(�6.40)
�0.15
(�6.5
Investment in
affiliates/total assets
�0.489
(�3.74)
�0.678
(�5.29)
2.970
(3.21)
3.144
(3.45)
�0.007
(�0.19)
�0.021
(�0.66)
0.000
(0.02)
�0.01
(�0.5
Chaebol dummy �0.246
(�3.15)
�0.253
(�3.30)
�0.395
(�0.80)
0.036
(0.07)
0.007
(0.38)
0.013
(0.78)
0.011
(0.99)
0.015
(1.32)
Fraction of foreign
ownership
0.006
(2.33)
0.005
(1.84)
0.113
(6.39)
0.118
(6.45)
0.001
(0.74)
0.001
(1.01)
�0.001
(�1.82)
�0.00
(�1.8
(Investment in
affiliate/total
assets) *
Investibility
0.039
(0.28)
0.247
(1.43)
1.972
(2.44)
1.826
(2.18)
�0.001
(�0.03)
0.031
(0.67)
�0.020
(�0.88)
�0.00
(�0.2
Chaebol
dummy *
Investibility
�0.0648
(�3.63)
�0.775
(�3.57)
3.148
(2.94)
3.349
(3.11)
0.065
(1.94)
0.058
(1.87)
0.036
(1.53)
0.032
(1.07)
Nobs 5785 5546 505 486 505 486 505 486
Panel B: Portfolio flow proxy for openness
Intercept 16.983
(10.41)
16.480
(9.93)
�154.619
(�11.82)
�158.370
(�12.17)
1.077
(2.33)
1.139
(2.44)
1.167
(3.93)
1.214
(3.92)
Portfolio
flow
52.366
(6.75)
217.322
(3.27)
8.496
(3.52)
6.810
(4.35)
recast error Analyst information advantage Forecast dispersion
2 1 2 1 2
7.199
(3.97)
1.924
(2.01)
3.817
(2.73)
�0.369
(�3.82)
0.088
(1.35)
0.092
(1.40)
�0.390
(�5.62)
�0.394
(�5.49)
�0.147
(�6.27)
�0.022
(�1.41)
�0.022
(�1.39)
�0.057
(�3.39)
�0.058
(�3.36)
�0.002
(�0.08)
�0.006
(�0.34)
�0.015
(�0.95)
�0.031
(�1.77)
�0.033
(�1.87)
0.007
(0.57)
�0.009
(�0.96)
�0.008
(�0.88)
0.019
(1.84)
0.021
(2.12)
�0.0008
(�1.95)
0.001
(2.37)
0.001
(2.39)
�0.001
(�1.07)
�0.001
(�0.76)
�1.359
(�0.67)
1.072
(0.89)
0.241
(0.17)
�0.567
(�0.45)
�0.464
(�0.31)
3.167
(1.49)
0.998
(0.75)
0.961
(0.66)
1.819
(1.28)
1.881
(1.17)
359 409 359 409 359
d measures are the number of analysts, absolute time-series forecast
ecific volatility is computed for each year from 1988 to 2002. Inde-
by total assets), fraction of total assets invested in affiliated firms,
ependent aggregate variables are yearly averages of the investibility
relation and country-wise heteroskedasticity following Bekaert et al.
h coefficient estimate.
Table 6 (continued )
Firm-specific volatility Number of analysts Time-series forecast error Analyst fo
1 2 1 2 1 2 1
Lagged
portfolio flow
70.179
(7.82)
266.959
(3.59)
7.989
(2.95)
Market capitalization �4.901
(�9.52)
�4.741
(�9.04)
48.890
(11.98)
50.057
(12.32)
�0.328
(�2.28)
�0.345
(�2.37)
�0.355
(�3.83)
Cash flow/total
assets
0.045
(0.42)
0.050
(0.47)
�0.661
(�0.68)
�0.797
(�0.84)
�0.212
(�6.44)
�0.221
(�6.68)
�0.146
(�6.45)
Investment in
affiliates/total
assets
�0.494
(�3.44)
�0.542
(�3.78)
2.271
(2.23)
2.853
(2.88)
�0.014
(�0.38)
�0.009
(�0.24)
�0.018
(�0.76)
Chaebol dummy �0.289
(�3.24)
�0.279
(�3.15)
�0.920
(�1.61)
�0.583
(�1.08)
�0.002
(�0.10)
0.001
(0.03)
0.008
(0.58)
Fraction of foreign
ownership
0.006
(2.29)
0.006
(2.16)
0.101
(5.67)
0.108
(6.04)
0.005
(0.16)
0.001
(0.61)
�0.001
(�2.49)
(Investment in
affiliate/total
assets) * portfolio
flow
3.337
(0.32)
5.661
(0.47)
154.760
(2.28)
110.469
(1.95)
�0.106
(�0.04)
�0.150
(�0.05)
�0.106
(�0.06)
Chaebol dummy *
portfolio flow
�27.993
(�2.11)
�40.789
(�2.63)
319.876
(3.99)
342.761
(3.82)
4.984
(1.78)
5.702
(1.86)
2.636
(1.44)
Nobs 5785 5546 409 359 409 359 409
The 1987e2001 sample consists of 400e500 individual Korean non-financial firms per year. Earnings-relate
error, absolute analyst forecast error, and forecast dispersion around annual earnings announcements. Firm-sp
pendent firm-specific variables are log of market cap, cash flow (operating income plus depreciation divided
a dummy variable for membership in a chaebol, and the fraction of total equity held by foreign investors. Ind
(Panel A) and portfolio flow measures (Panel B) for each country. Regressions are GLS corrected for autocor
(2003). r-Squared values are unreported as they are inappropriate for GLS. t-Statistics are reported below eac

425K.-H. Bae et al. / Journal of International Money and Finance 25 (2006) 404e428
divided by assets) is associated with smaller time series and analyst forecast errors and forecastdispersion. Larger foreign ownership is correlated with more analysts, suggesting that the ben-eficial impact of openness is magnified for those firms that are heavily covered in response toforeign investor interest.
There are also interesting associations between openness, information, and governance as in-dicated by the slopes of the interactive terms. For firm-specific volatility, the negative slope coef-ficient on the chaebol dummy times openness term indicates that the impact of increased opennesson the production of firm-specific information is more muted for chaebol group members.For number of analysts, the slope coefficients on the interactive terms for both affiliated invest-ments and chaebol are significantly positive, suggesting that increased openness attracts more an-alysts for chaebol member firms. Interestingly, for the time-series forecast error, the slope onchaebol * investibility is positive, which is consistent with improvement in the informativenessof earnings (H3a) for chaebol related firms.16 Panel B of Table 6 reports similar regressions inwhich U.S. portfolio flow serves as the ‘‘openness’’ independent variable, rather than investibility.
There are several potential explanations for these results. Companies ranking poorly on gov-ernance (chaebol member firms) attract more attention (number of analysts) but experience lessof an improvement in information environment (firm-specific volatility) when openness in-creases. For example, Hamao et al. (2002) find that the firm-specific volatility of Japanese firmsthat are kereitsu group members or that maintain a ‘‘main bank’’ relationship is less sensitive tomacroeconomic ups and downs, suggesting that group or bank relationships shield a firm fromeconomic fluctuations. It may be the case that groups of poorly governed firms cooperate toweaken the value of disclosure to shield their true performance, in addition to providing directeconomic support to group members. Alternatively, firms with high affiliate investment or chae-bol membership are more complex and merely more difficult for the analysts and markets tounderstand. Our results suggest that market openness seems to motivate analyst coverage forthese firms. However, the beneficial impact on the firm’s information environment is not as ev-ident as for those simple non-chaebol member firms.17
5. Summary and conclusions
We have uncovered interesting associations between the state of the information environ-ment and the degree of openness to foreign equity investment across a sample of emergingmarkets. Some highlights are as follows. Openness events such as official liberalizations,cross-listing of shares overseas, or the listing of a closed-end country fund are associatedwith increases in firm-specific volatility and most earnings-related proxies for the informationenvironment. In particular, earnings management is less prevalent, earnings are less smoothand, therefore, more difficult to forecast, analysts produce more forecasts per earnings event,and pre-announcement forecast dispersion is greater. Changes in the number of analysts andthe nature of their output seem larger for foreign analysts. Different facets of the informationenvironment respond differently to changes in the degree of openness versus the actual extentof foreign equity flows across an emerging economy’s borders. Results on individual Koreanfirms indicate that the effect of increased openness on the quality of the information
16 Interestingly, unreported results test whether individual firm cross-listing in the U.S. or U.K. have a similar impact,
but the results are largely insignificant.17 We control for firm size with the log market capitalization, but correlation between size, affiliate investments, and
chaebol membership may complicate our results.

426 K.-H. Bae et al. / Journal of International Money and Finance 25 (2006) 404e428
environment is muted for firms that score poorly on governance indicators, even though they dodraw relatively more analyst coverage with increased openness.
By employing a variety of proxies for different aspects of the information environment, weenjoy a detailed look at changes in many facets of that environment. For example, we can viewincreases in the number of analysts as an increase in the ‘‘inputs’’ to the information productionprocess. Changes in forecast dispersion, forecast errors, analyst information advantage, and thefrequency of forecast revision are ‘‘outputs’’ related to a specific type of information event,earnings news. Changes in the firm-specific volatility reflect the impact on a more general mea-sure of how information is incorporated into firm value. Changes in openness appear to affectdifferent aspects of the information environment differently. For example, changes in the num-ber of analysts may precede or predict changes in openness while other information environ-ment measures appear to be a consequence of openness. Across our sample of individualKorean firms, openness may prompt more input to information production (the number of an-alysts) but yield less potent output (forecast errors) for firms that may be poorly governed ordifficult for analysts to figure out.
Of course, openness may follow changes in the information environment, rather than trigger-ing changes in the information environment as we theorize. As more information about firms inan emerging market becomes available, foreign demand for local stocks increases and putspressure on local authorities to loosen access. Furthermore, information production may antic-ipate, rather than follow, increases in openness. Thus, our results should be treated with cautionbecause of possible endogeneity. Our own preliminary tests (unreported but available upon re-quest) stack a pair of variables, an information variable and an openness variable, in a vectorautoregression model to determine the leadelag associations, but the results are inconclusive.Applying more powerful econometrics techniques and seeking more imaginative instruments isa challenge for future research on the impact of liberalizations.
Clearly, liberalization and other acts of opening to foreign equity investors have an impact onthe information environment. It is particularly interesting to note the particularly large changesattributed to foreign analysts who increase their presence, activity, and contribution after open-ness increases. Thus, we have succeeded in documenting another facet of the impact of the tran-sition of emerging stock markets to integration with the global capital market. Opening to foreignportfolio investors does not just lower the cost of capital but also alters the local environment fordisclosure, information production, and the analysis and use of information, and draws foreignresources, effort, and skill into the capital market. Indeed, beneficial changes in the informationenvironment, in addition to facilitating cross-border risk sharing, may contribute to the lower costof capital after liberalizations and cross-listings documented by previous authors.
References
Admati, A., Pfleiderer, P., 2000. Forcing firms to talk: financial disclosure and externalities. Review of Financial Studies
13 (3), 479e520.
Bae, K.H., Chan, K., Ng, A., 2004. Investibility and return volatility. Journal of Financial Economics 71 (2), 239e263.
Bae, K.H., Kang, J.K., Kim, J.M., 2002. Tunneling or value added: evidence from mergers by Korean business groups.
Journal of Finance 57 (6), 2695e2740.
Baek, J.S., Kang, J.K., Park, K.S., 2004. Corporate governance and firm value: evidence from the Korean financial
crisis. Journal of Financial Economics 71 (2), 265e314.
Bailey, W., Chung, Y.P., Kang, J.K., 1996. Investment restrictions and the pricing of Korean convertible eurobonds.
Pacific Basin Finance Journal 4 (1), 93e111.

427K.-H. Bae et al. / Journal of International Money and Finance 25 (2006) 404e428
Bailey, W., Chung, Y.P., Kang, J.K., 1999. Foreign ownership restrictions and equity price premiums: what drives the
demand for cross-border investments? Journal of Financial and Quantitative Analysis 34 (4), 489e512.
Bailey, W., Karolyi, G.A., Salva, C. The economic consequences of increased disclosure: evidence from international
cross-listings. Journal of Financial Economics, in press.
Bailey, W., Li, H., Mao, C.X., Zhong, R., 2003. Regulation fair disclosure and earnings information: market, analyst,
and corporate responses. Journal of Finance 58 (6), 2487e2514.
Baker, W.K., Nofsinger, J., Weaver, D., 2002. International cross-listing and visibility. Journal of Financial and Quan-
titative Analysis 37 (3), 495e521.
Ball, R., Kothari, S.P., Robin, A., 2000. An extension of the effect of international institutional factors on the properties
of accounting earnings. Journal of Accounting and Economics 29 (1), 1e51.
Bekaert, G., Harvey, C., 2002. A chronology of important economic, financial, and political events in emerging markets.
http://www.duke.edu/~charvey/chronology.htm.
Bekaert, G., Harvey, C., 2000. Foreign speculators and emerging equity markets. Journal of Finance 55 (2), 565e613.
Bekaert, G., Urias, M., 1996. Diversification, integration, and emerging market closed-end funds. Journal of Finance 51
(3), 835e870.
Bekaert, G., Harvey, C., Lundblad, C., 2003. Equity market liberalization in emerging markets. Working paper, Duke
University, Durham, NC.
Bhattacharya, U., Daouk, H., Welker, M., 2004. The world price of earnings opacity. The Accounting Review 78 (3),
641e678.
Djankov, S., La Porta, R., Lopez de Silano, F., Shleifer, A., 2002. Courts: the Lex Mundi Project. Working paper, Har-
vard University, Boston, MA.
Doidge, C., 2004. U.S. cross-listings and the private benefits of control: evidence from dual-class firms. Journal of Fi-
nancial Economics 72 (3), 519e553.
Doidge, C., Karolyi, G.A., Stulz, R., 2004. Why are foreign firms listed in the U.S. worth more? Journal of Financial
Economics 71 (2), 205e238.
Durnev, A., Morck, R., Yeung, B., 2004. Value-enhancing capital budgeting and firm-specific stock return variation.
Journal of Finance 59 (1), 65e105.
Durnev, A., Morck, R., Yeung, B., Zarowin, P., 2003. Does greater firm-specific return variation mean more or less in-
formed stock pricing? Journal of Accounting Research 41 (5), 797e836.
Errunza, V., Miller, D., 2000. Market segmentation and the cost of capital in international equity markets. Journal of
Financial and Quantitative Analysis 35 (4), 577e600.
Foerster, S., Karolyi, G.A., 1999. The effects of market segmentation and illiquidity on asset prices: evidence from for-
eign stocks listing in the U.S. Journal of Finance 54 (3), 981e1013.
Hamao, Y., Mei, J.P., Xu, Y., 2002. Idiosyncratic risk and creative destruction in Japan. Working paper, University of
Southern California, Los Angeles, CA.
Harris, M., Raviv, A., 1993. Differences of opinion make a horse race. Review of Financial Studies 6 (3), 473e506.
Henry, P., 2000. Stock market liberalization, economic reform, and emerging market equity prices. Journal of Finance
55 (2), 529e564.
Joh, S.W., 2003. Corporate governance and firm profitability: evidence from Korea before the economic crisis. Journal
of Financial Economics 68 (2), 287e322.
Kim, O., Verrecchia, R., 1991. Market reaction to anticipated announcements. Journal of Financial Economics 30 (2),
273e310.
Kim, O., Verrecchia, R., 1994. Market liquidity and volume around earnings announcements. Journal of Accounting and
Economics 17 (1e2), 41e67.
Lang, M., Lins, K., Miller, D., 2003. ADRs, analysts, and accuracy: does cross listing in the U.S. improve a firm’s in-
formation environment and increase market value? Journal of Accounting Research 41 (2), 317e346.
La Porta, Rafael, Lopez-de-Silanes, Florencio, Shleifer, Andre, Vishny, Robert W., 1998. Law and Finance. Journal of
Political Economy 106, 1113e1155.
Leuz, C., Nanda, D., Wysocki, P., 2003. Earnings management and investor protection: an international comparison.
Journal of Financial Economics 69 (3), 505e528.
Li, K., Morck, R., Yang, F., Yeung, B. Firm-specific variation and openness in emerging markets. Review of Economics
and Statistics, in press.
Miller, D., 1999. The market reaction to international cross-listings: evidence from depositary receipts. Journal of Fi-
nancial Economics 51 (1), 103e123.
Morck, R., Yeung, B., Yu, W., 2000. The information content of stock markets: why do emerging markets have syn-
chronous stock price movements? Journal of Financial Economics 58 (1e2), 215e260.

428 K.-H. Bae et al. / Journal of International Money and Finance 25 (2006) 404e428
Obstfeld, M., 1998. The global capital market: benefactor or menace? Journal of Economic Perspectives 12 (4), 9e30.
Patro, D., 2002. Stock market liberalization and emerging market country fund premiums. Journal of Business 78 (1),
135e168.
Roll, R., 1988. R2. Journal of Finance 43 (3), 541e566.
Stulz, R., 1999. Globalization of capital markets and the cost of capital. Journal of Applied Corporate Finance 12 (3),
8e25.
Wurgler, J., 2000. Financial markets and the allocation of capital. Journal of Financial Economics 58 (1e2), 187e214.
Xu, Y., Malkiel, B., 2003. Investigating the behavior of idiosyncratic volatility. Journal of Business 76 (4), 613e644.