stochastic analysis of the electromagnetic induction
TRANSCRIPT

Stochastic Analysis of the ElectromagneticInduction Effect on a Neuron's Action PotentialDynamicsAnte Lojic Kapetanovic ( [email protected] )
University of Split: Sveuciliste u Splitu https://orcid.org/0000-0001-5507-5788Anna Susnjara
University of Split: Sveuciliste u SplituDragan Poljak
University of Split: Sveuciliste u Splitu
Research Article
Keywords: conductance-based neuron model, memristor coupling, electromagnetic induction, uncertaintyquantication, stochastic sensitivity analysis
Posted Date: March 8th, 2021
DOI: https://doi.org/10.21203/rs.3.rs-280952/v1
License: This work is licensed under a Creative Commons Attribution 4.0 International License. Read Full License
Version of Record: A version of this preprint was published at Nonlinear Dynamics on August 7th, 2021.See the published version at https://doi.org/10.1007/s11071-021-06762-z.

Nonlinear Dynamics manuscript No.(will be inserted by the editor)
Stochastic analysis of the electromagnetic induction effect on a neuron’saction potential dynamics
Ante Lojic Kapetanovic · Anna Šušnjara · Dragan Poljak
Received: date / Accepted: date
Abstract This paper examines the effect of electromagneticinduction on the electrophysiology of a single cortex neuronthrough two different modes associated with the nature of theexternal neuronal stimulus. By using the recently extendedinduction-based variant of the well-known and biologicallyplausible Hodgkin-Huxley neuron model, bifurcation analy-sis is performed. Electromagnetic induction caused by mag-netic flux is captured using a polynomial approximation ofa memristor embedded into the neuron model. In order todetermine true influence of the variability of ion channelsconductivity, the stochastic sensitivity analysis is performedpost hoc. Additionally, numerical simulations are enrichedwith uncertainty quantification, observing values of ion chan-nels conductivity as random variables. The aim of the studyis to computationally determine the sensitivity of the actionpotential dynamics with respect to the changes in conduc-tivity of each ion channel so that the future experimentalprocedures, most often medical treatments, may be adaptedto different individuals in various environmental conditions.
A. L. KapetanovicE-mail: [email protected] of Electronics and ComputingUniversity of SplitRudera Boskovica 3221000 Split, Croatia
A. ŠušnjaraDepartment of Electronics and ComputingUniversity of SplitRudera Boskovica 3221000 Split, Croatia
D. PoljakDepartment of Electronics and ComputingUniversity of SplitRudera Boskovica 3221000 Split, Croatia
Keywords conductance-based neuron model · memristorcoupling · electromagnetic induction · uncertaintyquantification · stochastic sensitivity analysis
1 Introduction
The electromagnetic influence on human tissue and organs ismost often observed through two frameworks: low frequencyeffects on the nervous system (a change in the action poten-tial dynamics of the neuronal membrane) and thus on brainmetabolism, and radiofrequency thermal effects. Recentlypublished guidelines for limiting exposure to electromag-netic fields by International Commission on Non-IonizingRadiation Protection (ICNIRP) [18] state that the only ef-fect at frequencies of 10 MHz or higher is human or organheating, though some authors claim that even on such highfrequencies, given that the incident power density is suffi-ciently low, it is possible to observe ultrasonic vibrationsin the membrane of a neuron as a result of interaction withelectromagnetic radiation [44], which is supported experi-mentally [36]. However, the most of the literature definesclear boundaries between the influence of low-frequency ra-diation (up to 100 kHz) and radiofrequency radiation (100kHz to 300 GHz), where for the range from 100 kHz to 10MHz, the possibility of influence of neuronal stimulation andtissue heating both exists [39]. In summary, as the radiationfrequency increases, heating effects predominate and the like-lihood of nerve stimulation decreases. A detailed review ofneurobehavior during exposure to low-frequency electric andmagnetic fields is given in [17]. In this paper, we are concen-trated on the effects of time-varying magnetic fields wherethe main interaction is the Faraday induction of electricalfields and associated currents, the value of which dependson the tissue configuration, orientation and conductivity. Theelectro-stimulation of a neuron, the electrical polarization

2 Ante Lojic Kapetanovic et al.
of presynaptic processes leading to a change in post synap-tic cell activity, is examined using a computational neuronmodel extended with an additive variable which is capableof capturing the effect of electromagnetic induction.
Extensive research has been carried out w.r.t. magneticstimulation of a neuron and neuronal network through clini-cal studies and computer simulations, respectively [3, 34, 35].The treatment of the neurodegenerative diseases in the con-text of electromagnetic induction is also discussed, e.g., forAlzheimer disease [4], and for epilepsy [10]. The effective-ness of electromagnetic stimulation in the treatment of mentalillnesses is computationally assessed in [23] through the reg-ulatory abilities of the external electromagnetic stimulationon the pattern dynamics of neuronal networks.
Much effort has been invested in realization of very pre-cise numerical models of a neuron as well, from simplemodels such as integrate-and-fire [15] and associated ex-tensions [9, 19, 45], over more bio-physically realistic mod-els such as Hodgkin-Huxley neuron model [16] and its re-spective simplifications, e.g., FitzHugh-Nagumo model [11],Morris-Lecar model [31], Hindmarsh-Rose model [37], tocompletely theoretical models such as Wilson polynomialmodel [51] and Izhikevich model [20].
In addition to an external source, the change of concentra-tion of ions in a neuron cell could also lead to the occurrenceof electromagnetic induction. This phenomena is inspectedin [29], where authors introduce the four-variable Hindmarsh-Rose neuron model with an additive variable used in order toobtain feedback memrisitve current, which directly dependson the variation of magnetic flow. The previously outlinedwork is further improved in [28], where the electrical neu-ronal activity mode transition is investigated by applyingexternal electromagnetic radiation on the improved three-variable Hindmarsh-Rose neuron model. Furthermore, theeffect of electromagnetic induction, described by the modula-tion of magnetic flux on the membrane potential of a neuron,realized using memristor coupling together with an additivephase noise imposed on the neuron in order to detect the dy-namical response and phase transition mode, is investigatedin [53]. Authors in [30] have carried out an extensive reviewof all relevant literature considering dynamics in a neuronand neuronal network, paying special attention to realizationof a computational model under the effect of electromagneticinduction and/or radiation in order to better understand theelectromagnetic effect in treating neurodegenerative diseases.The dynamics of the action potential of a neuron under theelectromagnetic induction is shown to be greatly dependanton the environmental surrounding temperature in [27] us-ing the extended induction-based Hodgkin-Huxley neuronmodel, similar to that used in this paper. The temperatureinfluence is previously verified in the clinical study, wheretemperature effects are examined in rat hypothalamic tissueslices [59]. The action potential of a neuron largely depends
on the stimulus itself, especially if the noise is present [33].Recently, many studies have been carried out, where boththe presence of noise and the electromagnetic induction isobserved through dynamical analysis framework for a singleneuron [24, 26, 50] and neural networks [14, 25, 56]. Often-times, realistic neurons hold complex anatomical structure,for instance, autapse connection to some internuncial neu-rons. The autaptic regulation of electrical activity modes ina neuron under the effect of electromagnetic induction isinvestigated in [57]. The complexity of a neuron can alsobe observed through its electrical properties – a neuron isa charged body where any changes in fluctuation of eithermagnetic flux or electric charge can cause field variationand thus the variation in electrical properties of a neuron. Anovel neuron model, able to capture the effect of the totalelectromagnetic field, is developed and described by dimen-sionless dynamical system and is verified on analog circuitplatform [52]. Another important factor, the energy, is inves-tigated in [58], where authors analyze the role of the energysupply in brain metabolism and signal transmission by usingIzhikevich neuron model in the presence of electromagneticfield. Ion channels conductivity is large impact factor on theoverall electrical behaviour of a neuron as well [40, 41].
All previously outlined model variants of a single neuronand neuronal network have a common purpose – reliabilityand interpretability of the output where the greatest atten-tion is usually paid to nonlinear dynamical analysis throughbifurcation or phase graphs to determine the influence ofvarious factors (radiation, induction, noise, temperature) onthe dynamics of the action potential on the membrane andconsequently to gain insight on the coding and informationtransfer, brain metabolism, potential treatments for neurode-generative disorders, etc. However, a large impact of error,i.e. uncertainties, in parameter space and initial conditionsis often neglected and all relevant papers published in thefield of neural nonlinear dynamics and computational neu-roscience, to the best of our knowledge, take the values ofinput parameters as constants. In this paper, by consideringconductivity values of each ion channel in Hodgkin-Huxleyneuron model as a random variable uniformly distributedaround the expected value, the original deterministic systemis recasted to stochastic system [54]. The expected values ofion channels conductivity are taken from the review study byMa et al. in [30]. The stochastic collocation method is usedas a method of choice for uncertainty quantification becauseof its non-intrusive nature – no requirements for intrinsic sys-tem formulation perturbation and manual interventions areneeded. By computationally assessing the sensitivity of theaction potential dynamics and the inter-spike interval (ISI)duration w.r.t the changes in the conductivity of ion channelsof a neuron exposed to the electromagnetic induction, ex-perimental procedures with magnetic fields, such as medicaltreatments of neurodegenerative diseases with transcranial

Stochastic analysis of the electromagnetic induction effect on a neuron’s action potential dynamics 3
magnetic stimulation or deep stimulation [2], will be possibleto adapt to different individuals in various environmentalconditions.
The outline of the paper is as follows: the formulationof the extended Hudgkin-Huxley neuron model is given inSection 2, numerical simulations and results of bifurcationanalysis for two different types of the external neuronal stimu-lus are given in Section 3, the sensitivity analysis of a neuronmodel electrophysiology by considering ion channels con-ductivity as random variables is given in Section 4, finally,concluding remarks are outlined in Section 5.
2 Formulation
The model of choice in this study is Hodgkin-Huxley neu-ron model [16], originally described as a set of four cou-pled non-linear ordinary differential equations. The greatestsignificance of Hodgkin-Huxley neuron model is that it isbio-physically meaningful (describing the dynamics of mem-brane potential under the influence of some external stimulus,the dynamics of ionic currents, synaptic integration, etc.),measurable and readily available for bifurcation analysis [21].Although Hodgkin-Huxley neuron model is prohibitive andcomputationally expensive, which additionally causes imple-mentation difficulties and extended simulation time, since thefocus of the study is on the electromagnetic effect on a singleneuron, rather than on a neural network, these shortcomingscan be overlooked. In order to capture the electromagneticinduction in a neuron cell governed by the Faraday’s law,an additive variable in a membrane potential equation ofHodgkin-Huxley model is introduced. This variable furtherextends the original model with an additional equation de-scribing the change in the magnetic flux, ϕ . Hodgkin-Huxleyneuron model is then given in the following form [27]:
dVm
dt=
1Cm
(
gKn4(Vm −EK)+ gNam4h(Vm −ENa)
+gL(Vm −EL)+ Iext − kρ(ϕ)Vm
)
(1)
dy
dt= αy(1− y)−βyy, y = (n,m,h) (2)
dϕ
dt= k1Vm − k2ϕ (3)
Equation (1) describes the change of the membrane po-tential, Vm, in time, where Cm stands for the lipid bi-layercapacitance and gK , gNa and gL are maximum values of potas-sium, sodium and leakage ion channel conductivity, respec-tively. EK , ENa and EL are associated reversal potentials forpotassium, sodium and leakage ion channel, respectively.Iext represents the external neuro-stimulus by means of theelectric current source.
The dynamics of gating variables, denoted as y, is out-lined in (2), where αy and βy represent an ion channel gate’s
opening and closing rate, respectively. Each gating variable,y = n for the potassium ion channel, y = m for the sodiumion channel or y = h for the leakage ion channel, has itsactivation and inactivation steady state represented by theBoltzmann equation as a function of the membrane potential,Vm, and the environmental temperature, T , as follows:
αn(Vm,T ) =0.01φ(T )(10−Vm)
e(10−Vm)/10 −1(4)
βn(Vm,T ) = 0.125φ(T )e−Vm/80 (5)
αm(Vm,T ) =0.1φ(T )(25−Vm)
e(25−Vm)/10 −1(6)
βm(Vm,T ) = 4φ(T )e−Vm/18 (7)
αh(Vm,T ) = 0.07φ(T )e−Vm/20 (8)
βh(Vm,T ) =φ(T )
e(30−Vm)/10 +1(9)
where the function governing the environmental temperatureis defined in the following manner:
φ(T ) = 3(T−6.3)/10 (10)
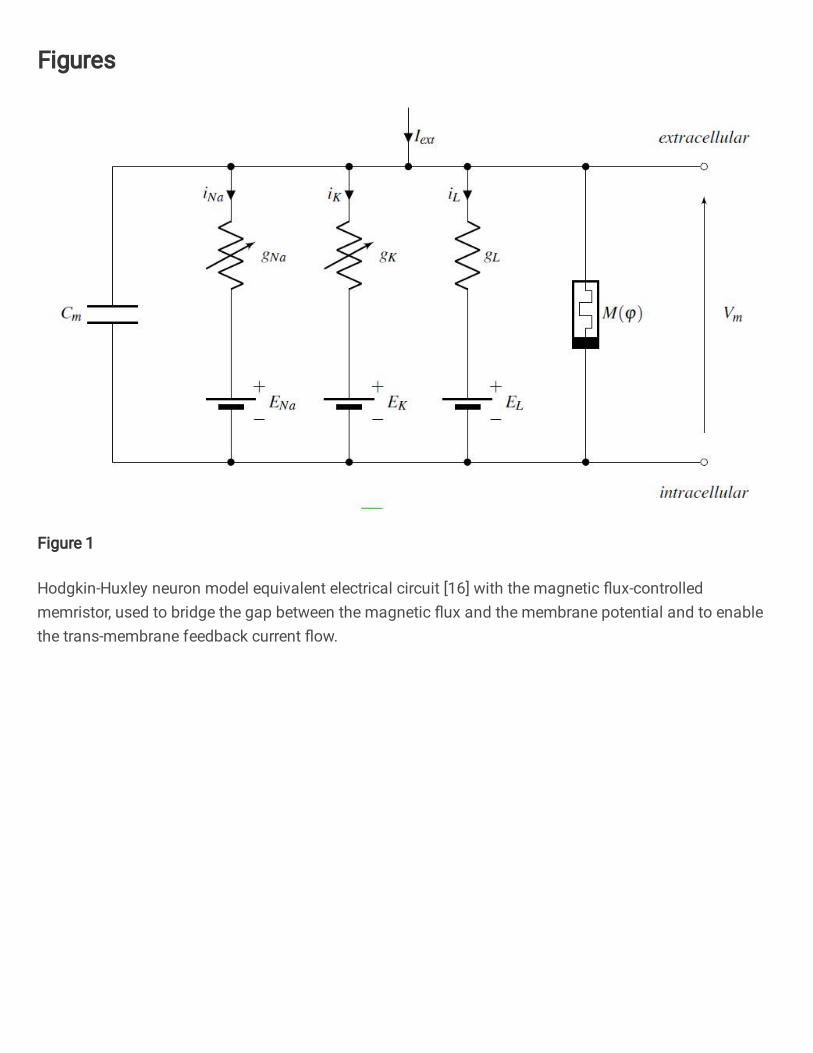
Arising from the Faraday’s law in the Maxwell’s frame-work, the presence of a time-varying magnetic field acrossan electrical conductor will induce a spatially varying non-conservative electric field. Since the neuron cell is electricallyshort when represented by a transmission line model, whichHudgkin-Huxley neuron model intrinsically is, only tempo-ral, rather than spatial variability, needs to be observed. Thus,the feedback current of magnetic flux could be realized byplacing the memristor in parallel in Hodgkin-Huxley neuronmodel equivalent electric circuit, Fig. 1.
Memristor (abbreviation of memory resistor) is a non-linear resistor with memory introduced by Chua in [5] as theforth fundamental electric circuit element that outlines themissing link between the charge, q(t) =
∫ t−∞ i(τ)dτ , and the
magnetic flux, ϕ(t) =∫ t−∞ v(τ)dτ:
dϕ = M(q)dq (11)
where M(q) is the memristance (abbrevation of memristor’sresistance) measured in Ω. Memristor, memristive systemsand possible applications are further elaborated in [6]. Thefirst physical realization of the memristor is achieved in thework by Strukov et al. [48], by constructing a nanoscale-thinfilm device which is equivalent to a time-dependant resistorwhose value at time t is linearly proportional to the amountof charge that has passed through it before. The memristordevice can be modelled as serially connected doped resistor,Ron, and undoped resistor, Ro f f , and its iv characteristic isgiven in a review paper by Joglekar et al. [22] as follows:
i(t) =v(t)
M(q(t))=
v(t)
R0√
1−2η∆Rϕ(t)/(Q0R20)
(12)

4 Ante Lojic Kapetanovic et al.
Cm
gNa
iNa
+
−ENa
gK
iK
+
−EK
gL
iL
+
−EL
M(ϕ)
Iext extracellular
intracellular
Vm
Fig. 1 Hodgkin-Huxley neuron model equivalent electrical circuit [16] with the magnetic flux-controlled memristor, used to bridge the gap betweenthe magnetic flux and the membrane potential and to enable the trans-membrane feedback current flow.
R0 stands for the total resistance at time t = 0 and is formu-lated as:
R0 =w0
DRon +
(
1−w0
D
)
Ro f f (13)
where w0 is the initial length of the doped region and D is thetotal length of the memristor. The polarity of the memristorcan be either η = +1, when the dopant drift expands thedoped region, or η =−1, when the contraction of the dopedregion occurs. Furthermore, ∆R is the difference in resistanceof two regions:
∆R = Ro f f −Ron (14)
Finally, Q0 is the total charge value that is required to passthrough the memristor for the dopant boundary to movethrough the entire length of the memristor, D:
Q0 =D2
µ2Ron
(15)
where the mobility of a dopant is represented as µ .Equation (12) describes the memristor as a purely dis-
sipative electric circuit element in a sense that it does notstore, supply or transmit energy. However, in order to sim-plify the numerical implementation of the memristor, dis-tance ourselves from the physical details of the memristorrealization itself, and ensure seamless simulation process, weassume memristor as a flux-controlled smooth continuouscubic monotone-increasing non-linear function as given inBao et al. [1]:
q(ϕ) = aφ +bφ 3 (16)
where a and b are arbitrary positive parameters. The memduc-tance (abbrevation of memristor’s conductance) measured inS, is defined as:
ρ(ϕ) =dq(ϕ)
dϕ= a+3bϕ2 (17)
−1.00 −0.75 −0.50 −0.25 0.00 0.25 0.50 0.75 1.00v [V]
−0.4
−0.2
0.0
0.2
0.4
i [A]
Bao et al.Joglekar et al.
Fig. 2 Visual representation of the iv characteristic compatibility be-tween the non-linear polynomial approximatin of the memristor givenin Bao et al. [1] and the actual memristor device realization [22] givenin Joglekar et al.
and is embedded in (1) after being scaled by factor k that de-scribes the suppression modulation on the membrane poten-tial [29]. The product term kρ(ϕ)Vm is the additive inductioncurrent posed on the neuron membrane. Parameters a and b
of a non-linear polynomial approximation of the memristorare chosen to be 0.4 and 0.02 as in [27]. To physically justifythe choice of a and b, parameters in 12 are fitted via Nelder-Mead simplex algorithm [32] and the compatibility betweenthe non-linear polynomial approximation of the memristorand the actual iv characteristics of the memristor is shown inFig. 2. The full list of free parameters, the details of the fittingprocedure and the implementation nuances are elaborated inAppendix A.
Finally, equation (3) in Hodgkin-Huxley neuron modeloutlines the dynamics of the magnetic flux, ϕ , where the termk1Vm describes the membrane potential-induced flux changesand the term k2ϕ describes the flux leakage [28].

Stochastic analysis of the electromagnetic induction effect on a neuron’s action potential dynamics 5
3 Numerical simulations
Expected maximum values of ion channel conductivity areset as in [7] as follows: gK = 36.0 mS/cm2, gNa = 120.0mS/cm2 and gL = 0.3 mS/cm2, with the coefficient of vari-ation (CV) of 5, 10 and 20 per cent, respectively. The restof the parameters and the initial condition setup of Hodgkin-Huxley neuron model are given in Table 1.
Numerical solution for all calculations in the study of (1)-(3) is carried out by using the MATLAB® implementation ofnonstiff differential equation solver based on the fourth orderRunge-Kutta integration method [42].
The simulation of an action potential dynamics is carriedout within two different electrical modes in the following twosubsections. The first mode, outlined in Subsection 3.1, isso-called tonic spiking electrical mode [21], where the actionpotential, represented as a time series of discrete, nearlyidentical membrane potential spikes, encode information andcarry it throughout a neuron’s cell. The distribution of ISIsis close to an exponential distribution [8], where the totalentropy is found to be ∼ 2.0. On the other hand, the secondmode, outlined in Subsection 3.2, is so-called tonic burstingelectrical mode [21], where periods of rapid action potentialspiking (bursting) are followed by quiescent periods typicallyof longer duration than the mean ISI. Bursting usually occurseither depending on the type of a neuron and its intrinsicconfiguration or depending on the type of the stimulus. Thisstudy examines the case of the latter – bursting is the responseof a neuron w.r.t. the external noisy stimulus current.
3.1 Tonic spiking electrical mode
The tonic spiking behaviour is achieved by using the externalstimulus direct current (dc) set to Iext(t) = 10 µA/cm2 for acomplete simulation duration of ∆ tsim = 1500 ms. Inductioncoefficient, k, is set to a constant value of k = 0.1, whilethe parameter in the potential-based change of the magneticflux term in (3) is set to k1 = 0.001 and the parameter in themagnetic flux leakage term in (3) is set to k2 = 0.01. This kindof tonic spiking behaviour represents the optimal behaviourof a neuron exposed to the electromagnetic induction effect,where optimality is viewed as the ability to transfer maximuminformation, expressed through the entropy measure. Eventhough, in computational neuroscience literature, entropy isexpressed in different forms for a variety of measured data,more details on the topic can be found elsewhere, e.g., [47],we assume the entropy definition as in the original work byShannon [43]:
H =−n
∑i
p(xi) log(
p(xi))
(18)
where observable xi is the i-th ISI in the simulation. For thepreviously outlined simulation configuration, action potential
dynamics along with the probability mass function of ISIs,captured post-simulation, are shown in Fig. 3.
The effect of the electromagnetic induction is investi-gated via bifurcation analysis where the induction coefficient,k, is taken as the bifurcation parameter. Bifurcation analysisconsisted of a repeated simulation of a fixed-configurationHodgkin-Huxley neuron model at a constant temperature ofT = 10 °C for the induction coefficient ranging from 0 to2. Instead of displaying all ISIs, the expected value of ISI,〈ISI〉, is evaluated. Furthermore, by using a stochastic col-location method, details on the method available elsewhere,e.g., in [55], the output uncertainty by means of 95 per centconfidence interval is determined. The uncertainty comesfrom the fact that we observe the conductance of each ionchannel in Hodgkin-Huxley neuron model as a random vari-able uniformly distributed around its expected value. Thestochastic analysis is performed by using 3, 5, 7 and 9 col-location points in each stochastic dimension, thus leading tothe total of 27, 125, 343 and 729 deterministic simulationsrespectively. Collocation level is changed from 3 to 9 in orderto test the convergence of the stochastic collocation methodand, as shown in Fig. 4, the convergence is satisfying for 5collocation points, which is used for further stochastic anal-ysis. Therefore, a total of 125 deterministic simulations isperformed in order to carry out the uncertainty quantificationand sensitivity analysis by means of stochastic collocationmethod.
Mean ISI over range of k ∈ [0,2] in simulation durationof ∆ tsim = 300 ms using 5 collocation points for CV = 5,10 and 20 per cent is shown in Fig. 5, Fig. 6, and Fig. 7,respectively. All three figures, 5 - 7, show the same exactbehavior of a neuron exposed to the effect of electromagneticinduction: an increase of the induction coefficient leads to adecrease in neuronal activity with the notable values of k inrange from k ∼ 1 to k ∼ 1.5, in which the greatest influenceof the uncertainty of ion channels conductivity is detectable,after which the transition from a spiking state to a quiescentstate occurs.
3.2 Tonic bursting electrical mode
The tonic spiking behaviour is achieved by using the noisyperiodic current set to Iext(t) = 10sin(ωt)+w.n. µA/cm2 asan external stimulus of a neuron for a complete simulationduration of ∆ tsim = 1500 ms. The angular frequency, ω , is setto ω = 100/∆ tsim Hz, and w.n. stands for white noise. Sincethe input is characterized by a large signal-to-noise ratio,compared to the ideal input for the tonic spiking electricalmode, the distribution of ISIs is less like an exponentialdistribution with, as expected, lower value of the entropy.All parameters of Hodgkin-Huxley neuron model along withinduction parameters are set as in the previous simulation

6 Ante Lojic Kapetanovic et al.
Table 1 Hodgkin-Huxley neuron model setup
Parameters
Name or description Label Value
lipid bi-layer conductance Cm 1.0 µF/cm2
potassium channel reversal potential EK −77.0 mVsodium channel reversal potential ENa 50.0 mVleakage channel reversal potential EL −54.387 mVenvironmental temperature T 6.3 °C
Initial conditions
Name or description Label Value
membrane potential value at t = 0 Vm,0 −65.0 mVmagnetic flux value at t = 0 φ0 0.1 mVs
potassium channel gating variable value at t = 0 m0αm(Vm,0,T )
αm(Vm,0,T )+βm(Vm,0,T )
sodium channel gating variable value at t = 0 n0αn(Vm,0,T )
αn(Vm,0,T )+βn(Vm,0,T )
h0αh(Vm,0,T )
αh(Vm,0,T )+βh(Vm,0,T )
0 200 400 600 800 1000 1200 1400−80
−60
−40
−20
0
20
40
V m [m
V]
0 200 400 600 800 1000 1200 1400t [ms]
0
5
10
I ext
[μA/
cm2 ]
12 13 14ISI [ms]
0.00
0.05
0.10
0.15
0.20
0.25
0.30
0.35
0.40
PMF
H=2.0832
Fig. 3 Action potential dynamics, Vm(t), shown in the top left subfigure, for the case of the direct current external stimulus, Iext(t), shown in thebottom left subfigure. Subfigure on the right depicts the probability density histogram (probability mass function) of ISIs, visually resembling anexponential distribution. Entropy amounts to H = 2.0832 for the number of bins determined via the Freedman-Diaconis rule [12].
in which the tonic spiking is achieved. The simulation isdepicted in Fig. 8.
Similar to the previous subsection, bifurcation analysisis performed in order to investigate the effect of electromag-netic induction on a neuron, in this case, stimulated by a noisyperiodic current. In this simulation, environmental tempera-ture is set to T = 6.3 °C. Induction coefficient, ranging from0 to 5 is again set as the bifurcation parameter. Remainingparameters are not changed and the simulation is performedfor 3, 5, 7 and 9 collocation points, respectively. Convergencegraph is shown in Fig. 9.
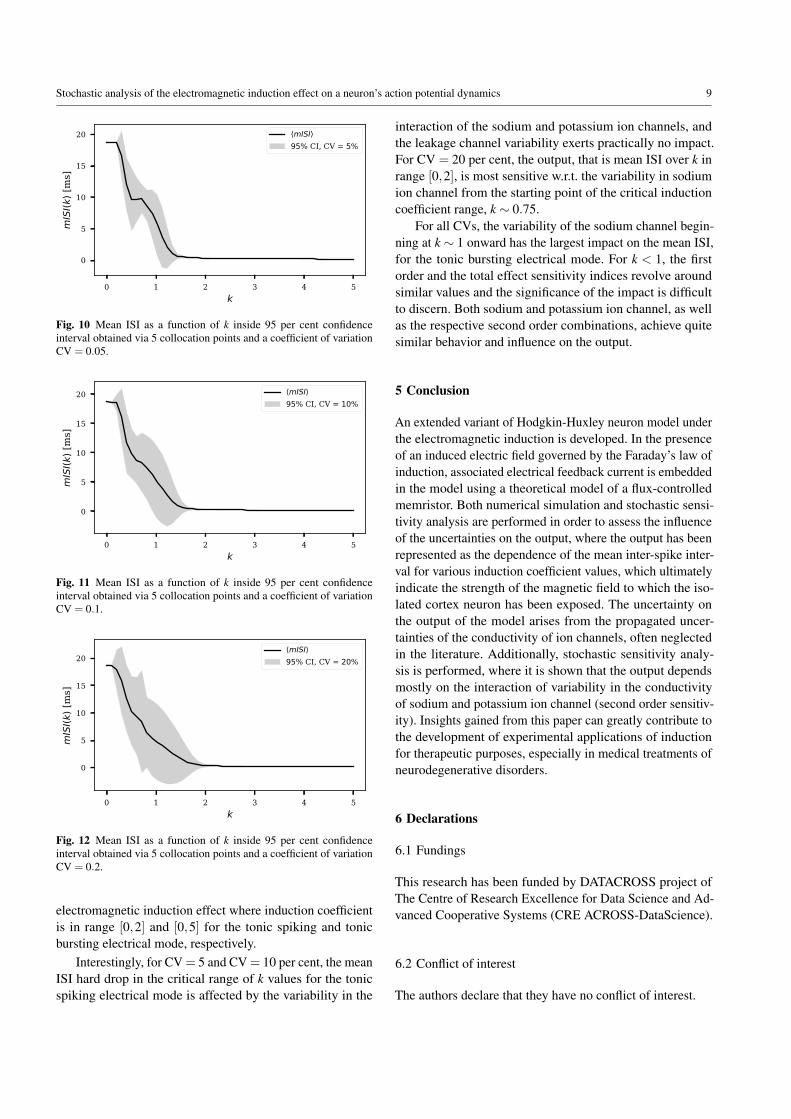
Mean ISI over range of k ∈ [0,5] in simulation durationof ∆ tsim = 300 ms using 5 collocation points for CV = 5, 10and 20 is shown in Fig. 10, Fig. 11, and Fig. 12, respectively.
Again, all three figures, 10 - 12, show the exact behavior ofa neuron exposed to the effect of electromagnetic induction:an increase of the induction coefficient leads to a decreasein neuronal activity. Here, a neuron undergoes two activitytransitions. The first transition occurs at k ∼ 0.5, where abursting state remains unchanged up until k ∼ 0.88. Thesecond transition occurs after a sharp decrease of expectedISI when the neuron passes into a quiscent state at k ∼ 1.5.
4 Sensitivity analysis
Sensitivity analysis ranks input parameters from the mostto the least significant ones with respect to the impact their

Stochastic analysis of the electromagnetic induction effect on a neuron’s action potential dynamics 7
1
2
3
4
5
6
7
mISI(k
) [ms]
CV = 5%⟨mISI⟩, 3 SC points⟨mISI⟩, 5 SC points⟨mISI⟩, 7 SC points⟨mISI⟩, 9 SC points
1
2
3
4
5
6
CV = 10%⟨mISI⟩, 3 SC points⟨mISI⟩, 5 SC points⟨mISI⟩, 7 SC points⟨mISI⟩, 9 SC points
1
2
3
4
5
CV = 20%⟨mISI⟩, 3 SC points⟨mISI⟩, 5 SC points⟨mISI⟩, 7 SC points⟨mISI⟩, 9 SC points
0.00 0.25 0.50 0.75 1.00 1.25 1.50 1.75 2.00k
0.0
0.2
0.4
0.6
0.8
1.0
1.2
1.4
Var(m
ISI)(k) [m
s]
Var(mISI), 3 SC pointsVar(mISI), 5 SC pointsVar(mISI), 7 SC pointsVar(mISI), 9 SC points
0.00 0.25 0.50 0.75 1.00 1.25 1.50 1.75 2.00k
0
1
2
3
4 Var(mISI), 3 SC pointsVar(mISI), 5 SC pointsVar(mISI), 7 SC pointsVar(mISI), 9 SC points
0.00 0.25 0.50 0.75 1.00 1.25 1.50 1.75 2.00k
0
2
4
6
8 Var(mISI), 3 SC pointsVar(mISI), 5 SC pointsVar(mISI), 7 SC pointsVar(mISI), 9 SC points
Fig. 4 Convergence graph for the stochastic collocation method applied on bifurcation analysis of Hodgkin-Huxley neuron model for k ∈ [0,2]. Theconvergence of the mean value for ISI is depicted in the first row, while the convergence for the variance is depicted in the second row for 4 levels ofaccuracy: 3, 5, 7 and 9 collocation points respectively. Each column depicts simulations for a different coefficient of variation, CV = 5, 10 and 20per cent.
0.00 0.25 0.50 0.75 1.00 1.25 1.50 1.75 2.00k
0
1
2
3
4
5
6
7
mISI(k
) [ms]
⟨mISI⟩95% CI, CV = 5%
Fig. 5 Mean ISI as a function of k inside 95 per cent confidence intervalobtained via 5 collocation points and a coefficient of variation CV= 0.05.
0.00 0.25 0.50 0.75 1.00 1.25 1.50 1.75 2.00k
0
2
4
6
8
10
mISI(k
) [ms]
⟨mISI⟩95% CI, CV = 10%
Fig. 6 Mean ISI as a function of k inside 95 per cent confidence intervalobtained via 5 collocation points and a coefficient of variation CV = 0.1.
0.00 0.25 0.50 0.75 1.00 1.25 1.50 1.75 2.00k
0
2
4
6
8
10
mISI(k
) [ms]
⟨mISI⟩95% CI, CV = 20%
Fig. 7 Mean ISI as a function of k inside 95 per cent confidence intervalobtained via 5 collocation points and a coefficient of variation CV = 0.2.
variability has on the total variance of the output of interest.In this work, sensitivity analysis is carried out accordingto a so-called analyis of variance (ANOVA) principle [38].ANOVA is based on a Hoeffding function decompositionand computation of Sobol indices [46]. Namely, the totalvariance due to the variability of all random input parametersis decomposed into terms corresponding to variances due tovariability present in all possible subsets of random inputparameters.
ANOVA sensitivity analysis results are presented in formof the first and higher order sensitivity indices. The sensitivityanalysis in this work is 3-dimensional from stochastic pointof view since random input parameters are: gNa, gK and gL.Thus, there are three first order sensitivity indices, S1(gNa),S1(gK) and S1(gL), each corresponding to the impact of gNa,gK and gL. Higher order sensitivity indices reflect the impact

8 Ante Lojic Kapetanovic et al.
0 200 400 600 800 1000 1200 1400−80
−60
−40
−20
0
20
40
V m [m
V]
0 200 400 600 800 1000 1200 1400t [ms]
−10
0
10
I ext
[μA/
cm2 ]
20 40 60ISI [ms]
0.0
0.1
0.2
0.3
0.4
0.5
0.6
PMF
H=1.4701
Fig. 8 Action potential dynamics, Vm(t), shown in the top left subfigure, for the case of the direct current external stimulus, Iext(t), shown in thebottom left subfigure. Subfigure on the right depicts the probability density histogram (probability mass function) of ISIs. Entropy amounts toH = 1.4701 for the number of bins determined via the Freedman-Diaconis rule [12].
0.0
2.5
5.0
7.5
10.0
12.5
15.0
17.5
mISI(k
) [ms]
CV = 5%⟨mISI⟩, 3 SC points⟨mISI⟩, 5 SC points⟨mISI⟩, 7 SC points⟨mISI⟩, 9 SC points
0.0
2.5
5.0
7.5
10.0
12.5
15.0
17.5
CV = 10%⟨mISI⟩, 3 SC points⟨mISI⟩, 5 SC points⟨mISI⟩, 7 SC points⟨mISI⟩, 9 SC points
0.0
2.5
5.0
7.5
10.0
12.5
15.0
17.5
CV = 20%⟨mISI⟩, 3 SC points⟨mISI⟩, 5 SC points⟨mISI⟩, 7 SC points⟨mISI⟩, 9 SC points
0 1 2 3 4 5k
0
1
2
3
4
5
6
7
Var(m
ISI)(k) [m
s]
Var(mISI), 3 SC pointsVar(mISI), 5 SC pointsVar(mISI), 7 SC pointsVar(mISI), 9 SC points
0 1 2 3 4 5k
0
2
4
6
8
10Var(mISI), 3 SC pointsVar(mISI), 5 SC pointsVar(mISI), 7 SC pointsVar(mISI), 9 SC points
0 1 2 3 4 5k
0
5
10
15
20
25
30Var(mISI), 3 SC pointsVar(mISI), 5 SC pointsVar(mISI), 7 SC pointsVar(mISI), 9 SC points
Fig. 9 Convergence graph for the stochastic collocation method applied on bifurcation analysis of Hodgkin-Huxley neuron model for k ∈ [0,5]. Theconvergence of the mean value for ISI is depicted in the first row, while the convergence for the variance is depicted in the second row for 4 levels ofaccuracy: 3, 5, 7 and 9 collocation points respectively. Each column depicts simulations for a different coefficient of variation, CV = 5, 10 and 20per cent.
of mutual interactions of input parameters. There are threesecond order sensitivity indices, S2(gNa, gK), S2(gNa, gL) andS2(gK , gL), reflecting the impact of the interaction betweenthe associated conductivity subsets. Higher stochastic di-mensions yield even higher order sensitivity indices becausenumber of subsets corresponding to mutual interactions ofinput parameters grows.
If stochastic dimension is too large, a total effect sensitiv-ity index may be computed in order to avoid the computationof higher order sensitivity indices to ultimately reduce thecomputation time. The total effect index measures the con-
tribution to the output variance of a single input parameterincluding all variances caused by its interactions, of any or-der, with any other input variables. E.g., the total effect indexST (gNa) measures the total effect sensitivity that gNa has,together with its interaction to gK and gL, on the mean ISIdistribution over k. If the first order and total effect indiceshave virtually the same value, the mutual interactions have anegligible impact on the variation of the output value.
Sensitivity indices are shown in Fig. 13 for the case oftonic spiking electrical mode, and in Fig. 14 for the case oftonic bursting electrical mode. Both modes are exposed to the
Stochastic analysis of the electromagnetic induction effect on a neuron’s action potential dynamics 9
0 1 2 3 4 5k
0
5
10
15
20
mISI(k
) [ms]
⟨mISI⟩95% CI, CV = 5%
Fig. 10 Mean ISI as a function of k inside 95 per cent confidenceinterval obtained via 5 collocation points and a coefficient of variationCV = 0.05.
0 1 2 3 4 5k
0
5
10
15
20
mISI(k
) [ms]
⟨mISI⟩95% CI, CV = 10%
Fig. 11 Mean ISI as a function of k inside 95 per cent confidenceinterval obtained via 5 collocation points and a coefficient of variationCV = 0.1.
0 1 2 3 4 5k
0
5
10
15
20
mISI(k
) [ms]
⟨mISI⟩95% CI, CV = 20%
Fig. 12 Mean ISI as a function of k inside 95 per cent confidenceinterval obtained via 5 collocation points and a coefficient of variationCV = 0.2.
electromagnetic induction effect where induction coefficientis in range [0,2] and [0,5] for the tonic spiking and tonicbursting electrical mode, respectively.
Interestingly, for CV = 5 and CV = 10 per cent, the meanISI hard drop in the critical range of k values for the tonicspiking electrical mode is affected by the variability in the
interaction of the sodium and potassium ion channels, andthe leakage channel variability exerts practically no impact.For CV = 20 per cent, the output, that is mean ISI over k inrange [0,2], is most sensitive w.r.t. the variability in sodiumion channel from the starting point of the critical inductioncoefficient range, k ∼ 0.75.
For all CVs, the variability of the sodium channel begin-ning at k ∼ 1 onward has the largest impact on the mean ISI,for the tonic bursting electrical mode. For k < 1, the firstorder and the total effect sensitivity indices revolve aroundsimilar values and the significance of the impact is difficultto discern. Both sodium and potassium ion channel, as wellas the respective second order combinations, achieve quitesimilar behavior and influence on the output.
5 Conclusion
An extended variant of Hodgkin-Huxley neuron model underthe electromagnetic induction is developed. In the presenceof an induced electric field governed by the Faraday’s law ofinduction, associated electrical feedback current is embeddedin the model using a theoretical model of a flux-controlledmemristor. Both numerical simulation and stochastic sensi-tivity analysis are performed in order to assess the influenceof the uncertainties on the output, where the output has beenrepresented as the dependence of the mean inter-spike inter-val for various induction coefficient values, which ultimatelyindicate the strength of the magnetic field to which the iso-lated cortex neuron has been exposed. The uncertainty onthe output of the model arises from the propagated uncer-tainties of the conductivity of ion channels, often neglectedin the literature. Additionally, stochastic sensitivity analy-sis is performed, where it is shown that the output dependsmostly on the interaction of variability in the conductivityof sodium and potassium ion channel (second order sensitiv-ity). Insights gained from this paper can greatly contribute tothe development of experimental applications of inductionfor therapeutic purposes, especially in medical treatments ofneurodegenerative disorders.
6 Declarations
6.1 Fundings
This research has been funded by DATACROSS project ofThe Centre of Research Excellence for Data Science and Ad-vanced Cooperative Systems (CRE ACROSS-DataScience).
6.2 Conflict of interest
The authors declare that they have no conflict of interest.

10 Ante Lojic Kapetanovic et al.
0.0
0.2
0.4
0.6
0.8
1st a
nd 2
nd order sen
sitiv
ity in
dices
CV = 5%S1(gNa)S1(gK)S1(gL)S2(gNa, gK)S2(gNa, gL)S2(gK, gL)
CV = 10%S1(gNa)S1(gK)S1(gL)S2(gNa, gK)S2(gNa, gL)S2(gK, gL)
CV = 20%S1(gNa)S1(gK)S1(gL)S2(gNa, gK)S2(gNa, gL)S2(gK, gL)
0.00 0.25 0.50 0.75 1.00 1.25 1.50 1.75 2.00k
0.0
0.2
0.4
0.6
0.8
total e
ffect s
ensitiv
ity in
dices
St(gNa)St(gK)St(gL)
0.00 0.25 0.50 0.75 1.00 1.25 1.50 1.75 2.00k
St(gNa)St(gK)St(gL)
0.00 0.25 0.50 0.75 1.00 1.25 1.50 1.75 2.00k
St(gNa)St(gK)St(gL)
Fig. 13 Variance-based sensitivity analysis for Hodgkin-Huxley neuron model under the influence of the electromagnetic induction. Externalneuronal stimulus for the case visualized in this figure is constant dc current. Upper row holds the first and the second order sensitivity indices of theoutput given gNa, gK and gL respectively, for the case of 5 collocation points. Lower row holds the total effect sensitivity indices of the output. Eachcolumn shows simulations for a different coefficient of variation.
0.0
0.2
0.4
0.6
0.8
1st a
nd 2
nd order sen
sitiv
ity in
dices
CV = 5%S1(gNa)S1(gK)S1(gL)S2(gNa, gK)S2(gNa, gL)S2(gK, gL)
CV = 10%S1(gNa)S1(gK)S1(gL)S2(gNa, gK)S2(gNa, gL)S2(gK, gL)
CV = 20%S1(gNa)S1(gK)S1(gL)S2(gNa, gK)S2(gNa, gL)S2(gK, gL)
0 1 2 3 4 5k
0.0
0.2
0.4
0.6
0.8
total e
ffect s
ensitiv
ity in
dices
St(gNa)St(gK)St(gL)
0 1 2 3 4 5k
St(gNa)St(gK)St(gL)
0 1 2 3 4 5k
St(gNa)St(gK)St(gL)
Fig. 14 Variance-based sensitivity analysis for Hodgkin-Huxley neuron model under the influence of electromagnetic induction. External neuronalstimulus for the case visualized in this figure is noisy periodic current. Upper row holds the first and the second order sensitivity indices of theoutput given gNa, gK and gL respectively, for the case of 5 collocation points. Lower row holds the total effect sensitivity indices of the output. Eachcolumn shows simulations for a different coefficient of variation.
6.3 Code availability
To enable seamless reproduction and re-implementation ofresults presented in this study, thereby to support the OpenScience movement, the entire associated code-base is avail-able on the first author’s GitHub:
https://github.com/antelk/em-hodgkin-huxley
6.4 Availability of data and material
https://github.com/antelk/em-hodgkin-huxley/
tree/main/src/output
A Fitting the iv characteristic of the memristor
To physically justify the choice of a and b in (17), parameters D, µand Ron are set to be fitted. Parameter Ro f f is assumed to be 20 timesgreater then free parameter Ron and parameter w is assumed to be 0.2times the value of the parameter D. The physical memristor’s polarityis assumed to be η =−1. The formulation for the memristance of the

Stochastic analysis of the electromagnetic induction effect on a neuron’s action potential dynamics 11
physical memristor is defined as follows:
M(q(t)) = R0
√
q−2η∆Rφ(t)/(Q0R20) (A.1)
where R0, ∆R and Q0 are given in (13), (14) and (15), respectively. Lossfunction is defined as the mean square error between the memristanceof the actual physical memristor given in (A.1) and the memristance ofthe non-linear approximation of the memristor given as the reciprocalof the expression in (17) for various time-dependent charge values. Theoptimization is performed using the Python scientific module SciPy [49]or, more precisely, its implementation of the Nelder-Mead iterativeminimization method [13]. The convergence graph is shown in Fig. 2,where free parameters took on the following values:
Ron = 1.589 ·10−1 Ω
µ = 6.237 ·10−14 m2/VsD = 1.698 ·10−7 m
Acknowledgements This research has been funded by DATACROSSproject of The Centre of Research Excellence for Data Science andAdvanced Cooperative Systems (CRE ACROSS-DataScience).
References
1. Bao, B., Liu, Z., Xu, J.: Steady periodic memristor oscillator withtransient chaotic behaviours. Electronics Letters 46 (2010). DOI10.1049/el.2010.3114
2. Barker, A., Jalinous, R., Freeston, I.: Non-invasive magnetic stim-ulation of human motor cortex. The Lancet 325 (1985). DOI10.1016/S0140-6736(85)92413-4
3. Barker, A.T., Freeston, I.L., Jalinous, R., Jarratt, J.A.: Magneticstimulation of the human brain and peripheral nervous system: anintroduction and the results of an initial clinical evaluation. Neuro-surgery 20(1) (1987). DOI 10.1097/00006123-198701000-00024
4. Capelli, E., Torrisi, F., Venturini, L., Granato, M., Fassina, L., Lupo,G.F.D., Ricevuti, G.: Low-frequency pulsed electromagnetic fieldis able to modulate miRNAs in an experimental cell model ofAlzheimer’s disease. Journal of Healthcare Engineering (2017).DOI 10.1155/2017/2530270
5. Chua, L.O.: Memristor – the missing circuit element. IEEE Trans-actions on Circuit Theory 18(5) (1971). DOI 10.1109/TCT.1971.1083337
6. Chua, L.O., Kang, S.M.: Memristive devices and systems. Proceed-ings of the IEEE 64(2) (1976). DOI 10.1109/PROC.1976.10092
7. Clay, J.R.: Excitability of the squid giant axon revisited. Journal ofNeurophysiology 80(2) (1998). DOI 10.1152/jn.1998.80.2.903
8. Dorval, A.: Probability distributions of the logarithm of inter-spikeintervals yield accurate entropy estimates for small datasets. Journalof neuroscience methods 173 (2008). DOI 10.1016/j.jneumeth.2008.05.013
9. Ermentrout, G.B., Kopell, N.: Parabolic bursting in an excitablesystem coupled with a slow oscillation. SIAM Journal on AppliedMathematics 46(2) (1986). DOI 10.1137/0146017
10. Fisher, R., Salanova, V., Witt, T., Worth, R., Henry, T., Gross, R.,Oommen, K., Osorio, I., Nazzaro, J., Labar, D., Kaplitt, M., Sper-ling, M., Sandok, E., Neal, J., Handforth, A., Stern, J., DeSalles,A., Chung, S., Shetter, A., Bergen, D., Bakay, R., Henderson, J.,French, J., Baltuch, G., Rosenfeld, W., Youkilis, A., Marks, W.,Garcia, P., Barbaro, N., Fountain, N., Bazil, C., Goodman, R.,McKhann, G., Babu Krishnamurthy, K., Papavassiliou, S., Epstein,C., Pollard, J., Tonder, L., Grebin, J., Coffey, R., Graves, N., theSANTE Study Group: Electrical stimulation of the anterior nucleusof thalamus for treatment of refractory epilepsy. Epilepsia 51(5)(2010). DOI https://doi.org/10.1111/j.1528-1167.2010.02536.x
11. FitzHugh, R.: Impulses and physiological states in theoretical mod-els of nerve membrane. Biophysical Journal 1(6) (1961). DOI10.1016/S0006-3495(61)86902-6
12. Freedman, D., Diaconis, P.: On the histogram as a density esti-mator: L2 theory. Zeitschrift für Wahrscheinlichkeitstheorie undVerwandte Gebiete 57(2) (1981). DOI 10.1007/BF01025868
13. Gao, F., Han, L.: Implementing the Nelder-Mead simplex algo-rithm with adaptive parameters. Computational Optimization andApplications 51 (2012). DOI 10.1007/s10589-010-9329-3
14. Ge, M., Lu, L., Xu, Y., Mamatimin, R., Pei, Q., Jia, Y.: Vibrationalmono-/bi-resonance and wave propagation in FitzHugh–Nagumoneural systems under electromagnetic induction. Chaos, Solitons& Fractals 133 (2020). DOI 10.1016/j.chaos.2020.109645
15. Gerstner, W., Kistler, W.M., Naud, R., Paninski, L.: Neuronaldynamics: From single neurons to networks and models of cog-nition. Cambridge University Press (2014). DOI 10.1017/CBO9781107447615
16. Hodgkin, A.L., Huxley, A.F.: A quantitative description of mem-brane current and its application to conduction and excitation innerve. Bulletin of Mathematical Biology 52(1) (1990). DOI10.1016/S0092-8240(05)80004-7
17. ICNIRP: Guidelines for limiting exposure to time-varying electricand magnetic fields (1 Hz to 100 kHz). Health Physics 99(6) (2010).DOI 10.1097/HP.0b013e3181f06c86
18. ICNIRP: Guidelines for limiting exposure to electromagnetic fields(100 kHz to 300 GHz). Health Physics 118 (2020). DOI 10.1097/HP.0000000000001210
19. Izhikevich, E.M.: Resonate-and-fire neurons. Neural Networks14(6) (2001). DOI 10.1016/S0893-6080(01)00078-8
20. Izhikevich, E.M.: Simple model of spiking neurons. IEEE Transac-tions on Neural Networks 14(6) (2003). DOI 10.1109/TNN.2003.820440
21. Izhikevich, E.M.: Which model to use for cortical spiking neurons?IEEE Transactions on Neural Networks 15(5) (2004). DOI 10.1109/TNN.2004.832719
22. Joglekar, Y.N., Wolf, S.J.: The elusive memristor: properties ofbasic electrical circuits. European Journal of Physics 30 (2009).DOI 10.1088/0143-0807/30/4/001
23. Lianghui, Q., Lin, D., Haiwei, H., Cao, Z., Zichen, D.: Pat-tern control of external electromagnetic stimulation to neuronalnetworks. Nonlinear Dynamics 102 (2020). DOI 10.1007/s11071-020-06076-6
24. Liu, Y., Ma, J., Xu, Y., Jia, Y.: Electrical mode transition of hybridneuronal model induced by external stimulus and electromagneticinduction. International Journal of Bifurcation and Chaos 29(11)(2019). DOI 10.1142/S0218127419501566
25. Lu, L., Jia, Y., Ge, M., Xu, Y., Li, A.: Inverse stochastic resonancein Hodgkin–Huxley neural system driven by Gaussian and non-Gaussian colored noises. Nonlinear Dynamics 100 (2020). DOI10.1007/s11071-020-05492-y
26. Lu, L., Jia, Y., Liu, W., Yang, L.: Mixed stimulus-induced modeselection in neural activity driven by high and low frequency currentunder electromagnetic radiation. Complexity 2017 (2017). DOI10.1155/2017/7628537
27. Lu, L., Kirunda, J.B., Xu, Y., Kang, W., Ye, R., Zhan, X., Jia, Y.:Effects of temperature and electromagnetic induction on action po-tential of Hodgkin–Huxley model. The European Physical JournalSpecial Topics 227 (2018). DOI 10.1140/epjst/e2018-700140-1
28. Lv, M., Ma, J.: Multiple modes of electrical activities in a newneuron model under electromagnetic radiation. Neurocomputing205 (2016). DOI 10.1016/j.neucom.2016.05.004
29. Lv, M., Wang, C., Guodong, R., Song, X.: Model of electrical ac-tivity in a neuron under magnetic flow effect. Nonlinear Dynamics85 (2016). DOI 10.1007/s11071-016-2773-6
30. Ma, J., Jun, T.: A review for dynamics in neuron and neu-ronal network. Nonlinear Dynamics 89 (2017). DOI 10.1007/s11071-017-3565-3

12 Ante Lojic Kapetanovic et al.
31. Morris, C., Lecar, H.: Voltage oscillations in the barnacle giantmuscle fiber. Biophysical Journal 35(1) (1981). DOI 10.1016/S0006-3495(81)84782-0
32. Nelder, J., Mead, R.: A simplex method for function minimization.The Computer Journal 7 (1965). DOI 10.1093/comjnl/7.4.308
33. Ozer, M., Ekmekci, N.H.: Effect of channel noise on the time-course of recovery from inactivation of sodium channels. PhysicsLetters A 338(2) (2005). DOI 10.1016/j.physleta.2005.02.039
34. Park, H.J., Bonmassar, G., Kaltenbach, J.A., Machado, A.G., Man-zoor, N.F., Gale, J.T.: Activation of the central nervous systeminduced by micro-magnetic stimulation. Nature Communications4 (2013). DOI 10.1038/ncomms3463
35. Pashut, T., Wolfus, S., Friedman, A., Lavidor, M., Bar-Gad, I.,Yeshurun, Y., Korngreen, A.: Mechanisms of magnetic stimulationof central nervous system neurons. PLOS Computational Biology7 (2011). DOI 10.1371/journal.pcbi.1002022
36. Pikov, V., Arakaki, X., Harrington, M., Fraser, S.E., Siegel, P.H.:Modulation of neuronal activity and plasma membrane prop-erties with low-power millimeter waves in organotypic corti-cal slices. Journal of Neural Engineering 7(4) (2010). DOI10.1088/1741-2560/7/4/045003
37. Rose R. M.; Hindmarsh, J.L.: The assembly of ionic currents ina thalamic neuron. I. The three-dimensional model. Proceedingsof the Royal Society B: Biological Sciences 237 (1989). DOI10.1098/rspb.1989.0049
38. Saltelli, A., Ratto, M., Andres, T., Campolongo, F., Cariboni, J.,Gatelli, D., Saisana, M., Tarantola, S.: Global sensitivity analysis.The primer. Wiley (2008). DOI 10.1002/9780470725184.ch6
39. Saunders, R.D., Jefferys, J.G.R.: A neurobiological basis for elfguidelines. Health Physics 92(6) (2007). DOI 10.1097/01.HP.0000257856.83294.3e
40. Schmid, G., Goychuk, I., Hänggi, P.: Effect of channel block on thespiking activity of excitable membranes in a stochastic hodgkin-huxley model. Physical biology 1(1-2) (2004). DOI 10.1088/1478-3967/1/2/002
41. Seely, J., Crotty, P.: Optimization of the leak conductance in thesquid giant axon. Physical Review E 82 (2010). DOI 10.1103/PhysRevE.82.021906
42. Shampine, L.F., Reichelt, M.W.: The matlab ode suite. SIAMJournal on Scientific Computing 18(1) (1997). DOI 10.1137/S1064827594276424
43. Shannon, C.E.: A mathematical theory of communication. The BellSystem Technical Journal 27(3) (1948). DOI 10.1002/j.1538-7305.1948.tb01338.x
44. Shneider, M.N., Pekker, M.: Non-thermal mechanism of weakmicrowave fields influence on neurons. Journal of Applied Physics114(10), 104701 (2013). DOI 10.1063/1.4821027
45. Smith, G.D., Cox, C.L., Sherman, S.M., Rinzel, J.: Fourier analysisof sinusoidally driven thalamocortical relay neurons and a minimalintegrate-and-fire-or-burst model. Journal of Neurophysiology83(1) (2000). DOI 10.1152/jn.2000.83.1.588
46. Sobol, I.M.: Sensitivity estimates for nonlinear mathematical mod-els. Matematicheskoe Modelirovanie 2 (1990)
47. Strong, S., Koberle, R., Steveninck, R., Bialek, W.: Entropy andinformation in neural spike trains. Physical Review Letters 80(1996). DOI 10.1103/PhysRevLett.80.197
48. Strukov, D.B., Snider, G.S., Stewart, D.R., Williams, R.S.: Themissing memristor found. Nature 453 (2008). DOI 10.1038/nature06932
49. Virtanen, P., Gommers, R., Oliphant, T.E., Haberland, M., Reddy,T., Cournapeau, D., Burovski, E., Peterson, P., Weckesser, W.,Bright, J., van der Walt, S.J., Brett, M., Wilson, J., Millman, K.J.,Mayorov, N., Nelson, A.R.J., Jones, E., Kern, R., Larson, E., Carey,C.J., Polat, I., Feng, Y., Moore, E.W., VanderPlas, J., Laxalde, D.,Perktold, J., Cimrman, R., Henriksen, I., Quintero, E.A., Harris,C.R., Archibald, A.M., Ribeiro, A.H., Pedregosa, F., van Mulbregt,P., SciPy 1.0 Contributors: SciPy 1.0: Fundamental Algorithms
for Scientific Computing in Python. Nature Methods 17 (2020).DOI 10.1038/s41592-019-0686-2
50. Wang, Y., Ma, J., Xu, Y., Wu, F., Zhou, P.: The Electrical Activityof Neurons Subject to Electromagnetic Induction and GaussianWhite Noise. International Journal of Bifurcation and Chaos 27(02)(2017). DOI 10.1142/S0218127417500304
51. Wilson, H.R.: Simplified Dynamics of Human and MammalianNeocortical Neurons. Journal of Theoretical Biology 200(4) (1999).DOI 10.1006/jtbi.1999.1002
52. Wu, F., Ma, J., Zhang, G.: A new neuron model under electromag-netic field. Applied Mathematics and Computation 347 (2019).DOI 10.1016/j.amc.2018.10.087
53. Wu, F., Wang, C., Jin, W., Ma, J.: Dynamical responses in a newneuron model subjected to electromagnetic induction and phasenoise. Physica A: Statistical Mechanics and its Applications 469(2017). DOI 10.1016/j.physa.2016.11.056
54. Xiu, D.: Fast Numerical Methods for Stochastic Computations: AReview. Communications In Computational Physics 5(2-4) (2009).URL http://global-sci.org/intro/article_detail/cicp/
7732.html
55. Xiu, D.: Stochastic Collocation Methods: A Survey. Springer In-ternational Publishing (2016). DOI 10.1007/978-3-319-11259-6_26-1
56. Xu, Y., Jia, Y., Wang, H., Liu, Y., Wang, P., Zhao, Y.: Spikingactivities in chain neural network driven by channel noise withfield coupling. Nonlinear Dynamics 95 (2019). DOI 10.1007/s11071-018-04752-2
57. Xu, Y., Ying, H., Jia, Y., Ma, J., Hayat, T.: Autaptic regulationof electrical activities in neuron under electromagnetic induction.Scientific Reports 7 (2017). DOI 10.1038/srep43452
58. Yang, Y., Ma, J., Xu, Y., Jia, Y.: Energy dependence on dischargemode of Izhikevich neuron driven by external stimulus under elec-tromagnetic induction. Cognitive Neurodynamics (2020). DOI10.1007/s11571-020-09596-4
59. Zhao, Y., Boulant, J.A.: Temperature effects on neuronal membranepotentials and inward currents in rat hypothalamic tissue slices. TheJournal of Physiology 564(1) (2005). DOI 10.1113/jphysiol.2004.075473
Figures
Figure 1
Hodgkin-Huxley neuron model equivalent electrical circuit [16] with the magnetic ux-controlledmemristor, used to bridge the gap between the magnetic ux and the membrane potential and to enablethe trans-membrane feedback current ow.

Figure 2
Visual representation of the iv characteristic compatibility between the non-linear polynomialapproximatin of the memristor given in Bao et al. [1] and the actual memristor device realization [22]given in Joglekar et al.

Figure 3
Action potential dynamics, Vm(t), shown in the top left subgure, for the case of the direct currentexternal stimulus, Iext (t), shown in the bottom left subgure. Subgure on the right depicts the probabilitydensity histogram (probability mass function) of ISIs, visually resembling an exponential distribution.Entropy amounts to H = 2:0832 for the number of bins determined via the Freedman-Diaconis rule [12].
Figure 4

Convergence graph for the stochastic collocation method applied on bifurcation analysis of Hodgkin-Huxley neuron model for k 2 [0;2]. The convergence of the mean value for ISI is depicted in the rst row,while the convergence for the variance is depicted in the second row for 4 levels of accuracy: 3, 5, 7 and 9collocation points respectively. Each column depicts simulations for a different coecient of variation,CV = 5, 10 and 20 per cent.
Figure 5
Mean ISI as a function of k inside 95 per cent condence interval obtained via 5 collocation points and acoecient of variation CV = 0:05.

Figure 6
Mean ISI as a function of k inside 95 per cent condence interval obtained via 5 collocation points and acoecient of variation CV =0:1.
Figure 7

Mean ISI as a function of k inside 95 per cent condence interval obtained via 5 collocation points and acoecient of variation CV =0:2.
Figure 8
Action potential dynamics, Vm(t), shown in the top left subgure, for the case of the direct currentexternal stimulus, Iext (t), shown in the bottom left subgure. Subgure on the right depicts the probabilitydensity histogram (probability mass function) of ISIs. Entropy amounts to H = 1:4701 for the number ofbins determined via the Freedman-Diaconis rule [12].

Figure 9
Convergence graph for the stochastic collocation method applied on bifurcation analysis of Hodgkin-Huxley neuron model for k 2 [0;5]. The convergence of the mean value for ISI is depicted in the rst row,while the convergence for the variance is depicted in the second row for 4 levels of accuracy: 3, 5, 7 and 9collocation points respectively. Each column depicts simulations for a different coecient of variation,CV = 5, 10 and 20 per cent.
Figure 10
Mean ISI as a function of k inside 95 per cent condence interval obtained via 5 collocation points and acoecient of variation CV = 0:05.

Figure 11
Mean ISI as a function of k inside 95 per cent condence interval obtained via 5 collocation points and acoecient of variation CV = 0:1.

Figure 12
Mean ISI as a function of k inside 95 per cent condence interval obtained via 5 collocation points and acoecient of variation CV = 0:2.
Figure 13
Variance-based sensitivity analysis for Hodgkin-Huxley neuron model under the inuence of theelectromagnetic induction. External neuronal stimulus for the case visualized in this gure is constant dccurrent. Upper row holds the rst and the second order sensitivity indices of the output given ¯ gNa, ¯ gKand ¯ gL respectively, for the case of 5 collocation points. Lower row holds the total effect sensitivityindices of the output. Each column shows simulations for a different coecient of variation.
Figure 14

Variance-based sensitivity analysis for Hodgkin-Huxley neuron model under the inuence ofelectromagnetic induction. External neuronal stimulus for the case visualized in this gure is noisyperiodic current. Upper row holds the rst and the second order sensitivity indices of the output given ¯gNa, ¯ gK and ¯ gL respectively, for the case of 5 collocation points. Lower row holds the total effectsensitivity indices of the output. Each column shows simulations for a different coecient of variation.