stlying with geoserver - lorax521.github.io · stlying with geoserver this tutorial covers...
TRANSCRIPT

STLYING WITH GEOSERVER
This tutorial covers introductory SLD styling in GeoServer for points, lines,
polygons, and rasters utilizing base XML from the SLD Cookbook.
James Raines
University of Colorado Denver
Spring 2017

pg. 1
STLYING WITH GEOSERVER
Login to GeoServer:
1. Login to a VPN service such as Cisco 2. Connect to anywhere.ucdenver.edu and login with your student
credentials 3. Open Remote Desktop Connection and connect to:
geoserver.ucdenver.pvt 4. Login with your student credentials 5. In a Firefox or Chrome browser, (do not use Internet Explorer)
navigate to http://geoserver.ucdenver.pvt:8181/geoserver/web
6. Login with your GeoServer credentials
***For the purposes of this tutorial, we will only be working in the Data
section:

pg. 2
STLYING WITH GEOSERVER
Create New Data Stores
In this step, we will be creating new data stores to host the following
layers:
a) DenverBoundary.shp
b) DenverArterials.shp
c) SpeedRecordings.shp
d) VehCrashes_HeatMap.tif
By this time, you should already have a workspace. In your workspace,
create two new data stores that link to the GeoServer_Styling folder.
1) A Shapefile data store: your Shapefile location should appear like
this “file:data_dir/GeoServer_Styling”. This will enable you to
publish all the shapefiles inside of this folder.
2) GeoTIFF data store: GeoTIFF data stores can only publish one
GeoTIFF at a time, so your URL* should appear like this
“file:data_dir/GeoServer_Styling/VehCrashes_HeatMap.tif
Publish Data
Publish all 3 shapefiles and the 1 raster.
1) When publishing shapefiles:
a. Use EPSG:2773 for: DenverBoundary, DenverArterials, and
SpeedRecordings

pg. 3
STLYING WITH GEOSERVER
b. Compute Bounding Boxes from data and native bounds
c. Under the Publishing tab, scroll down and ensure that
Queryable is checked.
d. Save the layer.

pg. 4
STLYING WITH GEOSERVER
2) When publishing the raster:
a. Use EPSG:2773
b. Compute Bounding Boxes from data and native
bounds, just like the shapefiles
c. Navigate to the Publishing tab
d. For Interpolation Methods, change bilinear to the
default, and ensure that nearest neighbor, bilinear,
and bicubic are selected
e. For Formats, ensure that GeoTIFF is the Native
Format
f. Check Queryable
g. Save the layer.

pg. 5
STLYING WITH GEOSERVER
Your data stores should now appear as below:
Shapefile:
GeoTIFF:
SLD Cookbook
Navigate to:
http://docs.geoserver.org/stable/en/user/styling/sld/cookbook/
Here, you will find XML base code and sample visualizations for styling
points, lines, polygons, and rasters.
Click on a few and get familiar with what is available.

pg. 6
STLYING WITH GEOSERVER
Text Editors
For the rest of this tutorial, we will be editing XML code in a text editor.
There are many out there with varying benefits. Notepad++ is one of the
most widely used, traditional text editors, but others, including Sublime
and Atom, offer more robust functionality.
For this exercise, we will be using Sublime. Reference this document
before proceeding:
[Ulises Sublime tutorial here]
More information on popular text editors can be found here:
http://lifehacker.com/five-best-text-editors-1564907215

pg. 7
STLYING WITH GEOSERVER
Simple Polygon with Stroke
We will start off providing color for our base layer, DenverBoundary. We
will make a white and black style for this layer to contrast with later
products.
1) From the SLD Cookbook, under Polygons, click on Simple polygon
with stoke.
2) Scroll down and click on View and download the full "Simple
polygon" SLD
3) A screen with XML will appear. This does not contain the head of
the code that will allow it to run. Right click and select Save as…
Save it as an XML document with “.sld” as the extension.

pg. 8
STLYING WITH GEOSERVER
4) Now, open the document in Sublime. It should look like this:
This appears like HTML with hierarchical tags.

pg. 9
STLYING WITH GEOSERVER
Quick lesson on tags
<FeatureTypeStyle>: Tells GeoServer this is styling a feature
<PolygonSymbolizer>: Tell GeoServer what type of feature
<Rule>: Instigates the rules for the style to follow
<Fill>: Determines the polygons fill color
<CssParameter>: Allows any CSS color code to be used for styling
<Stroke>: The border color
Reading and understanding tags will become more important as
you create custom and more complex styles.
5) Look up the hex code for white and black
https://www.w3schools.com/cssref/css_colors.asp
6) Set the fill to white and the stroke to black. Then, save the file as
“polygon_whiteWBlackStroke”
7) Next, change both the fill and stroke to black. Then, save as
“polygon_blackWBlackStroke”
8) Now, log back into GeoServer. Navigate to Styles and click add
new style.

pg. 10
STLYING WITH GEOSERVER
9) Create the style, polygon_whiteWBlackStroke:
Name your style the same as the files name. Designate the style
to be saved under your workspace, then scroll down and either
upload your file, or copy and paste it into the Style Editor.
**Note: if you upload your SLD, it will overwrite your style name
with the file name.
10) Always validate! Once your code is in the Style Editor, click
Validate. This let us know if the code can be understood by
GeoServer. Scroll up to the top and look for validation errors.
When you have no errors, click Submit to save the style.
11) Repeat for polygon_blackWBlackStroke
12) Now that the styles have been created, navigate to Layers and
select DenverBoundary
13) Select the publishing tab

pg. 11
STLYING WITH GEOSERVER
14) Scroll down to WMS Settings and set the Default Style to
polygon_whiteWBlackStroke. Then, add
polygon_whiteWBlackStroke and polygon_blackWBlackStroke
from the Available Styles to the Selected Styles. This will enable
us to alternate between them as a WMS. Save.
15) Navigate to Layer Preview and view DenverBoundary with
OpenLayers. Click the 3 horizontal dots in the top left
corner to access this menu. From the Styles drop down
menu, view your two styles.
pg. 12
STLYING WITH GEOSERVER
Optimized and Styled Label
We will now be adding labeled roads to Denver.
1) Navigate to the SLD Cookbook and use the same process to
download optimized and styled label
2) Open it your text editor. We will be changing the
ogc:PropertyName (road name attribute) and the CssParameter
for fill
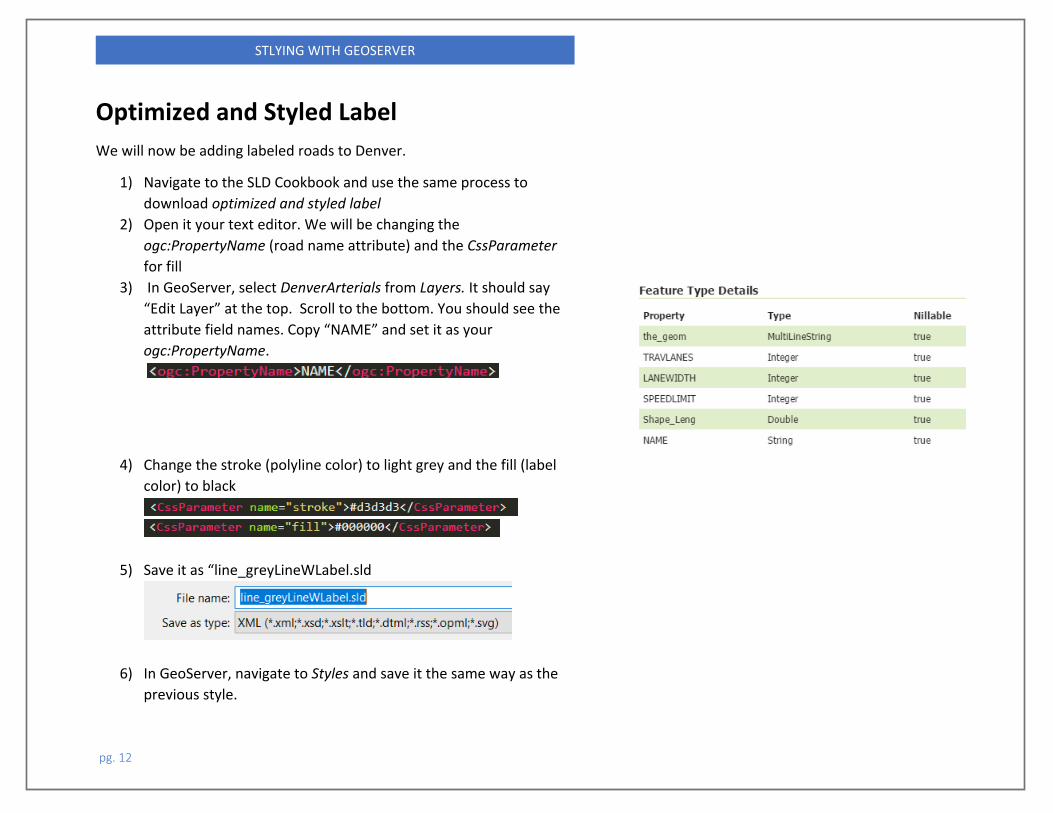
3) In GeoServer, select DenverArterials from Layers. It should say
“Edit Layer” at the top. Scroll to the bottom. You should see the
attribute field names. Copy “NAME” and set it as your
ogc:PropertyName.
4) Change the stroke (polyline color) to light grey and the fill (label
color) to black
5) Save it as “line_greyLineWLabel.sld
6) In GeoServer, navigate to Styles and save it the same way as the
previous style.

pg. 13
STLYING WITH GEOSERVER
7) Similarly, add the style to the DenverArterials layer as the default and selected style
8) Now view your styled and labels roads on top of Denver by adding
“DenverBoundary,” to your URL:
This is where layers are in the URL. After “Workspace:” and before
“&styles”.
Add “DenverBoundary,” first. The hierarchy, left to right, is the
drawing order.

pg. 14
STLYING WITH GEOSERVER
Attribute-based point
Now we will be adding the SpeedRecordings to our current layers and
styling them by attribute and with graduated symbols.
1) Navigate to the SLD Cookbook and use the same process to
download Attribute-based point
2) Open it in your text editor. There are currently 3 rules for this
style, we will add a fourth
3) Copy the entire Rule for MediumPop (from <Rule> to </Rule>)
and paste it between the Rule for MediumPop and LargePop.
4) Change the <Name> for each Rule to the following:
SmallPop UnderSpeedMajor
MediumPop UnderSpeedMinor
MediumPop (the new one) SpeedingMinor
LargePop SpeedingMajor
5) Change all <ogc:PropertyName> to:
Speed_Diff

pg. 15
STLYING WITH GEOSERVER
6) Change <ogc:Literal> to the following for the respective Rule:
(Literal is the value in which arguments such as
<ogc:PropertyIsGreaterThanOrEqualTo> can be executed from)
UnderSpeedMajor
• <ogc:PropertyIsLessThan>:
o <ogc:Literal>-6.83</ogc:Literal>
UnderSpeedMinor
• <ogc:PropertyIsGreaterThanOrEqualTo>:
o <ogc:Literal>-6.83</ogc:Literal>
• <ogc:PropertyIsLessThan>:
o <ogc:Literal>0</ogc:Literal>
SpeedingMinor
• <ogc:PropertyIsGreaterThanOrEqualTo>:
o <ogc:Literal>0</ogc:Literal>
• <ogc:PropertyIsLessThan>:
o <ogc:Literal>3</ogc:Literal>
SpeedingMajor
• <ogc:PropertyIsGreaterThanOrEqualTo>:
o <ogc:Literal>3</ogc:Literal>
7) Then change the <Title> accordingly
8) Now we are going to change the size of the points and
their color based on each category or Rule. Make the
following changes:
UnderSpeedMajor
Fill: #0033CC
An example of UnderSpeedMinor after changing the
<ogc:PropertyName>,<ogc:Literal>, and <Title>

pg. 16
STLYING WITH GEOSERVER
Size: 6
UnderSpeedMinor
Fill: #0033CC
Size: 8
SpeedingMinor
Fill: #ff0000
Size: 12
SpeedingMajor
Fill: #ff0000
Size: 16
Now we will see speed increase with the size of the point and
where people drive under the speed limit will be blue and over
the speed limit, red.
9) Save your SLD as point_speedRecordingsBlueRed.sld
10) Open GeoServer and turn this into a new style, then add it to the
SpeedRecordings layer under the publisher tab as the default
style. It should appear something similar to this under the WMS
Settings. It will show the <Title>s you’ve given the Rules.
11) In GeoServer, navigate to Layer Groups.
12) Create a new layer group
a. Use the Coordinate Reference System EPSG:2773
b. Generate Bounds
c. Add DenverBoundary, DenverArterials, and
SpeedRecordings in this drawing order. The higher the
pg. 17
STLYING WITH GEOSERVER
drawing order number, the more forward, or on top, the
layer will be.
d. Save.
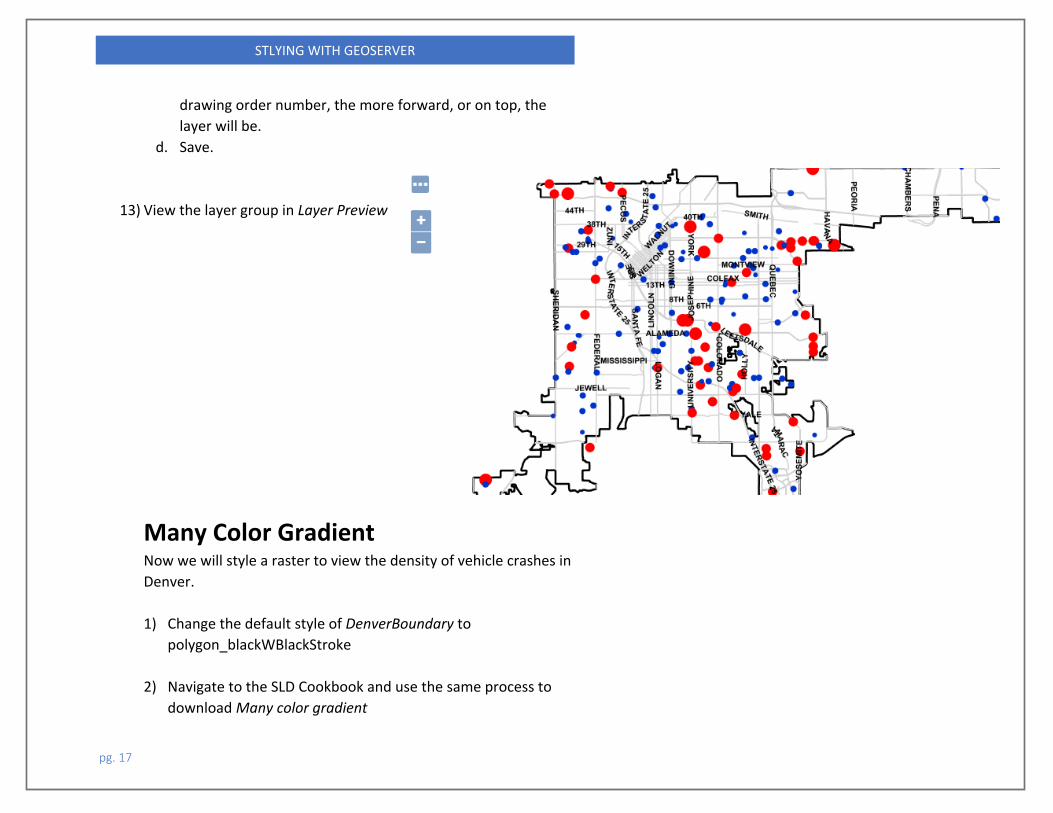
13) View the layer group in Layer Preview
Many Color Gradient Now we will style a raster to view the density of vehicle crashes in
Denver.
1) Change the default style of DenverBoundary to
polygon_blackWBlackStroke
2) Navigate to the SLD Cookbook and use the same process to
download Many color gradient

pg. 18
STLYING WITH GEOSERVER
3) This raster represents an index with very small values. The
values in this SLD are represented by “quantity”
Change all of the quantities as follows:
quantity=".0000005008"
quantity=".000001878"
quantity=".000038813"
quantity=".000063853"
quantity=".000096405"
quantity=".000138974"
quantity=".000194063"
quantity=".000312"
4) The first ColorMapEntry will go beyond the Denver
boundaries, so set it to 0 opacity:
Your SLD should now look like this:
5) Save it and add it as the default style to your layer,
VehCrashes_HeatMap

pg. 19
STLYING WITH GEOSERVER
6) Create a Layer Group with DenverBoundary and
VehCrashes_HeatMap
7) View your new Layer Group in Layer Preview