stimulus-lnduced oscillations in guard cell cytosolic … · the plant cell, vol. 7, 1207-1219,...
TRANSCRIPT

The Plant Cell, Vol. 7, 1207-1219, August 1995 O 1995 American Society of Plant Physiologists
Stimulus-lnduced Oscillations in Guard Cell Cytosolic Free Calcium
Mart in R. McAinsh,' Alex A. R. Webb, Jane E. Taylor, a n d Alistair M. Hether ington
lnstitute of Environmental and Biological Sciences, Division of Biological Sciences, Lancaster University, Lancaster, LA1 4YQ, United Kingdom
Ca2+ is implicated as a second messenger in the response of stomata to a range of stimuli. However, the mechanism by which stimulus-induced increases in guard cell cytosolic free Ca2+ ([Ca2+],) are transduced into different physiologi- Cal responses remains to be explained. Oscillations in [Ca2+], may provide one way in which this can occur. We used photometric and imaging techniques to examine this hypothesis in guard cells of Commelina communis. Externa1 Ca2+ ([Ca2+Ie), which causes an increase in [Ca2+],, was used as a closing stimulus. The total increase in [Ca2+], was directly related to the concentration of [Ca2+Ie, both of which correlated closely with the degree of stomatal closure. lncreases were oscillatory in nature, with the pattern of the oscillations dependent on the concentration of [Ca2+]e. At 0.1 mM, [Ca2+Ie induced symmetrical oscillations. In contrast, 1.0 mM [Ca2+]e induced asymmetric oscillations. Oscillations were stimu- lus dependent and modulated by changing [Ca2+]e. Experiments using Ca2+ channel blockers and Mn2+-quenching studies suggested a role for Ca2+ influx during the oscillatory behavior without excluding the possible involvement of Ca2+ re- lease from intracellular stores. These data suggest a mechanism for encoding the information required to distinguish between a number of different Ca2+-mobilizing stimuli in guard cells, using stimulus-specific patterns of oscillations in [Ca2+Ii.
INTRODUCTION
Strong evidence supports the role of Ca2+-based signal trans- duction pathways in stimulus-response coupling in plants (Bush, 1993; Gilroy et al., 1993; Poovaiah and Reddy, 1993; Webb et al., 1995). lncreases in cytosolic free Ca2+ ([Ca2+Ii) have been observed in severa1 cell types in response to a num- ber of stimuli, including plant hormones, mechanical stimuli, high and low temperatures, salt stress, exposure to oxidative agents, red light, funga1 elicitors, self-incompatibility factors, and electrical fields (for reviews, see Bush, 1993; Gilroy et al., 1993; Read et al., 1993; Webb et al., 1995). In addition, many components of Ca2+-based second messenger systems found in animals have also been identified in plant cells. These in- clude primary effectors, such as Ca2+-dependent protein kinases and protein phosphatases (Bush, 1993; Gilroy et al., 1993; Poovaiah and Reddy, 1993; Webb et al., 1995).
Although considerable progress has been made in elucidat- ing the transduction elements involved in plant cell signal transduction, little is known about the manner in which stimu- lus specificity is encoded in the Ca2+ signal or the encryption process responsible for describing the strength of a stimulus. Severa1 mechanisms may contribute to these processes. First, additional factors may act in parallel with Ca2+ or modify the action of changes in [Ca2+Ii. For example, both abscisic acid, which promotes stomatal closure (Mittelheuser and van
1 To whom correspondence should be addressed.
Steveninck, 1969), and auxin, which promotes stomatal opening (Pemadasa, 1982), induce an increase in [Ca2+]i in stomatal guard cells (Irving et al., 1992). However, whereas abscisic acid induces an increase in guard cell cytosolic pH, auxin induces a decrease in cytosolic pH (Irving et al., 1992). It has been suggested that the opposite changes in cytosolic pH are responsible for the differential response of stomata to these two plant hormones (MacRobbie, 1992; Assmann, 1993; Blatt and Thiel, 1993). Second, spatial heterogeneities in increases in [Ca2+Ii may differentially activate discretely local- ized Ca2+-mediated signaling pathways (Tsien and Tsien, 1990). Third, oscillations in [Ca2+li may increase the amount of information encoded by the changes in [Ca2+Ii (Berridge and Galione, 1988; Berridge et al., 1988; Fewtrell, 1993).
To date, there has been little evidence of oscillations in [Ca2+Ii in plants (Read et al., 1993). However, stimulus- induced oscillations in [CaZ+li have been extensively studied in animal cells (for example, see Berridge and Galione, 1988; Berridge et al., 1988; Berridge, 1990, 1993; Tsien and Tsien, 1990; Meyer and Stryer, 1991; Fewtrell, 1993). A number of models have been proposed to account for the generation and maintenance of oscillations in [Caz+]i in animals, and their possible physiological significance has been widely discussed (Berridge and Galione, 1988; Berridge et al., 1988; Berridge, 1990, 1993; Eichwald and Kaiser, 1993; Fewtrell, 1993). The pat- tern of oscillations observed is dependent on the cell type and varies depending on the strength and nature of the stimulus

1208 The Plant Cell
(Berridge et al., 1988; Meyer and Stryer, 1991; Fewtrell, 1993). Therefore, it has been suggested that the potential exists for encoding signaling information in the pattern of oscillations in [Ca2+Ii (Berridge and Galione, 1988; Berridge et al., 1988; Fewtrell, 1993), providing a mechanism for introducing a high leve1 of stimulus specificity into stimulus-induced increases in [Ca2+Ii.
Stomatal guard cells constitute an attractive system in which to investigate intracellular signaling mechanisms in plants (MacRobbie, 1992; Assmann, 1993). Ca2+ has been shown to act as a second messenger in the response of stomata to both opening and closing stimuli (McAinsh et al., 1990, 1992; Schroeder and Hagiwara, 1990; Gilroy et al., 1991; lrving et al., 1992; Allan et al., 1994). CaZ+-regulated ion channels, which act as primary effectors in the signal transduction cas- cade linking extracellular stimuli to alterations in guard cell turgor and hence stornatal aperture, have also been identi- fied (MacRobbie, 1992; Assmann, 1993). In this study, we employed fluorescence photometric and imaging techniques (McCormack and Cobbold, 1991) to investigate the regulation of cellular Ca2+ homeostasis and possible mechanisms of en- coding stimulus-specific information in the Ca2+ signal in plant cells by using the response of stomatal guard cells to externa1 Ca2+ ([Ca2+],), a closing stimulus (Mansfield et al., 1990; MacRobbie, 1992; Assmann, 1993), as a model.
RESULTS
A
3 Y s 8j a lu - lu c 2 b c v)
Response of Stomata to [Ca2+],
Figure 1 shows that [Ca2+], has a marked effect on stomatal aperture in Commelina communis, causing stomatal closure. The degree of closure is directly related to the concentration of [Ca2+Ie, with the amount of stomatal closure increasing with the amount of [Ca2+le. In the presence of 2 mM EGTA, reduc- ing [Ca2+], to vanishingly low levels, apertures were 19.7 f 0.3 pm (Figure 1A). lncubation of open stomata for 1 hr with 0.01 mM [Ca2+]e had no significant (P > 0.05) effect on aper- tures. In contrast, a 1-hr incubation in 0.1 or 1.0 mM [Ca2+], resulted in significant (P < 0.05) stomatal closure (giving final apertures of 17.2 f 0.2 and 11.5 2 0.3 pm, respectively). Fur- ther examination of this relationship revealed that stomatal responses to [Ca2+], were biphasic (Figure 1B). During the first phase, the initial rates of closure (determined in the first 30 min of the response) were the same for both 0.1 and 1.0 mM [Ca2+]e (15.9 pm hr-l). During the second phase of the response, the rate of closure induced by 1.0 mM [Ca2+], de- creased to -3.0 pm hr-’. However, there was a lag of -30 min when no change in stomatal aperture occurred, before the new rate of closure induced by 0.1 mM [Ca’+Ie was established. The rates of closure induced by 0.1 and 1.0 mM [Ca2+]e were then the same. This resulted in the differences in stomatal aper- ture observed after 1 hr. There was no significant (P > 0.05) effect of 0.01 mM [Ca2+]e on stomatal aperture until 80 min
F 0 8 ’ 9 0 -
[Ca2+ 1 e (mM) 6
20, Y 19 18 17 16 15 14 13 12 11
time (min) Figure 1. Stomatal Responses to [Ca2+],
(A) Stomatal apertures following the incubation of stomata open to 18 to 20 pm for 1 hr in the presence of 2 mM EGTA (bar at left), reduc- ing [Ca2+], to vanishingly low levels, or 0.01 (solid bar), 0.1 (hatched bar), or 1.0 mM (open bar) CaCI2. Values are the means of 120 mea- surements (+SE). (E) Rates of stomatal closure in response to the addition (arrowhead) of 0.01 (A), 0.1 (O), or 1.0 mM (O) CaCI2. Values are the means of 15 measurements (?SE).
into the response; at this time, there was no difference between the final rates of closure induced by the three concentrations of [Ca2+le. A two-stage response has also been reported dur- iiig dark-induced stomatal closure (Mansfield and Meidner, 1966).
Oscillations in [Ca2+Ii in Stomatal Guard Cells
The effects of [Ca2+], on guard cell [Ca2+Ii are shown in Fig- ure 2. When guard cells were perfused with 0.01 mM [Ca2+]e

Oscillations in Plant Cytosolic Ca2+ 1209
(n = 6 cells), there was no change in [Ca2+Ii (Figure 2A), al- though these cells were still capable of regulating [Ca2+Ii under conditions of elevated [Ca2+Ie, showing that they were undamaged. Consequently, the addition of 1.0 mM CaCI2 was
A
'Ooo 1 n
v F
100 10
I -
B 1000 '1
I -
C loo0 1
- 1
Figure 2. Effects of [Ca2+], on Guard Cell [CaZ+],.
Fura-2-loaded guard cells of stomata open to 6 to 10 pm were per- fused with 0.01 (solid bars), 0.1 (hatched bar), or 1.0 mM (open bars) [Canil,, and [Caz+], was monitored by ratio photometry. Representa- tive responses to the three concentrations of [Ca2+], are shown in (A)
(A) No apparent effect on [Ca2+], by 0.01 mM [CaZ+],. The ability of cells to regulate [Can+], was assessed by the addition of 1.0 mM CaCI2 (n = 6 cells). (B) Symmetrical oscillations in [Caz+], induced by 0.1 mM [Ca2+], (n = 77 cells). (C) Asymmetrical oscillations in [Caz+], induced by 1.0 mM [Ca2+], (n = 34 cells). Bars = 10 min.
to (C).
loo0 1
Figure 3. Abolition of Oscillations in [Caz+h.
Guard cells of closed stomata were microinjected with fura-2 into the cytosol, and the stoma opened to 6 to 10 pm. Resting [Caz+li was de- termined during perfusion with 0.01 mM [CaZ+], (solid bars). Guard cells were subsequently perfused with 0.1 mM [Ca2+], (hatched bar) and then returned to 0.01 mM [Caz+],. Changes in [Ca2+Ii were moni- tored by ratio photometry. The response shown is representative of measurements made with 10 cells. Bar = 10 min.
used as a positive control under these conditions and provided an additional indicator of cell viability (Gilroy et al., 1991; McAinsh et al., 1992). The resting [Ca2+],, during perfusion with 0.01 mM [Ca2+Ie, was determined at the start of each ex- periment. Resting [Ca2+], remained at a constant level in unstimulated cells, with values ranging from 90 to 250 nM (Figures 2 to 5). These values are similar to those reported previously for guard cells (Gilroy et al., 1990, 1991; McAinsh et al., 1990, 1992; Schroeder and Hagiwara, 1990; lrving et al., 1992; Allan et al., 1994). When [Ca2+]e was increased to 0.1 mM (Figure 28) and 1.0 mM (Figure 2C), there was a tran- sitory rise in [Ca2+Ii, which subsequently entered into a series of oscillations. Once established, the amplitude and period of the oscillations in a given cell remained constant, in the pres- ente of the stimulus, for up to 3 hr. All cells exhibiting a regulated increase in [Ca2+], in response to 0.1 or 1.0 mM [Ca2+Ie displayed this oscillatory behavior (n = 102 cells). This was not a consequence of changes in the concentration of external chloride ions rather than [Ca2+]e, because the ad- dition of 2 mM chloride ions, by increasing the external concentration of KCI by 2 mM, had no effect on [Ca2+J, (data not shown).
The pattern of oscillations was dependent on the concen- tration of [Ca2+],. Typically, 0.1 mM [Ca2+Ie (n = 77 cells) induced symmetrical oscillations with an amplitude of 300 to 560 nM and a period of 5 to 17 min (mean period of 8.3 f 0.8 min; Figure 2B), whereas 1.0 mM [Ca2+], (n = 34 cells) induced oscillations that were asymmetrical in character with an amplitude of 400 to 850 nM and a period of 10 to 16 min (mean period of 13.6 2 0.6 min; Figure 2C). The major oscilla- tions characteristic of 1.0 mM [Ca2+], were preceded by a series of minor oscillations around an elevated basal level of [Ca2+],. These may represent an adjustment phase during which the cell was reestablishing intracellular Ca2+ homeosta- sis. The total increase in [Ca2+], integrated over the period of the oscillations (Berridge and Prince, 1972) was 3.5 times greater when cells were perfused with 1.0 mM (Ca2+], as

1210 The Plant Cell
1000 - - h
F v - - N m O Y
A 1000 -
100 - 10 - ,i M LJ
Figure 4. Modulation of Oscillations in [Ca2+li.
Fura-2-loaded guard cells of open stomata (6 to 10 pm) were perfused with either 0.1 (hatched bars) or 1.0 mM (open bars) [Ca2+Ie. After the characteristic oscillations in [Ca2+]i were established, the concentration of [Ca*++le was changed (within the range that induced oscillatory be- havior). Resting [Ca2+], was determined at the start of each experiment during perfusion with 0.01 mM [Ca2+], (solid bars). Representative responses are shown in (A) and (8). (A) The effect of decreasing [Ca2+], from 1.0 to 0.1 mM (n = 6 cells). (8) The effect of increasing [Ca2+], from 0.1 to 1.0 mM (n = 9 cells). Bars = 10 min.
compared with oscillations induced by 0.1 mM [Ca2+]e (4991 f 781 nM min and 1418 f 260 nM min, respectively).
Stimulus Dependence of Oscillations in [Ca2+Ii
The continued presence of either 0.1 or 1.0 mM [Ca2+], as a stimulus was required to maintain the oscillations in [Ca2+Ii. Figure 3 shows that when guard cells exhibiting oscillations in response to 0.1 mM [Ca2+], were returned to 0.01 mM [Ca2+]e, the oscillations were immediately abolished and replaced by the previous or a lower resting level of [Ca2+]j (n = 10 cells).'This also occurred in cells perfused with 1.0 mM [Ca2+], and returned to 0.01 mM [Ca2+], (data not shown). The lower resting level of [Ca2+Ii observed in -50% of cells may represent a temporary adjustment phase before the reestab- lishment of the intracellular Ca2+ homeostasis.
Modulation of the Oscillatory Behavior
Figure 4 shows that changing [Ca2+Ie within the concentra- tion range that induced oscillations resulted in an alteration in the established oscillatory pattern. When guard cells ex- hibiting characteristic oscillations in response to 1.0 mM
[Ca2+], were perfused with 0.1 mM [Ca2+]e (n = 6 cells), there was a change in the pattern of oscillations as the oscillations typical of the lower concentration were established (Figure 4A). This was reflected by a decrease in the ratio of the total change in [Ca2+Ii integrated during the rising phase to the total change in [Ca2+Ii integrated during the falling phase (from between 1.3 and 1.4 to .ul.O), indicating a switch from asym- metrical to symmetrical oscillations. In addition, there was a lag phase before a new oscillatory pattern was established. This lag may reflect the cell adjusting to the new level of [Ca2+],. In contrast, when [Ca2+]e was increased from 0.1 to 1.0 mM (n = 9 cells), there was an increase in the ratio from 4 . 0 to between 1.4 and 1.7. This reflected an immediate switch from the symmetrical oscillations induced by 0.1 mM [Ca2+]e to the oscillatory behavior, which was characterized by asym- metrical oscillations, typical of that induced by 1.0 mM [Ca2+Ie (Figure 4B).
Ca2+ lnflux across the Plasma Membrane Contributes to the Rising Phase of Oscillations in [Ca2+],
We have used two approaches to assess the contribution made by Ca2+ influx to the observed oscillatory behavior: Ca2+ channel blockers, which are known to inhibit Ca2+ entry into

Oscillations in Plant Cytosolic Caz+ 121 1
plant cells (Hetherington et al., 1992) and have been previ- ously shown to be active in stomatal guard cells (MacRobbie, 1989; McAinsh et al., 1991), and the Mn2+-quenching tech- nique (Sage et al., 1989; Kass et al., 1990; Fasolato et al., 1993).
Figure 5 shows that the Ca2+ channel blocker verapamil caused a marked change in the oscillatory behavior induced by [Ca2+]e. When cells exhibiting oscillations in response to 0.1 mM [Ca2+]e were perfused with 0.1 mM [CaZ+le contain- ing 0.01 mM verapamil (n E 10 cells), there was a reduction in the amplitude of the oscillations leading to the abolition of the oscillatory behavior (Figure 5A). A similar effect on 0.1 mM [Ca2+je-induced oscillations was observed using 0.01 mM bepridil (data not shown). In contrast, 0.01 mM verapamil caused an alteration in the pattern of oscillations induced by 1.0 mM [Ca2+]e (n = 5 cells). Oscillations were converted from the characteristic asymmetrical pattern to symmetrical oscil- lations (Figure 58). At both concentrations of [Ca2+]e, there was a lag of one oscillation before these changes became ap- parent. lncreasing the verapamil concentration from 0.01 to 0.1 mM had no further effect on the pattern of oscillations (data not shown). Unfortunately, it was not possible to use La3+, which has been shown to inhibit &(=a2+ influx into guard cells (MacRobbie, 1989), in these studies due to interference with the Ca2+-dependent fluorescence of fura-2 (data not shown).
MnZf has been widely used as a tracer to study Ca2+ in- flux across the plasma membrane in animal cells (Sage et al., 1989; Kass et al., 1990; Fasolato et al., 1993). This technique relies on two well-established experimental observations: ( 1 ) Mn2+ competes with Ca2+ for passage through Ca2+- permeable channels (Sage et al., 1989; Luckhoff and Clapham, 1992); and (2) Mn2+ has a very high affinity for fura-2 (dissoci- ation constant of 2 nM), so that when Mnz+ binds to fura-2, it quenches the fluorescence of the dye at all excitation wavelengths (Kwan and Putney, 1990). Changes in both the Ca2+-independent fluorescence (used to follow changes in fluorescence due to quenching by Mn2+) and the Ca2+- dependent fluorescence (used to calculate [Ca2+],) can be monitored simultaneously. This allows changes in [Ca2+], to be related to the entry of Mn2+, and by inference, the Ca2+ in- flux across the plasma membrane, into cells. Recently, the Mn2+ permeability of Ca2+-selective channels has been clearly demonstrated in plants (Piiieros and Tester, 1995). This sug- gests that Mn2+ entry can also be used to trace Ca2+ influx into plant cells through Ca2+-permeable channels by follow- ing the reduction in the CaZc-independent fluorescence of fura-2-loaded cells in the presence of externa1 Mn2+. How- ever, the Mn2+ permeability of Ca2+-permeable channels still remains to be demonstrated in guard cells, and therefore, this
F Y
.- - + N m o Y
1 O0 10
Figure 5. Effects of Verapamil on [Ca2+],-lnduced Oscillations in [Ca2+],
Fura-2-loaded guard cells of stomata open to 6 to 10 pm were perfused with either 0.1 (hatched bar) or 1.0 mM (open bar) [Ca2+],. After the characteristic oscillations in ICa2+], were established, guard cells were perfused with the same concentration of [Ca2+]. containing 0.01 mM vera- pamil (dotted bars). Resting [Ca2+li was determined at the start of each experiment during perfusion with 0.01 mM [Ca2+], (solid bars). Representative responses are shown in (A) and (E). (A) The effect of 0.01 mM verapamil on oscillations in [Ca2+Ii induced by 0.1 mM [Ca2+], (n = 10 cells). (E) The effect of 0.01 mM verapamil on oscillations in [Ca2+Ii induced by 1.0 mM [Ca2+], (n = 5 cells). Bars = 10 min.

1212 The Plant Cell
technique does not exclude the possibility of Mn2+ entry through nonselective channels or Ca2+ influx via an Mn2+- impermeable route.
Figure 6 shows that Mn2+ had a marked effect on both the Ca2+-independent fluorescence and the Ca2+-dependent fluorescence ratio. When guard cells exhibiting characteristic oscillations in response to 0.1 mM (n = 7 cells; Figure 6A) or 1.0 mM (n = 6 cells; Figure 6B) [Ca2+]e were perfused with the same concentration of [Ca2+]e containing 1.0 mM MnCI2, there was an immediate decrease in the Ca2+-independent
fura-2 fluorescence. Decreases occurred in a series of rapid drops followed by periods in which the fluorescence remained relatively constant. The rapid drops in fluorescence cor- responded exactly with the rising phase of oscillations. These data indicate that Mn2+, and by inference Ca2+, enters guard cells during the rising phase of oscillations in [Ca2+Ii.
There was also damping of the oscillatory behavior follow- ing the addition of 1.0 mM MnCI2. Although less striking, this effect is similar to the effect of Ca2+ channel blockers on [Ca2+Je-induced oscillations in [Ca2+]i (Figure 5) and may
“us*,
1000 1”
s o 100
N
B
lOO0,B B, I
-4000 o C
- 3500 2 - E!2 o ‘E
-3000 2 , Q ) = 2
-2500 $ a a a ?
-2000 ; 2 ._ - I +
- 1500 o - i
Figure 6. The Use of Mnz+ as a Tracer of Ca2+ lnflux during Oscillations in [Can+],.
Guard cells of stomata open to between 6 and 10 flm and loaded with fura-2 in the cytosol were perfused with either 0.1 (hatched bar) or 1.0 mM (open bar) [Ca2+],. After the characteristic oscillations in [Cant], were established, guard cells were perfused with the same concentration of [Ca2+], containing 1.0 mM MnCI, (dotted bars). Mnz+, which can be used as a tracer for Caz+ channel-mediated Ca2+ influx, quenches the fluorescence emissions of fura-2 at all excitation wavelengths. Changes in both the Ca2+-dependent fura-2 fluorescence (used to calculate [Ca2+],) and the Ca‘+-independent fluorescence (used to follow Caz+-independent changes in the fura-2 fluorescence due to quenching that indicated the entry of Mn2+ into cells) were monitored photometrically. Mnz+ quenching of the Ca‘+-independent fura-2 fluorescence occurred in a series of steps (arrowheads marking rapid drops in fluorescence). Resting [Caz+], was determined at the start of each experiment during perfusion with 0.01 mM [Ca2+], (solid bars). Representative responses are shown in (A) and (B). (A) Changes in the Ca2+-dependent fluorescence ratio and Caz+-independent fura-2 fluorescence in response to 1 .O mM external Mn2+ during oscillations in [Ca2+], induced by 0.1 mM [Ca2+], (n = 7 cells). (8) Changes in the Ca2+-dependent fluorescence ratio and Ca2+-independent fura-2 fluorescence in response to 1.0 mM external Mn2+ during oscillations in [Ca2+], induced by 1.0 mM [Caz+], (n = 6 cells). Bars = 10 min.

Oscillations in Plant Cytosolic Ca2+ 1213
400
Figure 7. Oscillations in [Ca2+], lnduced by the lntracellular Release of Ca2+ from Caged Ca2+.
Guard cells of closed stomata perfused with 0.01 mM [Ca2+], were microinjeded with 0.1 mM Calcium Green-1 (a nonratiometric Ca2+- sensitive dye) and 10 mM Nitr-5 (caged Ca2+) into the cytosol, and the stoma subsequently opened to 6 to 10 pm. Photoactivation of the Nitr-5 to release Ca2+ was achieved by exposure to a 10- to 20-sec pulse of 380-nm light (arrowhead). Changes in [Can+], were monitored pho- tometrically and expressed in fluorescence units (high values represent high [Ca2+li). The response shown is representative of measurements made with three cells. Bar = 10 min.
reflect the inhibition of Ca2+ transport across the plasma membrane by Mn2+ in a manner analogous to that reported in membrane vesicles of maize (Marshall et al., 1994).
lncreases in [Ca2+], Trigger Oscillatory Behavior
The photolytic release of Ca2+ from caged Ca2+ in guard cells perfused with 0.01 mM [Ca2+]e, a concentration that has no effect on [Ca2+Ii (Figure 2A), induced oscillatory behavior. Fig- ure 7 shows that oscillations in [Ca2+Ii were symmetrical with a mean period of 4.5 f 0.3 min (n = 3 cells). The period of the oscillations in a given cell remained constant. However, oscillations became rapidly damped and were abolished within 30 min following photoactivation of caged Ca2+. This damped oscillatory behavior may represent a Ca2+ homeostatic re- sponse in which [Ca2+]i “hunts” before a new steady resting leve1 of [Ca2+Ii is established. The falling phase of the oscil- lations may result from Ca2+ being pumped out of the cell or sequestered into intracellular stores, whereas the rising phase may reflect either Ca2+-induced Ca2+ release from intracellu- lar Ca2+ stores (Berridge et al., 1988; Berridge, 1990, 1993; Eichwald and Kaiser, 1993; Fewtrell, 1993) or Ca2+-induced Ca2+ influx across the plasma membrane.
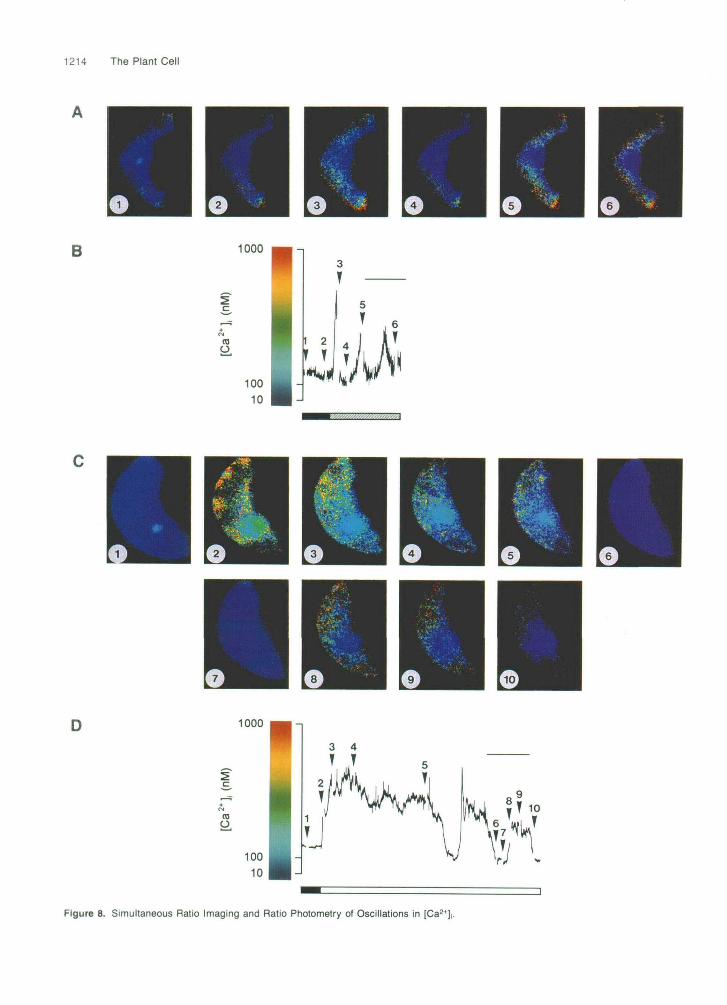
Spatial Distributions of [Caz+Ii during Oscillations in Response to [Ca*’]e Are Uneven
Spatial heterogeneities in increases in [Ca2+Ii may play an im- portant role during Ca2+-mediated signal transduction (Tsien
and Tsien, 1990). Therefore, simultaneous imaging and pho- tometric studies were conducted on the same guard cell to investigate the spatial and temporal dynamics of the oscilla- tory changes in [Ca2+]i. Ratio images obtained using this technique show the spatial distribution of [Ca2+Ii -2.5 sec af- ter the last photometric determination of [Ca2+Ii made on-line before the images were acquired. Figure 8 shows that in- creases in [Ca2+Ii were unevenly distributed throughout cells during the oscillatory behavior characteristic of both 0.1 mM (n = 6 cells; Figures 8A and 88) and 1.0 mM (n = 5 cells; Figures 8C and 8D) [Ca2+]e. In addition, during the transitory rise and minor oscillations that precede the characteristic os- cillations induced by 1.0 mM [Ca2+Ie, increases in [Ca2+Ii appeared to occur in two distinct stages (Figures 8C and 8D). Initially, increases were observed in the cytoplasmic regions around the periphery of cells (Figure 8C, image 2), followed by an increase in the cytoplasm surrounding the vacuolar re- gion (Figure 8C, image 3). However, to date, we have been unable to demonstrate a similar pattern of spatial-temporal localization in any of the characteristic oscillations in response to 0.1 or 1.0 mM [Ca2+Ii. This may reflect the discrete inter- vals at which images are acquired. Consequently, increased temporal resolution may be required before it is possible to assess the significance of these observations.
DISCUSSION
The Response of Guard Cells to [Ca2+]e Provides a Model for the lnvestigation of Ca2+-Based Signal Transduction
We used stomatal responses to [Ca2+], as a model to address one of the outstanding questions in the area of Ca2+-based cell signaling,.namely, the mechanism by which stimuli of differ- ent strengths are transduced into a graded physiological response through increases in [Ca2+Ii. Figure 1 demonstrates clearly the ability of stomatal guard cells to discriminate be- tween different strengths of an external signal when formulating their final response, that is, a reduction of guard cell turgor leading to stomatal closure. In addition, these data show that differences in signal strength were not simply translated into differences in the rate of stomatal closure (Figure 1B). In light of these observations, we investigated the potential for the Ca2+ signal to contain the stimulus-specific information re- quired to produce a specific stimulus-dependent response.
The Strength of the Externa1 Stimulus Determines the Nature of the Ca2+ Signal
The results described in this study show conclusively that the nature of the Ca2+ signal is absolutely dependent on the strength of the external stimulus (Figure 2). These data also demonstrate that it is possible to switch between different
1214 The Plant Cell
B 1000
(0o
10010
I 2r T
1000
o
10010
Figure 8. Simultaneous Ratio Imaging and Ratio Photometry of Oscillations in [Ca2+

Oscillations in Plant Cytosolic Ca2+ 1215
Ca2+ signals by changing the strength of the external stimu- lus and that this switch is reversible (Figures 3 and 4). The generation of stimulus-specific patterns of oscillations in [Ca2+Ii may provide a mechanism for coupling signals of different strengths to their characteristic responses. Previously, changes in [Ca2+Ii akin to oscillations have been reported in a minority of guard cells (McAinsh et al., 1990; Gilroy et al., 1991) and in oat protoplast (Volotovski et al., 1993) and maize epidermal cells (Felle, 1988). However, in manystudies, it has been concluded that these represent artifacts of signal detec- tion (for review, see Read et al., 1993). Our data illustrate the direct relationship between the strength of the external stimu- lus (that is, the concentration of [Ca2+]e), the pattern of the oscillations, and the magnitude of the physiological response (that is, the degree of stomatal closure).
In animals, oscillations in [Ca2+Ii occur in a wide range of cell types in response to many different agonists (for reviews, see Berridge et al., 1988; Berridge, 1990; Fewtrell, 1993). For a given cell type, the pattern of agonist-induced oscillations in [Ca2+Ji is a direct function of both the agonist applied and its concentration (Berridge et al., 1988; Meyer and Stryer, 1991; Fewtrell, 1993). Typically, oscillations with periods varying from <1 sec in cardiac muscle up to 30 min in mouse oocytes have been reported (Berridge et al., 1988). Therefore, the mean period of oscillations in [Ca2+Ii observed in guard cells (0.1 mM [Ca2+],, 8.3 f 0.8 min; 1.0 mM [Ca2+Je, 13.6 f 0.6 min) falls within the range observed in animals. On the basis of the data presented in this article, the generation of stimulus-specific oscillations in [Ca2+li that are modulated in a manner depen- dent on the strength of the stimulus, creating a stimulus-specific “Ca2+ fingerprint,” appears to be an important feature of Ca2+- based cell signaling, which is conserved between plants and animals.
The Generation of Oscillations in [Ca2+],
Severa1 models have been proposed for the generation and maintenance of oscillations in [Ca2+Ii in animals cells, and these have been reviewed extensively (Berridge and Galione, 1988; Berridge et al., 1988; Berridge, 1990, 1993; Eichwald and Kaiser, 1993; Fewtrell, 1993). We have used two approaches
to examine the origin of the Ca2+ required for the generation of oscillations in [Ca2+Ii: (1) Ca2+ channel blockers that are known to inhibit Ca2+ entry into plant cells (Hetherington et al., 1992) and that have been shown previously to have activ- ity in stomatal guard cells (MacRobbie, 1989; McAinsh et al., 1991), and (2) the Mn2+-quenching technique (Sage et al., 1989; Kass et al., 1990; Fasolato et al., 1993). The Ca2+ chan- nel blocker verapamil caused a reduction in the amplitude of the oscillations in [Ca2+Ii induced by 0.1 mM [Ca2+Ie, leading to abolition of the oscillatory behavior (Figure 5A). In addition, Figure 6A shows clearly that the rapid entry of Mn2+, and by inference Ca2+ influx, coincided with the rising phase of os- cillations. These data may suggest that Ca2+ influx is responsible for the increases in [Ca2+Ii during 0.1 mM [Ca2+],- induced oscillations, implying that an oscillator, located in the plasma membrane, is responsible for regulating Ca2+ influx. A plasma membrane Ca2+ channel, which is regulated either directly by [Ca2+Ie or indirectly by another factor such as membrane potential, could constitute such an oscillator. Patch clamp data have revealed severa1 different classes of plasma membrane channels that can allow the entry of Ca2+ into stomatal guard cells: stretch-activated Ca2+-selective chan- nels; the inwardly rectifying K+ channel, which exhibits a limited permeability to Ca2+; and nonselective Ca2+-perme- able channels (for a review, see Schroeder, 1992). However, until recently there has been little electrophysiological evidence for a specific voltage-dependent Ca2+ channel in the plasma membrane of plants. Membrane depolarization is an early event in the signal transduction cascade triggered by many physio- logical stimuli in plants (for review, see Tester, 1990). Recently, voltage-dependent Ca2+-permeable channels have been reported in the plasma membrane of carrot cells (Thuleau et al., 1994a, 1994b) and in plasma membrane fractions from wheat (Piiieros and Tester, 1995) and rye (White, 1994) roots. If these CaZ+-permeable channels exist in stomatal guard cells, they could constitute a regulated pathway for the entry of Ca2+ into the cytosol during oscillations in [Ca2+Ii.
The falling phase of oscillations in response to 0.1 mM [Ca2+]e can be explained most simply through the action of Ca2+-sensitive Ca2+ efflux mechanisms (for reviews, see Evans et al., 1991; Hetherington et al., 1992; Johannes et al., 1992; Maathuis and Sanders, 1992; Evans, 1994; Webb et al.,
Figure 8. (continued). Guard cells of closed stomata were microinjected with fura-2 into the cytosol, and the stoma opened to 6 to 10 pm. Resting [Ca2+], was deter- mined during perfusion with 0.01 mM [Ca2+Ie (solid bars), after which guard cells were perfused with either 0.1 (hatched bar) or 1.0 mM (open bar) [Cant],, stimulating characteristic oscillatory behavior. Oscillations were continuously monitored by ratio photometry ([B] and [O]). Ratio im- ages were obtained at discrete intervals ([A] and [C]), depending on the changes in [Ca2+], reported by the ratio calculated on-line using photometry. The numbered images shown in (A) and (C) indicate the spatial distribution of [Ca2+], -2.5 sec after the numbered points shown in (6) and (D) indicated by arrowheads. (A) Ratio images of oscillations in [Ca2+], induced by 0.1 mM [Ca2+]. (n = 6 cells). (B) Oscillations in [Ca2+], induced by 0.1 mM [Ca2+je monitored by ratio photometry (n = the same 6 cells as in [A]). (C) Ratio images of oscillations in [Ca2+], induced by 1.0 mM [Ca2+Ie (n = 5 cells). (D) Oscillations in [Ca2+], induced by 1.0 mM [Ca2+], monitored by ratio photometry (n = the same 5 cells as in [C]). Bars = 10 min.
1216 The Plant Cell
1995). Ca2+-ATPases, identified in the plasma membrane, and the tonoplast and endoplasmic reticulum of plant cells (Evans et al., 1991; Evans, 1994), together with H+/Ca2+ antiporters (Johannes et al., 1992) and outward-rectifying Ca2+ channels reported in the vacuolar membrane (Pantoja et al., 1992), may provide such a mechanism, allowing Ca2+ to be expelled from the cytosol into the apoplast or to be sequestered into intra- cellular stores such as the vacuole.
In contrast, oscillations in response to 1.0 mM [Ca2+Je are more complex than those elicited by 0.1 mM [Ca2+]e; conse- quently their generation requires additional explanation. Figure 56 shows that verapamil converts the oscillatory behavior from an asymmetrical pattern to a symmetrical one, whereas Fig- ure 6B shows that Mn2+, and by inference Ca2+, enters cells during the rising phase of oscillations in [Ca2+Ii in response to 1.0 mM [Ca2+],. Therefore, our data suggest that Ca2+ in- flux, regulated by an oscillator(s) located in the plasma membrane, contributes to the generation of 1.0 mM [Ca2+]e- induced oscillations in [Ca2+Ii. In addition, the inability of ver- apamil to abolish totally the oscillatory behavior and the apparent absence of Mn2+ influx during the second half of the asymmetrical oscillatory pattern raise the possibility that a sec- ond source of Ca2+ may contribute to the generation of this oscillatory behavior. This source might be Ca2+ released from intracellular stores through the action of an intracellular oscil- lator. However, our data do not exclude the involvement of Ca2+ influx through either verapamil-insensitive and/or Mn2+- impermeable Ca2+ channels in the plasma membrane. A vacuolar membrane Ca2+ channel would constitute a prime candidate for an intracellular oscillator. Three categories of Ca2+-selective channels have been characterized in the vacuolar membrane of plants: inward-rectifying voltage-gated channels, inositol 1,4,5-trisphosphate-gated Ca2+ release channels, and outward-rectifying Ca2+ channels (for a review, see Allen and Sanders, 1994). Recently, the voltage-dependent slow vacuolar cation channel, which has been characterized previously as a nonselective Ca2+-activated voltage-depend- ent channel (for a review, see Ward and Schroeder, 1994), has also been implicated in the release of Ca2+ from the vacuole in guard cells (Ward and Schroeder, 1994).
been proposed that in animals, protein phosphorylation may provide a mechanism by which this decoding can occur via the coupled action of a phosphatase and a kinase (Goldbeter et al., 1990). For example, oscillatory changes in [Ca2+li would modify the activity of a Ca2+-activated protein phosphatase while having no effect on that of a Ca2+-independent protein kinase, causing the level of the dephosphorylated form of a target protein to go up and down. The presence of phospha- tases and kinases, which exhibit different Ca2+ activation kinetics, could allow differential decoding of stimulus-specific patterns of oscillations in [Ca2+li into a range of physiological responses that can occur downstream of phosphorylation events.
Conclusions
Our studies indicate a role for stimulus-induced oscillations in [Ca2+Ii during Ca2+-based signal transduction. The pattern of stimulus-induced oscillations is directly related to the strength of the external stimulus, both of which correlate with the de- gree of stomatal closure. This suggests that oscillations are a feature of Ca2+-based signaling that is conserved between plants and animals and that they provide a possible mecha- nism for encoding the information required to distinguish between a number of different Ca2+-mobilizing stimuli. How- ever, it is also possible to imagine a more prosaic but equally important explanation to account for their existence. Oscilla- tions may be a feature of the machinery responsible for the maintenance of cellular Ca2+ homeostasis, representing cy- cles of Ca2+ efflux and release in response to “Ca2+ overload” as the cell establishes a new resting level of [Ca2+Ii. Neverthe- less, the results presented in this study highlight the importance of establishing the concentration of apoplastic free Ca2+ that is perceived by plant cells, because, on the basis of these data, the concentration of [Ca2+], selected for experimental manipu- lations would be expected to influence [Ca2+]i in a profound manner.
METHODS
The Significance of Oscillations in [Ca*+]i Plant Material
Our data demonstrate clearly that the pattern of oscillations in guard cell [Ca2+Ii is directly related to the strength of the external stimulus, both of which correlate with the magnitude of the physiological response. This suggests strongly that in plants, as in animals, oscillations in [Ca2+Ii provide the poten- tia1 for encoding stimulus-specific information in the Ca2+ signal (Berridge and Galione, 1988; Berridge et al., 1988; Meyer and Stryer, 1991; Fewtrell, 1993). Whether this represents a universal mechanism employed by all plant cells for a range of stimuli requires further investigation. In addition, we can only speculate about the signaling machinery downstream of Ca2+ that is responsible for decoding this information. It has
Plants (Commelina communis) were grown from seed (McAinsh et al., 1991). lmmediately prior to each experiment, the epidermis was peeled carefully from the abaxial surface of the youngest fully expanded leaf of 4-week-old plants and floated on C0,-free 10 mM KCI, 10 mM 2-(N-morpholino)ethanesulfonic acid (Mes)-KOH, pH 6.15, at 25OC. (McAinsh et al., 1992).
Epidermal Strip Bioassay
Freshly prepared epidermis was cut into 5-mm lengths and incubated underconditions promoting stomatal opening for 3 hr (McAinsh et al.,

Oscillations in Plant Cytosolic Ca2+ 1217
1991) and then transferred to C0,-free 50 mM KCI, 10 mM Mes-KOH, pH 6.15 (KCI-Mes), containing either 2 mM EGTA or 0.01, 0.1, or 1.0 mM CaCI,. The strips were incubated for an additional 1 hr, after which they were examined under the microscope to determine the aper- ture of the stomatal pores.
Video Microscopy
Epidermal strips (>2 cm in length) were incubated under conditions promoting stomatal opening (McAinsh et al., 1991) and then mounted, cuticle downward, in a perfusion chamber (McAinsh et al., 1990, 1992). Strips were illuminated (photon flux density of 100 pmol m-, ser1) from the transmitted light source (12 V tungsten lamp) of a Nikon (Sus- sex, UK) Diaphot inverted microscope and perfused with C02-free KCI-Mes containing 0.01, 0.1, or 1.0 mM CaCI2. Stomatal movements were monitored continuously using a JVC (Sussex, UK) color CCD camera and recorded using a SVHS video recorder (JVC). Apertures were subsequently measured from the video monitor calibrated using a Graticule (Dorset, UK) slide.
Microinjection of Fluorescent Dyes and Caged CaZ+
Freshly prepared epidermis (>2 cm in length) in which stomata were open to <1 pm were mounted cuticle side downward in a perfusion chamber (McAinsh et al., 1990, 1992). Guard cells were impaled with filamented glass microelectrodes (<0.25 pm tip diameter) containing 10 mM fura-2 pentapotassium salt or 0.1 mM Calcium Green-1 and 10 mM Nitr-5 (caged Caz+; Calbiochem-Novabiochem, Nottingham, UK) in their tips. Dyes and caged probes were microinjected into the cytosol iontophoretically (McAinsh et al., 1990, 1992). lnjected cells were maintained under conditions promoting stomatal opening for 45 min (McAinsh et al., 1992). Fluorescence measurements were only made on stomata that opened to the same aperture as those on the rest of the epidermal strip (6 to 10 pm) and in which both the injected and noninjected cells of a single stoma exhibited the same increase in turgor. Epidermal strips in which injected guard cells met all the criteria for estimating viability (Gilroy et al., 1991; McAinsh et al., 1992) were perfused with C02-free KCI-Mes, containing 0.01, 0.1, or 1.0 mM CaCI, at 25OC in the presence or absence of 1 mM MnCI, or 0.01 mM verapamil (Calbiochem-Novabiochem), and the fluorescence was monitored.
Fluorescence Microscopy
The perfusion chamber was mounted on the stage of a Nikon Diaphot inverted epifluorescence microscope (McAinsh et al., 1992). Excita- tion light was provided by a 100 W Nikon xenon light source. Excitation wavelengths were specified using 10-nm bandwidth interference filters (fura-2, 340 and 380 nm, 400-nm dichroic mirror; Calcium Green-1, 495 nm, 515-nm dichroic mirror [Cairn Research Ltd., Kent, UK]). These were selected using a spinning filter changer in combination with three metal gauze neutra1 density filters (reducing the excitation intensity to 3%) and transmitted to the microscope via a liquid light guide (Cairn Research Ltd.). The field of excitation was limited to the area of a sin- gle stoma using the excitation diaphragm of the microscope. A Nikon CF Fluor DL 40x oil immersion lens (1.30 numerical aperture) and nonfluorescent immersion oil (Fluka, Dorset, UK) were usedfor all mea- surements. Fluorescent light was passed to the side camera port of
the microscope and focused with a l x television relay lens (Nikon). A Nikon PFX shutter assembly and rectangular emission aperture were used to limit the area of the specimen studied to one stoma. Fluores- cence emissions (fura-2,510 nm with a 20-nm bandwidth interference filter [Nikon]; Calcium Green-1, 530 nm with a 10-nm bandwidth interference filter [Cairn Research Ltd.]) were quantified using the ap- propriate filter and detector combination.
Photometry
Fluorescence measurements were made using a Cairn spectrophotom- eter system. The autofluorescence of each guard cell was determined at each excitation wavelength prior to microinjection (McAinsh et al., 1990, 1992). Autofluorescence subtraction was calculated on-lhe. The spinning filter changer was run at 64 revolutions per second in spin mode, allowing fluorescencs measurements to be obtained at a rate of 64 readings per second. Values were calculated as the mean of 64 individual readings to increase the signal-to-noise ratio. A data point was given each second. For fura-2, the ratio (340/380 nm) was calcu- lated each second on-line. Ratios were converted into measurements of whole-cell cytosolic free Ca2+ ([Ca2+ji) using a predetermined cali- bration curve (see later section).
Ratio lmaging
Ratio imaging and ratio photometric studies were conducted simul- taneously on the same cell. Excitation light was provided by a Cairn spinning filter changer operating in a step mode, which enabled the excitation wavelengths to be changed manually between 340 and 380 nm, for imaging and in a spin mode for photometric measurements. The emission wavelength (fura-2, 510 nm with a 20 nm bandwidth) was specified using a Nikon interference filter. A mechanical detector changer (built by Peter Williams, Lancaster University, Lancaster, UK) was used to switch rapidly between detectors. A switch from photom- etry to imaging took less than a second (with the return to photometry taking up to 15 sec, depending on the final speed of the spinning filter changer, during which time no photometric measurements were ob- tained). Fluorescence images were recorded using a cooled extended ISIS-M intensified CCD camera (Photonic Science, Sussex, UK). Im- ages were acquired using an ARGUS-50 image analysis system (Hamamatsu Photonics Ltd., Middlesex, UK). Typically, images were captured at a resolution of 512 x 512 pixels and digitized to 256 gray levels. Each image recorded was the mean of eight individual frames. The time taken to acquire a pair of 340- and 380-nm images, includ- ing the step between filter positions, was -1.5 sec. lmage pbiit cwre obtained at discrete intervals, depending on the changes in [C;a2‘ii reported by the ratio calculated on-line using photometry. The cam- eradark signal was recorded prior to each experiment and subtracted on-line. The average autofluorescence value, calculated from the cytoplasmic region of an unloaded guard cell at both excitation wave- lengths, was subtracted from images at the end of each experiment (Gilroy et al., 1991). After autofluorescence subtraction, the 340-nm image was divided by the 380-nm image on a pixel-by-pixel basis to produce a ratio image. Ratio images obtained using this technique show the spatial distribution of [Ca2+li -2.5 sec after the last photo- metric determination of [Ca2+Ii made on-line before the pair of 340- and 380-nm images were acquired. The [Caz+]i was coded as differ- ent pseudocolors using a predetermined calibration curve (see later section).
1218 The Plant Cell
Calibration Berridge, M.J. (1990). Calcium oscillations. J. Biol. Chem. 265,
Berridge, M.J. (1993). lnositol trisphosphate and calcium signaling.
Berridge, M.J., and Galione, A. (1988). Cytosolic calcium oscillators.
Berridge, M.J., and Prince, W.T. (1972). Transepithelial potential changes during stimulation of isolated salivary glands with 5-hydrox- ytryptamine and cyclic AMP. J. Exp. Biol. 56, 139-153.
Berridge, M.J., Cobbold, P.H., and Cuthbertson, K.S.R. (1988). Spa- tia1 and temporal aspects of cell signaling. Philos. Trans. R. SOC. Lond. Ser. B 320, 325-343.
Blatt, M.R., and Thiel, 0. (1993). Hormonal control of ion channel gating. Annu. Rev. Plant Physiol. Plant MOI. Biol. 44, 534-567.
Bush, D.S. (1993). Regulation of cytosolic calcium in plants. Plant Phys- iol. 103, 7-13.
Eichwald, C., and Kaiser, F. (1993). Model for receptorcontrolled cyto- solic calcium oscillations and for externa1 influences on the signal pathway. Biophys. J. 65, 2047-2058.
Evans, D.E. (1994). PM-type calcium pumps are associated with higher plant cell intracellular membranes. Cell Calcium 15, 241-246.
Evans, D.E., Briars, S.-A., and Williams, L.E. (1991). Active calcium transport by plant cell membranes. J. Exp. Bot. 42, 285-303.
Fasolato, C., Hoth, M., Matthews, G., and Penner, R. (1993). Ca2+ and Mnz+ influx through receptor-mediated activation of non- specific cation channels in mast cells. Proc. Natl. Acad. Sci. USA
Felle, H. (1988). Auxin causes oscillations of cytosolic free calcium and pH in Zea mays coleoptiles. Planta 174, 495-499.
Fewtrell, C. (1993). Ca2+ oscillations in non-excitable cells. Annu. Rev. Physiol. 55, 427-454.
Gilroy, S., Read, N.D., and Trewavas, A.J. (1990). Elevation of cyto- plasmic calcium by caged calcium or caged inositol trisphosphate initiates stomatal closure. Nature 346, 769-771.
Gilroy, S., Fricker, M.D., Read, N.D., and Trewavas, A.J. (1991). Role of calcium in signal transduction of Commelina guard cells. Plant Cell 3, 333-344.
Gilroy, S., Bethke, P.C., and Jones, R.L. (1993). Calcium homeosta- sis in plants. Celi Sci. 106, 453-462.
Goldbeter, A., Dupont, G., and Berridge, M. J. (1990). Minimal model for signal-induced Ca2+ oscillations and for their frequency encod- ing through protein phosphorylation. Proc. Natl. Acad. Sci. USA87, 1461-1465.
Hetherington, A.M., Graziana, A., Mazan, C., Thuleau, P., and Ranjeva, R. (1992). The biochemistry and pharmacology of plasma- membrane calcium channels in plants. Philos. Trans. R. SOC. Lond. Ser. B 338, 91-96.
Irving, H.R., Gehring, C.A., and Parish, R.W. (1992). Changes in cyte solic pH and calcium of guard cells precede stomatal movements. Proc. Natl. Acad. Sci. USA 89, 1790-1794.
Johannes, E., Brosnan, J.M., and Sanders, D. (1992). Calcium chan- nels in the vacuolar membrane of plants: Multiple pathways for intracellular calcium mobilization. Philos. Trans. R. SOC. Lond. Ser.
Kass, E.N., Llopis, J., Duddy, S.K., and Orrentius, S. (1990). Receptor-operated calcium influx in rat hepatocytes. J. Biol. Chem.
9583-9586.
Nature 361, 315-325.
FASEB J. 2, 3074-3082.
90, 3068-3072.
8. 338, 105-112.
265, 17486-17492.
Similar results were obtained for both in vitro and in vivo calibration of the Ca2+-dependent ratio in guard cells (Gilroy et al., 1991; McAinsh et al., 1992). Consequently, an in vitro calibration is routinely used. Calibration of the Ca2+-dependent fluorescence of Calcium Green-1 is complex and only yields approximate values. Therefore, measure- ments of [Ca2+Ii using Calcium Green-1 were expressed in relative fluorescence units (Allan et al., 1994).
Mn2+-Quenching Experiments
The influx of Ca2+ into fura-2-loaded guard cells was assessed through the quenching of the Ca2+-independent fura-2 fluorescence signal (excitation isosbestic, 360 nm with a 10-nm bandwidth interfer- ente filter [Cairn Research Ltd.]; emission, 510 nm with a 20-nm bandwidth interference filter [Nikon]) by Mn2+ (1.0 mM MnCI, in C02- free KCI-Mes containing either 0.1 mM or 1.0 mM CaCI,) (Sage et al., 1989; Kass et ai., 1990; Fasolato et al., 1993).
Photoactivation of Caged Ca2+
Photoactivation of Nitr-5 (caged Ca2+) was achieved by exposure to a 10- to 20-sec pulse of 380-nm light (10-nm bandwidth interference filter; no neutra1 density filters; 400-nm dichroic mirror [Cairn Research Ltd.]) from the 100 W xenon light source of a Nikon Diaphot epifluores- cence microscope (Gilroy et al., 1990) via a liquid light guide (Cairn Research Ltd.) and a Nikon CF Fluor DL 40x oil immersion lens (1.30 numerical aperture) using nonfluorescent immersion oil.
ACKNOWLEDGMENTS
We thank Michael J. Berridge, F.R.S., Terry A. Mansfield, F.R.S., lrina Staxén, Anthony J. Trewavas, and Michael Whitaker for their comments during preparation of this article. A.A.R.W and J.E.T are funded through the Biotechnology and Biological Sciences Research Council (UK) Bi- ological Adaptation to Global Climate Change lnitiative and lntraceilular Signalling Programme, respectively. M.R.M. is grateful to the Royal Society for the award of a University Research Fellowship.
Received April 6, 1995; accepted June 9, 1995.
REFERENCES
Allan, A.C., Fricker, M.D., Ward, J.L., Beale, M.H., and Trewavas, A.J. (1994). Two transduction pathways mediate rapid effects of ab- scisic acid in Commelina guard cells. Plant Cell 6, 139-1328,
Allen, G.J., and Sanders, D. (1994). Two voltage-gated, calcium re- lesse channels coreside in the vacuolar membrane of broad bean guard cells. Plant Cell 6, 685-694.
Assmann, S.M. (1993). Signal transduction in guard cells. Annu. Rev. Cell Biol. 9, 345-375.

Oscillations in Plant Cytosolic Ca2+ 1219
Kwan, C.Y., and Putney, J.W. (1990). Uptake and intracellular s_eques- tration of divalent cations in resting and methacholine-stifiiulated mouse lacrimal acinar cells. J. Biol. Chem. 265, 678-684.
Luckhoff, A., and Clapham, D.E. (1992). lnositol 1,3,4,5- tetrakiphosphate activates an endothelial Caz+-permeable channel. Nature 355, 356-358.
Maathuis, F.J.M., and Sanders, D. (1992). Plant membrane transport. Curr. Opin. Cell Biol. 4, 661-669.
MacRobbie, E.A.C. (1989). Calcium influx at the plasma membrane of isolated guard cells of Commelina communis. Planta 178,231-241.
MacRobbie, E.A.C. (1992). Calcium and ABA-induced stomatal clo- sure. Philos. Trans. R. SOC. Lond. Ser. B 338, 5-18.
Mansfield, T.A., and Meidner, H. (1966). Stomatal opening in light of different wavelengths: Effects of blue light independent of car- bon dioxide concentration. J. Exp. Bot. 17, 510-521.
Mansfield, T.A., Hetherington, A.M., and Atkinson, C.J. (1990). Some current aspects of stomatal physiology. Annu. Rev. Plant Physiol. Plant MOI. Biol. 41, 55-75.
Marshall, J., Corzo, A., Leigh, R.A., and Sanders, D. (1994). Mem- brane potential-dependent calcium transport in rightside-out plasma membrane vesicles from Zea mays L. roots. Plant J. 5, 683-694.
McAinsh, M.R., Brownlee, C., and Hetherington, A.M. (1990). Ab- scisic acid-induced elevation of guard cell cytosolic Caz+ precedes stomatal closure. Nature 343, 186-188.
McAinsh, M A , Brownlee, C., and Hetherington, A.M. (1991). Par- tia1 inhibition of ABA-induced stomatal closure by calcium-channel blockers. Proc. R. SOC. Lond. B 243, 195-201.
McAinsh, M.R., Brownlee, C., and Hetherington, A.M. (1992). Visualizing changes in cytosolic free Caz+ during the response of stomatal guard cells to abscisic acid. Plant Cell 4, 1113-1122.
McCormack, J.G., and Cobbold, P.H. (1991). Cellular Calcium. (Ox- ford, UK: Oxford University Press).
Meyer, T., and Stryer, L. (1991). Molecular model for receptorstimulated calcium spiking. Annu. Rev. Biophys. Biophys. Chem. 20, 153-174.
Mittelheuser, C.G., and van Steveninck, R.F.M. (1969). Stomatal clo- sure and inhibition of transpiration induced by RS-abscisic acid. Nature 221, 281-282.
Pantoja, O., Gelli, A., and Blumwald, E. (1992). Voltage-dependent calcium channels in plant vacuoles. Science 255, 1567-1570.
Pemadasa, M.R. (1982). Difterential abaxial and adaxial stomatal re- sponse to indole-3-acetic-acid in Commelina communis L. New
.
PhytOl. 90, 209-219.
Pitieros, M., and Tester, M. (1995). Characterization of a voltage- dependent Caz+-selective channel from wheat roots. Planta 195, 478-488.
Poovaiah, B.W., and Reddy, A.S.N. (1993). Calcium and signal trans- duction in plants. Crit. Rev. Plant Sci. 12, 185-211.
Read, N.D., Shacklock, P.S., Knight, MA., and Trewavas, A.J. (1993). lmaging calcium dynamics in living plant cells and tissues. Cell Biol. Int. 17, 111-125.
Sage, O.S., Merritt, J.E., Hallam, T.R., and Rink, T.J. (1989). Receptor- mediated calcium entry in fura-2-loaded human platelets stimulated with ADP and thrombin. Biochem. J. 258, 923-926.
Schroeder, J.I. (1992). Plasma membrane ion channel regulation during abscisic acid-induced closing of stomata. Philos. Trans. R. Soc. Lond. Ser. B 338, 83-89.
Schroeder, J.I., and Hagiwara, S. (1990). Repetitive increases in cytosolic Ca*+ of guard cells by abscisic acid activation of non- selective Ca2+ permeable channels. Proc. Natl. Acad. Sci. USA 87, 9305-9309.
Tester, M. (1990). Plant ion channels: Whole-cell and single channel studies. New Phytol. 114, 305-340.
Thuleau, P., Moreau, M., Schroeder, J.I., and Ranjeva, R. (1994a). Recruitment of plasma membrane voltage-dependem calcium- permeable channels in carrot cells. EMBO J. 13, 5843-5847.
Thuleau, P., Ward, J.M., Ranjeva, R., and Schroeder, J.I. (1994b). Voltage-dependent calcium-permeable channels in the plasma mem- brane of higher plant cells. EMBO J. 13, 2970-2975.
Tsien, R.W., and Tsien, R.Y. (1990). Calcium channels, stores, and oscillations. Annu. Rev. Cell Biol. 6, 715-760.
Volotovski, L.D., Sokolovsky, S.G., Nikifomv, E.L., and Zinchenko, V.P. (1993). Calcium oscillations in plant cell cytoplasm induced by red and far-red light irradiation. J. Photochem. Photobiol. B Biol.
Ward, J.M., and Schroeder, J.I. (1994). Calcium-activated K+ chan- nels and calcium-induced calcium release by slow vacuolar ion channels in guard cell vacuoles implicated in the control of stoma- tal closure. Plant Cell 6, 669-683.
Webb, A.A.R., Taylor, J.E., McAinsh, M.R., and Hetherington, A.M. (1995). Calcium ions as intracellular second messengers in plants. Adv. Bot. Res., in press.
White, P.J. (1994). Characterization of a voltage-dependent cation- channel from the plasma membrane of rye (Secale cereale L.) roots in planar lipid bilayers. Planta 193, 186-193.
20, 95-100.

DOI 10.1105/tpc.7.8.1207 1995;7;1207-1219Plant Cell
M. R. McAinsh, AAR. Webb, J. E. Taylor and A. M. HetheringtonStimulus-Induced Oscillations in Guard Cell Cytosolic Free Calcium.
This information is current as of July 25, 2018
Permissions 8X
https://www.copyright.com/ccc/openurl.do?sid=pd_hw1532298X&issn=1532298X&WT.mc_id=pd_hw153229
eTOCs http://www.plantcell.org/cgi/alerts/ctmain
Sign up for eTOCs at:
CiteTrack Alerts http://www.plantcell.org/cgi/alerts/ctmain
Sign up for CiteTrack Alerts at:
Subscription Information http://www.aspb.org/publications/subscriptions.cfm
is available at:Plant Physiology and The Plant CellSubscription Information for
ADVANCING THE SCIENCE OF PLANT BIOLOGY © American Society of Plant Biologists