“stewards agents f d - stanford...
TRANSCRIPT
“STEWARDS, AGENTS, AND THE FOUNDER DISCOUNT:
EXECUTIVE COMPENSATION IN NEW VENTURES”
NOAM WASSERMAN
Harvard Business School Rock Center 210
Cambridge, MA 02163 (617) 495-6215 [email protected]
I would like to thank Nitin Nohria, Brian Hall, Teresa Amabile, Josh Lerner, Ranjay Gulati, Ezra
Zuckerman, Bill Sahlman, Lynda Applegate, Warren Boeker, Jesse Fried, David Scharfstein,
Vishesh Kumar, Mauro Guillen, Mason Carpenter, Gerry George, Hillary Elfenbein, Juan Florin,
Gary Dushnitzky, Debbie Strumsky, Marc Yoshida and participants in the Harvard Work-in-
Process Seminar, the Babson-Kauffman Research Conference, and the Academy of Management
Conference for comments on earlier versions of this paper. I would also like to thank Associate
Editor Amy Hillman and three anonymous reviewers for their diligent guidance on earlier drafts,
and Bill Holodnak, Aaron Lapat, and Mike DiPierro for their invaluable assistance with data
collection.
“STEWARDS, AGENTS, AND THE FOUNDER DISCOUNT:
EXECUTIVE COMPENSATION IN NEW VENTURES”
ABSTRACT
Agency theory suggests that the interests of opportunistic, self-interested agents
will conflict with those of principals. Stewardship theory suggests instead that
executives’ interests will be aligned with company interests and executives thus be more
intrinsically motivated than predicted by agency theory. This study develops hypotheses
regarding the psychological and situational factors that affect the applicability of each
theory to executive compensation. Hypotheses are tested using a unique dataset of 1,238
executives from 528 private companies. Results suggest significant differences between
founder-stewards and non-founder agents that diminish with company growth, and
significant effects of equity ownership and outside rounds of financing.
Page 1
INTRODUCTION
Since ground-breaking work by Jensen and Meckling (1976), agency theory has been the
dominant lens for examining executive compensation. According to agency theory, principals
who employ agents to work on their behalf incur agency costs because the interests of principals
and agents diverge. Incentive schemes and monitoring are proposed as ways to reduce agency
costs (Jensen et al., 1976). Stewardship theory, introduced recently in the management control
literature (e.g., Davis, Schoorman, & Donaldson, 1997; Donaldson & Davis, 1991; Lee &
O'Neill, 2003), construes principal-agent issues somewhat differently. According to stewardship
theory, some executives are likely to pursue organizational interests even when they conflict with
the executives’ self interest (Donaldson et al., 1991). The theory defines psychological and
situational factors that can lead executives to act less like self-interested agents and more like
organizational stewards with whom it might be counterproductive for principals to use the
mechanisms recommended by agency theory (Lee et al., 2003).
Both theories have implications for executive compensation, which has long been
understood to be a determinant of whether an executive continues to work for a company
(Barnard, 1938). According to stewardship theory, executives who create an organization and
feel a strong sense of attachment to and psychological ownership of it are more likely to behave
as stewards. Higher levels of psychic income (Gimeno, Folta, Cooper, & Woo, 1997) should
dispose such “organizationally centered” executives (Davis et al., 1997:25) to accept lower cash
compensation to continue working in the organization. Agency theory is more likely to describe
executives who did not create an organization and organizations that can tie compensation to
concrete performance measures. Higher compensation will be required to retain such executives
and, in such organizations, should be tied to those performance measures. To the extent that
compensation issues help determine whether an executive continues to work for a company

Page 2
(Barnard, 1938), founder retention is important because founders can exert a significant impact
on the operations and performance of the companies they start. “Founder management,” observe
Jayaraman et al. (2000:1221), “is positively related to stock performance among smaller and
younger firms,” even among Fortune 500 companies (Villalonga & Amit, 2005). On the occasion
of a company’s initial public offering, moreover, valuation and return to first-day investors are
significantly affected by whether the founder is still CEO (Certo, Covin, Daily, & Dalton, 2001;
Certo, Daily, Cannella, & Dalton, 2003).
This study focuses on the interplay between agency and stewardship theories. It is
suggested that these two theories are complementary rather than conflicting, and that each is
more applicable to executives and situations to which the other theory is less applicable. The
theories are examined in the context of new ventures, in which organizational founders and non-
founders both work, and in which the situational context is consistent with stewardship theory
early in the life of a venture but becomes more consistent with agency theory as the venture
matures. The study tests its hypotheses on a unique dataset of 1,238 executives in 528 private
new ventures in the information-technology industry and considers the implications of its
findings for the understanding of agency, stewardship, and compensation within executive teams.
STEWARDS AND AGENTS IN NEW VENTURES
Both agency theory and stewardship theory are concerned with how principals can increase
the likelihood that agents will act to maximize shareholder wealth (Tosi, Brownlee, Silva, &
Katz, 2003). But the behavioral premises that underlie the two theories are quite different. As a
result, stewardship theory is more relevant in contexts in which agency theory is less relevant,
and vice versa (Davis et al., 1997). More specifically, agency theory is concerned with problems
caused by separating management from ownership (Berle & Means, 1932; Jensen et al., 1976).
Page 3
“Principals” are owners who contract with “agent” executives to manage their companies on the
principals’ behalf. Principals who employ agents incur agency costs because the interests of the
parties diverge (Jensen et al., 1976). Self-interested agents are presumed, when it serves their
interests and they are able, to take actions inconsistent with the best interests of the
organization’s shareholders. The more divergent the interests of agents and principals, the
greater the agency costs. Monitoring and incentive schemes are often used to change agent
behavior and reduce agency costs.
Stewardship theory posits that some agents are likely to pursue organizational interests
even when such interests are in conflict with the agents’ self interest (Donaldson et al., 1991).
“Stewards” are executives employed by principals whose interests tend to be aligned with those
of the principals. Stewards are “organizationally centered” executives (Davis et al., 1997) who
identify closely with the organization and thus derive higher satisfaction from behaviors that
promote the organization’s interests than from self-serving behaviors. In fact, when
organizational interests are in conflict with their self interest, stewards are inclined to put the
interests of the organization first (Tosi et al., 2003). Psychological and situational factors posited
to affect the degree of stewardship behavior include, respectively, whether an executive created
the organization and feels a sense of control over its direction, and whether the organization has
instituted organizational controls to decrease performance ambiguity (Davis et al., 1997; Ouchi,
1980).
Fama and Jensen (1983) argue that young entrepreneurial firms are a classic instance of the
union rather than separation of ownership and control. Because its assumptions are a poor fit
with contexts that lack a clear conflict between managerial and shareholder interests (Deckop,
Mangel, & Cirka, 1999; Lane, Cannella, & Lubatkin, 1998), agency theory is less applicable to
Page 4
such firms than to more mature firms. We look to stewardship theory to illuminate the former
context.
New ventures provide us with a good arena in which to study the contexts in which each
theory applies. With regards to the psychological factors described above, the executives
working in new ventures include both founders who should behave more like stewards and non-
founders who should act more like agents. With regards to the situational factors described
above, young new ventures should be less control-oriented than more mature organizations,
making stewardship theory more applicable to young new ventures and agency theory more
applicable to mature new ventures.
Common to both theories is the notion that executive compensation is a powerful lever for
influencing agent behavior. Boards of directors control the compensation as well as hiring and
firing of top-level executives (Fama et al., 1983; Lorsch, 1989) and one of the board’s most
important roles is setting compensation to align executive interests with those of the shareholders
(Jensen & Murphy, 1990b). Cash compensation is directly controlled by boards of directors
(Fama et al., 1983) and is therefore the component most affected by variables of interest to
studies that examine the interaction between boards and senior executives (Carpenter & Wade,
2002). This is particularly true of new ventures, where boards rarely issue new equity to
executives working in the venture (Sahlman, Stevenson, Roberts, & Bhide, 1999) but reassess
compensation regularly. Thus cash compensation provides the best test of this study’s
hypotheses and is the main focus of this paper. However, equity issues also play an important
role in the paper. According to both agency and stewardship theories, the amount of equity held
by an executive should have a strong impact on that executive’s compensation. Thus, this
paper’s second hypothesis focuses on equity holdings. In addition, even though the percentage

Page 5
of equity owned by the executive is the best variable to use in studies that focus on the
compensation implications of equity ownership (Jensen et al., 1990b), in robustness tests of the
core models, this study also uses an estimate of the current value of those equity holdings.1
Attention to the motivations of executives might enable boards to reduce the compensation
needed to retain or motivate particular executives. Specifically, boards should compensate
stewards and agents differently. Executives inclined to behave as stewards are likely to be
willing to accept less compensation than executives at the same level who are motivated by
agency considerations. Furthermore, the challenges of determining executive compensation are
exacerbated in situations where the organization lacks organizational controls and performance
metrics to which it can tie compensation. At the intersection between the psychological and the
situational, stewards in stewardship situations (here, founders in pre-controls ventures) should
receive the least compensation, while agents in agency situations (non-founders in companies
with organizational controls) should receive the most compensation. Hypotheses detailing how
these factors affect executive compensation in new ventures are summarized in Figure 1.
------------------------------- Insert Figure 1 about here -------------------------------
Psychological Factors
The biggest difference between stewardship theory and agency theory lies in their
divergent views of executive identification and motivation (Davis et al., 1997). According to
1 It should be noted that such estimates of the value of executive equity holdings are relatively uncertain even in studies of public-company compensation (Hall & Murphy, 2002). In the private companies that are the focus of this study, the additional complications of illiquid company equity (Hertzel & Smith, 1993), long vesting terms and lack of executive diversification (Hall et al., 2002), high uncertainty whether the equity value will ever be realized (i.e., that the company will have a successful “exit”), and inability to assign that equity value to the specific year that is of interest, make it even harder to rely on equity-value estimates as a core variable (Kahl, Liu, Longstaff, & Page, 2003). Thus, even though many compensation studies should examine “total compensation” (cash compensation plus the value of equity compensation received annually) for the executives of interest (e.g., Baker, 1987), for both theoretical and empirical reasons cash compensation is the core dependent variable used in this study.

Page 6
stewardship theory, identification resulting from tight alignment between the values of
executives and the values of their organizations (Deckop et al., 1999) leads executives to make
decisions that are in their organizations’ interests. Similarly, executives with high levels of
intrinsic motivation will gain more intrinsic rewards from their work (Davis et al., 1997). From
a compensation perspective, boards should be able to pay less cash compensation to executives
who have higher levels of identification and intrinsic rewards.
The foremost way that people develop strong organizational identification is by creating
the organization, a classic example being entrepreneurs and the companies they found (Pierce,
Kostova, & Dirks, 2001). Thus, compared to non-founders, founders have stronger attachment
(Dobrev & Barnett, 2005; Jayaraman et al., 2000; Zaleznik & Kets de Vries, 1975) and
commitment (Carroll, 1984) to their ventures. Founders view their companies as extensions of
themselves (Handler, 1990; Levinson, 1971), some to such an extent that there is a “merging of
individual ego and the corporation, thus melding individual self-esteem with corporate prestige”
(Donaldson et al., 1991:51). That executives who create and identify closely with an
organization and are motivated by intrinsic rewards are more likely to behave as stewards than
self-interested agents (Arthurs & Busenitz, 2003; Mael & Ashforth, 1992) has prompted Nelson
(2003:710) to suggest that founders’ extraordinary commitment amounts to an “anti-agency
cost” to their organizations.
This can be both a benefit and a detriment to founders. The benefits include higher levels
of psychic income (Gimeno et al., 1997), greater personal satisfaction (Evans & Leighton, 1989),
and more non-pecuniary benefits (Hamilton, 2000; Moskowitz & Vissing-Jorgensen, 2002) than
non-founders. As a result, founders might be expected to voluntarily accept less cash
compensation, especially when doing so can help their ventures during their “cash poor” early

Page 7
stages of growth. However, high levels of organizational identification can also come with costs
(Mael et al., 1992). Strong attachment to their firms, to the extent that it renders less credible
threats to leave, leaves founders in much the same circumstance as faculty members whose
organizational commitment causes them to accept below-market salaries in order to continue to
work in their present organizations (Pfeffer & Langton, 1993). Thus, founders may also
involuntarily have to accept lower compensation.
Because the non-founding hires recruited by boards to bring needed skills to a venture tend
to be extrinsically motivated and to identify less closely with the organization, agency theory is
more likely to apply to them (Donaldson et al., 1991). According to O'Reilly and Chatman
(1986:497), new executive hires “base their commitment on compliance, exchanging behavior
for extrinsic rewards.” Employees who lack such organizational attachment should be more
driven by market forces (Guth & MacMillan, 1986) and should demand higher levels of
compensation than executives who are intrinsically motivated. In summary, founders can be
viewed as stewards who, because they identify closely with and gain non-material rewards from
their ventures, are likely to accept less cash compensation than non-founders who are more
properly viewed as the agents of agency theory. The result should be a “founder discount”
regarding cash compensation.
Hypothesis 1: Cash compensation will be lower for founders than for non-founders.
Equity holdings play a central role in both stewardship theory and agency theory in ways
that might be mutually reinforcing. Executives’ “psychological ownership” of an organization,
whether founded by them or not, can be strongly influenced by their equity ownership (Arthurs
et al., 2003). The more equity they own the more executives’ identities are tied to their
organizations and the more steward-like they are likely to behave (Pierce et al., 2001). To the
Page 8
extent that higher levels of psychological attachment reduce turnover (O'Reilly et al., 1986),
employee retention becomes less a concern for boards. Thus, stewardship theory suggests that
boards should be able to pay less cash compensation to executives who own more equity. From
an agency theory perspective it has been posited that greater equity holdings can reduce agency
problems (Jensen et al., 1976) by acting as substitute governance mechanisms (Rediker & Seth,
1995) that induce executives to accept lower compensation. Furthermore, the process of
detaching ownership from management control is closely related to the percentage of equity held
by executives (Fogelberg, 1980); executives who own a majority of the equity are expected to act
consistently with stewardship theory, executives with low levels of ownership to act consistently
with agency theory (Fox & Hamilton, 1994). It follows that executives who hold less equity will
have lower levels of psychological ownership and expect higher compensation.
Hypothesis 2: Executive equity holdings will be inversely related to cash compensation.
Situational Factors and Psychological-Situational Interactions
Situational factors also influence the degree of agency versus stewardship (Davis et al.,
1997; Fama et al., 1983). The central situational factor affecting an organization’s management
philosophy and culture is the degree to which formal control mechanisms have been adopted
(Davis et al., 1997). Stewardship theory is more applicable to organizations in which the lack of
controls fosters trust as the basis for collective work and promotes high levels of intrinsic
motivation. However, the degree of organizational control, and hence the degree of stewardship,
is expected to change over the life of a venture, especially as the venture adds employees and
raises new rounds of outside financing. The hypotheses below examine how these situational
factors should affect cash compensation, and how they might interact with the psychological
issues examined above.

Page 9
As a new organization grows and the division of labor deepens, its structure becomes more
formalized and professionalized (Blau, 1970; Blau & Scott, 1962; Hellman & Puri, 2002). Roles
become more defined, coordination becomes more formal, and controls are instituted to facilitate
organizational activities. Agency theory is more likely to apply in organizations that have
adopted control mechanisms to reduce risk and increase predictability (Davis et al., 1997). Thus,
with the lower levels of intrinsic motivation that result in these larger organizations, we expect
cash compensation to increase with size, even after controlling for the additional financial
resources that larger organizations may have.
Although these situational changes should affect all executives in new ventures, they are
expected to affect founders disproportionately. Founders play the central role in starting new
ventures, controlling all key decisions regarding their direction. Self determination and intrinsic
motivation thus predominate in these early stages of organizational growth. Stewardship
motivation is highly dependent on the steward’s maintaining a feeling of self determination
(Manz, 1986), but changes in the overall organizational environment can lower intrinsic
motivation (Amabile, 1993). More specifically, founders’ intrinsic motivation is expected to
diminish as psychological ownership wanes in the face of increased formalization and reduced
familiarity with all parts of the expanding organization (Pierce et al., 2001). With company
growth, founders are often forced to share influence over their companies’ direction, which can
cause them to begin to exhibit lower levels of commitment (Dobrev et al., 2005:435). A lower
degree of psychological ownership increases the likelihood that executives will pursue individual
self interest over the interests of the overall organization (Guth et al., 1986), increases the degree
to which they are likely to behave as agents generally, and reduces the likelihood that they will
Page 10
accept lower compensation (Davis et al., 1997). We thus expect there to be a smaller “founder
discount” in larger companies.
Hypothesis 3: Cash compensation will be higher in larger firms.
Hypothesis 4: The difference between founders’ and non-founders’ cash compensation
will be narrower in larger firms.
Stewardship situations match clan contexts in which performance ambiguity is high
(Ouchi, 1980). That young ventures, like clans, lack concrete performance metrics makes it
difficult for boards to judge progress towards core organizational goals (Gersick, 1994). Given
this, new ventures tend to be situationally less consistent with agency theory (Fama et al., 1983)
and more consistent with stewardship theory (Davis et al., 1997), promoting high levels of trust
and goal congruence.
However, capital constraints drive new ventures to outside investors (Gompers & Lerner,
2001) who reduce their own investing uncertainty by staging their capital investments across
multiple “rounds” months or years apart (Gompers, 1995). Just as customers can push ventures
to be more accountable and reliable (Hannan & Freeman, 1984), new investors impose
contractual requirements that can alter the situational contexts of new ventures (Gompers, 1995),
in an even more direct way. Each round of investment can bring new contractual requirements
that decrease performance ambiguity, enabling performance evaluation to be based on “explicit,
verifiable measures [that can] withstand the scrutiny of contractual relations” (Ouchi, 1980:137).
These increased controls cause the organization to become more depersonalized and less
facilitative of stewardship behaviors, for when principals institute controls, stewards lose
intangible rewards, “have less desire to behave as stewards,” and demand higher compensation
(Davis et al., 1997:39-40). Having better controls should also reduce organizational risk for the
principals, making them more willing to increase cash compensation. Thus, as each new round
Page 11
of financing is completed, a new venture’s situation should become less consistent with
stewardship theory and more consistent with agency theory, and the level of cash compensation
should increase, even after controlling for the additional capital raised in the new round of
financing. Once again, however, given their higher levels of early attachment to and
identification with their ventures, founders are expected to be disproportionately affected by the
raising of new rounds of financing.
Hypothesis 5: The number of rounds of financing raised by the company will be positively
related to cash compensation.
Hypothesis 6: The difference between founders’ and non-founders’ cash compensation
will be narrower in firms that have raised more rounds of financing.
METHODS
Founders, a central focus of this study’s hypotheses, are largely absent from past research
on executive compensation. Privately-held companies being extremely secretive about executive
compensation (Jensen & Murphy, 1990a), past research has focused on public companies, the
founders of which rarely still number among the members of the top management team. Even
Beatty and Zajac’s (1994) seminal “young company” study of compensation in newly-public
companies did not include founders. Researchers who have tried to examine founder
compensation (e.g., Deckop, 1988; Henderson & Fredrickson, 1996) in the context of large
companies have discovered that founders made up less than ten percent of the executives in their
datasets, precluding definitive founder-related conclusions.
To get around this problem, the data used in this study are from a private-company
compensation survey conducted annually by three national professional services firms: Ernst &
Young (an accounting firm), Hale and Dorr (a law firm), and J. Robert Scott (an executive search
firm). The survey instrument was designed, developed, and tested by the author with the

Page 12
assistance of the three professional services firms. Each year these firms compile a list of
American private technology companies that draws from the membership lists of regional and
state-wide technology councils, the VentureOne database of companies that have raised venture
capital, the firms’ own client lists, and recommendations by private-company investors. The
CEOs and CFOs of these companies are then mailed invitations to participate, with the
expectation that a single senior executive will complete the entire survey for each company. The
principal inducement is the promise of a free copy of an unabridged, published Compensation
Report, which is not available to non-participants. Survey questions cover company founding,
dates on which key product development milestones were passed, financing history, backgrounds
of the members of the top management team, executive compensation, and the composition of
the board of directors. The survey instrument for the year 2000 survey was pilot tested with ten
companies before invitations were mailed to the full list of potential participants. Since 2000 the
survey has been conducted online so that responses could be validated as they were entered.
The dataset includes data from 2000, 2001, and 2002 to reduce the chance that the results
are sensitive to the year in which the data were collected, while controlling for the year of
collection. The 20% response rate across the three years of the survey is relatively high
considering the sensitivity of the questions and level of executives targeted (Finkelstein, 1992;
Waldman, Ramirez, House, & Puranam, 2001). To test the representativeness of the responses
respondents were compared to non-respondents with regard to geographic distribution, industry
segment, and stage of company development (the data available for non-respondents). No
statistically significant differences were observed between respondents and non-respondents on
these dimensions. Across the full dataset 31% of companies are based in California, 18% in
Massachusetts. Median company age is 39 months, with 25th and 75th percentiles of 25 and 59
Page 13
months, respectively, median number of employees 54, with 25th and 75th percentiles of 27 and
100 employees, respectively. Further summary data are presented in Table 1.
------------------------------- Insert Table 1 about here -------------------------------
The full dataset includes 528 private technology companies. Of the 1,238 executives in the
dataset 40% are CEOs and 41% are founders. Fewer than five percent of the companies
participated in more than one annual survey, precluding an examination of compensation
changes in the same companies over time. (The low rate of repeat survey participation is not
surprising given the high rate of failure among young companies in this industry, demands on the
time of the CEOs and CFOs of these companies, and the exclusion of companies that have gone
public, among other factors.) To ensure that repeat respondents did not introduce auto-
correlation problems all core models were rerun excluding the repeat respondents; no differences
were found. The data average 2.3 executives per company. To adjust for companies that have
more than one executive in the dataset and therefore have within-cluster correlations, clustered
regressions with robust standard errors (Froot, 1989; Williams, 2000) were used.
Dependent Variable
The main dependent variable is each executive’s cash compensation, which comprises both
salary and bonus (e.g., Henderson & Fredrickson, 2001). Auxiliary models were run using a
salary-only dependent variable consistent with Barkema and Pennings (1998) and Bloom (1999),
who measured salary “exclusive of any performance incentives” (Bloom, 1999:30). The salary-
only and salary-plus-bonus variables were highly correlated (r=.88) and the auxiliary results
matched those from the main models, as shown below.2
2 Consistent with the analyses of public-company compensation in Core et al. (1999), it would have been desirable to be able to perform further robustness tests using a third dependent variable that added the current value of the
Page 14
Independent Variables
A dummy variable was used to indicate whether an executive was a founder of the
company. The percentage of company equity held by the executive was used to assess the
impact of equity holdings (Jensen et al., 1990b), but an auxiliary analysis also assessed whether
the non-equity results were robust to the use of an estimate of the value of the executive’s equity
holdings, described below. For the hypotheses regarding company size and changes in the
“founder discount,” company size was estimated using the number of employees and an
interaction variable was computed by multiplying the founder dummy by the number of
employees in the company. For the hypotheses regarding rounds of financing and changes in the
founder discount, a variable indicated the number of rounds of financing (i.e., separate private
placements) completed and an interaction variable was computed by multiplying the founder
dummy by the number of rounds raised.
An alternative explanation for some of the hypotheses is that compensation is affected by
differences in executives’ human capital. Evans and Leighton’s (1989) finding that education
has greater returns in self-employment than in wage work, for example, suggests an important
role for human capital in entrepreneurial sector executives. Following past studies (e.g., Gimeno
et al., 1997) that measured entrepreneurs’ human capital using the constructs of formal education
and prior work experience, the models control for each executive’s educational degrees
(bachelor’s, M.B.A., non-M.B.A. master’s, J.D., and Ph.D.) and years of prior experience.
Other alternative explanations include executives’ varying levels of power and influence
over the compensation-setting process. Tenure (in months) was used to control for the executive’s equity holdings to the executive’s cash compensation. However, the already-existing problems associated with valuing stock-based compensation in liquid public companies (Core et al., 1999; Hall et al., 2002) are exacerbated in private companies where executives hold non-liquid securities that have a high chance of never paying off (Hertzel et al., 1993; Kahl et al., 2003). This precluded the computation of reliable equity values that could be combined with cash compensation in a single dependent variable.

Page 15
possibility that executives with longer tenure might exert more influence over their compensation
than managers with shorter tenure. Executives who were hired due to a tie to a venture capitalist
on the board of directors (Sahlman & Gorman, 1986) may also command more compensation, so
a dummy variable controlled for such a tie. Executives who are themselves members of their
companies’ boards of directors might be more powerful given the prestige of serving on boards
(Finkelstein, 1992), the fact that they may perform more duties for their companies than do peers
who do not also serve on the board (Cyert, Kang, & Kumar, 2002), and that they might be
expected to be able to influence their compensation by developing social ties with the other
board members who determine compensation (Main, O'Reilly, & Wade, 1995). The models
consequently include a control for whether executives also serve on their companies’ boards of
directors. A common finding in large-company studies being that CEOs’ cash compensation
substantially exceeds that of those who work for them (e.g., Lambert, Larcker, & Weigelt, 1993;
Lazear & Rosen, 1981), the models also control for whether each executive was a CEO or a
direct subordinate reporting to the CEO. The final executive-level control is for whether an
executive’s cash compensation includes only salary or salary and bonus, bonuses being more
contingent than salary and representing a different mix of pay (e.g., Core et al., 1999).
At the company level, receiving revenues from customers and raising successive rounds of
financing augment the resources available to pay compensation, so the models include controls
for company revenues and amount of capital raised in the most recent round of financing.
Company age was also included, given that an organization’s ability to survive is tightly linked
to its age (Hannan, 1998). From a stewardship perspective, losing control of board decision
making can decrease the sense of control over the company, and may heighten the apparent
conflict between shareholders and managers. Therefore, the models include a dichotomous
Page 16
threshold variable (Gimeno et al., 1997) that indicates whether outsiders controlled more than
50% of a company’s board. Dummy variables captured company business segment and, as
proxies for the broader market conditions that existed at the time of each survey, dummy
variables also indicated whether the company’s data was collected in 2000, 2001, or 2002.
As mentioned above, although Hypothesis 2 is concerned with the impact that percentage
of equity holdings should have on an executive’s psychological ownership, it is possible that the
value of the executive’s equity holdings might have also have an important impact on this
study’s other hypotheses. To construct an alternative equity-holding variable that estimates the
current value of an executive’s equity holdings, the percentage of equity held by the executive
was multiplied by the company’s private-market valuation following the most recent round of
financing. However, given the problems described above regarding the computation of reliable
equity values in these companies, the results from this auxiliary model should be interpreted
cautiously. In addition, the 2000 dataset was missing valuation data for almost one-quarter of its
companies (a problem fixed in the 2001 and 2002 surveys), resulting in fewer observations in the
auxiliary model.
RESULTS
Table 1 presents the means and standard deviations of the core variables in the models and
the correlations among those variables. The possibility of collinearity among the variables was
checked in two ways. First, variance-inflation-factor analysis (Belsley, Kuh, & Welsch, 1980;
Mansfield & Helms, 1982; Neter, Wasserman, & Kutner, 1989) found no variables with VIF
scores of more than 10 (the highest score was 4.34), indicating no problems. Second, factor
analysis suggested additional testing of two pairs of variables: the CEO and board-member
dummies, and the months-since-hired and company-age variables. In models in which one of
Page 17
each pair was dropped, the significance of the remaining variable increased rather than
decreased, reinforcing the robustness of the results.
Given the centrality of founder status to the hypotheses, Table 2 presents separate means
and standard deviations for founders and non-founders. Founders were much more likely to be
CEOs (57% of founders and 29% of non-founders were CEOs) and averaged fewer years of prior
work experience. A lower percentage of founders had M.B.A. degrees, a higher percentage
Ph.D. degrees.
------------------------------- Insert Table 2 about here -------------------------------
Nested OLS regression models, fixed-effects models, and auxiliary analyses employing
alternate forms of the dependent and independent variables were used to test the hypotheses.
Table 3 presents the core models. Model 1 shows the baseline results of regressing
compensation on the control variables. Model 2 is the full model used to test the hypotheses.
Model 3 uses company fixed-effects to assess whether Model 2 is missing key company-level
differences that might affect its results. The dependent variable, being normally distributed, was
not transformed, consistent with other compensation studies in which this was the case (e.g.,
Carpenter, 2000).
------------------------------- Insert Table 3 about here -------------------------------
Many of the controls in the baseline model were significant. With respect to human-
capital controls, years of prior work experience was highly significant at the p<.005 level, each
year of additional experience resulting in almost $2,000 in additional compensation. Other very
significant controls at the individual-executive level included being hired due to a tie to a venture
capitalist (p<.01) and bonus eligibility (p<.005). At the company level, very significant variables

Page 18
included dollars raised in the most recent round of financing (p<.005) and whether outsiders
controlled the board of directors (p<.01), both with positive coefficients. The adjusted-R2 of
Model 1 is .329 and the overall model is highly significant.
Using Model 2 to examine the hypotheses we find that founders received $25,000 less than
non-founders (p<.01), supporting H1. A significant (p<.05) negative relationship was observed
between executives’ equity and compensation, supporting H2. Consistent with H3, cash
compensation increases significantly (at p<.005) with increases in the number of employees.
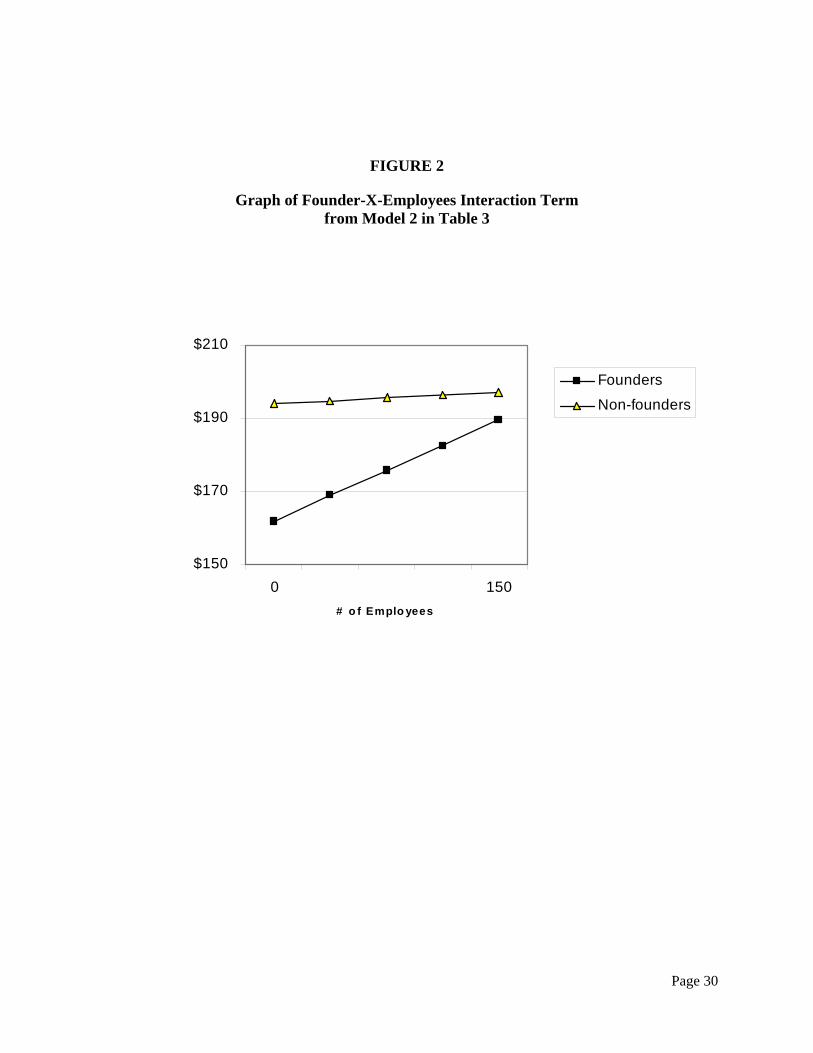
Furthermore, supporting H4, the positive and significant (p<.05) coefficient on the Founder X
Employees interaction term suggests that the founder discount decreases with company size.
This interaction term is graphed in Figure 2. With each round of financing (H5), compensation
increased by $5,000 (p<.05), even after controlling for the amount of money raised in the most
recent previous round (significant at p<.05) and company revenues (p<.10). Hypothesis 6, that
founders will be disproportionately affected by the raising of new rounds of financing, is not
supported. The adjusted-R2 of Model 2 is .441, significantly higher than in the baseline model.
------------------------------- Insert Figure 2 about here -------------------------------
Model 3 uses company fixed-effects to assess whether Model 2 was affected by missing
variables at the company level. Because they are constant within each company’s top
management team (TMT), the company-level independent variables from Model 2 could not be
tested in the fixed-effects model. In Model 3, however, the executive-level factors were again
very significant (p<.05), with founders making $24,000 less than non-founders and a negative
relationship between equity percentage and cash compensation, and the significance of the two
interaction terms matches the results in Model 2.
Page 19
In summary, H1 (founders receive less compensation than non-founders) is strongly
supported, even after controlling for differences in formal positions and executive backgrounds.
H2, which posits a negative relationship between equity percentage and compensation, is
strongly supported. Cash compensation increases with company size (H3), and the founder
discount (H4) diminishes with company size. Compensation increases with rounds of financing
(supporting H5), even after controlling for the additional capital raised and from increasing
company revenues. However, Hypothesis 6, that this increase is higher for founders than for
non-founders, is not supported.
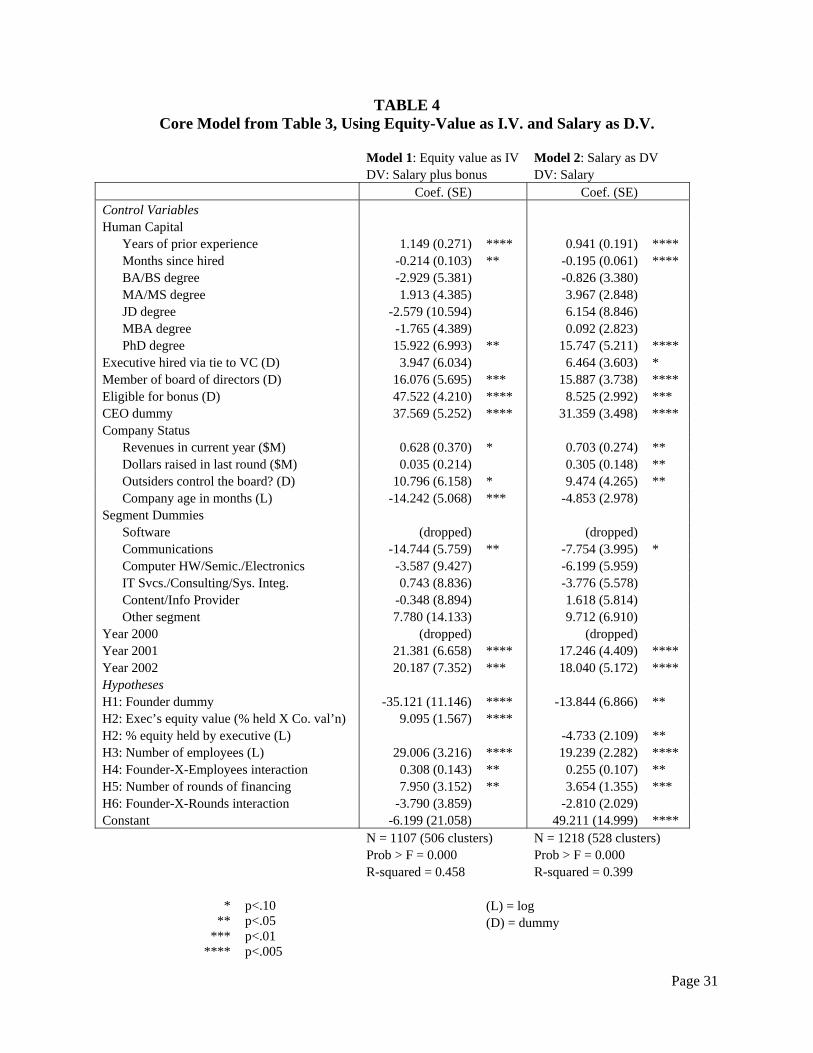
As shown in Model 1 of Table 4, an alternate form of equity holdings was tested using an
estimate of the current value of an executive’s equity. The non-equity hypotheses were all
supported again in this model, with the founder discount even greater (cash compensation is
$35,000 lower for founders than for non-founders) and more significant (p<.005). Interestingly,
though, the coefficient on the alternative equity-value variable itself is positive in this model
instead of negative. Another auxiliary analysis that examined whether the results changed when
using a salary-only dependent variable (Model 2 of Table 4) yielded nearly identical results as in
the core Model 2 in Table 3, consistent with past studies (e.g., Core et al., 1999) that had similar
results for salary, salary-plus-bonus, and total-compensation dependent variables.
DISCUSSION
This study has examined the psychological and situational factors that affect the
applicability of agency and stewardship theories to executives in new ventures. Psychologically,
founders should act more like stewards and non-founders more like agents, and executives who
own a higher percentage of equity should earn less compensation, consistent with both
stewardship and agency theories. Hypotheses applying these theoretical predictions to executive
Page 20
compensation within new-venture teams were strongly supported. Situationally, the results also
supported the hypotheses that compensation for all executives increases with company size and
with the raising of new rounds of financing, but that founder compensation is affected
disproportionately by company size, thus decreasing the founder discount in larger companies.
Stewardship theory helps us understand why founders might be more willing than non-
founders to accept lower compensation. Founders are more intrinsically motivated than non-
founders and derive more non-monetary benefits from working in the companies they started. It
might be said that “founders pay to be founders” much as wine hobbyists accept lower profits to
maximize their non-financial benefits as owners of wineries (Morton & Podolny, 2002). “The
founder CEO,” remarked one venture capitalist, “benefits from ‘soft’ compensation such as
greater psychic rewards that a non-founding CEO will never be able to get” (Borchers, 2004).
A potential downside is that strong feelings of stewardship might leave founders
vulnerable to boards’ imposition of lower compensation. Founders’ strong attachment to the
companies they start might compromise the credibility of threats to leave if their compensation
demands are not met, resulting in a founder discount. One founder who complained that his
board was not taking seriously his threat to leave if he did not get a raise observed that a non-
founder could more convincingly make this threat (Rosen, 2004). More generally, even
executives who are not founders might find that strong attachment to their companies leaves
them in a less powerful negotiating position relative to executives who are not perceived to have
such attachment. However, as the level of attachment decreases with company growth, boards
must adjust by reducing the founder discount, as they indeed seem to do in the technology-based
new ventures that are the subjects of this study.
Page 21
One implication of these findings is that it is possible for private-company CEOs to receive
less compensation than do their direct subordinates, a circumstance not found in public
companies in which CEOs are much more powerful, and thus earn far more, than their direct
subordinates. In the new ventures that are the focus of this study, instances are found of CEOs
who are founders earning less than the CTOs or CFOs who report to them. In fact, in the study
dataset, of 290 CEOs who were founders, 77 (27%) made less than at least one of their direct
subordinates and another 69 (24%) were paid the same amount as a direct subordinate. Future
field research could explore the extent to which lower founder compensation is voluntarily
accepted or is imposed on founders by boards.
This finding suggests that there are important ways in which the results presented here
conflict with what might be expected from a power perspective. Founders, for example, might
be expected to be more powerful than non-founders because they have longer tenure (Fisher &
Govindarajan, 1992) and higher levels of prestige power (Finkelstein, 1992; Zaleznik et al.,
1975), are difficult to replace (Hickson, Hinings, Lee, Schneck, & Pennings, 1971), exert more
influence over the choice of outside board members (Main et al., 1995), and often possess an
overpowering leadership style (Zaleznik et al., 1975). This power might reasonably be expected
to translate into leverage over their companies’ compensation processes and the ability to
command higher compensation (Combs & Skill, 2003). But despite these power advantages
founders tend to receive substantially less compensation than non-founders.
The marked difference between founder and non-founder compensation also emphasizes a
need for future researchers to consider the possible impact that the presence of founders might
have on their results. Academic studies (e.g., Finkelstein, 1992) have used founder status as an
indicator of greater executive power. In fact, such status might have an effect opposite the one

Page 22
intended inasmuch as this study suggests that founders may be hampered in their ability to
influence key decisions. Moreover, the presence of founders could skew the results of studies
that ignore founder issues. Beatty and Zajac (1994), for example, found that executives’ equity
holdings are lower in higher-risk than in lower-risk companies. A possible alternative
explanation is that this difference reflects a different mix of founders versus non-founders:
higher risk companies might have higher rates of founder turnover and thus more non-founders
on their TMTs. Differences in equity holdings might thus be a function of differences in the
preponderance of founders, whose equity holdings tend to be higher than those of non-founders.
The findings regarding equity holdings might also conflict with what might be expected
from a power perspective. This study found a strong inverse relationship between compensation
and the percentage of equity owned by an executive, consistent with the hypothesized impact of
equity holdings on psychological ownership. This finding is also consistent with recent
empirical studies in large companies (e.g., Core et al., 1999; Cyert et al., 2002). However, it
conflicts with arguments that higher equity percentages should afford executives more ownership
power (Finkelstein, 1992) and enable them to increase their own compensation (Allen & Panian,
1982). “Executives who own significant portions of their firms,” observe Finkelstein and
Hambrick (1989:124), “are likely to control not only operating decisions but board decisions as
well. Such executives would thus be in a position to essentially set their own compensation.” In
this study, auxiliary analyses suggested a positive linkage between compensation and the value
of executive equity holdings. Given the problems described earlier with calculating reliable
estimates of the value of executive equity holdings in private companies, this result should be
interpreted cautiously. However, future research could benefit both from improved approaches
to valuing such equity and from further exploration of this difference in equity results.
Page 23
Situationally, Gersick (1994) examined the transformation of new ventures from
companies that have to deal with ambiguous feedback from uncertain or “noisy” environments
into companies in which performance ambiguity is much lower, and Davis et al. (1997) highlight
how the controls instituted in that process can affect stewardship behaviors. The results of this
study suggest that such situational changes also have important implications for compensation.
As controls are instituted to reduce performance ambiguity, they also reduce the clan-like
characteristics of new ventures in ways that require boards to increase executive compensation.
In contrast to results reported above that conflicted with what might be expected from a power
perspective, these findings are consistent with predictions derived from power-based resource
dependency theory inasmuch as company growth and the raising of new rounds of financing
should increase executives’ power by proving that they can cope with their companies’ critical
contingencies (e.g., Hickson et al., 1971; Pfeffer & Salancik, 1978). The link between the
institution of controls and compensation can also shed light on the evolution of agency issues in
these firms. Agency costs, save when the founder maintains ownership of all of the company’s
equity, increase as outsiders invest. Investors’ ability to monitor founders increases as controls
increase, reducing the potential impact of misaligned incentives but also requiring them to
increase executive compensation. Although changes in company size and financing rounds
affected all executives, the size-related changes affected founders disproportionately. Future
research could explore why founders were affected more by changes in size than by financing
rounds.
It is important to emphasize that this study focused on private technology companies.
Although such companies constitute a substantial portion of new ventures, and although single-
industry studies of technology firms (e.g., Eisenhardt, 1989; Virany, Tushman, & Romanelli,

Page 24
1992) do provide greater internal validity, future research could shed light on whether the use of
these companies might have introduced patterns that do not exist in other industries. In addition,
the quantitative models used in the present study controlled for differences across executives in
prior work experience, educational backgrounds, board membership, and ties to VCs. Future
research could explore whether entrepreneurial managers differ in other ways that might affect
their compensation. Are first-time founders, for example, more attached than “serial” founders
to the companies they start? Are co-founders less attached than solo founders to their
companies? Situationally, do changes in corporate governance (e.g., ownership or board
structure), environmental contingencies, or corporate strategies (e.g., increases in diversification)
shift the mix of agency versus stewardship in ways that affect pay differences?
In closing, we have developed a wealth of knowledge about compensation in public
companies, much of it by examining executive compensation from an agency perspective.
Recent work (e.g., Bloom & Milkovich, 1996; Daily, Dalton, & Cannella, 2003; Davis et al.,
1997) that has begun to question this focus on agency theory has suggested that our picture of
executive compensation could be enriched by integrating stewardship theory and other
perspectives, as has been done in this study. New ventures provide us with an excellent context
in which to study the interplay between agency theory and stewardship theory. More generally,
new ventures should also provide other important research benefits. In contrast to large
companies in which the dynamics have evolved over many years and activities in one part can
significantly affect other parts, young companies provide simpler environments to study. The
understanding of organizational issues that emerges from such study can yield insights into
broader issues that have been hard to uncover in large, complex organizations. Ensley et al.
(2002:381) argued recently that: “While the bulk of TMT research has been conducted on
Page 25
existing large firms … the richest and most interesting studies of TMTs are likely to involve new
ventures.” Moreover, to comprehend the existing structures of larger organizations we must first
understand the processes that created and developed these structures when the organizations
were still small (Aldrich, 1999). To conduct research in private companies requires gaining
access to scarce data and understanding idiosyncratic characteristics such as the presence of
company founders and the dramatic changes introduced by company growth. Surmounting these
challenges in order to study the evolution of executive compensation throughout company
growth and development should yield deep insights that broaden our understanding of agency,
stewardship, and organizational issues throughout all stages of company evolution.

Page 26
FIGURE 1 Summary of Hypotheses
Founder H1 Non-founder Own larger percentage of equity H2 Own smaller percentage of equity Smaller organization H3 Larger organization Founder vs. Non-founder in smaller organization H4 Founder vs. Non-founder in larger org. Fewer rounds of outside financing H5 More rounds of outside financing Founder vs. non-founder with fewer rounds raised H6 Founder vs. non-founder with more rounds raised
Stewardship
Agency
More cash compensation

Page 27
TABLE 1 Summary Data and Correlation Table
Mean S.D. (1) (2) (3) (4) (5) (6) (7) (8) (9) (10) (11) (12) (13) (14) (15) (16) (17) (18) (19) 1.Cash compensation ($000) 188.2 104.3 2.Founder? 41% 0.5 -0.09 3.Exec. hired via tie to VC 13% 0.3 0.11 -0.20 4.% equity held by executive 27.9 21.1 -0.23 0.19 -0.16 5.Years of prior experience 15.2 8.3 0.19 -0.21 0.18 -0.17 6.Months since hired 33.9 34.6 0.00 0.29 -0.11 0.23 -0.13 7.BA/BS degree 76% 0.4 -0.02 -0.03 0.03 -0.01 0.03 -0.01 8.MA/MS degree 24% 0.4 0.03 0.10 -0.04 0.01 -0.03 0.04 -0.05 9.JD degree 2% 0.1 0.01 0.05 0.01 0.02 0.02 -0.03 0.02 -0.02 10.MBA degree 32% 0.5 0.04 -0.12 0.11 -0.07 0.06 -0.09 0.04 -0.20 -0.05 11.PhD degree 8% 0.3 -0.01 0.17 -0.01 -0.04 0.03 0.04 -0.10 0.14 -0.05 -0.15 12.Position = CEO 40% 0.5 0.27 0.28 0.07 -0.02 0.17 0.13 0.01 0.03 0.11 0.06 -0.04 13.Completed product dev. 0.8 0.4 -0.06 0.08 0.08 -0.02 0.04 -0.12 -0.05 0.09 -0.02 -0.07 0.13 0.02 14.Company revenues ($M) 0.8 3.9 -0.01 -0.04 -0.02 0.00 0.01 -0.01 -0.06 -0.06 -0.08 0.05 0.00 -0.01 -0.06 15.# rounds of financing 2.6 1.4 0.16 -0.14 0.04 -0.32 0.06 0.05 0.00 -0.03 0.03 0.03 -0.04 -0.03 -0.15 0.00 16.Dollars raised last rd ($M) 16.7 47.6 0.04 -0.08 0.01 -0.06 -0.03 -0.03 -0.07 0.00 -0.01 0.06 -0.02 -0.03 -0.03 -0.02 0.04 17.Member of board 49% 0.5 0.19 0.46 0.03 0.06 0.08 0.22 0.01 0.08 0.07 -0.01 0.10 0.73 0.03 -0.01 -0.08 -0.06 18.Outsiders control board? 85% 0.4 0.11 -0.08 0.04 -0.23 0.04 0.01 -0.01 0.02 -0.03 0.02 -0.02 0.00 0.00 0.05 0.23 -0.04 -0.09 19.Number of employees 77.8 82.0 0.27 -0.12 0.08 -0.19 0.06 0.00 -0.12 -0.03 0.00 0.00 -0.08 -0.03 -0.16 -0.03 0.32 0.10 -0.10 0.11 20.Company age (months) 55.6 51.3 0.04 -0.13 -0.01 0.16 0.05 0.62 0.03 -0.01 -0.03 -0.01 -0.05 0.00 -0.20 -0.02 0.14 -0.01 0.02 0.02 0.03
(obs=1,238)

=
Page 28
TABLE 2 Means and Standard Deviations, Founders Vs. Non-Founders
Founders (N=508) Non-Founders (N=730)
Mean Std.Dev Mean Std.Dev Cash compensation 177.3 82.7 195.7 116.4 % equity held by executive 32.9 21.5 24.5 20.2 Years of prior experience 13.3 8.0 16.6 8.2 Months since hired 45.7 41.5 25.6 26.0 BA/BS degree 75% 0.4 77% 0.4 MA/MS degree 29% 0.5 20% 0.4 JD degree 3% 0.2 2% 0.1 MBA degree 26% 0.4 36% 0.5 PhD degree 14% 0.3 4% 0.2 Position = CEO 57% 0.5 29% 0.5 Member of board of directors 77% 0.4 30% 0.5

Page 29
TABLE 3
Core Regression Models
Dependent variable: Executive’s salary-plus-bonus in current year ($000)
Model 1: Baseline Model 2: Full model Model 3: Fixed effects Coef. (SE) Coef. (SE) Coef. (SE)
Control Variables Human Capital Years of prior experience 1.725 (0.301) **** 1.093 (0.261) **** 0.783 (0.319) ** Months since hired -0.152 (0.098) -0.180 (0.097) * -0.185 (0.128) BA/BS degree -3.921 (5.449) -3.539 (5.147) -2.221 (6.716) MA/MS degree 2.928 (4.733) 4.196 (4.374) 2.624 (4.749) JD degree -6.495 (12.165) -3.181 (11.127) -5.309 (12.728) MBA degree -0.976 (4.295) -2.504 (4.117) -1.501 (4.379) PhD degree 13.687 (7.948) * 18.231 (6.994) *** 18.422 (7.401) ** Executive hired via tie to VC (D) 16.429 (6.107) *** 6.212 (5.774) 5.594 (6.007) Member of board of directors (D) 9.929 (5.178) * 25.010 (5.713) **** 29.068 (6.453) **** Eligible for bonus (D) 52.171 (4.712) **** 44.669 (4.248) **** 50.378 (7.070) **** CEO dummy 45.470 (5.297) **** 44.593 (5.295) **** 42.251 (5.602) **** Company Status Revenues in current year ($M) 0.297 (0.584) 0.689 (0.397) * Dollars raised in last round ($M) 1.035 (0.264) **** 0.468 (0.228) ** Outsiders control the board? (D) 18.479 (6.993) *** 10.522 (5.745) * Company age in months (L) 5.325 (4.225) -10.011 (4.108) ** Industry Segments (D) Software (dropped) (dropped) Communications -13.035 (6.327) ** -16.528 (5.878) *** Computer HW/Semi/Electronics 1.971 (9.276) -4.975 (8.975) IT Svcs./Consulting/Sys. Integ. -7.337 (9.590) -8.760 (8.579) Content/Info Provider 3.761 (10.458) -1.909 (8.852) Other segment 20.269 (13.014) 13.059 (11.090) Year 2000 (dropped) (dropped) Year 2001 -3.784 (7.112) 19.402 (6.332) **** Year 2002 -16.220 (7.112) ** 14.916 (6.884) ** Hypotheses H1: Founder dummy -25.261 (9.691) *** -23.964 (9.368) ** H2: % equity held by executive (L) -5.709 (2.835) ** -5.210 (2.080) ** H3: Number of employees (L) 28.606 (3.448) **** H4: Founder-X-Employees interaction 0.307 (0.134) ** 0.298 (0.122) ** H5: Number of rounds of financing 6.340 (2.795) ** H6: Founder-X-Rounds interaction -3.254 (3.448) -0.841 (2.777) Company dummies (528 dummies) Constant 69.619 (16.564) **** 28.691 (22.040) N = 1235 (535 clusters) N = 1218 (528 clusters) N = 1218 Prob > F = 0.000 Prob > F = 0.000 Prob > F = 0.000 R-squared = 0.329 R-squared = 0.441 R-squared = 0.808
(L) = log (D) = dummy
* p<.10 ** p<.05
*** p<.01 **** p<.005
Page 30
FIGURE 2
Graph of Founder-X-Employees Interaction Term from Model 2 in Table 3
$150
$170
$190
$210
0 150# o f Emplo yees
Founders
Non-founders
Page 31
TABLE 4 Core Model from Table 3, Using Equity-Value as I.V. and Salary as D.V.
Model 1: Equity value as IV Model 2: Salary as DV DV: Salary plus bonus DV: Salary
Coef. (SE) Coef. (SE) Control Variables Human Capital Years of prior experience 1.149 (0.271) **** 0.941 (0.191) **** Months since hired -0.214 (0.103) ** -0.195 (0.061) **** BA/BS degree -2.929 (5.381) -0.826 (3.380) MA/MS degree 1.913 (4.385) 3.967 (2.848) JD degree -2.579 (10.594) 6.154 (8.846) MBA degree -1.765 (4.389) 0.092 (2.823) PhD degree 15.922 (6.993) ** 15.747 (5.211) **** Executive hired via tie to VC (D) 3.947 (6.034) 6.464 (3.603) * Member of board of directors (D) 16.076 (5.695) *** 15.887 (3.738) **** Eligible for bonus (D) 47.522 (4.210) **** 8.525 (2.992) *** CEO dummy 37.569 (5.252) **** 31.359 (3.498) **** Company Status Revenues in current year ($M) 0.628 (0.370) * 0.703 (0.274) ** Dollars raised in last round ($M) 0.035 (0.214) 0.305 (0.148) ** Outsiders control the board? (D) 10.796 (6.158) * 9.474 (4.265) ** Company age in months (L) -14.242 (5.068) *** -4.853 (2.978) Segment Dummies Software (dropped) (dropped) Communications -14.744 (5.759) ** -7.754 (3.995) * Computer HW/Semic./Electronics -3.587 (9.427) -6.199 (5.959) IT Svcs./Consulting/Sys. Integ. 0.743 (8.836) -3.776 (5.578) Content/Info Provider -0.348 (8.894) 1.618 (5.814) Other segment 7.780 (14.133) 9.712 (6.910) Year 2000 (dropped) (dropped) Year 2001 21.381 (6.658) **** 17.246 (4.409) **** Year 2002 20.187 (7.352) *** 18.040 (5.172) **** Hypotheses H1: Founder dummy -35.121 (11.146) **** -13.844 (6.866) ** H2: Exec’s equity value (% held X Co. val’n) 9.095 (1.567) **** H2: % equity held by executive (L) -4.733 (2.109) ** H3: Number of employees (L) 29.006 (3.216) **** 19.239 (2.282) **** H4: Founder-X-Employees interaction 0.308 (0.143) ** 0.255 (0.107) ** H5: Number of rounds of financing 7.950 (3.152) ** 3.654 (1.355) *** H6: Founder-X-Rounds interaction -3.790 (3.859) -2.810 (2.029) Constant -6.199 (21.058) 49.211 (14.999) **** N = 1107 (506 clusters) N = 1218 (528 clusters) Prob > F = 0.000 Prob > F = 0.000 R-squared = 0.458 R-squared = 0.399
(L) = log (D) = dummy
* p<.10 ** p<.05
*** p<.01 **** p<.005
Page 32
REFERENCES
Aldrich, H. E. 1999. Organizations Evolving. Thousand Oaks, CA: Sage Publications.
Allen, M. P., & Panian, S. K. 1982. Power, performance, and succession in the large corporation. Administrative Science Quarterly, 27(4): 538-547.
Amabile, T. M. 1993. Motivational synergy: Toward new conceptualizations of intrinsic and extrinsic motivation in the workplace. Human Resource Management Review, 3(3): 185-201.
Arthurs, J. D., & Busenitz, L. W. 2003. The boundaries and limitations of agency theory and stewardship theory in the venture capitalist/entrepreneur relationship. Entrepreneurship Theory and Practice, 28: 145-162.
Baker, G. P. 1987. Discussion of an analysis of the use of accounting and market measures of performance in executive compensation contracts. Journal of Accounting Research, 25: 126-129.
Barkema, H. G., & Pennings, J. M. 1998. Top management pay: Impact of overt and covert power. Organization Studies, 19(6): 975-1003.
Barnard, C. 1938. The Functions of the Executive. Cambridge, MA: Harvard University Press.
Beatty, R. P., & Zajac, E. J. 1994. Managerial incentives, monitoring, and risk bearing: A study of executive compensation, ownership, and board structure in initial public offerings. Administrative Science Quarterly, 39(2): 313-335.
Belsley, D. A., Kuh, E., & Welsch, R. E. 1980. Regression Diagnostics. New York, NY: John Wiley & Sons.
Berle, A., & Means, G. C. 1932. The Modern Corporation and Public Property. New York: Macmillan.
Blau, P. 1970. A formal theory of differentiation in organizations. American Sociological Review, 31: 179-191.
Blau, P. M., & Scott, W. R. 1962. Formal Organizations. San Francisco, CA: Chandler.
Bloom, M. 1999. The performance effects of pay dispersion on individuals and organizations. Academy of Management Journal, 42(1): 25-40.
Bloom, M. C., & Milkovich, G. T. 1996. Issues in managerial compensation research. In C. L. Cooper, & D. M. Rousseau (Eds.), Trends in Organizational Behavior, Vol. 3: 23-47. New York, NY: John Wiley & Sons.
Borchers, J. 2004. Personal communication with the author. Palo Alto, CA.
Carpenter, M. 2000. The price of change: The role of CEO compensation in strategic variation and deviation from industry strategy norms. Journal of Management, 26(6): 1179-1198.
Carpenter, M., & Wade, J. 2002. Microlevel opportunity structures as determinants of non-CEO executive pay. Academy of Management Journal, 45(6): 1085-1103.
Carroll, G. R. 1984. Dynamics of publisher succession in newspaper organizations. Administrative Science Quarterly, 29: 93-113.
Certo, S. T., Covin, J. G., Daily, C. M., & Dalton, D. R. 2001. Wealth and the effects of founder management among IPO-stage new ventures. Strategic Management Journal, 22: 641-658.
Page 33
Certo, S. T., Daily, C. M., Cannella, A. A., Jr., & Dalton, D. R. 2003. Giving money to get money: How CEO stock options and CEO equity enhance IPO valuation. Academy of Management Journal, 46(5): 643-653.
Combs, J. G., & Skill, M. S. 2003. Managerialist and human capital explanations for key executive pay premiums: A contingency perspective. Academy of Management Journal, 46(1): 63-73.
Core, J., Holthausen, R., & Larcker, D. F. 1999. Corporate governance, chief executive officer compensation, and firm performance. Journal of Financial Economics, 51: 371-406.
Cyert, R. M., Kang, S.-H., & Kumar, P. 2002. Corporate governance, takeovers, and top-management compensation: Theory and evidence. Management Science, 48(4): 453-469.
Daily, C. M., Dalton, D. R., & Cannella, A. A., Jr. 2003. Corporate governance: Decades of dialogue and data. Academy of Management Review, 28(3): 371-382.
Davis, J. H., Schoorman, F. D., & Donaldson, L. 1997. Toward a stewardship theory of management. Academy of Management Review, 22(1): 20-47.
Deckop, J. R. 1988. Determinants of chief executive officer compensation. Industrial and Labor Relations Review, 41(2): 215-226.
Deckop, J. R., Mangel, R., & Cirka, C. C. 1999. Getting more than you pay for: Organizational citizenship behavior and pay-for-performance plans. Academy of Management Journal, 42(4): 420-428.
Dobrev, S. D., & Barnett, W. P. 2005. Organizational roles and transition to entrepreneurship. Academy of Management Journal, 48(3): 433-449.
Donaldson, L., & Davis, J. H. 1991. Stewardship theory or agency theory: CEO governance and shareholder returns. Australian Journal of Management, 16(1): 49-64.
Eisenhardt, K. M. 1989. Making fast strategic decisions in high-velocity environments. Academy of Management Journal, 32(3): 543-576.
Ensley, M. D., Pearson, A. W., & Amason, A. C. 2002. Understanding the dynamics of new venture top management teams: Cohesion, conflict, and new venture performance. Journal of Business Venturing, 17: 365-386.
Evans, D. S., & Leighton, L. S. 1989. Some empirical aspects of entrepreneurship. American Economic Review, 79: 519-535.
Fama, E. F., & Jensen, M. L. 1983. Separation of ownership and control. Journal of Law and Economics, 26: 301-325.
Finkelstein, S. 1992. Power in top management teams: Dimensions, measurement, and validation. Academy of Management Journal, 35: 505-538.
Finkelstein, S., & Hambrick, D. C. 1989. Chief executive compensation: A study of the intersection of markets and political processes. Strategic Management Journal, 10: 121-134.
Fisher, J., & Govindarajan, V. 1992. Profit center manager compensation: An examination of market, political and human capital factors. Strategic Management Journal, 13(3): 205-217.
Fogelberg, G. 1980. Ownership and control in 43 of New Zealand's largest companies. New Zealand Journal of Business, 2: 54-78.
Fox, M. A., & Hamilton, R. T. 1994. Ownership and diversification: Agency theory or stewardship theory. Journal of Management Studies, 31(1): 69-81.
Page 34
Froot, K. A. 1989. Consistent covariance matrix estimation with cross-sectional dependence and heteroskedasticity in financial data. Journal of Financial and Quantitative Analysis, 24: 333-355.
Gersick, C. J. G. 1994. Pacing strategic change: The case of a new venture. Academy of Management Journal, 37(1): 9-45.
Gimeno, J., Folta, T. B., Cooper, A. C., & Woo, C. Y. 1997. Survival of the fittest? Entrepreneurial human capital and the persistence of underperforming firms. Administrative Science Quarterly, 42(4): 750-783.
Gompers, P. 1995. Optimal investment, monitoring, and the staging of venture capital. Journal of Finance, 50: 1461-1489.
Gompers, P., & Lerner, J. 2001. The Money of Invention. Boston: Harvard Business School Press.
Guth, W. D., & MacMillan, I. C. 1986. Strategy implementation versus middle management self-interest. Strategic Management Journal, 7: 313-327.
Hall, B. J., & Murphy, K. J. 2002. Stock options for undiversified executives. Journal of Accounting & Economics, 33(1).
Hamilton, B. H. 2000. Does entrepreneurship pay? An empirical analysis of the returns to self-employment. Journal of Political Economy, 108(3): 604-631.
Handler, W. C. 1990. Succession in family firms: A mutual role adjustment between entrepreneur and next-generation family members. Entrepreneurship Theory and Practice, Fall: 37-51.
Hannan, M. T. 1998. Rethinking age dependence in organizational mortality: Logical formalizations. American Journal of Sociology, 104(1): 126-164.
Hannan, M. T., & Freeman, J. 1984. Structural inertia and organizational change. American Sociological Review, 49: 149-164.
Hellman, T., & Puri, M. 2002. Venture capital and the professionalization of start-up firms: Empirical evidence. Journal of Finance, 57(1): 169-197.
Henderson, A. D., & Fredrickson, J. W. 1996. Information-processing demands as a determinant of CEO compensation. Academy of Management Journal, 39(3): 575-606.
Henderson, A. D., & Fredrickson, J. W. 2001. Top management team coordination needs and the CEO pay gap: A competitive test of economic and behavioral views. Academy of Management Journal, 44(1): 96-117.
Hertzel, M., & Smith, R. L. 1993. Market discounts and shareholder gains for placing equity privately. Journal of Finance, 48(2): 459-485.
Hickson, D. J., Hinings, C. R., Lee, C. A., Schneck, R. E., & Pennings, J. M. 1971. A strategic contingencies theory of intraorganizational power. Administrative Science Quarterly, 16: 216-229.
Jayaraman, N., Khorana, A., Nelling, E., & Covin, J. 2000. CEO founder status and firm financial performance. Strategic Management Journal, 21: 1215-1224.
Jensen, M., & Meckling, W. 1976. Theory of the firm: Managerial behavior, agency costs and ownership structure. Journal of Financial Economics, 3: 305-360.
Jensen, M., & Murphy, K. 1990a. Performance pay and top management incentives. Journal of Political Economy, 98: 225-264.
Page 35
Jensen, M., & Murphy, K. J. 1990b. CEO incentives -- it's not how much you pay, but how. Harvard Business Review, 68(May-June): 138-153.
Kahl, M., Liu, J., Longstaff, F., & Page, M. 2003. Paper millionaires: How valuable is stock to a stockholder who is restricted from selling it? Journal of Financial Economics, 67(3): 385-410.
Lambert, R. A., Larcker, D. F., & Weigelt, K. 1993. The structure of organizational incentives. Administrative Science Quarterly, 38(3): 438-461.
Lane, P. J., Cannella, A. A., Jr., & Lubatkin, M. H. 1998. Agency problems as antecedents to unrelated mergers and diversification: Amihud and Lev reconsidered. Strategic Management Journal, 19: 555-578.
Lazear, E. P., & Rosen, S. 1981. Rank-order tournaments as optimum labor contracts. Journal of Political Economy, 89: 841-864.
Lee, P. M., & O'Neill, H. M. 2003. Ownership structures and R&D investments of U.S. and Japanese firms: Agency and stewardship perspectives. Academy of Management Journal, 46(2): 212-225.
Levinson, H. 1971. Conflicts that plague family businesses. Harvard Business Review, 49(2): 90-98.
Lorsch, J. 1989. Pawns or Potentates: The Reality of America's Boards. Boston, MA: Harvard Business School Press.
Mael, F., & Ashforth, B. E. 1992. Alumni and their alma mater: A partial test of the reformulated model of organizational identification. Journal of Organizational Behavior, 13(2): 103-123.
Main, B. G. M., O'Reilly, C. A., & Wade, J. 1995. The CEO, board of directors and executive compensation: Economic and psychological perspectives. Industrial and Corporate Change, 4(2): 293-332.
Mansfield, E. R., & Helms, B. P. 1982. Detecting multicollinearity. The American Statistician, 36(3): 158-160.
Manz, C. C. 1986. Self-leadership: Toward an expanded theory of self-influence processes in organizations. Academy of Management Review, 11(3): 585-600.
Morton, F. S., & Podolny, J. 2002. Love or money? The effects of owner motivation in the California wine industry. Journal of Industrial Economics, 50(4): 431-456.
Moskowitz, T. J., & Vissing-Jorgensen, A. 2002. The returns to entrepreneurial investment: A private equity premium puzzle? American Economic Review, 92(4): 745-778.
Nelson, T. 2003. The persistence of founder influence: Management, ownership, and performance effects at initial public offering. Strategic Management Journal, 24: 707-724.
Neter, J., Wasserman, W., & Kutner, M. H. 1989. Applied Linear Regression Models. Homewood, IL: Irwin.
O'Reilly, C. A., & Chatman, J. 1986. Organizational commitment and psychological attachment: The effects of compliance, identification, and internalization on prosocial behavior. Journal of Applied Psychology, 71: 492-499.
Ouchi, W. G. 1980. Markets, bureaucracies, and clans. Administrative Science Quarterly, 25: 129-141.
Pfeffer, J., & Langton, N. 1993. The effect of wage dispersion on satisfaction, productivity, and working collaboratively: Evidence from college and university faculty. Administrative Science Quarterly, 38: 382-407.
Pfeffer, J., & Salancik, G. R. 1978. The External Control of Organizations: A Resource Dependency Perspective. New York, NY: Harper and Row.
Page 36
Pierce, J. L., Kostova, T., & Dirks, K. T. 2001. Toward a theory of psychological ownership in organizations. Academy of Management Review, 26(2): 298-310.
Rediker, K. J., & Seth, A. 1995. Boards of directors and substitution effects of alternative governance mechanisms. Strategic Management Journal, 16(2): 85-99.
Rosen, J. 2004. Personal communication with the author. New York, NY.
Sahlman, W. A., & Gorman, M. 1986. What do venture capitalists do? Journal of Business Venturing, 1(1).
Sahlman, W. A., Stevenson, H. H., Roberts, M. J., & Bhide, A. 1999. The Entrepreneurial Venture. Boston, MA: Harvard Business School Press.
Tosi, H. L., Brownlee, A. L., Silva, P., & Katz, J. P. 2003. An empirical exploration of decision-making under agency controls and stewardship structure. Journal of Management Studies, 40(8): 2053-2071.
Villalonga, B., & Amit, R. 2005. How do family ownership, control, and management affect firm value? Journal of Financial Economics(In press).
Virany, B., Tushman, M. L., & Romanelli, E. 1992. Executive succession and organization outcomes in turbulent environments: An organization learning approach. Organization Science, 3(1): 72-91.
Waldman, D. A., Ramirez, G. G., House, R. J., & Puranam, P. 2001. Does leadership matter? CEO leadership attributes and profitability under conditions of perceived environmental uncertainty. Academy of Management Journal, 44(1): 134-143.
Williams, R. L. 2000. A note on robust variance estimation for cluster-correlated data. Biometrics, 56: 645-646.
Zaleznik, A., & Kets de Vries, M. F. R. 1975. Power and the Corporate Mind. Boston: Houghton Mifflin.