stevens creek 2011 summary report
TRANSCRIPT
Stevens Creek 2011
Summary Report
Wetland Cover
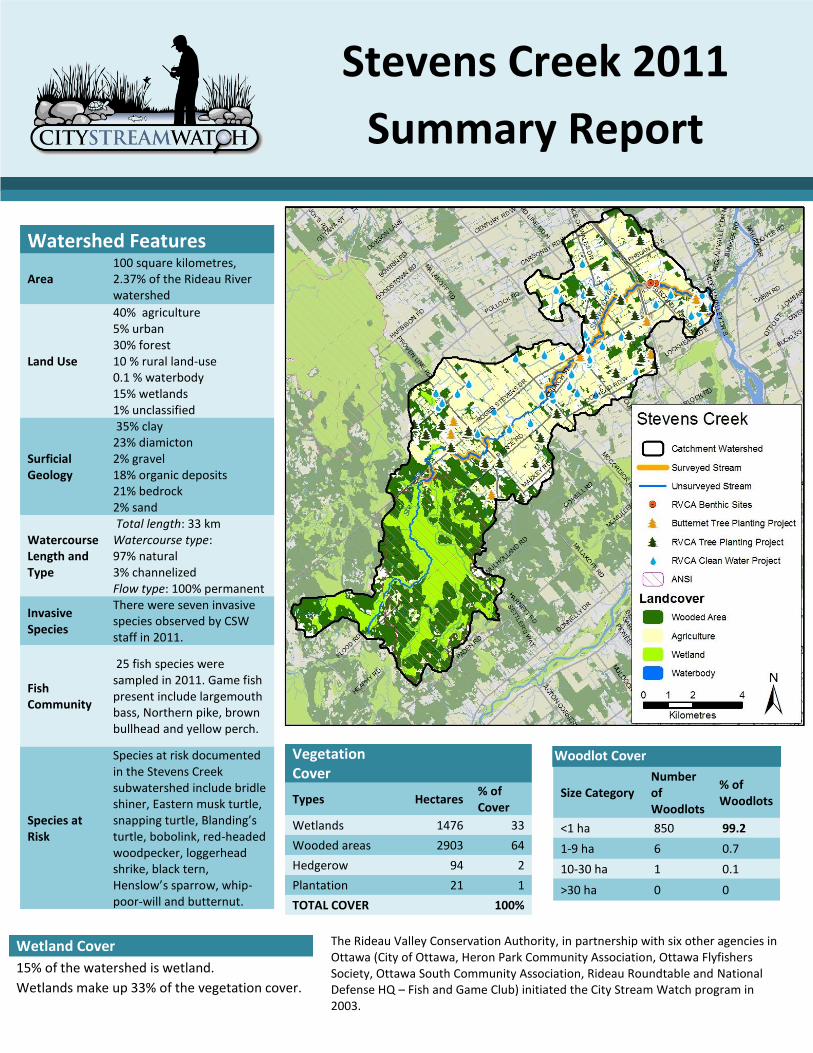
15% of the watershed is wetland.
Wetlands make up 33% of the vegetation cover.
Woodlot Cover
Size Category Number of Woodlots
% of Woodlots
<1 ha 850 99.2
1-9 ha 6 0.7
10-30 ha 1 0.1
>30 ha 0 0
Watershed Features
Area 100 square kilometres, 2.37% of the Rideau River watershed
Land Use
40% agriculture 5% urban 30% forest 10 % rural land-use 0.1 % waterbody 15% wetlands 1% unclassified
Surficial Geology
35% clay 23% diamicton 2% gravel 18% organic deposits 21% bedrock 2% sand
Watercourse Length and Type
Total length: 33 km Watercourse type: 97% natural 3% channelized Flow type: 100% permanent
Invasive Species
There were seven invasive species observed by CSW staff in 2011.
Fish Community
25 fish species were sampled in 2011. Game fish present include largemouth bass, Northern pike, brown bullhead and yellow perch.
Species at Risk
Species at risk documented in the Stevens Creek subwatershed include bridle shiner, Eastern musk turtle, snapping turtle, Blanding’s turtle, bobolink, red-headed woodpecker, loggerhead shrike, black tern, Henslow’s sparrow, whip-poor-will and butternut.
Vegetation Cover
Types Hectares % of Cover
Wetlands 1476 33
Wooded areas 2903 64
Hedgerow 94 2
Plantation 21 1
TOTAL COVER 100%
The Rideau Valley Conservation Authority, in partnership with six other agencies in Ottawa (City of Ottawa, Heron Park Community Association, Ottawa Flyfishers Society, Ottawa South Community Association, Rideau Roundtable and National Defense HQ – Fish and Game Club) initiated the City Stream Watch program in 2003.
Stevens Creek 2011 Summary Report
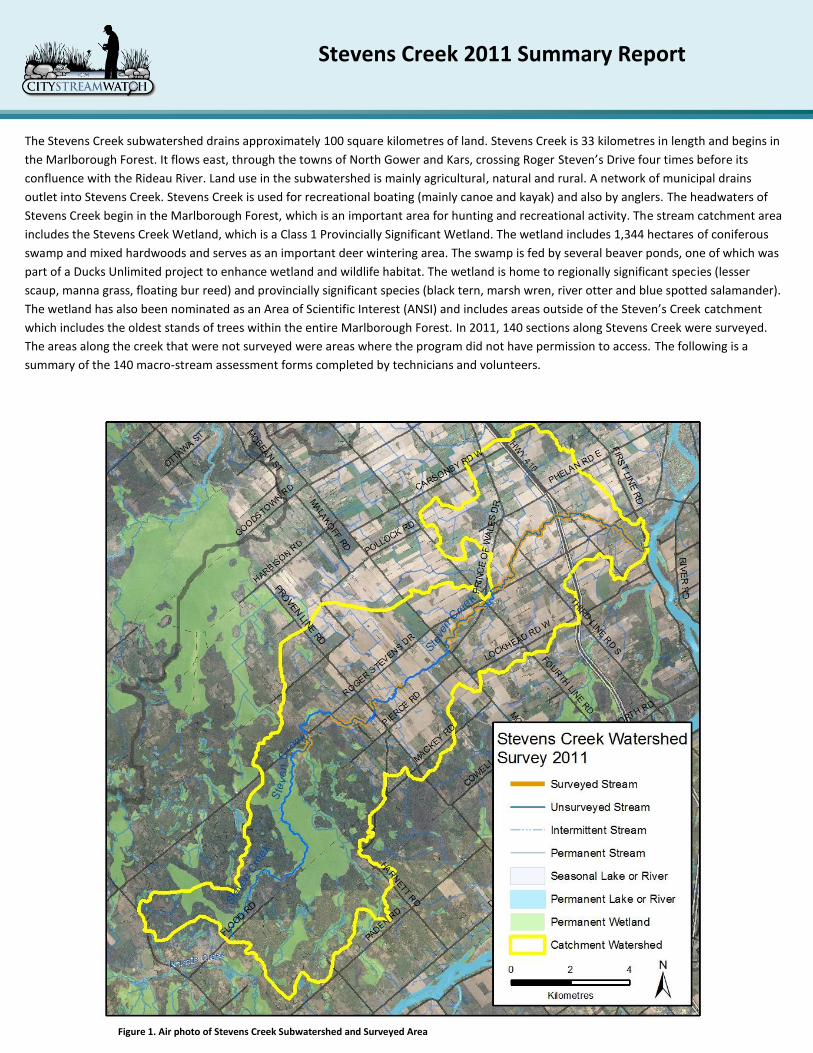
The Stevens Creek subwatershed drains approximately 100 square kilometres of land. Stevens Creek is 33 kilometres in length and begins in
the Marlborough Forest. It flows east, through the towns of North Gower and Kars, crossing Roger Steven’s Drive four times before its
confluence with the Rideau River. Land use in the subwatershed is mainly agricultural, natural and rural. A network of municipal drains
outlet into Stevens Creek. Stevens Creek is used for recreational boating (mainly canoe and kayak) and also by anglers. The headwaters of
Stevens Creek begin in the Marlborough Forest, which is an important area for hunting and recreational activity. The stream catchment area
includes the Stevens Creek Wetland, which is a Class 1 Provincially Significant Wetland. The wetland includes 1,344 hectares of coniferous
swamp and mixed hardwoods and serves as an important deer wintering area. The swamp is fed by several beaver ponds, one of which was
part of a Ducks Unlimited project to enhance wetland and wildlife habitat. The wetland is home to regionally significant species (lesser
scaup, manna grass, floating bur reed) and provincially significant species (black tern, marsh wren, river otter and blue spotted salamander).
The wetland has also been nominated as an Area of Scientific Interest (ANSI) and includes areas outside of the Steven’s Creek catchment
which includes the oldest stands of trees within the entire Marlborough Forest. In 2011, 140 sections along Stevens Creek were surveyed.
The areas along the creek that were not surveyed were areas where the program did not have permission to access. The following is a
summary of the 140 macro-stream assessment forms completed by technicians and volunteers.
Figure 1. Air photo of Stevens Creek Subwatershed and Surveyed Area

Stevens Creek 2011 Summary Report
18%
21%
36%
26%
Anthropogenic Changes to Stevens Creek
Not Altered
Natural
Altered
HighlyAltered
40%
3% 1% 7%
20%
7%
10%
6% 1% 4% 2%
Land Use Adjacent to Stevens Creek
Active Agriculture
Pasture
Abandonned Agriculture
Residential
Forest
Scrubland
Meadows
Wetlands
Industrial/Commercial
Recreational
Infracstructure
Anthropogenic Alterations to Stevens Creek Figure 2 illustrates the classes of anthropogenic alterations observed along Stevens Creek. Of the 140 sections sampled, 18 percent of the stream remained without any human alteration. Sections considered natural, but with some anthropogenic changes made up 21 percent of the sections sampled, and 36 percent accounted for sections that were considered “altered” but still had natural features. Twenty-six percent of the sampled areas were “highly altered” with few natural portions. Areas that were listed as “altered” or “highly altered” were associated with road crossings, culverts, channelized sections or areas that had little or no buffer and little aquatic or wildlife habitat.
Land Use Adjacent to Stevens Creek Eleven different land uses were identified along the banks adjacent to Stevens Creek. Surrounding land use is considered from the beginning to end of the survey section (100m) and up to 100m on each side of the creek. Land use outside of this area is not considered for the surveys but is nonetheless part of the subwatershed and will influence the creek. The largest land use (40%) was agricultural. Natural areas made up 43 percent of the stream, characterized by forest, scrubland, wetland and meadow. The remaining land use consisted of residential, pasture, infrastructure, abandoned agriculture, and industrial/ commercial.
Figure 2. Classes of Anthropogenic Alterations Occurring along Stevens Creek Photo of land use along Stevens Creek
Photo of an anthropogenic change on Stevens Creek
Stevens Creek 2011 Summary Report
97%
3%
Channel Type
Natural
Channelized
8% 2%
90%
Instream Morphology of StevensCreek
Pools
Riffles
Runs
4% 4%
10%
5%
8%
6%
23%
22%
18%
Instream Substrate Along StevensCreek
Bedrock
Boulders
Cobble
Gravel
Sand
Silt
Clay
Muck
Detritus
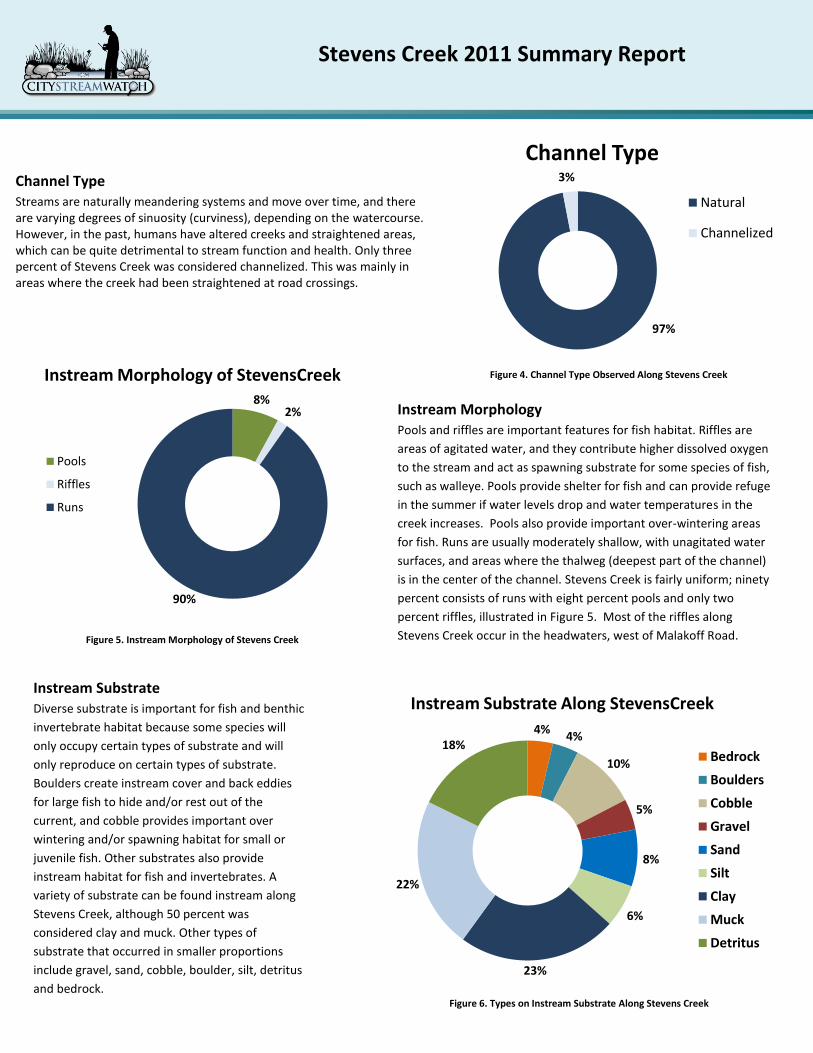
Channel Type Streams are naturally meandering systems and move over time, and there are varying degrees of sinuosity (curviness), depending on the watercourse. However, in the past, humans have altered creeks and straightened areas, which can be quite detrimental to stream function and health. Only three percent of Stevens Creek was considered channelized. This was mainly in areas where the creek had been straightened at road crossings.
Instream Morphology Pools and riffles are important features for fish habitat. Riffles are
areas of agitated water, and they contribute higher dissolved oxygen
to the stream and act as spawning substrate for some species of fish,
such as walleye. Pools provide shelter for fish and can provide refuge
in the summer if water levels drop and water temperatures in the
creek increases. Pools also provide important over-wintering areas
for fish. Runs are usually moderately shallow, with unagitated water
surfaces, and areas where the thalweg (deepest part of the channel)
is in the center of the channel. Stevens Creek is fairly uniform; ninety
percent consists of runs with eight percent pools and only two
percent riffles, illustrated in Figure 5. Most of the riffles along
Stevens Creek occur in the headwaters, west of Malakoff Road.
Instream Substrate Diverse substrate is important for fish and benthic
invertebrate habitat because some species will
only occupy certain types of substrate and will
only reproduce on certain types of substrate.
Boulders create instream cover and back eddies
for large fish to hide and/or rest out of the
current, and cobble provides important over
wintering and/or spawning habitat for small or
juvenile fish. Other substrates also provide
instream habitat for fish and invertebrates. A
variety of substrate can be found instream along
Stevens Creek, although 50 percent was
considered clay and muck. Other types of
substrate that occurred in smaller proportions
include gravel, sand, cobble, boulder, silt, detritus
and bedrock.
Figure 3. Land Use Identified Along Stevens Creek
Figure 4. Channel Type Observed Along Stevens Creek
Figure 5. Instream Morphology of Stevens Creek
Figure 6. Types on Instream Substrate Along Stevens Creek
Stevens Creek 2011 Summary Report
6%
16%
78%
4% 12%
84%
0
10
20
30
40
50
60
70
80
90
100
Instream Overhanging None
Left bank
Right bank
Percentage of Woody Debris Along Stevens Creek
5% 4%
95% 96%
0
10
20
30
40
50
60
70
80
90
100
Left Bank Right Bank
Undercut
No undercut
Percentage of Undercut Banks Along Stevens Creek
24%
76%
Percent shaded
Percent open
Percent of Stream Shaded Along Stevens Creek
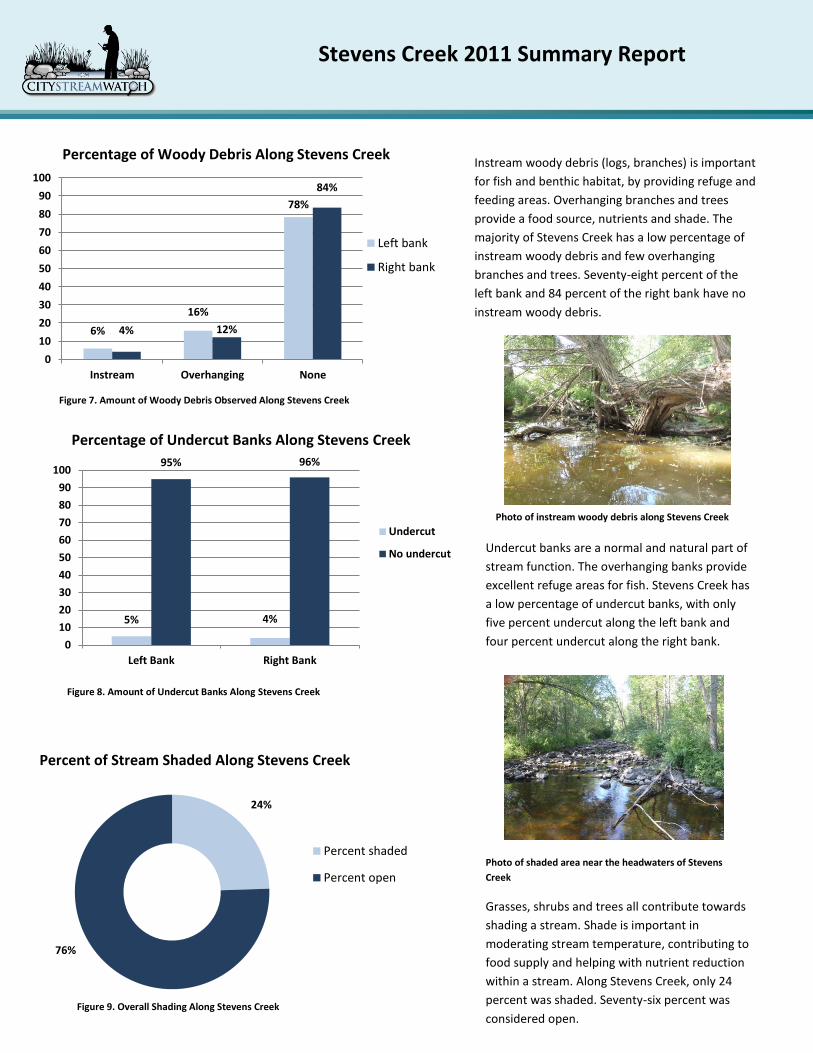
Instream woody debris (logs, branches) is important
for fish and benthic habitat, by providing refuge and
feeding areas. Overhanging branches and trees
provide a food source, nutrients and shade. The
majority of Stevens Creek has a low percentage of
instream woody debris and few overhanging
branches and trees. Seventy-eight percent of the
left bank and 84 percent of the right bank have no
instream woody debris.
Undercut banks are a normal and natural part of
stream function. The overhanging banks provide
excellent refuge areas for fish. Stevens Creek has
a low percentage of undercut banks, with only
five percent undercut along the left bank and
four percent undercut along the right bank.
Grasses, shrubs and trees all contribute towards
shading a stream. Shade is important in
moderating stream temperature, contributing to
food supply and helping with nutrient reduction
within a stream. Along Stevens Creek, only 24
percent was shaded. Seventy-six percent was
considered open.
Figure 7. Amount of Woody Debris Observed Along Stevens Creek
Figure 8. Amount of Undercut Banks Along Stevens Creek
Figure 9. Overall Shading Along Stevens Creek
Photo of instream woody debris along Stevens Creek
Photo of shaded area near the headwaters of Stevens
Creek

Stevens Creek 2011 Summary Report
54%
23% 16%
5% 1%
0%10%20%30%40%50%60%70%80%90%
100%
Extensive(choked withvegetation)
Common(>50%
vegetation)
Normal (25-50%
vegetation)
Low (<25%vegetation)
Rare(vegetationfew and farbetween)
Instream Vegetation of Stevens Creek
Narrow-leaved Emergents
21%
Broad-leaved Emergents
7%
Robust Emergents
9%
Free-floating Plants
6% Floating Plants
9%
Submerged Plants 18%
Algae 31%
Types of Instream Vegetation in Stevens Creek
13%
37%
13%
36%
17%
32%
14%
37%
0%
10%
20%
30%
40%
50%
60%
70%
80%
90%
100%
0-5m 5-15m 15-30m >30m
% o
f Se
ctio
ns
Sam
ple
d
Buffer Width
Buffer Evaluation of Stevens Creek
Left Bank
Right Bank
Amount of Instream Vegetation Instream vegetation is an important factor for a healthy
stream ecosystem. Vegetation helps to remove
contaminants from the water, contributes oxygen to the
stream, and provides habitat for fish and wildlife.
However, too much vegetation can be detrimental. Figure
10 demonstrates the frequency of instream vegetation in
Stevens Creek. Overall, Stevens Creek had a high amount
of vegetation; only 39 percent was considered to have
common or normal levels and six percent was considered
in the low or rare category. Fifty-four percent of the
surveyed areas had extensive levels (choked with
vegetation), which can be an indication of high amounts
of nutrients entering the stream. In some areas, it
flowering rush, an invasive species, which was choking the
stream and outcompeting native vegetation.
Types of Instream Vegetation The majority of Stevens Creek had a high diversity
in types of instream vegetation. Only 31 percent of
sections surveyed consisted of algae. The other
two types of vegetation most commonly found
were narrow-leaved emergents (21 percent) and
submergents (18 percent). Other types of
vegetation observed less often were broad-leaved,
robust, free-floating and floating.
Buffer Evaluation Natural buffers between watercourses and human
alterations are extremely important for filtering excess
nutrients running into the creek, infiltrating rainwater,
maintaining bank stability and providing wildlife habitat.
Natural shorelines also shade the creek, helping
maintain baseflow levels and keeping water
temperatures cool. According to the document How
Much Habitat Is Enough (Environment Canada, 2004), it
is recommended that a stream have a minimum of 30
metres of riparian area or more (the more the better).
Along Stevens Creek, 13 percent of the left bank and 17
percent of the right bank had a buffer of only zero to
five metres. Thirty-seven percent of the left bank and
thirty-two percent of the right bank had a buffer of five
to 15 metres. Thirteen percent to 14 percent had a
buffer of 15 to 30 metres. Just over one third of Stevens
Creek had a buffer of greater than 30 metres, which is
the minimum recommended buffer from the
Environment Canada document.
Figure 10. Amount of Instream Vegetation in Stevens Creek
Figure 11. Types of Instream Vegetation in Stevens Creek
Figure 12. Buffer Evaluation of Stevens Creek
Stevens Creek 2011 Summary Report
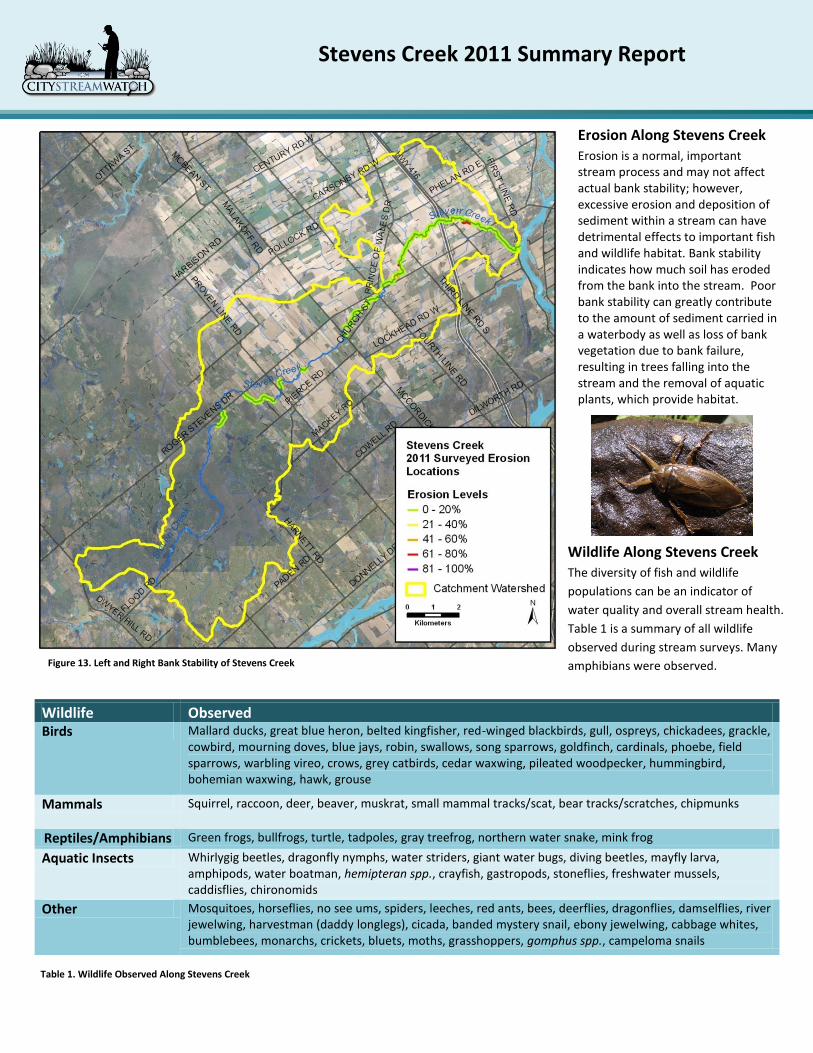
Wildlife Observed Birds Mallard ducks, great blue heron, belted kingfisher, red-winged blackbirds, gull, ospreys, chickadees, grackle,
cowbird, mourning doves, blue jays, robin, swallows, song sparrows, goldfinch, cardinals, phoebe, field sparrows, warbling vireo, crows, grey catbirds, cedar waxwing, pileated woodpecker, hummingbird, bohemian waxwing, hawk, grouse
Mammals Squirrel, raccoon, deer, beaver, muskrat, small mammal tracks/scat, bear tracks/scratches, chipmunks
Reptiles/Amphibians Green frogs, bullfrogs, turtle, tadpoles, gray treefrog, northern water snake, mink frog
Aquatic Insects Whirlygig beetles, dragonfly nymphs, water striders, giant water bugs, diving beetles, mayfly larva, amphipods, water boatman, hemipteran spp., crayfish, gastropods, stoneflies, freshwater mussels, caddisflies, chironomids
Other Mosquitoes, horseflies, no see ums, spiders, leeches, red ants, bees, deerflies, dragonflies, damselflies, river jewelwing, harvestman (daddy longlegs), cicada, banded mystery snail, ebony jewelwing, cabbage whites, bumblebees, monarchs, crickets, bluets, moths, grasshoppers, gomphus spp., campeloma snails
Erosion Along Stevens Creek Erosion is a normal, important stream process and may not affect actual bank stability; however, excessive erosion and deposition of sediment within a stream can have detrimental effects to important fish and wildlife habitat. Bank stability indicates how much soil has eroded from the bank into the stream. Poor bank stability can greatly contribute to the amount of sediment carried in a waterbody as well as loss of bank vegetation due to bank failure, resulting in trees falling into the stream and the removal of aquatic plants, which provide habitat.
Wildlife Along Stevens Creek The diversity of fish and wildlife
populations can be an indicator of
water quality and overall stream health.
Table 1 is a summary of all wildlife
observed during stream surveys. Many
amphibians were observed. Figure 13. Left and Right Bank Stability of Stevens Creek
Table 1. Wildlife Observed Along Stevens Creek
Stevens Creek 2011 Summary Report
5%
24%
17%
58%
0%
10%
20%
30%
40%
50%
60%
70%
80%
90%
100%
Oil/gas Trails Floating Garbage Garbage on StreamBottom
None
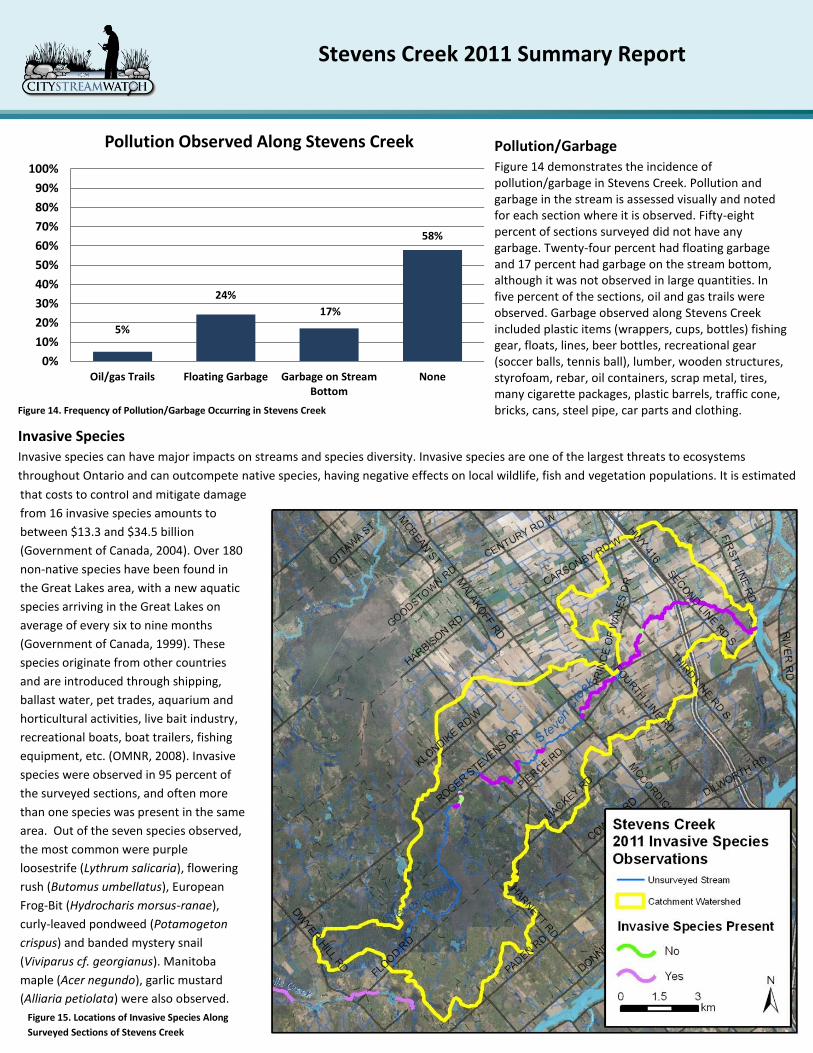
Pollution Observed Along Stevens Creek
Pollution/Garbage Figure 14 demonstrates the incidence of pollution/garbage in Stevens Creek. Pollution and garbage in the stream is assessed visually and noted for each section where it is observed. Fifty-eight percent of sections surveyed did not have any garbage. Twenty-four percent had floating garbage and 17 percent had garbage on the stream bottom, although it was not observed in large quantities. In five percent of the sections, oil and gas trails were observed. Garbage observed along Stevens Creek included plastic items (wrappers, cups, bottles) fishing gear, floats, lines, beer bottles, recreational gear (soccer balls, tennis ball), lumber, wooden structures, styrofoam, rebar, oil containers, scrap metal, tires, many cigarette packages, plastic barrels, traffic cone, bricks, cans, steel pipe, car parts and clothing.
that costs to control and mitigate damage
from 16 invasive species amounts to
between $13.3 and $34.5 billion
(Government of Canada, 2004). Over 180
non-native species have been found in
the Great Lakes area, with a new aquatic
species arriving in the Great Lakes on
average of every six to nine months
(Government of Canada, 1999). These
species originate from other countries
and are introduced through shipping,
ballast water, pet trades, aquarium and
horticultural activities, live bait industry,
recreational boats, boat trailers, fishing
equipment, etc. (OMNR, 2008). Invasive
species were observed in 95 percent of
the surveyed sections, and often more
than one species was present in the same
area. Out of the seven species observed,
the most common were purple
loosestrife (Lythrum salicaria), flowering
rush (Butomus umbellatus), European
Frog-Bit (Hydrocharis morsus-ranae),
curly-leaved pondweed (Potamogeton
crispus) and banded mystery snail
(Viviparus cf. georgianus). Manitoba
maple (Acer negundo), garlic mustard
(Alliaria petiolata) were also observed.
Invasive Species Invasive species can have major impacts on streams and species diversity. Invasive species are one of the largest threats to ecosystems
throughout Ontario and can outcompete native species, having negative effects on local wildlife, fish and vegetation populations. It is estimated
Figure 14. Frequency of Pollution/Garbage Occurring in Stevens Creek
Figure 15. Locations of Invasive Species Along
Surveyed Sections of Stevens Creek

Stevens Creek 2011 Summary Report
It is important to know locations of migratory
obstructions because these can prevent fish
from accessing important spawning and
rearing habitat. Only two migratory
obstructions to fish passage were observed
along Stevens Creek. The weir in North Gower
is a permanent obstruction. The other
obstruction is accumulated woody material.
Often, woody debris floating downstream can
get caught on fallen trees or branches and
build up, possibly creating a seasonal
migration barrier. The water levels in 2011
were extremely low, and the accumulated
debris may not have been an obstruction in
other years with normal water levels.
Photo of weir structure
Figure 16. Location of Migratory Obstructions to Fish Passage Along Stevens Creek
Temperature is an important parameter in streams as it influences many aspects of physical, chemical and biological health. Many factors can
influence fluctuations in stream temperature such as:
Springs (groundwater and surface water interaction)
Tributaries
Precipitation runoff
Discharge pipes
Stream shading from riparian vegetation
The greatest factor of fluctuating temperature is solar radiation and runoff from developed areas. Typically, streams with large amounts of
riparian canopy cover will yield lower temperatures while areas with no trees may be warmer. The method for temperature classification is
taken from Stoneman and Jones, which is an accepted method by both Ministry of Natural Resources and Department of Fisheries and Oceans
for assigning thermal classification. Classification is based on temperature data for each stream, taken at 4:00pm, anywhere between July 1 and
August 31, on days where maximum air temperature exceeds 24.5°C and the previous two or three days have had similar temperatures.
Although dataloggers are set to record temperatures between April and October, only the days that meet the temperature requirements are
used in classification. The water temperature is used along with the maximum temperature of those days to classify as warmwater, coolwater
or cold water.
Another important methodology of temperature classification is through fish community data. Fish have different temperature requirements,
and these are also considered when classifying the stream. For example, if a species is recorded in a stream that requires cold water, there
could be cold water inputs influencing that stream, at that location.
Figure 16. Location of Migratory Obstructions to Fish Passage Along Stevens Creek
Migratory Obstructions
Thermal Classification

Stevens Creek 2011 Summary Report
0
5
10
15
20
25
30
35
40
25.0 30.0 35.0 40.0
Datalogger 1
Datalogger 2
Datalogger 3
Datalogger 4
Datalogger 5
Thermal Classification for Stevens Creek
Warmwater
Coolwater
Cold Water
Five temperature dataloggers were deployed in Stevens
Creek to give a representative sample of how
temperature fluctuates and differs along the stream.
The dataloggers were installed in April and retrieved in
late September. Dataloggers are either secured to blocks
on the bottom of a stream or attached to rebar secured
to the bottom.
Figure 17. Temperature Datalogger Locations Along Stevens Creek
When analyzed on the
nomograph (Figure 18), it appears
that Stevens Creek is a
warmwater system. All
temperature dataloggers were
within that range, aside from one
which was within the coolwater
classification. This logger was
located near the mouth of
Stevens Creek.
There were two temperatures
from Datalogger 3 that were likely
out of water for a period of time
and were recording air
temperature instead of water
temperature. These were
discounted for the classification.
Photo of datalogger deployed in Stevens Creek on a block
Figure 18. Thermal Classification
Nomograph for Stevens Creek
Wat
er
Tem
pe
ratu
re a
t 1
6:0
0 (
°C)
Maximum Air Temperature (°C)
Stevens Creek 2011 Summary Report
Maximum Air Temperature (°C)
Wat
er
Tem
pe
ratu
re a
t 1
6:0
0 (°C
)
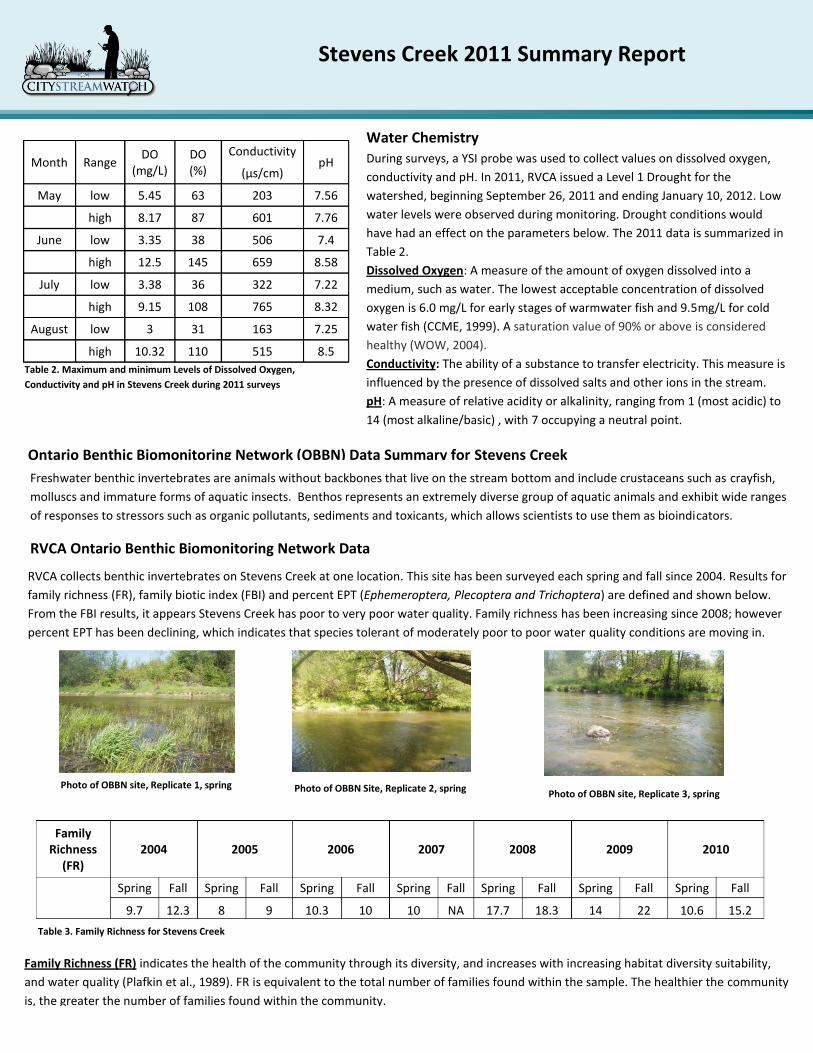
Water Chemistry During surveys, a YSI probe was used to collect values on dissolved oxygen,
conductivity and pH. In 2011, RVCA issued a Level 1 Drought for the
watershed, beginning September 26, 2011 and ending January 10, 2012. Low
water levels were observed during monitoring. Drought conditions would
have had an effect on the parameters below. The 2011 data is summarized in
Table 2.
Dissolved Oxygen: A measure of the amount of oxygen dissolved into a
medium, such as water. The lowest acceptable concentration of dissolved
oxygen is 6.0 mg/L for early stages of warmwater fish and 9.5mg/L for cold
water fish (CCME, 1999). A saturation value of 90% or above is considered
healthy (WOW, 2004).
Conductivity: The ability of a substance to transfer electricity. This measure is
influenced by the presence of dissolved salts and other ions in the stream.
pH: A measure of relative acidity or alkalinity, ranging from 1 (most acidic) to
14 (most alkaline/basic) , with 7 occupying a neutral point.
RVCA Ontario Benthic Biomonitoring Network Data
Ontario Benthic Biomonitoring Network (OBBN) Data Summary for Stevens Creek
Freshwater benthic invertebrates are animals without backbones that live on the stream bottom and include crustaceans such as crayfish,
molluscs and immature forms of aquatic insects. Benthos represents an extremely diverse group of aquatic animals and exhibit wide ranges
of responses to stressors such as organic pollutants, sediments and toxicants, which allows scientists to use them as bioindicators.
Family Richness (FR) indicates the health of the community through its diversity, and increases with increasing habitat diversity suitability,
and water quality (Plafkin et al., 1989). FR is equivalent to the total number of families found within the sample. The healthier the community
is, the greater the number of families found within the community.
Wat
er
Tem
pe
ratu
re a
t 1
6:0
0 (°C
)
Month Range DO
(mg/L) DO (%)
Conductivity pH
(µs/cm)
May low 5.45 63 203 7.56
high 8.17 87 601 7.76
June low 3.35 38 506 7.4
high 12.5 145 659 8.58
July low 3.38 36 322 7.22
high 9.15 108 765 8.32
August low 3 31 163 7.25
high 10.32 110 515 8.5
Table 2. Maximum and minimum Levels of Dissolved Oxygen,
Conductivity and pH in Stevens Creek during 2011 surveys
RVCA collects benthic invertebrates on Stevens Creek at one location. This site has been surveyed each spring and fall since 2004. Results for
family richness (FR), family biotic index (FBI) and percent EPT (Ephemeroptera, Plecoptera and Trichoptera) are defined and shown below.
From the FBI results, it appears Stevens Creek has poor to very poor water quality. Family richness has been increasing since 2008; however
percent EPT has been declining, which indicates that species tolerant of moderately poor to poor water quality conditions are moving in.
Family Richness
(FR) 2004 2005 2006 2007 2008 2009 2010
Spring Fall Spring Fall Spring Fall Spring Fall Spring Fall Spring Fall Spring Fall
9.7 12.3 8 9 10.3 10 10 NA 17.7 18.3 14 22 10.6 15.2
Photo of OBBN Site, Replicate 2, spring
Figure 18. Thermal Classification for Temperature Dataloggers on Stevens Creek
Photo of OBBN site, Replicate 1, spring Photo of OBBN site, Replicate 3, spring
Table 3. Family Richness for Stevens Creek
Stevens Creek 2011 Summary Report
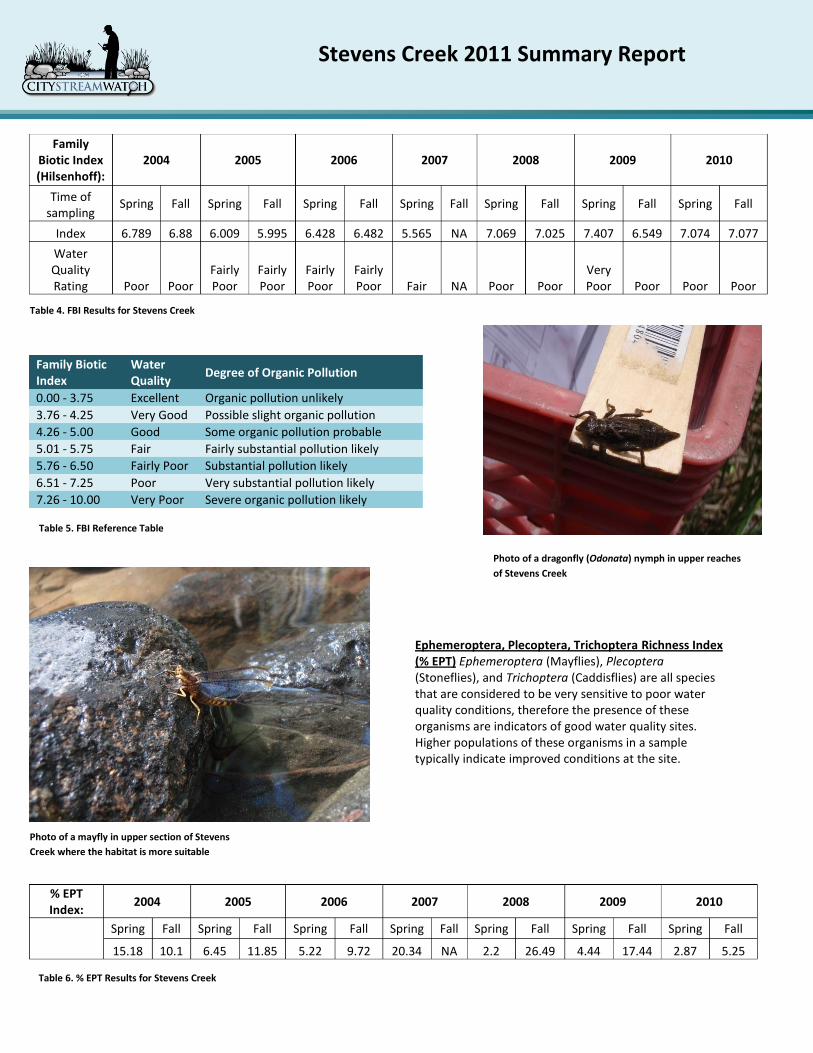
Ephemeroptera, Plecoptera, Trichoptera Richness Index (% EPT) Ephemeroptera (Mayflies), Plecoptera (Stoneflies), and Trichoptera (Caddisflies) are all species that are considered to be very sensitive to poor water quality conditions, therefore the presence of these organisms are indicators of good water quality sites. Higher populations of these organisms in a sample typically indicate improved conditions at the site.
Table 4. FBI Results for Stevens Creek
Table 5. FBI Reference Table
Family Biotic Index
Water Quality
Degree of Organic Pollution
0.00 - 3.75 Excellent Organic pollution unlikely
3.76 - 4.25 Very Good Possible slight organic pollution
4.26 - 5.00 Good Some organic pollution probable
5.01 - 5.75 Fair Fairly substantial pollution likely
5.76 - 6.50 Fairly Poor Substantial pollution likely
6.51 - 7.25 Poor Very substantial pollution likely
7.26 - 10.00 Very Poor Severe organic pollution likely
% EPT Index:
2004 2005 2006 2007 2008 2009 2010
Spring Fall Spring Fall Spring Fall Spring Fall Spring Fall Spring Fall Spring Fall
15.18 10.1 6.45 11.85 5.22 9.72 20.34 NA 2.2 26.49 4.44 17.44 2.87 5.25
Table 6. % EPT Results for Stevens Creek
Family Biotic Index (Hilsenhoff):
2004 2005 2006 2007 2008 2009 2010
Time of sampling
Spring Fall Spring Fall Spring Fall Spring Fall Spring Fall Spring Fall Spring Fall
Index 6.789 6.88 6.009 5.995 6.428 6.482 5.565 NA 7.069 7.025 7.407 6.549 7.074 7.077
Water Quality Rating Poor Poor
Fairly Poor
Fairly Poor
Fairly Poor
Fairly Poor Fair NA Poor Poor
Very Poor Poor Poor Poor
Photo of a mayfly in upper section of Stevens
Creek where the habitat is more suitable
Photo of a dragonfly (Odonata) nymph in upper reaches
of Stevens Creek
Stevens Creek 2011 Summary Report
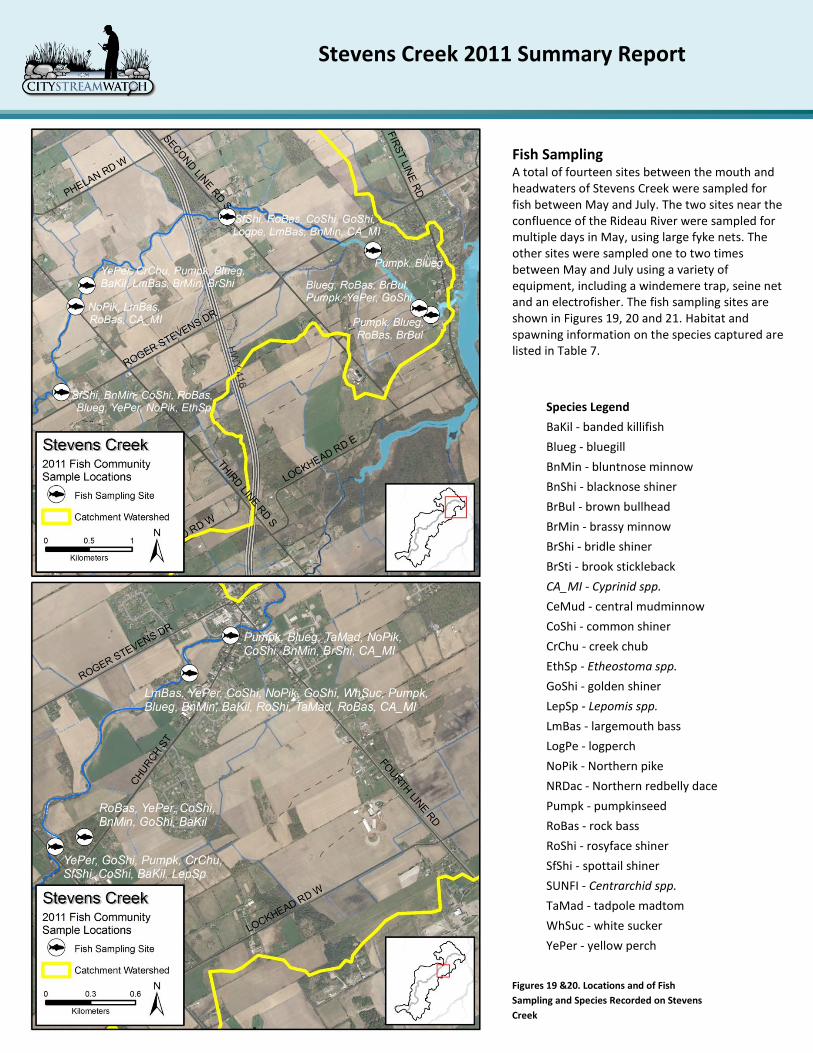
Fish Sampling A total of fourteen sites between the mouth and headwaters of Stevens Creek were sampled for fish between May and July. The two sites near the confluence of the Rideau River were sampled for multiple days in May, using large fyke nets. The other sites were sampled one to two times between May and July using a variety of equipment, including a windemere trap, seine net and an electrofisher. The fish sampling sites are shown in Figures 19, 20 and 21. Habitat and spawning information on the species captured are listed in Table 7.
Figures 19 &20. Locations and of Fish
Sampling and Species Recorded on Stevens
Creek
Species Legend
BaKil - banded killifish
Blueg - bluegill
BnMin - bluntnose minnow
BnShi - blacknose shiner
BrBul - brown bullhead
BrMin - brassy minnow
BrShi - bridle shiner
BrSti - brook stickleback
CA_MI - Cyprinid spp.
CeMud - central mudminnow
CoShi - common shiner
CrChu - creek chub
EthSp - Etheostoma spp.
GoShi - golden shiner
LepSp - Lepomis spp.
LmBas - largemouth bass
LogPe - logperch
NoPik - Northern pike
NRDac - Northern redbelly dace
Pumpk - pumpkinseed
RoBas - rock bass
RoShi - rosyface shiner
SfShi - spottail shiner
SUNFI - Centrarchid spp.
TaMad - tadpole madtom
WhSuc - white sucker
YePer - yellow perch

Stevens Creek 2011 Summary Report
Fish Community Summary A total of twenty-six different fish species were collected. All fish were live released back to the stream after fish sampling. Etheostoma spp. indicates that either Johnny Darters or Tessellated Darters were captured. To differentiate between those species, the fish must be removed from the system and brought back to lab; to avoid this, they are only identified to genus level. Minnow species that were caught but too small to identify are classified as Cyprinid spp. Two sunfish species were captured that were too small to identify. One was only identified to family level and is listed as Centrarchid spp. The second species was either Pumpkinseed or Bluegill, and is therefore listed further, as Lepomis spp. Six volunteers spent a total of 29.5 hours fish sampling on Stevens Creek and learned how to use a seine net.
Photo of a volunteer pulling a seine net
Figure 21. Locations and of Fish Sampling and Species Recorded on Stevens Creek
Species Legend
Blueg - bluegill
BnMin - bluntnose minnow
BnShi - blacknose shiner
BrSti - brook stickleback
CeMud - central mudminnow
CoShi - common shiner
CrChu - creek chub
EthSp - Etheostoma spp.
NoPik - Northern pike
NRDac - Northern redbelly dace
Pumpk - pumpkinseed
RoBas - rock bass
SUNFI - Centrarchid spp.
WhSuc - white sucker
Common shiner with spawning colours

Stevens Creek 2011 Summary Report
Table 7. Species List with Habitat and Spawning Requirements for Stevens Creek Fish Community
Species Name Latin Name General Habitat
Spawning Period
Spawning Temp (°C)
banded killifish
Fundulus diaphanous calm ponds or lakes spring 21-32
blacknose shiner
Notropis heterolepis still, shallow, clear streams or bays with abundant aquatic vegetation
spring n/a
bluegill Lepomis macrochirus ponds, lakes or calm rivers and streams with heavy aquatic vegetation
spring 19-27
bluntnose minnow
Pimephales notatus bottoms of shallow lakes or ponds or gravelly streams with little aquatic vegetation
spring 20-28
brassy minnow
Hybognathus hankinsoni
streams or cool, dark bog ponds with acidic waters spring 10-13
bridle shiner Notropis bifrenatus still, clear streams with abundant submergent vegetation late spring 14-26
brook stickleback
Culaea inconstans spring-fed ponds or cold streams with heavy aquatic vegetation or wetland areas of lakes
spring 8-19
brown bullhead
Ameiurus nebulosus bottom of shallow, warmwater bays, lakes or ponds and larger slow-moving rivers with abundant aquatic vegetation
spring 14-29
central mudminnow
Umbra limi ponds or pools in streams with heavy aquatic vegetation and organic substrate
spring ~13
common shiner
Luxilus comutus prefers streams or shorelines of clear lakes spring 14-28
creek chub Semotilus atromaculatus
prefers small creeks or shorelines of small lakes spring 13-27
golden shiner
Notemigonus crysoleucas
clear, still areas in shallower, larger watercourses with abundant aquatic vegetation
spring 20-27
largemouth bass
Micropterus salmoides shallow bays, lakes or calm rivers with woody debris, soft substrate and abundant aquatic vegetation
spring to summer
14-21
logperch Percina caprodes lakes, rivers or streams with sand, gravel or cobble substrate spring to summer
10-15
Northern pike
Esox Lucius calm, warm rivers or bays with heavy aquatic vegetation spring 2-18
Northern redbelly dace
Phoxinus eos quiet beaver ponds, small lakes or pools in streams June to July 21-27
pumpkinseed Lepomis gibbosus bays, lakes, ponds or calm streams with abundant submergent vegetation
spring to summer
13-29
rock bass Ambloplites rupestris rocky areas of shorelines along lakes or warm water reaches of streams
May to July 14-24
rosyface shiner
Notropis rubellus calm lakes or ponds or flowing rivers and streams spring 20-29
spottail shiner
Notropis hudsonius lakes or larger streams and rivers spring 18-22
tadpole madtom
Noturus gyrinus calm, clear ponds, streams, shallow lakes with soft bottoms and heavy aquatic vegetation
spring to summer
n/a
white sucker Catostomus commersonii
warmer, shallow bays, lakes or large tributaries spring 6-23
yellow perch Perca flavescens warm or cool ponds, lakes or rivers with moderate levels of aquatic vegetation
spring 7-22
Stevens Creek 2011 Summary Report
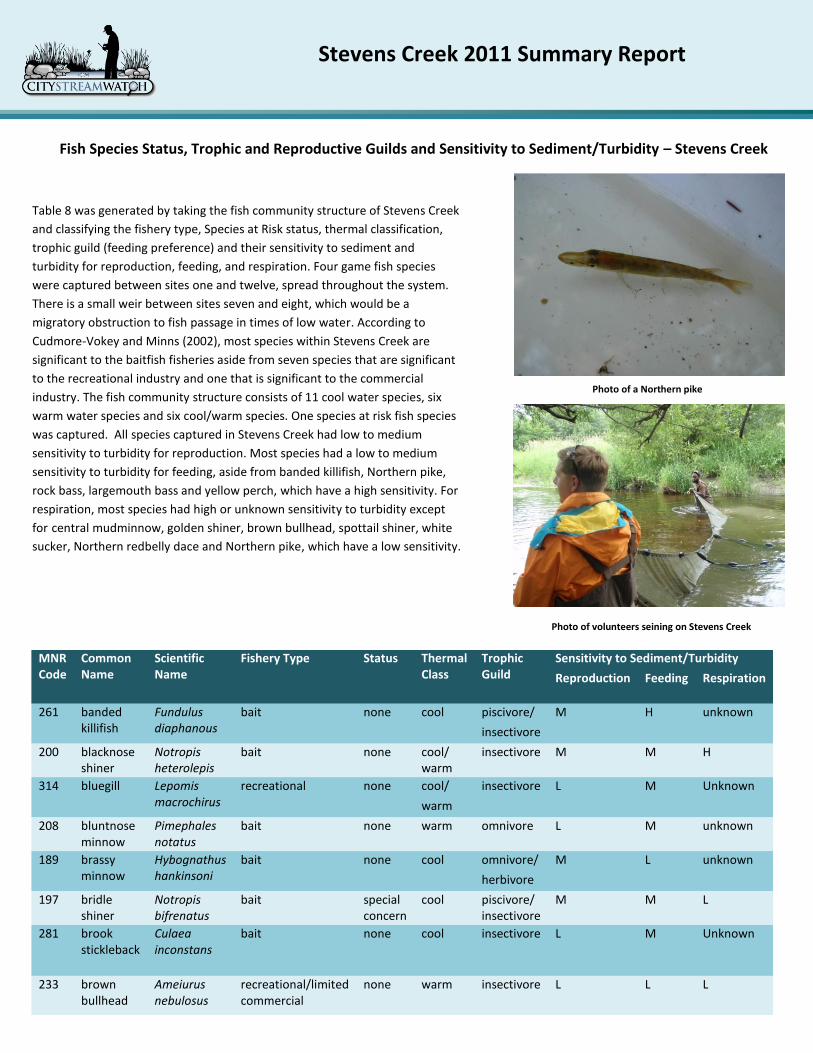
Fish Species Status, Trophic and Reproductive Guilds and Sensitivity to Sediment/Turbidity – Stevens Creek
Table 8 was generated by taking the fish community structure of Stevens Creek
and classifying the fishery type, Species at Risk status, thermal classification,
trophic guild (feeding preference) and their sensitivity to sediment and
turbidity for reproduction, feeding, and respiration. Four game fish species
were captured between sites one and twelve, spread throughout the system.
There is a small weir between sites seven and eight, which would be a
migratory obstruction to fish passage in times of low water. According to
Cudmore-Vokey and Minns (2002), most species within Stevens Creek are
significant to the baitfish fisheries aside from seven species that are significant
to the recreational industry and one that is significant to the commercial
industry. The fish community structure consists of 11 cool water species, six
warm water species and six cool/warm species. One species at risk fish species
was captured. All species captured in Stevens Creek had low to medium
sensitivity to turbidity for reproduction. Most species had a low to medium
sensitivity to turbidity for feeding, aside from banded killifish, Northern pike,
rock bass, largemouth bass and yellow perch, which have a high sensitivity. For
respiration, most species had high or unknown sensitivity to turbidity except
for central mudminnow, golden shiner, brown bullhead, spottail shiner, white
sucker, Northern redbelly dace and Northern pike, which have a low sensitivity.
Photo of a Northern pike
Photo of volunteers seining on Stevens Creek
MNR Code
Common Name
Scientific Name
Fishery Type Status Thermal Class
Trophic Guild
Sensitivity to Sediment/Turbidity
Reproduction Feeding Respiration
261 banded killifish
Fundulus diaphanous
bait none cool piscivore/ M H unknown
insectivore
200 blacknose shiner
Notropis heterolepis
bait none cool/ warm
insectivore M M H
314 bluegill Lepomis macrochirus
recreational none cool/ insectivore L M Unknown
warm
208 bluntnose minnow
Pimephales notatus
bait none warm omnivore L M unknown
189 brassy minnow
Hybognathus hankinsoni
bait none cool omnivore/ M L unknown
herbivore
197 bridle shiner
Notropis bifrenatus
bait special concern
cool piscivore/ insectivore
M M L
281 brook stickleback
Culaea inconstans
bait none cool insectivore L M Unknown
233 brown bullhead
Ameiurus nebulosus
recreational/limited commercial
none warm insectivore L L L
Stevens Creek 2011 Summary Report
Table 8. Summary of Status, Sensitivity and Classification for Fish Community in Stevens Creek
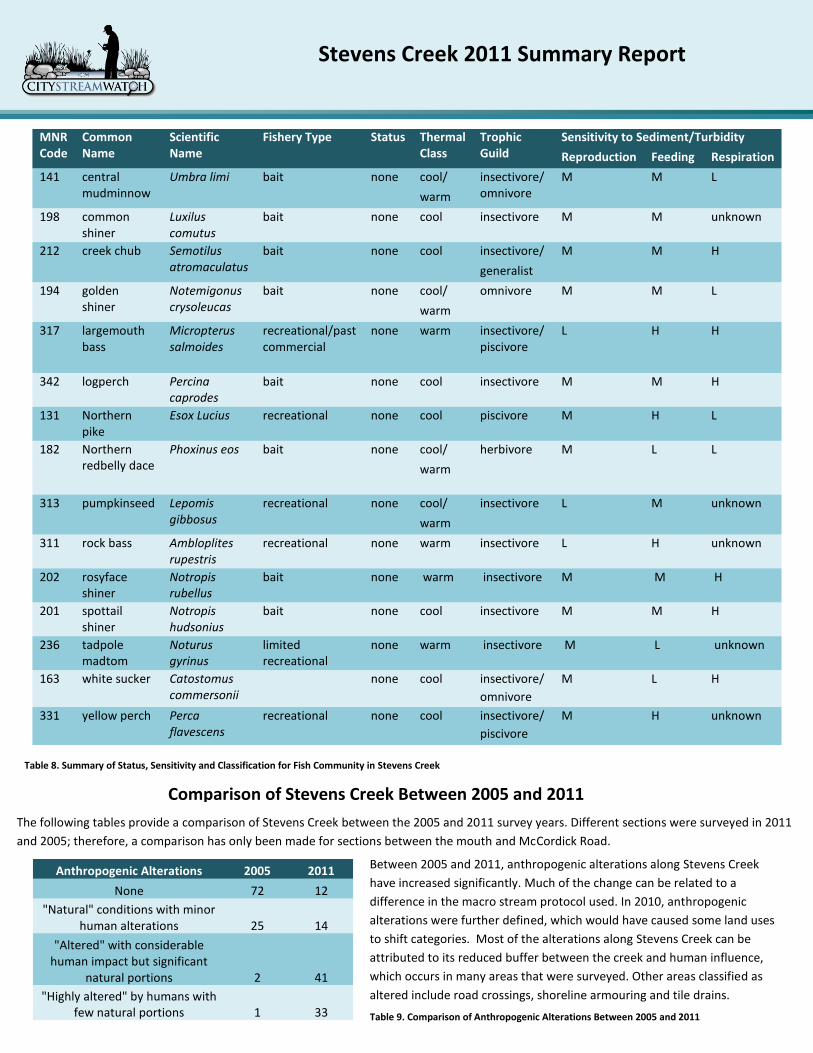
Anthropogenic Alterations 2005 2011
None 72 12
"Natural" conditions with minor human alterations 25 14
"Altered" with considerable human impact but significant
natural portions 2 41
"Highly altered" by humans with few natural portions 1 33
Between 2005 and 2011, anthropogenic alterations along Stevens Creek
have increased significantly. Much of the change can be related to a
difference in the macro stream protocol used. In 2010, anthropogenic
alterations were further defined, which would have caused some land uses
to shift categories. Most of the alterations along Stevens Creek can be
attributed to its reduced buffer between the creek and human influence,
which occurs in many areas that were surveyed. Other areas classified as
altered include road crossings, shoreline armouring and tile drains.
Table 9. Comparison of Anthropogenic Alterations Between 2005 and 2011
MNR Code
Common Name
Scientific Name
Fishery Type Status Thermal Class
Trophic Guild
Sensitivity to Sediment/Turbidity
Reproduction Feeding Respiration
141 central mudminnow
Umbra limi bait none cool/ insectivore/ omnivore
M M L
warm
198 common shiner
Luxilus comutus
bait none cool insectivore M M unknown
212 creek chub Semotilus atromaculatus
bait none cool insectivore/ M M H
generalist
194 golden shiner
Notemigonus crysoleucas
bait none cool/ omnivore M M L
warm
317 largemouth bass
Micropterus salmoides
recreational/past commercial
none warm insectivore/piscivore
L H H
342 logperch Percina caprodes
bait none cool insectivore M M H
131 Northern pike
Esox Lucius recreational none cool piscivore M H L
182 Northern redbelly dace
Phoxinus eos bait none cool/ herbivore M L L
warm
313 pumpkinseed Lepomis gibbosus
recreational none cool/ insectivore L M unknown
warm
311 rock bass Ambloplites rupestris
recreational none warm insectivore L H unknown
202 rosyface shiner
Notropis rubellus
bait none warm insectivore M M H
201 spottail shiner
Notropis hudsonius
bait none cool insectivore M M H
236 tadpole madtom
Noturus gyrinus
limited recreational
none warm insectivore M L unknown
163 white sucker Catostomus commersonii
none cool insectivore/ M L H
omnivore
331 yellow perch Perca flavescens
recreational none cool insectivore/ M H unknown
piscivore
Comparison of Stevens Creek Between 2005 and 2011
The following tables provide a comparison of Stevens Creek between the 2005 and 2011 survey years. Different sections were surveyed in 2011
and 2005; therefore, a comparison has only been made for sections between the mouth and McCordick Road.
Stevens Creek 2011 Summary Report
Instream Vegetation 2005 2011
Extensive 11 65
Common 44 21
Normal 24 12
Low 21 2
Rare 0 0
None n/a 0
Pollution/Garbage 2005 2011
None 82 63
Floating Garbage 11 30
Garbage on Stream Bottom 7 13
Oil or Gas Trails 0 7
Unusual Colouration n/a 0
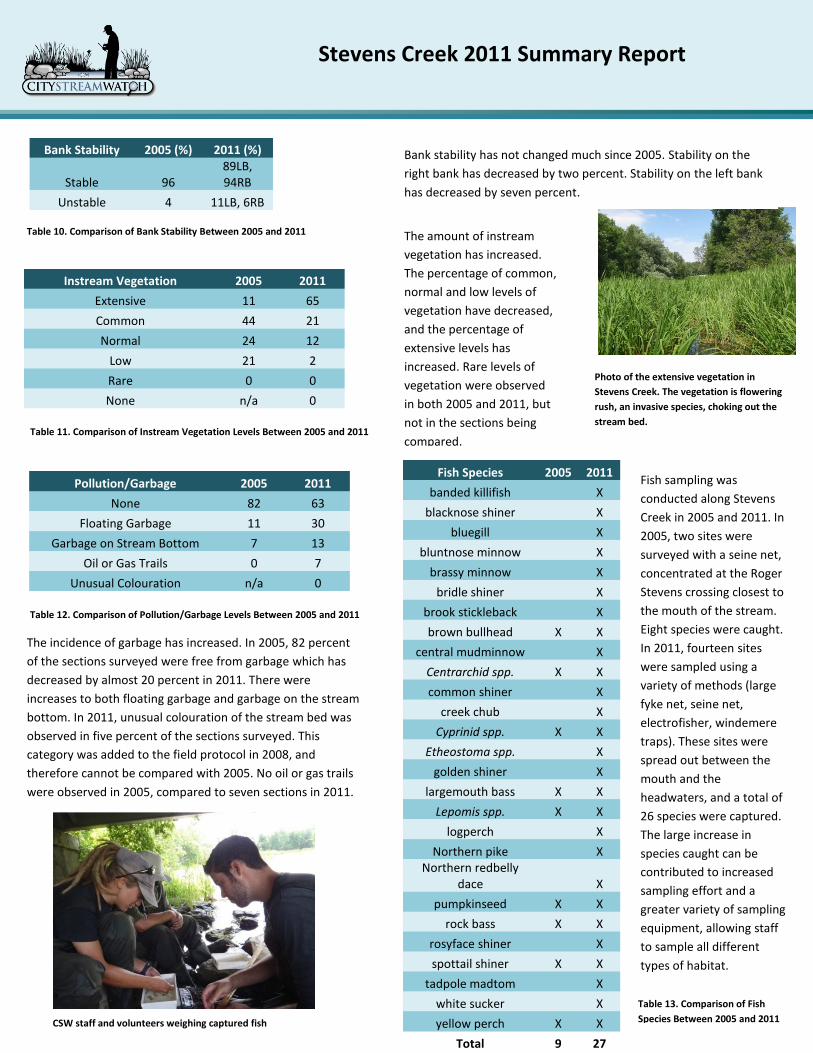
Bank Stability 2005 (%) 2011 (%)
Stable 96 89LB, 94RB
Unstable 4 11LB, 6RB
Bank stability has not changed much since 2005. Stability on the
right bank has decreased by two percent. Stability on the left bank
has decreased by seven percent.
The amount of instream
vegetation has increased.
The percentage of common,
normal and low levels of
vegetation have decreased,
and the percentage of
extensive levels has
increased. Rare levels of
vegetation were observed
in both 2005 and 2011, but
not in the sections being
compared.
The incidence of garbage has increased. In 2005, 82 percent
of the sections surveyed were free from garbage which has
decreased by almost 20 percent in 2011. There were
increases to both floating garbage and garbage on the stream
bottom. In 2011, unusual colouration of the stream bed was
observed in five percent of the sections surveyed. This
category was added to the field protocol in 2008, and
therefore cannot be compared with 2005. No oil or gas trails
were observed in 2005, compared to seven sections in 2011.
Table 10. Comparison of Bank Stability Between 2005 and 2011
Table 11. Comparison of Instream Vegetation Levels Between 2005 and 2011
Table 12. Comparison of Pollution/Garbage Levels Between 2005 and 2011
Photo of the extensive vegetation in
Stevens Creek. The vegetation is flowering
rush, an invasive species, choking out the
stream bed.
Fish Species 2005 2011
banded killifish X
blacknose shiner X
bluegill X
bluntnose minnow X
brassy minnow X
bridle shiner X
brook stickleback X
brown bullhead X X
central mudminnow X
Centrarchid spp. X X
common shiner X
creek chub X
Cyprinid spp. X X
Etheostoma spp. X
golden shiner X
largemouth bass X X
Lepomis spp. X X
logperch X
Northern pike X Northern redbelly
dace X
pumpkinseed X X
rock bass X X
rosyface shiner X
spottail shiner X X
tadpole madtom X
white sucker X
yellow perch X X
Total 9 27
Fish sampling was
conducted along Stevens
Creek in 2005 and 2011. In
2005, two sites were
surveyed with a seine net,
concentrated at the Roger
Stevens crossing closest to
the mouth of the stream.
Eight species were caught.
In 2011, fourteen sites
were sampled using a
variety of methods (large
fyke net, seine net,
electrofisher, windemere
traps). These sites were
spread out between the
mouth and the
headwaters, and a total of
26 species were captured.
The large increase in
species caught can be
contributed to increased
sampling effort and a
greater variety of sampling
equipment, allowing staff
to sample all different
types of habitat.
CSW staff and volunteers weighing captured fish
Table 13. Comparison of Fish
Species Caught in Stevens Creek
Between 2005 and 2011 Table 13. Comparison of Fish
Species Between 2005 and 2011
Stevens Creek 2011 Summary Report
Black swallowtail butterfly Bridle shiner, a species at risk, caught in Stevens Creek
The following table highlights past monitoring and restoration efforts that have been carried out in the Stevens Creek subwatershed.
Highlight of Monitoring and/or Restoration Work
Year Accomplishment Description
2005 City Stream Watch monitoring 144 macro stream surveys were completed on Stevens Creek by City Stream Watch staff and volunteers.
2005 Two sites sampled for fish by City Stream Watch staff and volunteers
Volunteers and staff captured eight species of fish, including young of the year largemouth bass and juvenile Northern pike
2006 City of Ottawa fish sampling
The City of Ottawa conducted fish sampling between the mouth of Stevens Creek and 2nd Line Road, capturing a total of 18 species over 10 sites. Another site farther upstream was sampled and a total of six species were caught.
2011 14 sites along Stevens Creek were sampled by City Stream Watch staff and volunteers; a total of 25 fish species were captured.
6 volunteers spent a total of 29.5 hours assisting with seine netting and electrofishing. All fish were released live back into the creek.
2011 140 macro stream surveys were completed on Stevens Creek by City Stream Watch staff and volunteers
43 volunteers spent a total of 324 hours carrying out stream habitat surveys on Stevens Creek.
ongoing RVCA Stewardship projects RVCA has provided incentive grants for landowners within Stevens Creek subwatershed for a total of 24 tree plantings, 7 butternut plantings and 43 rural clean water projects
ongoing OBBN monitoring RVCA staff monitor benthic invertebrates for water quality at one site along Stevens Creek; since 2003 benthos are collected by staff each spring and fall and analyzed in a lab
Table 14. Monitoring and Restoration Highlights in the Stevens Creek subwatershed
Stevens Creek 2011 Summary Report
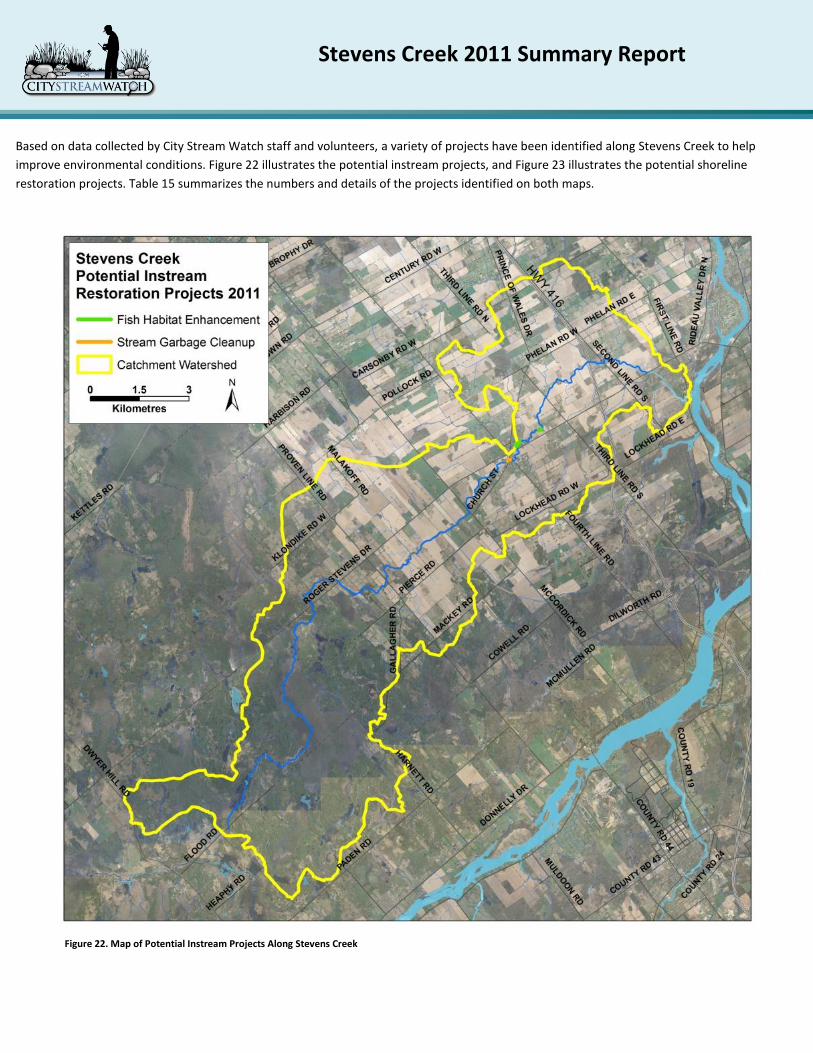
Based on data collected by City Stream Watch staff and volunteers, a variety of projects have been identified along Stevens Creek to help
improve environmental conditions. Figure 22 illustrates the potential instream projects, and Figure 23 illustrates the potential shoreline
restoration projects. Table 15 summarizes the numbers and details of the projects identified on both maps.
Figure 22. Map of Potential Instream Projects Along Stevens Creek
Stevens Creek 2011 Summary Report
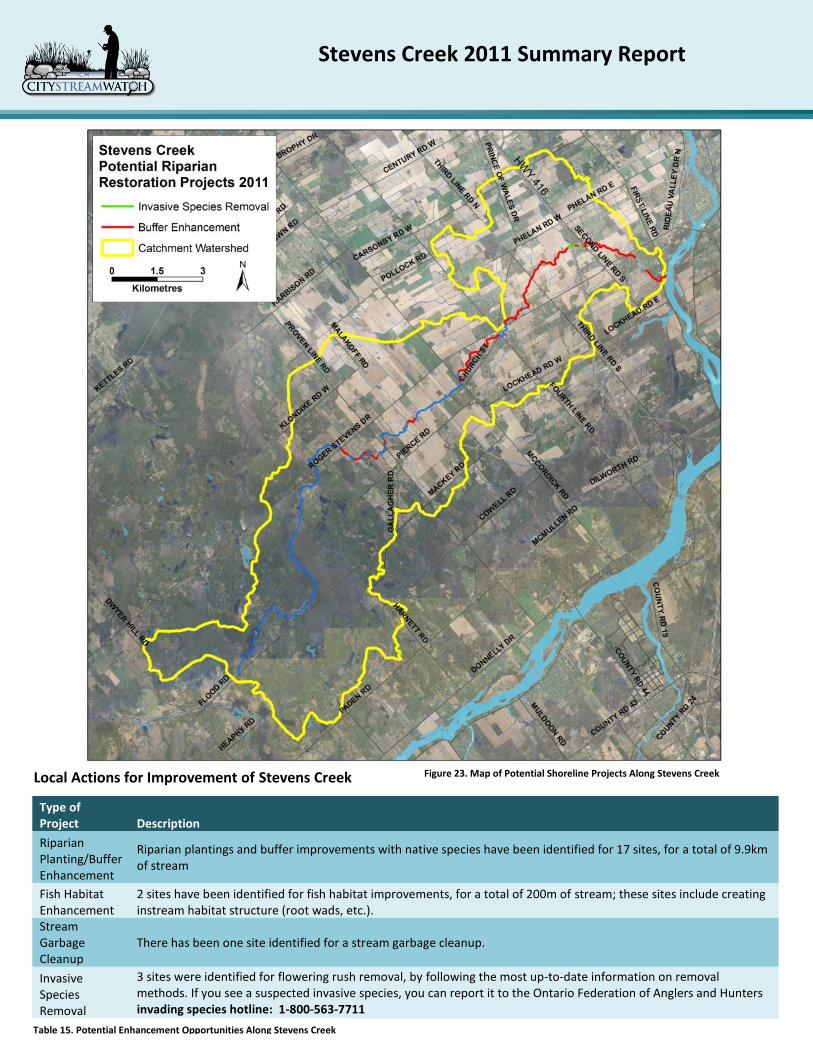
Figure 23. Map of Potential Shoreline Projects Along Stevens Creek Local Actions for Improvement of Stevens Creek
Type of Project Description
Riparian Planting/Buffer Enhancement
Riparian plantings and buffer improvements with native species have been identified for 17 sites, for a total of 9.9km of stream
Fish Habitat Enhancement
2 sites have been identified for fish habitat improvements, for a total of 200m of stream; these sites include creating instream habitat structure (root wads, etc.).
Stream Garbage Cleanup
There has been one site identified for a stream garbage cleanup.
Invasive Species Removal
3 sites were identified for flowering rush removal, by following the most up-to-date information on removal methods. If you see a suspected invasive species, you can report it to the Ontario Federation of Anglers and Hunters invading species hotline: 1-800-563-7711
Table 15. Potential Enhancement Opportunities Along Stevens Creek

Stevens Creek 2011 Summary Report
For information on the overall 2011 City Stream Watch Program and the volunteer activities,
please refer to the City Stream Watch Summary report, 2011. To view the macrostream protocol
used, please see the City Stream Watch website:
http://www.rvca.ca/programs/streamwatch/index.html
REFERENCES 1. Canadian Wildlife Service (CWS), Environment Canada. 2004. How Much Habitat Is Enough? Retrieved from:
http://www.ec.gc.ca/EnviroZine/english/issues/64/feature2_e.cfm 2. Cudmore-Vokey, Becky and Minns, C.K. 2002. Reproductive Ecology and Vegetation Association Databases of Lake Ontario Fishes. 3. Ontario Ministry of Natural Resources. 2008. Field Guide to Aquatic Invasive Species. 4. Ontario Ministry of Natural Resources. April 1, 1990-March 31, 2010. Resource Management Plan for the Regional Municipality of
Ottawa-Carleton Marlborough Forest 5. Plafkin et al. 1989. Rapid Bioassessment Protocols for use in Streams and Rivers: Benthic Macroinvertebrates and Fish. U.S.
Environmental Protection Agency. 6. Rideau Valley Conservation Authority (RVCA). 2005. City Stream Watch Annual Report. Manotick, ON: Grant Nichols 7. Rideau Valley Conservation Authority (RVCA). 2006. City Stream Watch Annual Report. Manotick, ON: Grant Nichols
8. Rideau Valley Conservation Authority (RVCA). 2009 (OBBN data).
9. Stoneman, C.L. and M.L. Jones. 1996. A Simple Method to Evaluate the Thermal Stability of Trout Streams.
2011 City Stream Watch Sponsors A very large and sincere thank you to our 2011 program sponsors:
Community Fisheries and Wildlife Involvement Program, Ministry of Natural Resources
Science and Technology Internship, Natural Resources Canada