steven domber new jersey geological and water survey … · national watersmart ... ag/irr. potable...
TRANSCRIPT

Steven Domber New Jersey Geological and Water Survey
New Jersey Department of Environmental Protection &
Jennifer Shourds New Jersey Water Science Center United States Geological Survey

Acknowledgements Steve Tessler, Ecologist/Data Manager, USGS
Christine Wieben, Hydrologist, USGS
Mary Chepiga, Chief Hydrologic Modeling, USGS
Jeffrey Hoffman, NJ State Geologist, NJGWS

NJ Water Transfer Data Model or NJWaTr or NJ Water or…. NJ’s tool to compile, store and distribute “cradle to grave” water use
data for research/modeling purposes; not regulatory Department-wide reported data and estimates
A conveyance-based model that represents any water exchange activity between two sites
Pairs of Sites are joined through unidirectional Conveyances for which water Transactions are recorded
Sites and conveyances form a water network
Attributes such as owner, permit, water resource, location are linked with each component of the network
Uses MS Access as primary data management tool

What’s in NJWaTr: Two Primary Conveyance Networks
WithdrawalPoint
WithdrawalPoint
Drinking WaterService Area
Drinking WaterUse Area
Sewer ServiceArea
DischargePoint
DischargePoint
DischargePoint
Drinking WaterService Area
Sewer ServiceArea
Atmosphere
Use Area
Atmosphere
WithdrawalPoint
DischargePoint
self-supplied commercial and industrial, agricultural, power generation, irrigation and mining uses
- Attribute information associated with all sites (boxes) and conveyances (arrows) - Transfer information associated will all conveyances, where available
potable supply and wastewater uses

What NJWaTr helps you know… Where does our water come from? Where does it go? What is the water used for? Who’s using it? How much is used? How much is returned and where? How and why do these facts change over time? And a whole lot more

Simple Questions, but Water programs evolved to address very specific needs
with specific rules and regulations. e.g. allocation withdrawals, NJDPES discharges, safe
drinking water systems, WQMPs
The data management systems of those programs were not designed to look at the entire cycle of water use; just their specific component of it.
NJWaTr links these different datasets together to
allow the user to look at the conveyance of water from withdrawal to discharge.

USGS and NJDEP Collaboration Initiated in 2002 with USGS NJ Water Science Center
Offshoot of NEWUDS NJWaTr v1 with 1990 to 1999 data
2005 NJWaTr v2 updated model and enhanced data loading methods
2008 added 2000 to 2007 data and created post-processors
2009 started annual update agreements with USGS
Model updates and data QA/QC
2010 2-year JFAs to handle new data and corrections
ASR, historical data; 1918-1989, sw returns, model enhancements
~$2Million with ~1/3+ covered by USGS match: $133K/year Vs $100K to add 1 table to NJDEP regulatory database

NJWaTr Contains Over 38,000 Sites
Industrial, commercial, mining, power, irrigation, public supply, & self-supplied domestic sw and gw withdrawals
Water purveyor raw and finished water transfers, aquifer storage and recovery, and sanitary sewer discharges
100,000 gpd reporting thresholds, with 50,000 gpd in NJ Highlands No saline withdrawals (for now)
25,000 one-way Conveyances
2.5 million Transfers
1990 to 2011 monthly data 2012 to 2013 data will be available summer 2016 2014 and 2015 data available January 2017
Flexible design allows easy addition of new data/attributes to meet needs of
multiple users
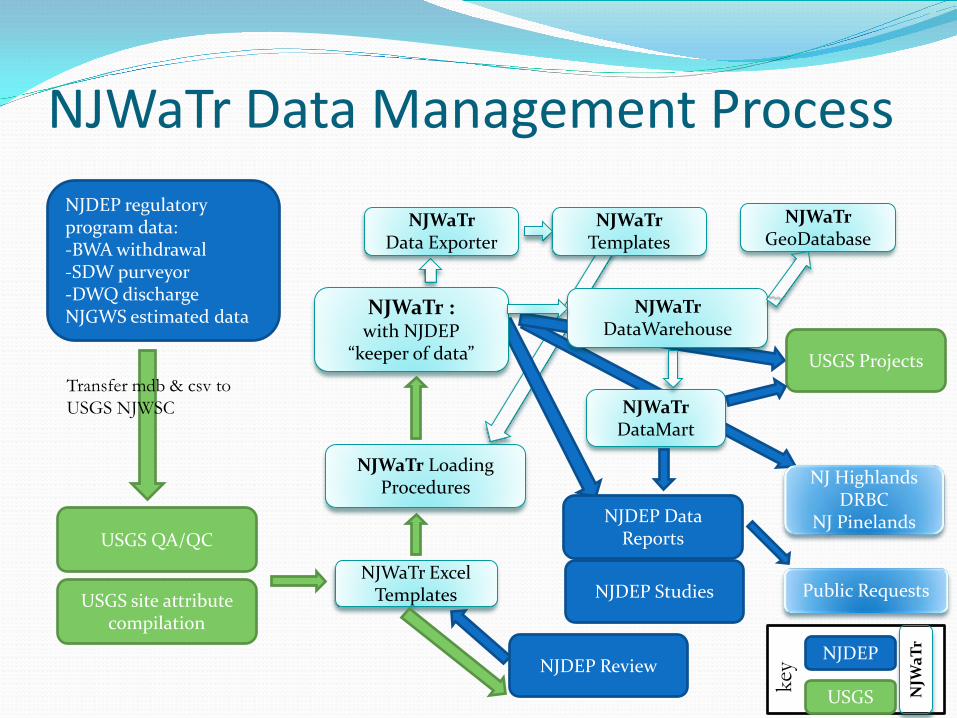
NJWaTr Data Management Process NJDEP regulatory program data: -BWA withdrawal -SDW purveyor -DWQ discharge NJGWS estimated data
NJWaTr Excel Templates
USGS QA/QC
USGS site attribute compilation
Transfer mdb & csv to USGS NJWSC
USGS Projects
NJWaTr Loading Procedures
NJWaTr : with NJDEP
“keeper of data”
NJWaTr DataMart
NJWaTr DataWarehouse
NJDEP Studies
NJDEP Data Reports
NJDEP Review
Public Requests
NJ Highlands DRBC
NJ Pinelands
NJWaTr Data Exporter
NJWaTr Templates
NJWaTr GeoDatabase
NJDEP
USGS key
NJW
aTr

QA/QC Process 1) Identify new sites for current year. (~100 new sites added to NWIS every yr
but varies) 2) Allocate members (sites) to their particular groups to remove any
duplicates/double-reported sites. 3) Compute year totals for all sites & identify which permits are pumping
outside their monthly & yearly allocations. Check “over pumpers” against available paper copies, where available. Fix & document/flag (10 different QA flags)
4) Identify missing monthly data– estimate using earlier historical data & document/flag
5) Compare yearly totals for current year against historical data using outlier/statistical calculations and visual/graphical programs. Fix any discrepancies & document/flag
6) Repeat this process for updates & additions to previous years’ (historical) data, from 2003 to present.
7) Add supporting metadata (hydrologic resource info, type of use, census info, critical areas, HUC14, aquifer designation, etc)
8) When QA/QC process complete, create & load data into appropriate NJWaTr templates
9) Create & update GIS interface with new annual & monthly water use data

QA/QC Process, continued As a tracking model, NJWaTr is capable of tracking not only the source
& destination of water use but the evolution of a datapoint throughout time. Example: Null datapoint-> estimated-> reported volume-> units error-> final
All of these data points/volumes get preserved & annotated. NJWaTr will show the last value as ‘Preferred’; Old values/changes stored as ‘Non-preferred’ in different table w/in database with timestamp & appropriate flag(s) explaining genesis.
Estimations based on a historical average, calculated by month, by site. That historical estimation value improves over time as more data (ie years) become available/uploaded.

QA/QC process in pictures (11 Step Process, constantly evolving)
0
2
4
6
8
10
12
14
16
18
2003 2004 2005 2006 2007
Annu
al U
se m
gy
Annual Use- 2055P Name of Owner, LLC
Statistical functions to elicit biggest problems first. (pumping greater than 25% of permitted monthly or annual allocation(s), 2SDs away from historical mean) 90/10 rule
Chose your favorite BWA permit

New QA/QC - open source coding “Up and coming” R Studio/Shiny app- we have plans to adapt work we did for USGS national
compilation QA/QC this spring to fit NJWaTr’s QA/QC program. Idea is to format NJWaTr data such that with some coding changes we will be able to use this functionality as another graphic/visual means to QA/QC our data. Can compare 2 years for one data category, 2 data categories over time, multiple data categories over time, boxplots, times series plots, bar sums, ranked data, choropleths
Examples of graphs plotted for data exploration:

Challenging technical aspects Common errors with the water use data– order(s) of magnitude off in
reported volumes/units issues; usage reported on wrong well/site.
Linking USGS vs NJDEP Bureau of Water Allocation systems together (mainly site identification issues)
Supporting metadata come from different sources
Delay inherent in dealing with water use data to produce a reliable
dataset, have to wait ‘til following year, (sometimes November before complete dataset) and time needed to process, QA/QC data, and upload into various databases. Water use data are NOT real time!
The good news: a lot/most of these problems have gone away or
improved drastically over the years as a result of: online reporting, database automation, and/or better information available
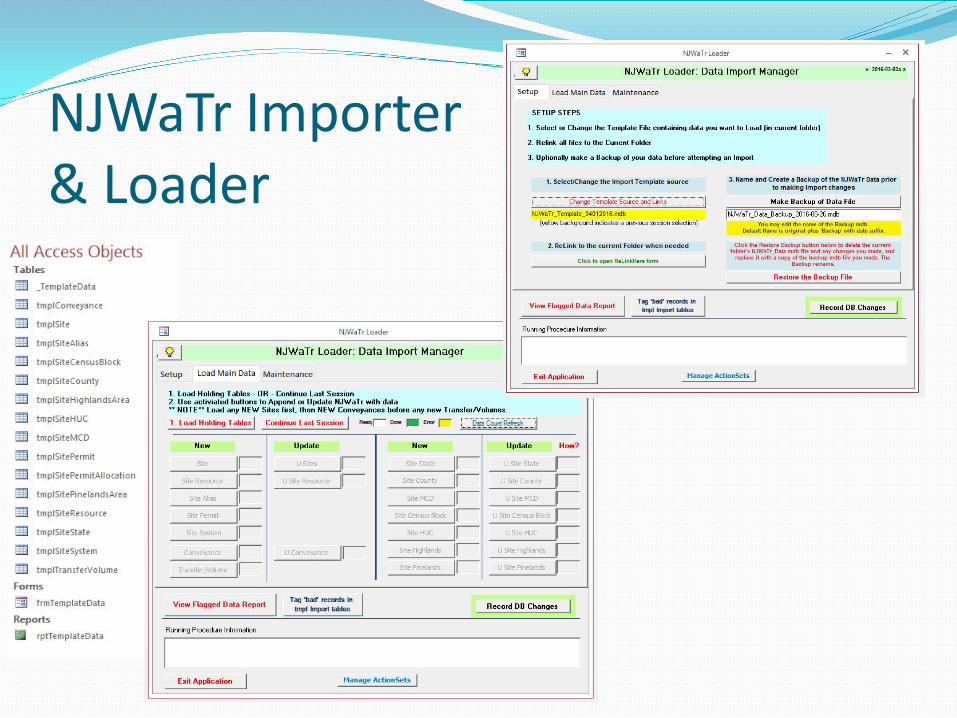
NJWaTr Importer & Loader

NJWaTr Relational Database Schematic
76 Tables, 95 relationships, 319 fields, >6,500 lookup values

NJWaTr DataWarehouse

NJWaTr DataMart
Publically available data sets: http://www.njgeology.org/geodata/dgs10-3.htm

NJWaTr Exporter

NJWaTr Geodatabase

Examples of NJWaTr Use USGS Work
Groundwater models 5-yr confined aquifer synoptics Regional studies: Highlands/Pinelands/Passaic-
Hackensack Watershed studies National WATERSMART Program: DRB Pilot Study Area SWUDS 2010 Data AWUDS National 5-yr compilation Internal (USGS) data requests from researchers doing
regional studies

Full Allocation Estimates by Site All SW and GW withdrawal sites in NJ
2,300 permits with allocation limits
2,800 groups with allocation limits
6,300 sites with estimated allocations of 7,800 mgd SW – 1,000 sites with est. alloc. of 6,700 mgd GW – 5,300 sites with est. alloc. of 1,100 mgd
5,500 sites with withdrawals of 2,500 mgd SW – 850 sites with withdrawals of 2,000 mgd GW – 4,650 sites with withdrawals of 500 mgd

Examples of NJWaTr Use NJDEP Work
Statewide Water Supply Master Plan Stream low-flow margin method for water availability Statewide, county, and HUC water use summaries Water availability/water budgets Data inquiries

Simplified Statewide Data http://www.njgeology.org/enviroed/infocirc/withdrawals2009.pdf

Water Availability http://www.njgeology.org/geodata/dgs14-1.htm

How do withdrawals vary by water region?
Key:
Upper Delaware
Lower Delaware
Passaic
Atlantic Coastal
Raritan
Excludes power generation
Ag/Irrigation
Com/Ind/Min
PotableSupply

Where do the withdrawals come from?
Key: GW,Conf.
SW
GW,Unconf.
Excludes power generation
12%
60%
28%
Statewide Averages
3 Primary Sources of Water 1. Unconfined ground water
and non-regulated surface water (statewide)
2. Confined aquifers (coastal plain)
3. Reservoirs/safe yield and regulated surface water

What is Consumptive Use? That part of a water withdrawal that is evaporated,
transpired, incorporated into products or crops, consumed by people or livestock, or otherwise removed from the immediate environment
Total use = consumptive use + non-consumptive use In most cases it is estimated using monthly
coefficients; e.g. 90% of total ag irrigation is consumptive in August

Total vs Consumptive
-
100,000
200,000
300,000
400,000
500,000
600,000
Total Use Consumptive Use
Mil
lion
s of
gal
lons
per
yea
r
Ag/Irrigation
Com/Ind/Min
Potable Supply
83%
10% 7%
Total Use
Potable Supply
Com/Ind/Min
Ag/Irrigation
61% 7%
32%
Consumptive Use
Potable Supply
Com/Ind/Min
Ag/Irrigation
15%

Monthly Consumptive vs Non-Consumptive
0
10,000
20,000
30,000
40,000
50,000
60,000
Jan Feb Mar Apr May Jun Jul Aug Sep Oct Nov Dec
mil
lion
s of
gal
lons
per
mon
th
Com/Ind/Min Con
Ag/Irr Con
Potable Supply Con
Com/Ind/Min
Ag/Irr
Potable Supply

Per Capita Potable Water Use Total Use Per Capita • Increasing efficiency of
industries • Loss of major water using
industries • Indoor plumbing code
efficiencies
Consumptive Use Per Capita • Migration to suburbs (with
yards) • Lawn/landscape irrigation • New development grow-in
periods

Suburban vs Urban Potable Use
0
1,000
2,000
3,000
4,000
5,000
Jan-
01
May
-01
Sep-
01
Jan-
02
May
-02
Sep-
02
Jan-
03
May
-03
Sep-
03
Jan-
04
May
-04
Sep-
04
Jan-
05
May
-05
Sep-
05
Jan-
06
May
-06
Sep-
06
Jan-
07
May
-07
Sep-
07
Jan-
08
May
-08
Sep-
08
Jan-
09
May
-09
Sep-
09
Jan-
10
May
-10
Sep-
10
Jan-
11
May
-11
Sep-
11
Suburban Water System
Non-Consumptive Use Consumptive Use
0500
1,0001,5002,0002,500
Jan-
01
May
-01
Sep-
01
Jan-
02
May
-02
Sep-
02
Jan-
03
May
-03
Sep-
03
Jan-
04
May
-04
Sep-
04
Jan-
05
May
-05
Sep-
05
Jan-
06
May
-06
Sep-
06
Jan-
07
May
-07
Sep-
07
Jan-
08
May
-08
Sep-
08
Jan-
09
May
-09
Sep-
09
Jan-
10
May
-10
Sep-
10
Jan-
11
May
-11
Sep-
11
Urban Water System
Non-Consumptive Consumptive No ratio of baseline to peak …
1.1 – 1.2 baseline to peak ratio

Major Purveyor (with year-round and seasonal vacation residents)
0
200
400
600
800
1,000
1,200
1,400
1,600
1,800
2,000
Jan-01 Jan-02 Jan-03 Jan-04 Jan-05 Jan-06 Jan-07 Jan-08 Jan-09 Jan-10 Jan-11
mil
lion
s of
gal
lons
per
mon
th
1.4 – 1.8 baseline to peak ratio

Major Purveyors (with large summer increases in population)
0
50
100
150
200
250
300
350
400
Jan-01 Jan-02 Jan-03 Jan-04 Jan-05 Jan-06 Jan-07 Jan-08 Jan-09 Jan-10 Jan-11
mil
lion
s of
gal
lons
per
mon
th
2.5 – 4+ baseline to peak ratio

Sanitary Sewer Discharge

Water Tracking with NJWaTr
$$
$
$
$
$
$
$$
$$
$
$
$
$
$$
$
$
$$
4 0 4
Water imports
Sewer collections
Sewer discharges
Water withdrawals
One water purveyor with its own sources and imports and multiple sewer collection systems
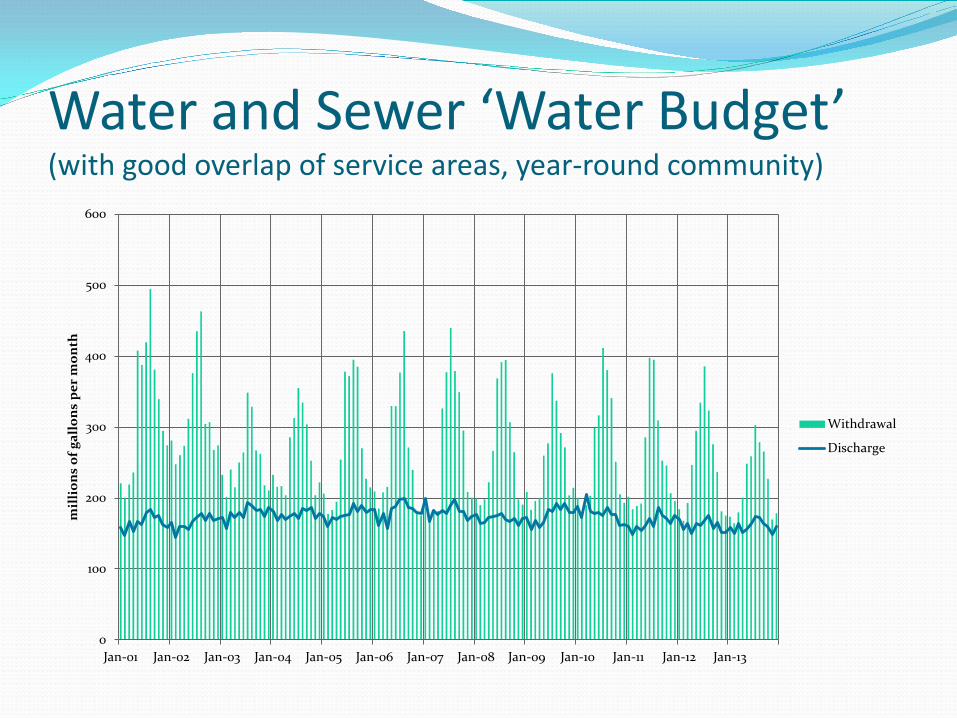
Water and Sewer ‘Water Budget’ (with good overlap of service areas, year-round community)
0
100
200
300
400
500
600
Jan-01 Jan-02 Jan-03 Jan-04 Jan-05 Jan-06 Jan-07 Jan-08 Jan-09 Jan-10 Jan-11 Jan-12 Jan-13
mil
lion
s of
gal
lons
per
mon
th
Withdrawal
Discharge

Water and Sewer ‘Water Budget’ (for summer vacation county)
0
100
200
300
400
500
600
700
800
900
Jan-01 Jan-02 Jan-03 Jan-04 Jan-05 Jan-06 Jan-07 Jan-08 Jan-09
mil
lion
s of
gal
lons
per
mon
th
Confined Withdrawals Unconfined Withdrawals Sewer Returns

Water Balance for the North Branch Rancocas River water-table aquifer system
-200
-100
0
100
200
300
400
500
600
Jan-
90
Jan-
91
Jan-
92
Jan-
93
Jan-
94
Jan-
95
Jan-
96
Jan-
97
Jan-
98
Jan-
99
mill
ion
gallo
ns p
er m
onth
Unconfined GW and SW Withdrawals Returns (non-consumptive, confined aquifer, sewer) Net Impact

Historic Data: (to be added)
0
100,000
200,000
300,000
400,000
500,000
600,000
700,000
800,000
1900
1903
1906
1909 1912
1915
1918
1921
1924
1927
1930
1933
1936
1939
1942
1945
1948 1951
1954
1957
1960
1963
1966
1969
1972
1975
1978
1981
1984
1987
1990
1993
1996
1999
2002
2005
2008 2011
KMAN
NJWaTr
SW Potable
GW Model

Additional Resources

Thank you for listening
Jennifer Shourds USGS NJWSC Water Use Specialist 609-406-3819 [email protected]
Steven Domber Acting Section Chief, Water Supply Planning & Modeling, NJGWS New Jersey Department of Environmental Protection 609-984-6587 [email protected]
