stern-gerlach experimentthe object of the stern-gerlach experiment is to establish the directional...
TRANSCRIPT

Page 1 of 18
STERN-GERLACH EXPERIMENT
INTRODUCTION
A beam of potassium atoms generated in a hot furnace travels along a
specific path in a magnetic two-wire field. Because of the magnetic moment
of the potassium atoms, the nonhomogeneity of the field applies a force at
right angles to the direction of their motion. The potassium atoms are
thereby deflected from their path.
By measuring the density of the beam of particles in a plane of detection
lying behind the magnetic field, it is possible to draw conclusions as to
the magnitude and direction of the magnetic moment of the potassium atoms.
THEORY
The potassium atoms forming the atomic beam have one outer electron in the
ground state 4s. The orbital angular momentum is equal to zero. The
magnetic moment of the potassium atom due to this electron is therefore
attributable only to its spin S.
S.g2m
eμ s
0 .
If one considers the component Sz of the spin in a given z–direction, the
system has two different possible orientations, characterized by the
quantum numbers
21
m s .
The z-component of spin takes the eigenvalue
sz mS .
The associated magnetic moment in the z-direction take the value
m.mm2
eB
0z

Page 2 of 18
with the Bohr magneton
224
0B mA10248.9
m2
e
and
ss g.mm .
The literature value of the g-factor is
0024.2gs . (2)
Hence,
10012.1m . (3)
The object of the Stern-Gerlach experiment is to establish the directional
quantization of the electron spin. Furthermore, according to which quantity
is taken as known, the value of z; B m or gs can be determined.
The forces acting on the potassium atom are attributable to their magnetic
moment and arise when the field is inhomogeneous:
z
Bm
z
BF Bzz
. (4)
To produce an inhomogeneous magnetic field which simulates the field
produced by two parallel wires separated by 2a, the specially shaped pole-
pieces (made of magnetic soft iron) shown in Fig. 1 is used.
Fig. 1 Two wire field.
2a

Page 3 of 18
The following expression applies to the two-wire field
a
B
z
B
968.0
1
(5)
where the magnetic introduction B against the excitation current i can be
calibrated. (See Appendix.)
The velocity of the potassium atoms entering the magnetic field can be
considered with sufficient accuracy as being along the same direction
(x-direction) before entry into the field. The following transit in the
x-direction should be borne in mind (Fig. 2): a time
L
t
for passing through the magnetic field of length L and a time
l
t
for the distance l from the point of entry into the magnetic field to the
point of entry into the plane of the detector.
Because of the effectively constant force in the z-direction, the potassium
atoms of mass M acquire, by virtue of the inhomogeneity of the field, a
momentum
z
BLmLFtFzM Bzz
.
.
Fig. 2 Particle track between magnetic analyzer and detection plane.
B
z
l L
-D
+D
x
u
B
Page 4 of 18
It follows that the point of impact u of a potassium atom of velocity in
the x-direction, at a given field inhomogeneity, is
...z)
L
2
11(z)tt(ztz
2
1zu
ll
where
tz2
1 .
is the path element covered by a potassium atom immediately after passing
through the magnetic field in the z-direction. Hence, there is the
following fundamental relationship between the deflection u, the particle
velocity and the field inhomogeneity B/z.
z
Bm)
L
2
11(
M
L.zu B2
ll
(6)
where 0zu for m = -1
and 0zu for m = +1
It will be noticed that the faster particles are deflected less from their
path than the slower ones.
In order to produce a beam of potassium atoms of higher average particle
velocity, a furnace heated to a defined temperature T is used. In the
furnace, the evaporated potassium atoms are sufficiently numerous to
acquire a maxwellian velocity distribution, i.e., the number of atoms with
a velocity between and + d in each elementary volume dV of the furnace
is proportional to
de 2.kT2
2M
.
This proportionality applies also when one considers only the velocity
directions lying within a solid angle d which is determined at x = 0 by
tracks of width dz. The atoms which emerge from the opening in the furnace,
and which have entered the magnetic field between z and z + dz, with a

Page 5 of 18
velocity between and + d, obviously satisfy a velocity function
involving the third power of (Fig. 3)
de2
dzd.e)z(nd
3
0
kT2
2M
3kT2
2M
m2 (7)
Thus, only those potassium atoms traverse the strip dz in time dt with
velocity at a later point in time corresponding to the transit time,
which come from volume element dV existing in a region at depth dt behind
the opening in the furnace. The volume of this region is proportional to
and contributes likewise to the distribution function. Indexing with m
takes account of the two possible magnetic moments of the potassium atoms.
On symmetry grounds it can be assumed that both directional orientations
are equally probable.
The function m(z) represents the spatial profile of the numbers of
particles, for particles of orientation m at the position x = 0. It arises
through limitation of the atomic beam by appropriate systems of diaphragms.
The function m(z) differs from zero within a rectangular area of width D
(beam enclosure).
The object of the following calculation is to calculate the particle
current density I in the measuring plane x = 0, as a function of the
dt
dV
dV
d
d
z
dz
x
Fig. 3 Geometrical relationships for deriving the distribution function depending on and z.

Page 6 of 18
position u, from the distribution which depends on and z, since this
density is proportional to the signal at the detector. All potassium atoms
entering the magnetic field at a height of z are spread by an amount du at
position u on account of their differences in velocity d. For equal values
of z, therefore, the following conversion from to u applies:
duu4
1d
43
.
From equation (6) for the deflection of the path as a function of , one
obtains by substitution and differentiation:
3
2
B3
zu
du
M2
z
B
I
L
2
11L.I
2
1d
In addition,
zukT2
z
B
I
L
2
11L.I
kT2
MB2
If, to abbreviate, we now let
kT2
z
B
I
L
2
11L.I
qB
(8)
and
deM16
z
B
I
L
2
11L.I
n
3
0
KT2
2M2
2
B
0
we obtain from (7) the distribution
dzzu
due)z(nnd
3zu
q
m02
. (9)

Page 7 of 18
We now integrate with respect to z and sum over the possible orientations
m, and so derive the desired particle current density at position u:
3zu
qD
0zuD
210m
D
D
2
zu
dze)z(n
du
nd
I
3
D
0zuD
zu
q
210zu
dze)z(n
By reason of the equivalence to the particle profile of the orientations
m = -1/2 and m = +1/2,
)z(I)z()z( 02121
and hence
3zu
qD
D00
zu
dze)z(InI
(10)
For a vanishing magnetic field or a vanishing inhomogeneity u z and is
independent of . In this case, the particle current density in the
measuring plane is defined as I0(u).
The course of the particle current density I(u) depends, among other
factor, on how I0(u) is formed. As the simplest approximation, one can
start from a beam enclosure of any desired narrowness:
)z(DI2)z(I 0)0(
0 (11)
We then get
3
D
D
zu
q
00)0(
0zu
dze)z(IDn2)u(I
and therefore
3
u
q
00)0(
0u
eIDn2)u(I
. (12)

Page 8 of 18
The particle current density I(0)
(u) for narrow beam profiles is therefore
proportional to the width 2D determined by the diaphragm system. The
position ue of the intensity maximum is found by differentiating with
regard to u:
u
q
500
)0(e
u
u3qIDn2
du
)u(dI .
From
0)u(du
)u(dI )0(e
)0( (13)
we obtain the determining equation for )0(eu :
kT6
z
B
I
L
2
11L.I
q3
1u
B)0(
e
. (14)
The distance of the maxima from the x-axis (beam deflection) therefore
increase in proportion to the field inhomogeneity.
A better compatibility of the calculation with the experiment is achieved
by regarding the beam enclosure with width 2D as being infinitely long, and
by describing the beam profile as two steep straight lines with a parabolic
apex (Fig. 4).
DzpzD
pzpp
z
2
1p
2
1D
pzDzD
i)z(I2
00
Dzp1
pzpp
zpzD1
idz
dI0
0 (15)
Dzp0
pzpp
1pzD0
idz
Id02
02

Page 9 of 18
Fig. 4 Mathematical assumption of particle current density with a vanishingly-small magnetic field.
In this model, I0(z) is regarded as being twice differentiable. The
particle current density I(u) based on this supposition has values,
dependent on the inhomogeneity of the magnetic field and hence on q, which
have maxima at positions ue(q), which differ to a greater or lesser extent
from the positions 3q)0(
eu resulting from the approximation assuming
an infinitesimally narrow beam enclosure.
It can be shown that
e22
44
e u
1.
p3
1D
p5
1D
u3q
e
e u
cu3 (16)
where 22
44
p3
1D
p5
1D
c
For sufficiently large inhomogeneous fields
q
c
3
que .
Using equations (8) and (16), the Bohr magneton B is given by:
z
B
u
cu3
.
I
L
2
11L.I
kT2 ee
B
(17)
-D -p +p +Dz
I0(z)
Page 10 of 18
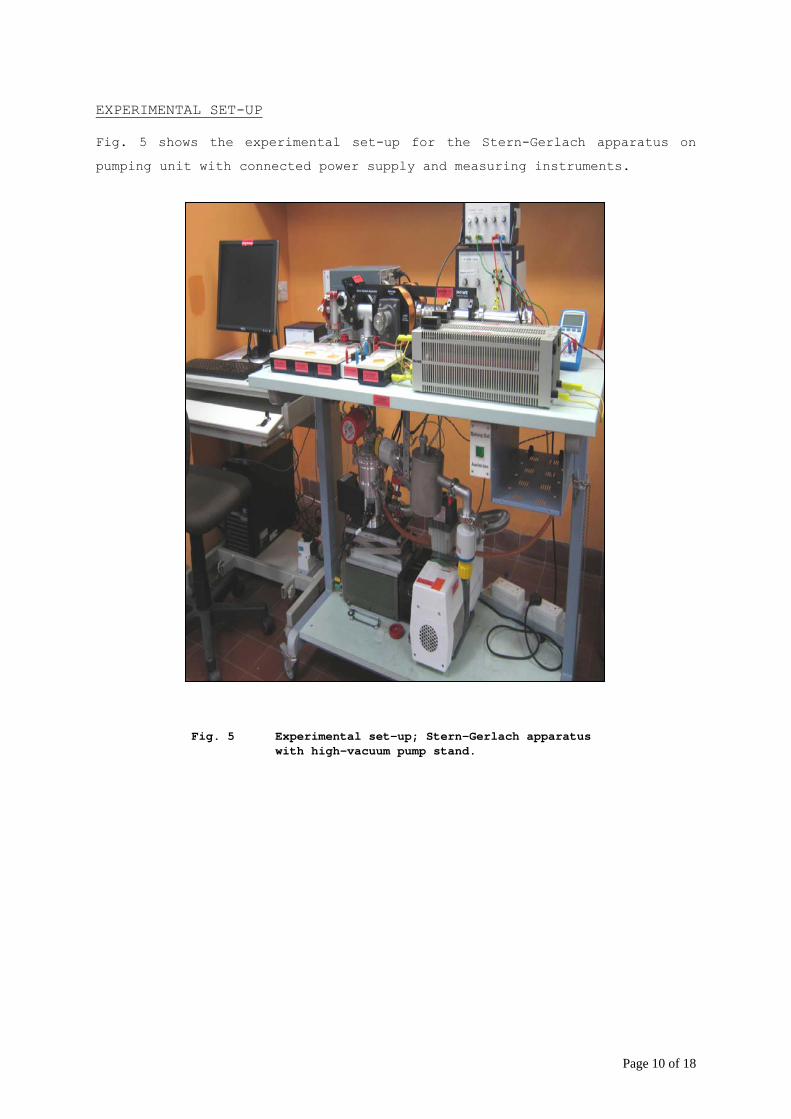
EXPERIMENTAL SET-UP
Fig. 5 shows the experimental set-up for the Stern-Gerlach apparatus on
pumping unit with connected power supply and measuring instruments.
Fig. 5 Experimental set-up; Stern-Gerlach apparatus with high-vacuum pump stand.

Page 11 of 18
The schematic arrangement of the set-up without adjusting device is shown
in Fig. 6.
Fig. 6 Schematic arrangement of the experimental set-up
(without adjusting devices).
A beam of potassium is produced by heating the metal in a small electric
furnace and then defined as a thin beam by means of slits. The magnetic
deflecting field produced between the specially shaped pole-pieces of an
electromagnet simulates a two-wire field.
The detector is a surface ionization detector; it can be swivelled by means
of a level system and enables the intensity distribution in the beam to be
measured electrically with good sensitivity. The vacuum container is
provided with bellows.
Heating
Bellows Detector
Heating
V
NW 40 KF Flange for vacuum pump with vacuum gauge
Thermocouple0 … 10 mVi
Table-top
A
Magnet 0 … 1500 Aw Poles: 115 mm above table-top Pole diameter: 39 mm Pole clearance: approx. 50 mm adjustable
Furnace

Page 12 of 18
The principle and arrangement of the adjusting device are shown in Fig. 7.
Fig. 7 Principle and arrangement of the adjusting device.
View from the detector the beam always emanates from the center of magnet.
In order to scan the intensity of beam cross-section, the detector has to
be guided on a circular curve, the center of which is located at the center
of the magnet. This is achieved by means of a level guide. Since there is
no reference point available near the detector for measuring the angle of
adjustment, the level is extended beyond its pivot in the direction of the
beam source where it is adjusted with the aid of a spindle; the latter is
provided with a scale having 100 graduations. One revolution u of the
spindle corresponds to an adjusting path SS of 1 mm (10 revolutions
possible).
The leverage is 1:1.8, i.e. one revolution of the spindle scale
corresponding to a displacement SD = 1.8 mm of the detector.
SD = 1.8 mm / rev SS = 1 mm / rev 235 mm 420 mm
Bearing in center of magnet
Reference flange Connection
flange Bearing fulcrum points
Adjustment flanges
Bellows

Page 13 of 18
The electrical circuit in the Stern-Gerlach experiment is shown in Fig. 8.
Fig. 8 Electrical circuit.
Procedure
1. Evacuating the Stern-Gerlach apparatus and bringing the furnace to the
desired temperature (~180 C) take several hours. Ask the technologist
in charge of the experiment to prepare the apparatus in the morning so
that you can perform the experiment in the afternoon, on the same day.
2. Before carrying out the measurement, demagnetize the electromagnet.
This is done by reducing the excitation current in steps by small
amounts, reversing the polarity at each step using the commuting switch
in the circuit shown in Fig. 8.
Atomic beam fusuale
Magn. Analyzer
Detector
Measuring amplifier
Stern-Gerlach Apparatus
DC Power supply
0 … 1,5 V~/5 A
AC Power supply Matching transformer
Thermocouple
CuNi Fe
0 … 1 A
0 … 15 V~
1 V—
0 … 50 V— 10
max. 1 A~
10
0,5 A~

Page 14 of 18
3. Using the following settings,
Furnace temperature: ~180 C Detector voltage: 11 V
run the Step Motor Software to obtain the graph of the detector ionization current iI as a function of detector displacement Ue.
4. Software procedures
I. Measurement
i. Open the “Measure” program
ii. Click the “Gauge” menu. Confirm that “Step motor” has been selected
iii. Go to “file” menu and click “Open measurement” to display the following window
Note: Do not reconfigure the set values for all the parameters

Page 15 of 18
iv. Proceed to open the next window by clicking “next”
v. Input the furnace temperature and magnet excitation current in the “Title of measurement” box (e.g. 180deg 0.4A)for easy identification
vi. Adjust the magnet excitation current to 0.4 A as registered on the ammeter
vii. Click “start measurement”. It will take about 2 minutes to complete the scanning by the step motor. The graph will be plotted on the top left screen
viii. Upon completion of the plot, click “at start position” to reset to starting position
ix. Click “end series of measurement”
x. The graph plotted will be displayed in full screen view as shown below.

Page 16 of 18
I. ANALYSIS
i. Go to “Analysis” menu, click “smooth” and check “into new measurement” box
ii. Next click “smooth”
The resulting graph will be as shown.
iii. At the main menu, click the “+” icon and drag an area that covers the first peak
iv. Go to “Analysis” menu, click “show extreme” and check “visualize result”
The 1st peak will be labelled on the plot as shown below.
v. Repeat steps iii & iv for the second peak

Page 17 of 18
vi. Note the x position (in mm) of both peaks and calculate the distance between them
vii. Multiply the measured distance by 1/3 to obtain the actual ionization current peaks 2u.
viii. Save the graph using a filename for easy identification such as ”180deg 0.4A_date”
ix. Repeat the experiment with magnet excitation current of
0.5A, 0.6 A, 0.7 A, 0.8 A, 0.9 A
5. For each magnet excitation current I, determine
i) the magnet induction B from the calibration curve given in the
Appendix.
ii) zB
using eq.(5) with a = 2.5 mm
iii) separation of ionization current peaks 2u from the plot, from
which obtain ue.
iv) e
e u
cu3 using eq (16) with D = 0.86 mm and p = 0.36 mm.
6. Tabulate i, B, zB
, 2u, ue, e
e u
cu3
7. Plot z
B
(T/m) vs e
e u
cu3 (mm) and determine its slope.
8. Using eq (17) calculate the Bohr magneton B with I = 0.455 m,
L = 7 cm, T = 273+160 = 433k (for furnace temperature = 180 C) and
slope obtained above.

Page 18 of 18
APPENDIX