stereo vision-based forward obstacle detectionweb.yonsei.ac.kr/hgjung/ho gi jung...
TRANSCRIPT

International Journal of Automotive Technology, Vol. 8, No. 4, pp. 493−504 (2007) Copyright © 2007 KSAE1229−9138/2007/035−12
493
STEREO VISION-BASED FORWARD OBSTACLE DETECTION
H. G. JUNG1),2)*, Y. H. LEE1), B. J. KIM1), P. J. YOON1) and J. H. KIM2)
1)Mando Global R&D H.Q., 413-5 Gomae-dong, Giheung-gu, Yongin-si, Gyeonggi 449-901, Korea2)School of Electrical and Electronic Engineering, Yonsei University, Seoul 120-749, Korea
(Received 12 January 2006; Revised 8 June 2007)
ABSTRACT−This paper proposes a stereo vision-based forward obstacle detection and distance measurement method. Ingeneral, stereo vision-based obstacle detection methods in automotive applications can be classified into two categories:IPM (Inverse Perspective Mapping)-based and disparity histogram-based. The existing disparity histogram-based methodwas developed for stop-and-go applications. The proposed method extends the scope of the disparity histogram-basedmethod to highway applications by 1) replacing the fixed rectangular ROI (Region Of Interest) with the traveling lane-based ROI, and 2) replacing the peak detection with a constant threshold with peak detection using the threshold-line andpeakness evaluation. In order to increase the true positive rate while decreasing the false positive rate, multiple candidatepeaks were generated and then verified by the edge feature correlation method. By testing the proposed method withimages captured on the highway, it was shown that the proposed method was able to overcome problems in previousimplementations while being applied successfully to highway collision warning/avoidance conditions. In addition,comparisons with laser radar showed that vision sensors with a wider FOV (Field Of View) provided faster responses tocutting-in vehicles. Finally, we integrated the proposed method into a longitudinal collision avoidance system.Experimental results showed that activated braking by risk assessment using the state of the ego-vehicle and measuringthe distance to upcoming obstacles could successfully prevent collisions.
KEY WORDS : Active safety vehicle, Obstacle detection, Stereo vision system, Disparity histogram
1. INTRODUCTION
Collision Avoidance Systems in general consist of fourcomponents: environment recognition, electronically con-trolled vehicles, collision avoidance controllers, and HMIs(Human Machine Interfaces) (Blum and Escandarian,2002). Environment recognition refers to fixed environ-ment information such as roadway geometry, weatherconditions, and geometrical locations, as well as targetvehicle information provided to collision avoidance con-trollers. Electronically controlled vehicles refer to motionsensor outputs used for the estimation of vehicle states,such as wheel speed sensors, steering angle sensors, yaw-rate sensors, and acceleration sensors. At the same time,electronically-controlled vehicles implement steering,braking, and acceleration commands transferred via theCAN (Controller Area Network) using X-by-Wire systems.Collision avoidance controllers fulfill risk assessment,path planning for collision avoidance, and commandgeneration/transmission for path tracking. HMIs receivedriver intension or operation commands and informdrivers of risk assessment results and control situations.
Vehicle detection methods can be categorized as eitheror passive. Active sensor-based methods include milli-meter wave radar-based (Park et al., 2003), Lidar-based(Light Detection and Ranging) (Wang et al., 2003;Hancock et al., 1997) and acoustic-based (Chellappa etal., 2004) methods. Optical sensors, such as normalcameras, are usually referred to as passive sensors be-cause they acquire data in a non-intrusive way. Generally,passive sensors offer some advantages over active sensors:low cost, wide spatial coverage, high spatial resolution,fast scanning speed, and no interference that might becaused when a large number of vehicles move simultane-ously in the same direction using the same type of sensor(Herbert, 2000).
Sun’s recent review of vision-based vehicle detectioneffectively shows the state of the art in terms of thepassive sensor-based method (Sun et al., 2006). In thisresearch, the vehicle detection procedure was separatedinto two steps: HG (Hypothesis Generation) and HV(Hypothesis Verification).
Approaches to the HG step can be classified mainlyinto three categories: knowledge-based, motion-based,and stereo-based approaches. The objective of the HGstep is to quickly find candidate vehicle locations in an*Corresponding author. e-mail: [email protected]

494 H. G. JUNG et al.
image. Knowledge-based methods employ a priori know-ledge to estimate vehicle locations in an image usingtechniques such as symmetry, color, shadow, corners,texture, vehicle light, and vertical/horizontal edges. Motion-based methods employ relative motion via the calculationof optical flow (Giachetti et al., 1998). There are twotypes of stereo-based methods: disparity map-based andIPM (Inverse Perspective Mapping)-based methods.
The input to the HV step is the set of hypothesizedlocations obtained during the HG step. Approaches to theHV step can be classified as template-based or appear-ance-based approaches. Template-based approaches usepredefined patterns and perform correlations between thegiven image and the template (Ito et al., 1995). Appear-ance-based approaches are further divided into a two-class pattern classification problem: vehicles versus non-vehicles. Appearance-based approaches discover thecharacteristics of the appearance of any given vehicle byusing a set of training images to capture the variability ofthe vehicle class (Sun et al., 2005).
The major interest of this paper is stereo vision-basedvehicle detection for longitudinal collision warning/avoidance via braking. Although dense stereo matchingalgorithms are progressing continuously and are able torecognize the shapes and judge the distances of objectsprecisely and minutely, they are not useful in automotivecollision warning/avoidance because the developmentdirection is not aimed at real-time computation and targetselection (Brown et al., 2003; Scharstein and Szeliski,2002; Kastrinaki et al., 2003). This may be a reason whySun’s review mentions only two kinds of stereo vision-based methods.
The IPM-based method generates two virtual imagesrespectively for left and right images by assuming thatevery object is located on a flat ground plane. Then, thedifference between the remapped left and right imagesreveals the location of obstacles, because anything locat-ed above the road makes large clusters of nonzero pixelsin the difference image (Bertozzi and Broggi, 1998).Because of the flat ground plane assumption, the perfor-mance of the IPM-based method is degraded severelywhen the tilt angle of the camera changes on unevenroadways.
The difference between corresponding pixels in the leftand right images is called disparity. The disparities of allthe image points form the disparity-map. Once the dis-parity map is available, all the pixels within the depth ofinterest, according to a disparity interval, are determinedand accumulated in a disparity histogram. If an obstacleis present within the depth of interest, then a peak pointwill occur at the corresponding histogram bin (Frankeand Kutzbch, 1996). Because Franke’s implementationwas developed for stop-and-go applications, it used afixed rectangular ROI and peak detection by constant
threshold and then simply recognized the closest object,i.e. the largest disparity, as the control target. This ap-proach could not be applied directly to highway collisionwarning/avoidance because multiple preceding vehiclesexist over a wide distance range.
This paper proposes a way to measure the distancebetween the ego-vehicle and target vehicles. The HG stepof this paper consists of ROI establishment usingrecognized lane information, edge feature-based stereomatching, disparity histogram generation, peak detectionin the disparity histogram using the threshold-line, andcandidate validation by peakness evaluation. The HVstep of this paper verifies candidate locations by using thecorrelation of the left and right edge images with thecandidate disparity, which is similar to the templatematching-based HV. The main contribution of this paperis extending the disparity map-based method to highwayapplications by establishing the ROI using recognizedlane information, and by compensating for the variationof peak height using the threshold-line. All of the adoptedoperations proved to be suitable for real-time operationsand parallel implementations by VHDL (Very-high-speed-integrated-circuit Hardware Description Language).Experimental results showed that the proposed methodwas able to successfully measure the distance to thepreceding vehicle and was able to overcome curved roadproblems and road surface noise factors. Thanks to thewider FOV (Field Of View) of the camera, the vision-based method detected cutting-in vehicles faster than alaser radar. Experiments using a test vehicle with the ESP(Electronic Stability Program) showed that the longitudi-nal collision avoidance system (incorporating the propo-sed method) was able to successfully stop vehicles beforecollisions.
2. STEREO VISION-BASED LONGITUDINAL COLLISION AVOIDANCE SYSTEM
This system consists of five main components: a stereovision-based obstacle distance measurement, a dynamicmodel of the ego-vehicle, the collision avoidance algorithm,active braking, and the HMI (Human Machine Interface).This dynamic model of the ego-vehicle estimates requir-ed state variables for the ego-vehicle by utilizing sensorsalready installed on the vehicle such as wheel speed,lateral acceleration, yaw-rate, and steering angle. Thecollision avoidance algorithm measures the risk of colli-sion using current vehicle states and obstacle states, andthen sends the required braking commands to activebraking systems via CAN in order to avoid upcomingcollisions. The active braking system should be able togenerate the required braking force without requiring thedriver to push the pedal. In our system, the Mando MGH-series ESP was used as an active braking actuator. Figure

STEREO VISION-BASED FORWARD OBSTACLE DETECTION 495
1 shows the brief architecture of the system.Stereo vision-based obstacle distance measurement
consists of six phases as shown in Figure 2: traveling lanerecognition, ROI establishment, edge feature-based stereomatching, disparity histogram generation, peak detection/validation in the disparity histogram, and edge featurecorrelation-based candidate verification. The proposedmethod is basically an extension or modification ofFranke’s disparity histogram-based obstacle distancemeasurement (Franke and Kutzbch, 1996). It was assum-ed that the preceding vehicle will make a definite peak inthe disparity histogram and peak detection would measurethe distance. In order to make the disparity histogramemphasize the preceding vehicle and ignore potentialdisturbances effectively, the fixed rectangular ROI wasreplaced with an adaptive ROI according to the recogni-zed traveling lane region, i.e. a traveling lane-based ROI.Peak height variation in the disparity histogram withrespect to distance was compensated for by replacingconstant threshold-based peak detection with threshold-
line-based peak detection and peakness evaluation-basedvalidation. In addition, the recognized traveling lane wasutilized by the LKS (Lane Keeping System)/LKAS (LaneKeeping Assist System) controller.
3. ENHANCED DISPARITY HISTOGRAM-BASED HYPOTHESIS GENERATION
3.1. Travelling Lane-Based ROI EstablishmentThe ROI for the following operations was establishedaccording to recognized traveling lanes. In general, ROIestablishment is important in two aspects: to reducecomputational load and to improve the robustness ofsystems. Furthermore, if an established ROI in generalcontains sufficient image portions to detect the distanceto the preceding vehicle, explicit object boundary detec-tion is unnecessary.
McCall’s recent in-depth survey shows the state of theart in vision-based lane detection and tracking techno-logy, which has developed over the last 15 to 20 years(McCall and Trivedi, 2006). Although there have been alot of advanced lane detection technologies, we imple-mented a simple lane detection method similar toBertozzi’s approach (Bertozzi, 1998) to verify the feasi-bility of our main proposal, i.e. traveling lane-based ROIand threshold-line based peak detection in the disparityhistogram.
The implemented lane detection method consists offour steps: inverse perspective warped image generation,lane marking template matching, lane marking grouping,and curve fitting. Some assumptions about the structurednature of road surfaces include: (1) the road/lane textureis consistent; (2) the road/lane width is locally constant;(3) road markings follow strict rules for appearance orplacement; and (4) the road is a flat plane or follows a
Figure 1. The architecture of the longitudinal collisionavoidance system.
Figure 2. Vision system architecture.
Figure 3. Traveling lane-based ROI establishment.

496 H. G. JUNG et al.
strict model for elevation change (McCall and Trivedi,2006). It is noteworthy that the absence of flat ground inlane detection is not as serious as in obstacle distancemeasurement.
An inverse perspective warped image, or bird’s eyeview image, was obtained by using the homographybetween the image plane and the ground plane derivedfrom the camera height and the tilt angle (Batavia et al.,1997). Figure 3(a) is an input image and Figure 3(b) isthe inverse perspective warped image corresponding tothe input image. The inverse perspective warped imageeliminates the effect of perspective distortion. Lane mark-ing template-matching uses the fact that lane markingappears as a black-white-black transition with almost thesame width in the horizontal direction. Lane markinggrouping collects detected lane markings in a verticaldirection, and lane marking groups with proper spacing,i.e. roadway width, can be recognized as left/right lanemarkings. Figure 3(c) shows the detected traveling laneinformation. Left lane marking and right lane markingwere modeled as a quadratic polynomial using LS (LeastSquared error)-based curve fitting. Finally, the recognizedtraveling lane was remapped onto the input image asshown in Figure 3(d). This traveling lane-based ROItakes the place of a fixed rectangular ROI in order to copewith highway applications.
3.2. Edge Feature-Based Stereo MatchingFeature-based stereo matching was employed to con-struct the sparse disparity map of the input images. Inautomotive vision, it is well known that vertical edges aresufficient to detect noticeable objects (Franke and Kutzbch,1996). Consequently, stereo matching using only verticaledges can drastically reduce the computational load. Thefeature-based stereo matching process consisted of pixelclassification and similarity-based matching.
In general, pixel classification investigates the intensitydifferences between a pixel and four directly connectedneighbors so as to assign a class value to the pixel reflect-ing the intensity configuration. It is known that feature-based stereo matching with pixel class is fast and robustto noise (Franke and Kutzbch, 1996; Jung et al., 2006).Equation (1) shows how the relationship between g(x)and g(i) was encoded, where g(x) represents the greyvalue of the investigated pixel and g(i) represents thegray value of the neighboring pixel with index i, whichwas designated as shown in Figure 4(a). Consecutively,Equation (2) and Figure 4(b) show how the class valueClass(x) was constructed by concatenating four d(i)values. A smooth pixel was classified in the zero classand a pixel with more edges was classified in the non-zero class. The threshold T was adaptively modified tomaintain the ratio of non-zero pixels within a reasonablerange, e.g. 5~10%. Figure 5(a) shows the original image
and Figure 5(b) shows the pixel classification results.Only 6.4% of the total pixels were classified in the non-zero class.
(1)
(2)
Stereo matching was performed only on pixels withvertical edges. Furthermore, stereo matching was com-posed of step-by-step test sequences: class comparison,class similarity, color similarity, and maximum similaritydetection (Jung et al., 2006). Only correspondence candi-dates passing the previous test steps were investigated inthe next test step. Assuming that the vertical alignment ofthe stereo rig was calibrated, the search range of a pixelwas limited to a horizontal line with a fixed displace-ment. First, a correspondence test was performed on thepixels in the same class as the investigated pixel. Theclass similarity of the investigated pixel (x, y) withrespect to the disparity d defined by Equation (3) showedhow the candidate pixel was similar to the investigatedpixel in the sense of a 3×3 class window. The colorsimilarity of the investigated pixel (x,y) with respect todisparity d defined by Equation (4) showed how thecandidate pixel was similar to the investigated pixel inthe sense of the 5×5 color window. The total similaritydefined by Equation (5) was the product of the classsimilarity and the color similarity. If the highest total
d i( )=1 if g i( ) g x( )>– T+
2 if g i( ) g x( )<– T–
0 else ⎩⎪⎨⎪⎧
Class x( )= i 0=
3
∑ d i( )<< 2 i⋅( )( )= i 0=
3
∑ 4i d⋅ i( )
Figure 4. Neighboring pixel indexing and class encoding.
Figure 5. Pixel classification results.

STEREO VISION-BASED FORWARD OBSTACLE DETECTION 497
similarity was lower than a certain threshold, the investi-gated pixel failed to find the corresponding point and wasignored. A pixel with disparity d receiving the highesttotal similarity was determined as the correspondingpoint of the investigated pixel.
ClassSimilarity(x, y, d) =
where, f(Classleft, Classright)=
ColorSimilarity(x, y, d) =1− (4)
where, =
Similarity(x, y, d) = (5)
ClassSimilarity(x, y, d)×ColorSimilarity(x, y, d)
3.3. Threshold-Line-Based Peak Detection and PeaknessEvaluation-Based ValidationIn general, the candidate locations of the precedingvehicle are determined by peak detection in a disparityhistogram. Candidate generation consists of three steps:disparity histogram construction, threshold-line-basedpeak detection and peakness evaluation-based validation.
The preceding vehicle is supposed to form a peak inthe disparity histogram (Franke and Kutzbch, 1996). Thedisparity histogram measures how many pixels have acertain disparity value and are implemented as an accu-mulator array. While investigating the disparity value ofall feature pixels within the established ROI, a histogrambin corresponding to each disparity value increases.Figure 7 shows an example of a disparity histogram.
Although the preceding vehicle certainly produces apeak in the disparity histogram, the height of the peakvaries with respect to its disparity value, as shown inFigure 8. This can be naturally derived from the fact thatdistant objects appear small and near objects appearlarge. Because near objects appear big, the probability ofthe occurrence of vertical edge pixels is high. A neardistance means large disparity. Therefore, near objectsare expected to generate high peaks and large disparityvalues. Inversely, because distant objects appear small,the probability of the occurrence of vertical edge pixels islow. Distant objects are expected to generate low peaksand small disparity values.
Peak detection when using a constant threshold cannotreflect the relationship between disparity and peak height.If the constant threshold is too low, the false detectionrate at large disparity values increases. If threshold is settoo high to avoid false detection, the preceding vehiclemight be missed. The threshold-line with respect to dis-parity is expected to overcome the drawback of the con-
13 3×----------
u 1–=
1
∑ v 1–=
1
∑ f Classleft x+u,y+v( ),Classleft x+u+d,y+v( )( )
0, Classleft Classright≠1,Classleft = Classright⎩
⎨⎧
1256--------- ColorSSD x,y,d( )
5 5×-----------------------------------------
ColorSSD x,y,d( )
u= 2–
2
∑ v= 2–
2
∑13---
Rleft x+u,y+v( )−Rright x+u+d,y+v( )( )2+
Gleft x+u,y+v( )−Gright x+u+d,y+v( )( )2+
Bleft x+u,y+v( )−Bright x+u+d,y+v( )( )2⎝ ⎠⎜ ⎟⎜ ⎟⎜ ⎟⎛ ⎞
×
⎩ ⎭⎪ ⎪⎨ ⎬⎪ ⎪⎧ ⎫
Figure 6. Stereo matching result (disparity map).
Figure 7. Disparity histogram.
Figure 8. Threshold line compensating for perspectivedistortion.
498 H. G. JUNG et al.
stant threshold. The threshold-line is a line passingthrough the origin with its slope calibrated empirically.The constant slope of the threshold line is justified byfeature ratio maintenance in the feature detection phase.Peakness evaluation and the HV step will be explainedbelow.
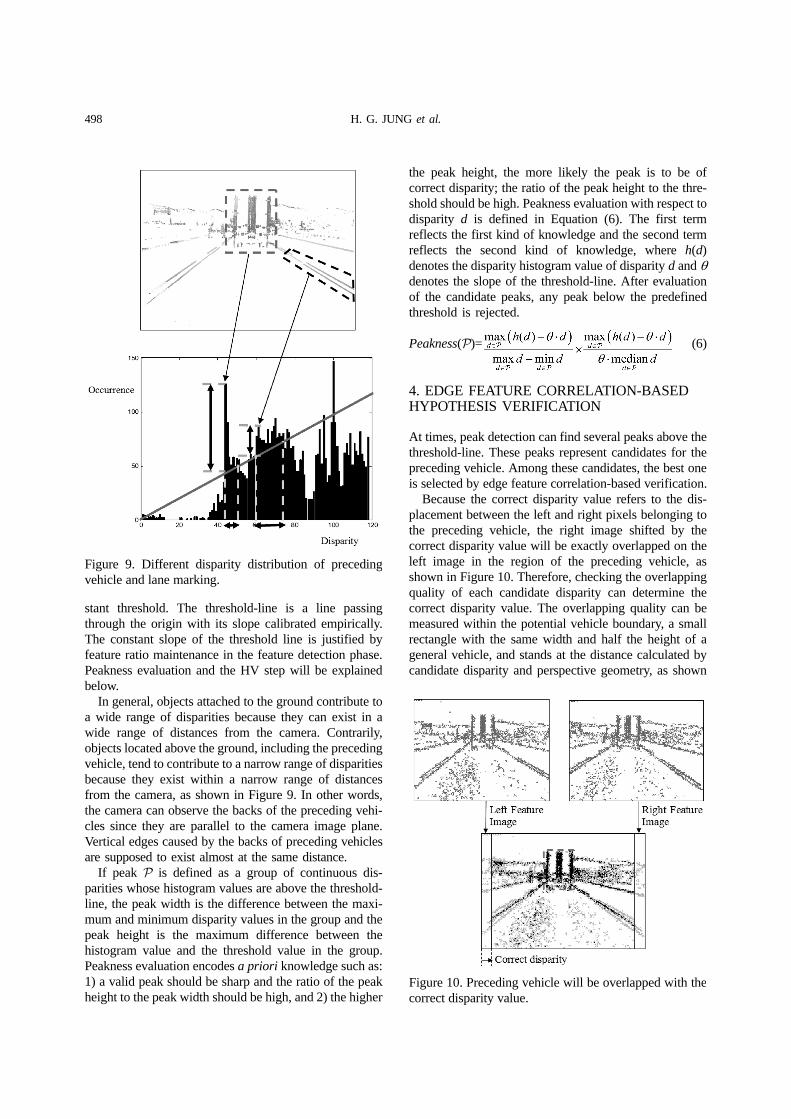
In general, objects attached to the ground contribute toa wide range of disparities because they can exist in awide range of distances from the camera. Contrarily,objects located above the ground, including the precedingvehicle, tend to contribute to a narrow range of disparitiesbecause they exist within a narrow range of distancesfrom the camera, as shown in Figure 9. In other words,the camera can observe the backs of the preceding vehi-cles since they are parallel to the camera image plane.Vertical edges caused by the backs of preceding vehiclesare supposed to exist almost at the same distance.
If peak P is defined as a group of continuous dis-parities whose histogram values are above the threshold-line, the peak width is the difference between the maxi-mum and minimum disparity values in the group and thepeak height is the maximum difference between thehistogram value and the threshold value in the group.Peakness evaluation encodes a priori knowledge such as:1) a valid peak should be sharp and the ratio of the peakheight to the peak width should be high, and 2) the higher
the peak height, the more likely the peak is to be ofcorrect disparity; the ratio of the peak height to the thre-shold should be high. Peakness evaluation with respect todisparity d is defined in Equation (6). The first termreflects the first kind of knowledge and the second termreflects the second kind of knowledge, where h(d)denotes the disparity histogram value of disparity d and θdenotes the slope of the threshold-line. After evaluationof the candidate peaks, any peak below the predefinedthreshold is rejected.
Peakness(P)= (6)
4. EDGE FEATURE CORRELATION-BASED HYPOTHESIS VERIFICATION
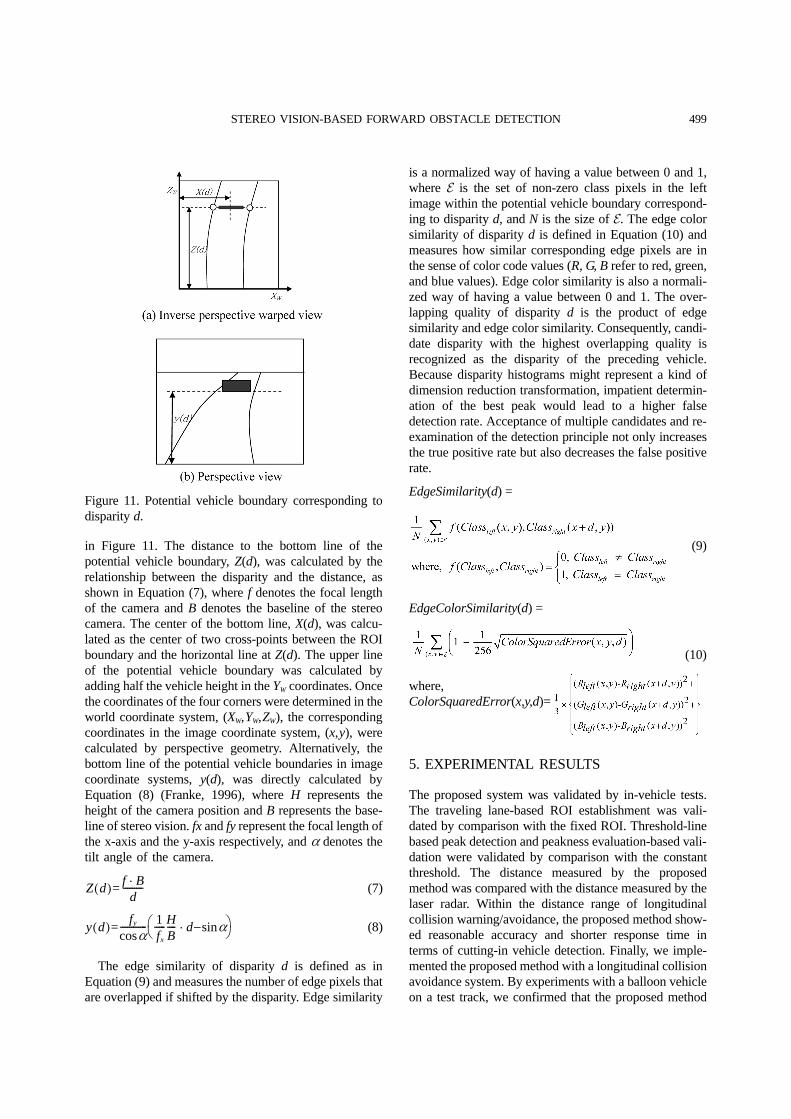
At times, peak detection can find several peaks above thethreshold-line. These peaks represent candidates for thepreceding vehicle. Among these candidates, the best oneis selected by edge feature correlation-based verification.
Because the correct disparity value refers to the dis-placement between the left and right pixels belonging tothe preceding vehicle, the right image shifted by thecorrect disparity value will be exactly overlapped on theleft image in the region of the preceding vehicle, asshown in Figure 10. Therefore, checking the overlappingquality of each candidate disparity can determine thecorrect disparity value. The overlapping quality can bemeasured within the potential vehicle boundary, a smallrectangle with the same width and half the height of ageneral vehicle, and stands at the distance calculated bycandidate disparity and perspective geometry, as shown
Figure 9. Different disparity distribution of precedingvehicle and lane marking.
Figure 10. Preceding vehicle will be overlapped with thecorrect disparity value.
STEREO VISION-BASED FORWARD OBSTACLE DETECTION 499
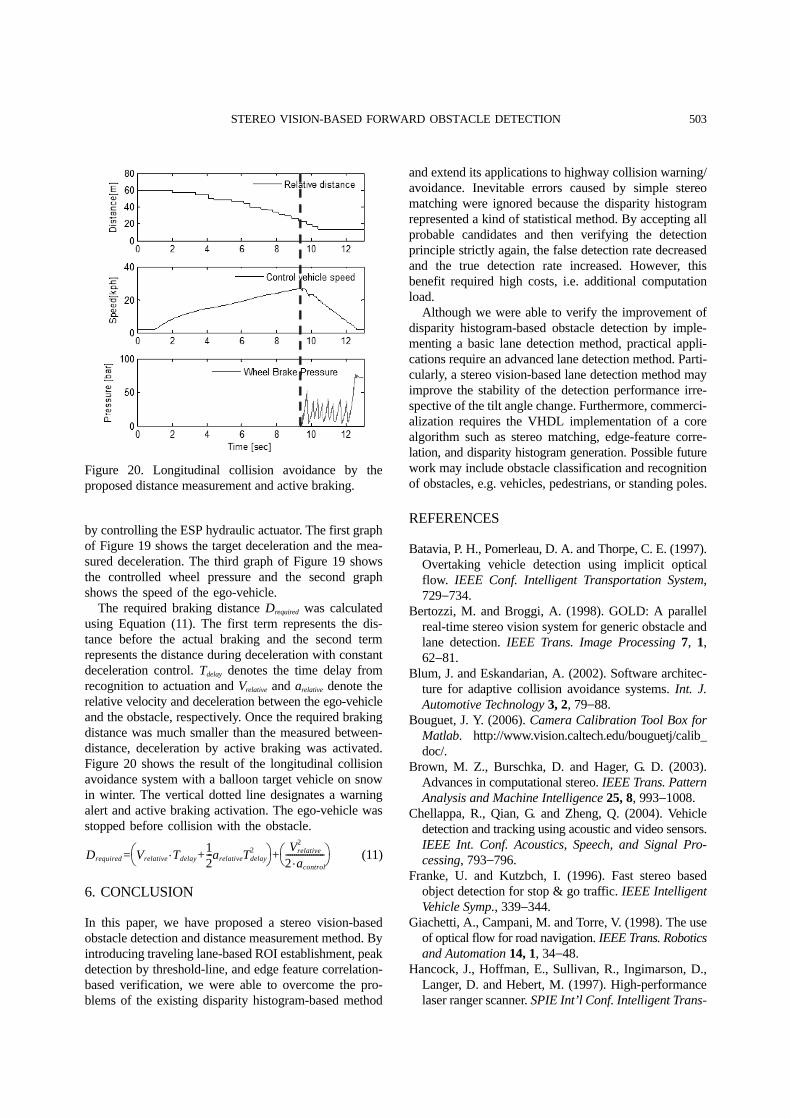
in Figure 11. The distance to the bottom line of thepotential vehicle boundary, Z(d), was calculated by therelationship between the disparity and the distance, asshown in Equation (7), where f denotes the focal lengthof the camera and B denotes the baseline of the stereocamera. The center of the bottom line, X(d), was calcu-lated as the center of two cross-points between the ROIboundary and the horizontal line at Z(d). The upper lineof the potential vehicle boundary was calculated byadding half the vehicle height in the YW coordinates. Oncethe coordinates of the four corners were determined in theworld coordinate system, (XW,YW,ZW), the correspondingcoordinates in the image coordinate system, (x,y), werecalculated by perspective geometry. Alternatively, thebottom line of the potential vehicle boundaries in imagecoordinate systems, y(d), was directly calculated byEquation (8) (Franke, 1996), where H represents theheight of the camera position and B represents the base-line of stereo vision. fx and fy represent the focal length ofthe x-axis and the y-axis respectively, and α denotes thetilt angle of the camera.
(7)
(8)
The edge similarity of disparity d is defined as inEquation (9) and measures the number of edge pixels thatare overlapped if shifted by the disparity. Edge similarity
is a normalized way of having a value between 0 and 1,where E is the set of non-zero class pixels in the leftimage within the potential vehicle boundary correspond-ing to disparity d, and N is the size of E. The edge colorsimilarity of disparity d is defined in Equation (10) andmeasures how similar corresponding edge pixels are inthe sense of color code values (R, G, B refer to red, green,and blue values). Edge color similarity is also a normali-zed way of having a value between 0 and 1. The over-lapping quality of disparity d is the product of edgesimilarity and edge color similarity. Consequently, candi-date disparity with the highest overlapping quality isrecognized as the disparity of the preceding vehicle.Because disparity histograms might represent a kind ofdimension reduction transformation, impatient determin-ation of the best peak would lead to a higher falsedetection rate. Acceptance of multiple candidates and re-examination of the detection principle not only increasesthe true positive rate but also decreases the false positiverate.
EdgeSimilarity(d) =
(9)
EdgeColorSimilarity(d) =
(10)
where,ColorSquaredError(x,y,d)=
5. EXPERIMENTAL RESULTS
The proposed system was validated by in-vehicle tests.The traveling lane-based ROI establishment was vali-dated by comparison with the fixed ROI. Threshold-linebased peak detection and peakness evaluation-based vali-dation were validated by comparison with the constantthreshold. The distance measured by the proposedmethod was compared with the distance measured by thelaser radar. Within the distance range of longitudinalcollision warning/avoidance, the proposed method show-ed reasonable accuracy and shorter response time interms of cutting-in vehicle detection. Finally, we imple-mented the proposed method with a longitudinal collisionavoidance system. By experiments with a balloon vehicleon a test track, we confirmed that the proposed method
Z d( )= f B⋅d
---------
y d( )= fy
cosα------------ 1
fx
-----HB---- d−sinα⋅
⎝ ⎠⎛ ⎞
Figure 11. Potential vehicle boundary corresponding todisparity d.

500 H. G. JUNG et al.
successfully stopped the test vehicle before a collision.
5.1. Experimental SettingsThe stereo camera used in the experiments was madewith two off-the-shelf CMOS cameras and its baseline setto 30 cm in order to be able to detect distant objects.Figure 12(a) shows the stereo camera module that wasinstalled on the windshield of the test vehicle. A Caltechcalibration toolbox was used for stereo camera calibr-ation and rectification (Bouguet, 2006). Images used fortests and evaluations were acquired on the highway.
During the experiments, one laser radar was installed ona test vehicle as shown in Figure 12(b) in order to recordthe reference distance.
5.2. Effect of Traveling Lane-Based ROIDistances of the image sequence were calculated by twodifferent methods: the fixed ROI and the traveling lane-based ROI. Figure 13(a) shows the distances calculatedby the fixed ROI-based method. The distances containedmany large noise factors. Figure 13(b) shows the dis-tances calculated by the traveling lane-based ROI methodand Table 1 shows the comparison of the two cases. Thetraveling lane-based ROI method produced small averageerrors compared to the fixed ROI method.
By investigating the situation on a curved road, it wasshown how the proposed traveling lane-based ROIimproved the performance of preceding vehicle detec-tion. Figure 14(a) shows an example of the fixed ROI andFigure 14(b) shows pixels with the same disparity valuesas the output of preceding vehicle detection. Because theroad was curved, a vehicle on the adjacent lane wasdetected. The correct preceding vehicle, which shouldhave been used for longitudinal control, was rejectedbecause of its comparatively smaller peak height. Figure14(c) shows the ROI established according to the recog-nized traveling lane. It was shown that the establishedROI successfully captured the image of the precedingvehicle while ignoring adjacent vehicles. Figure 14(d)shows the correctly-detected preceding vehicle.
Figure 12. Forward-looking sensors on a test vehicle.
Figure 13. Fixed ROI vs. traveling lane-based ROI.
Figure 14. Comparison of ROI methods in a curved roadsituation.
Table 1. Error mean and variance of two ROI methods.
Fixed ROI Lane-based ROI
Error mean 5.1738 1.8509
Error variance 15.8154 1.8453

STEREO VISION-BASED FORWARD OBSTACLE DETECTION 501
5.3. Effect of Peak Detection by the Threshold-Line andPeakness EvaluationPreceding vehicle detection was tested with two differentpeak detection methods: the constant threshold-based,and threshold-line and peakness evaluation-basedmethods. Figure 15(a) shows the distances calculated bythe constant threshold. The distances contained manylarge noise factors. Figure 15(b) shows the distancescalculated by the threshold-line and peakness evaluation.Table 2 shows that the proposed method producedsmaller average errors than the constant threshold-basedmethod. During the experiments, the constant thresholdwas small so the candidate peaks never failed to includecorrect ones. Pixels belonging to the background portion,
which generally form small peaks at small disparity values,were detected as preceding vehicles. Errors in the con-stant threshold-based method were caused by backgroundpixels and traffic markings.
By investigating critical situations, it was shown that
Figure 15. Constant threshold vs. the threshold-line andpeakness evaluaiton.
Table 2. Error mean and variance of two thresholdmethods.
Constant threshold
Threshold-line andPeakness Evaluation
Error mean 4.1874 1.8509
Error variance 9.4403 1.8453
Figure 16. Comparison of the two peak detection methods.
Figure 17. Measured distances with a laser radar and theproposed method.

502 H. G. JUNG et al.
the proposed threshold-line and peakness evaluationimproved peak detection performance. Figure 16(a) is anexample of the constant threshold and the detected peaks.The peak in the circle denotes a peak recognized as apreceding vehicle. In Figure 16(b), the traffic sign on theground surface corresponds to a detected peak. Figure16(c) is an example of the threshold-line and the detectedpeaks. The circled peak also denotes a peak recognized asa preceding vehicle. In this case, thanks to threshold-lineand peakness evaluation, the correct peak, (not detectedby the constant threshold-based method) was success-fully detected. Figure 16(d) shows that the detected peakdid in fact correspond to a preceding vehicle.
5.4. Comparison with a Laser RadarThe proposed method was verified by comparing itsoutput with the distance measured by a laser radar. It wasconfirmed that the larger FOV of the vision systemimproved response times with respect to cutting-invehicles when compared with laser radars.
In an open space, a test vehicle approached a vehiclestanding still and then returned to the initial position. Forthe sake of safety, we performed the experiment at a testtrack and did not use the traveling lane-based ROImethod. Figure 17 shows the two distance sequences
measured by the proposed system and a laser radar. Theproposed system measured the distance correctly withinthe range of 10-60 m. Although the measured distancewas not perfect, it proved sufficient for collision warningand avoidance. Furthermore, while comparing the propo-sed method with laser radars, the vision-based systemwas shown to simultaneously detect traveling lanes, whichis necessary for lane-keeping and target resolutions oncurved roads.
Another major difference between stereo vision andlaser radars is the FOV. Laser radars use a narrow FOV tocover far distances due to the TOF (Time Of Flight)principle. By contrast, the vision system uses a widerFOV because it measures the bearing angle of objects.Furthermore, the traveling-lane based ROI eliminates thedisturbance of vehicles on adjacent lanes. Figure 18 showsthe distance measurements when a vehicle was about tocut-in. The proposed vision system detected cutting-invehicles faster than the laser radar. This rapid responsetime is crucial for the successful management of cutting-in vehicles.
5.5. Vehicle Test of Longitudinal Collision AvoidanceSystemUsing the proposed stereo vision-based obstacle distancemeasurement, we implemented a longitudinal collisionavoidance system by braking. The collision avoidancecontroller continuously calculated the required brakingdistance by considering the ego-vehicle states and theobstacle distance. Once the required braking distance wassmaller than the measured distance, active braking wasactivated to prevent predicted collisions.
Active braking was implemented by using the MandoMGH-25 ESP system. The collision avoidance controllersent a deceleration command to the braking controller,and then the braking controller implemented deceleration
Figure 18. Effect of the vision system’s wider FOV.
Figure 19. Deceleration control results by ESP pressurecontrol.
STEREO VISION-BASED FORWARD OBSTACLE DETECTION 503
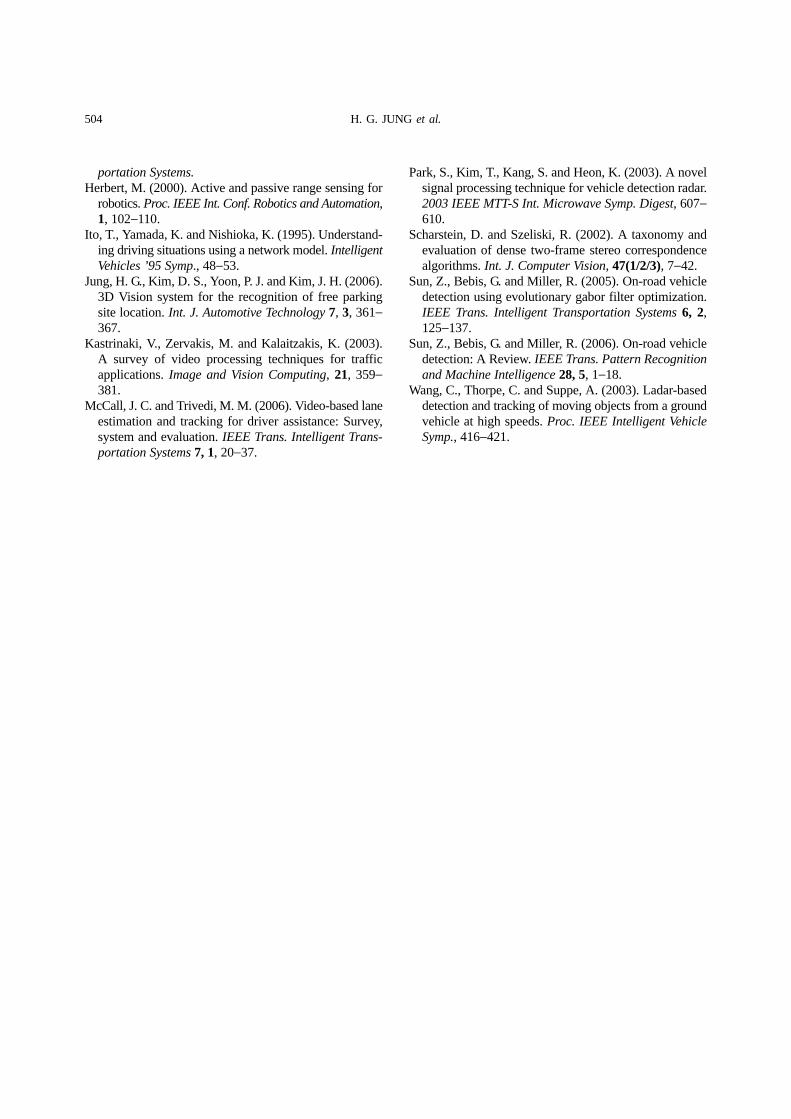
by controlling the ESP hydraulic actuator. The first graphof Figure 19 shows the target deceleration and the mea-sured deceleration. The third graph of Figure 19 showsthe controlled wheel pressure and the second graphshows the speed of the ego-vehicle.
The required braking distance Drequired was calculatedusing Equation (11). The first term represents the dis-tance before the actual braking and the second termrepresents the distance during deceleration with constantdeceleration control. Tdelay denotes the time delay fromrecognition to actuation and Vrelative and arelative denote therelative velocity and deceleration between the ego-vehicleand the obstacle, respectively. Once the required brakingdistance was much smaller than the measured between-distance, deceleration by active braking was activated.Figure 20 shows the result of the longitudinal collisionavoidance system with a balloon target vehicle on snowin winter. The vertical dotted line designates a warningalert and active braking activation. The ego-vehicle wasstopped before collision with the obstacle.
(11)
6. CONCLUSION
In this paper, we have proposed a stereo vision-basedobstacle detection and distance measurement method. Byintroducing traveling lane-based ROI establishment, peakdetection by threshold-line, and edge feature correlation-based verification, we were able to overcome the pro-blems of the existing disparity histogram-based method
and extend its applications to highway collision warning/avoidance. Inevitable errors caused by simple stereomatching were ignored because the disparity histogramrepresented a kind of statistical method. By accepting allprobable candidates and then verifying the detectionprinciple strictly again, the false detection rate decreasedand the true detection rate increased. However, thisbenefit required high costs, i.e. additional computationload.
Although we were able to verify the improvement ofdisparity histogram-based obstacle detection by imple-menting a basic lane detection method, practical appli-cations require an advanced lane detection method. Parti-cularly, a stereo vision-based lane detection method mayimprove the stability of the detection performance irre-spective of the tilt angle change. Furthermore, commerci-alization requires the VHDL implementation of a corealgorithm such as stereo matching, edge-feature corre-lation, and disparity histogram generation. Possible futurework may include obstacle classification and recognitionof obstacles, e.g. vehicles, pedestrians, or standing poles.
REFERENCES
Batavia, P. H., Pomerleau, D. A. and Thorpe, C. E. (1997).Overtaking vehicle detection using implicit opticalflow. IEEE Conf. Intelligent Transportation System,729−734.
Bertozzi, M. and Broggi, A. (1998). GOLD: A parallelreal-time stereo vision system for generic obstacle andlane detection. IEEE Trans. Image Processing 7, 1,62−81.
Blum, J. and Eskandarian, A. (2002). Software architec-ture for adaptive collision avoidance systems. Int. J.Automotive Technology 3, 2, 79−88.
Bouguet, J. Y. (2006). Camera Calibration Tool Box forMatlab. http://www.vision.caltech.edu/bouguetj/calib_doc/.
Brown, M. Z., Burschka, D. and Hager, G. D. (2003).Advances in computational stereo. IEEE Trans. PatternAnalysis and Machine Intelligence 25, 8, 993−1008.
Chellappa, R., Qian, G. and Zheng, Q. (2004). Vehicledetection and tracking using acoustic and video sensors.IEEE Int. Conf. Acoustics, Speech, and Signal Pro-cessing, 793−796.
Franke, U. and Kutzbch, I. (1996). Fast stereo basedobject detection for stop & go traffic. IEEE IntelligentVehicle Symp., 339−344.
Giachetti, A., Campani, M. and Torre, V. (1998). The useof optical flow for road navigation. IEEE Trans. Roboticsand Automation 14, 1, 34−48.
Hancock, J., Hoffman, E., Sullivan, R., Ingimarson, D.,Langer, D. and Hebert, M. (1997). High-performancelaser ranger scanner. SPIE Int’l Conf. Intelligent Trans-
Drequired = Vrelative Tdelay⋅ 12---arelativeTdelay
2+⎝ ⎠⎛ ⎞+
Vrelative2
2 acontrol⋅------------------⎝ ⎠⎛ ⎞
Figure 20. Longitudinal collision avoidance by theproposed distance measurement and active braking.
504 H. G. JUNG et al.
portation Systems.Herbert, M. (2000). Active and passive range sensing for
robotics. Proc. IEEE Int. Conf. Robotics and Automation,1, 102−110.
Ito, T., Yamada, K. and Nishioka, K. (1995). Understand-ing driving situations using a network model. IntelligentVehicles ’95 Symp., 48−53.
Jung, H. G., Kim, D. S., Yoon, P. J. and Kim, J. H. (2006).3D Vision system for the recognition of free parkingsite location. Int. J. Automotive Technology 7, 3, 361−367.
Kastrinaki, V., Zervakis, M. and Kalaitzakis, K. (2003).A survey of video processing techniques for trafficapplications. Image and Vision Computing, 21, 359−381.
McCall, J. C. and Trivedi, M. M. (2006). Video-based laneestimation and tracking for driver assistance: Survey,system and evaluation. IEEE Trans. Intelligent Trans-portation Systems 7, 1, 20−37.
Park, S., Kim, T., Kang, S. and Heon, K. (2003). A novelsignal processing technique for vehicle detection radar.2003 IEEE MTT-S Int. Microwave Symp. Digest, 607−610.
Scharstein, D. and Szeliski, R. (2002). A taxonomy andevaluation of dense two-frame stereo correspondencealgorithms. Int. J. Computer Vision, 47(1/2/3), 7−42.
Sun, Z., Bebis, G. and Miller, R. (2005). On-road vehicledetection using evolutionary gabor filter optimization.IEEE Trans. Intelligent Transportation Systems 6, 2,125−137.
Sun, Z., Bebis, G. and Miller, R. (2006). On-road vehicledetection: A Review. IEEE Trans. Pattern Recognitionand Machine Intelligence 28, 5, 1−18.
Wang, C., Thorpe, C. and Suppe, A. (2003). Ladar-baseddetection and tracking of moving objects from a groundvehicle at high speeds. Proc. IEEE Intelligent VehicleSymp., 416−421.