stepwise hydrogeological … - amigo-3... · stepwise hydrogeological characterisation utilising a...
TRANSCRIPT

235
STEPWISE HYDROGEOLOGICAL CHARACTERISATION UTILISING A GEOSYNTHESIS METHODOLOGY – A CASE STUDY FROM THE MIZUNAMI
UNDERGROUND RESEARCH LABORATORY PROJECT
H. Saegusa, H. Osawa, H. Onoe, T. Ohyama, R. Takeuchi and S. Takeuchi Japan Atomic Energy Agency, Japan
Abstract
The Mizunami Underground Research Laboratory (“MIU”) is now under construction by Japan Atomic Energy Agency (JAEA) in the Cretaceous Toki granite in the Tono area of central Japan. One of the main goals of the MIU project, which is a broad scientific study of the deep geological environment as a basis of research and development for geological disposal of nuclear wastes, is to establish comprehensive techniques for the investigation, analysis and assessment of the deep geological environment in fractured crystalline rock. For this purpose, a geosynthesis methodology has been developed and will be tested in a dry run to determine if it produces the data required for repository design and associated integrated safety assessment modelling.
Surface-based hydrogeological characterisation, intended to develop conceptual models of the deep geological environment based on an understanding of the undisturbed conditions before excavation of this URL, was carried out in a stepwise manner. This allows field investigations, construction of geological and hydrogeological models and interpretation of resultant groundwater flow simulations to develop in an iterative manner. Investigations have the goal of obtaining information on factors relevant to repository design, associated construction, operational and post-closure safety assessment, evaluation of the practicality of implementation and environmental impact assessment. Such factors include bulk hydraulic conductivity, the locations and properties of water conducting features, direct and indirect indicators of regional and local flow (e.g. based on chemistry or isotopes), etc.
Following evaluation of pre-existing site information, field investigations began with fault mapping. This was followed by reflection seismic and vertical seismic profile surveys. In addition, a large programme of investigations was carried out in boreholes, including cross-hole tomography and hydraulic tests. Such input is utilised for the construction of hydrogeological models and groundwater flow simulations, which can be used to identify and prioritise key issues for further investigations. Results show that such an approach, focusing hydrogeological characterisations by a structured geosynthesis methodology, leads to an improved understanding of the deep hydrogeological environment and allows repository-relevant datasets to be produced in an efficient and traceable manner.
Introduction
The Mizunami Underground Laboratory (MIU)[1] is the location of a comprehensive research project investigating the deep underground environment within crystalline rock. It is conducted by the Japan Atomic Energy Agency in Mizunami City, Gifu Prefecture, central Japan and its role is defined in “Framework for Nuclear Energy Policy” [2] by the Japan Atomic Energy Commission. MIU is a

236
purpose-built generic underground research laboratory project that includes two 1 000 m circular cross section shafts and horizontal research galleries at depths of 500 m and 1 000 m (Figure 1)[3]. The project, which began in 1996, is implemented in three overlapping phases: Surface-based Investigation (Phase I), Construction (Phase II) and Operation (Phase III), with a total duration of 20 years.
Figure 1. Location of the MIU construction site, principal boreholes and the planned layout of the MIU facilities
Main Shaft(F 6.5m)
Ve nti lation Shaft
(F 6.5m)
Middle Stage
Sub Stage
Main Stage
Hydrochemical monitoring boreholeHydraulic monitoring boreholeURL Shaft
1 km
MIU Construction site DH-15
Site scale area
MIZ-1
MSB-4
MSB-1
MSB-3
MSB-2
Ventilation ShaftMain Shaft
DH-2 100 mMIU construction site
Tokyo
Osaka
NNW trending fault
MIU construction site
MIU is a broad scientific study of the deep geological environment as a component of research and development supporting geological disposal of nuclear wastes. One of the main goals of the project is to establish techniques for comprehensive investigation, analysis and assessment of fractured crystalline rock. For this purpose, a geosynthesis methodology has been developed and is being tested to determine if it produces the data required for repository design and associated integrated safety assessment modelling.
In Phase I, a stepwise investigation was conducted by iterating investigation, interpretation, modelling and assessment in order to test applicability of the basic geosynthesis methodology and to modify it as required to optimise performance for this particular geological setting. This paper describes the results of this work, with a particular emphasis on hydrogeological characterisation.
Site geology
In the study area, Tertiary sedimentary rocks widely and unconformably overlay the Cretaceous Toki Granite, which was emplaced ca. 60-70 Ma ago [4]. The Tertiary sedimentary rocks are lithologically divided into the Mizunami Group (age ca. 15-20 Ma) and the Seto Group (1.5-12 Ma). The Mizunami Group is further sub-divided into the Toki Lignite-bearing Formation, the

237
Akeyo/Hongo Formation and the Oidawara Formation, in ascending order. The lower part of the Mizunami Group is mainly composed of tuff, silt/sandstone and conglomerate. The middle and upper parts of the Mizunami Group are mainly composed of mudstone and silt/sandstone alternating with shallow marine facies. The Seto Group consists of unconsolidated clay, sand and gravel.
The Toki Granite is typically felsic and is sub-classified by biotite content. The granite is also sub-divided into structural domains based on variations in fracture development (an upper highly fractured domain (UHFD) and a lower sparsely fractured domain (LSFD)). Below the unconformity with the Miocene sediments, the upper part of the Toki Granite has been intensely weathered. This weathered zone varies in extent across the study area, but is typically a few tens of metres thick.
The most significant structure in the area is the Tsukiyoshi fault, which has an E-W trend and a dip of 70-80° to the south. The Toki Granite and Mizunami Group are both cut by the fault, with approximately 30 metres of vertical displacement [5].
Geosynthesis methodology
Identification of specific aims
To determine specific aims for R&D activities in the MIU project, some key factors needing to be characterised and the resultant data requirements to support safety assessment, design and construction of underground facilities and environmental assessment have been identified. It is recognised that this list is not complete as, for example, long-term evolution of geological environment and biosphere assessment are not being considered at this time. The requirements for safety assessment have been assigned referring to the context provided by the generic H12 study [6] as well as the items and methods for investigation and evaluation considered for future preliminary investigations of potential HLW sites in Japan [7]. The extent to which such goals can be achieved will be examined in the MIU project.
Adopting of iterative approach
Various spatial and temporal as well as economic and socio-political constraints are likely to be encountered when characterising the geological environment at specific sites. For effective characterisation despite such limitations, it is important to evaluate the relationship between the information obtained during the investigations and that actually required to meet specific aims. This allows iterative assessment of the value of the characterisation output at each project stage, which leads to identification and prioritisation of key issues for further investigations [8,9].
Development and optimisation of the geosynthesis data flow diagram
For MIU site characterisation, investigations used an iterative approach based on a geosynthesis data flow diagram [8-10]. The geosynthesis data flow diagram illustrates, for specified aims, the data that need to be acquired and the subsequent process of interpretation and synthesis of information by different disciplines in order to derive output in the form desired by the end users.
The geosynthesis data flow diagram has been iteratively tested and optimised based on the technical knowledge accumulated during stepwise characterisation work. An example for step 3 (Figure 2) shows how the information from the studies carried out in new deep boreholes is combined with the background from the previous step in order to update and extend the models which produce the output data required by designers and performance assessors.

238
BoreholeinvestigationsGroundexploration
Item
s re
late
d to
the
char
acte
rizat
ion
Item
s no
t rel
ated
to th
e ch
arac
teriz
atio
nLi
nk b
etw
een
item
s re
late
dto
the
char
acte
rizat
ion
Con
firm
atio
n of
con
siste
ncy
Link
s co
nnec
ted
Link
s no
t con
nect
ed
Fiel
d In
vest
igat
ions
Surv
ey/R
evie
w of
exi
stin
g in
form
atio
n
Rem
ote
sens
ing
Airb
orne
geo
phys
ical
sur
vey
(Mag
netic
/Ele
ctor
omag
netic
/Rad
iom
etric
sur
vey
etc)
Geo
logi
cal m
appi
ng
Gro
und
geop
hysic
al s
urve
y(G
ravit
y/M
agne
tic/E
lect
ric/E
lect
orom
agne
tic/R
adio
met
ric/S
eism
ic su
rvey
etc
)
Tren
ch e
xcav
atio
n su
rvey
Surfa
ce h
ydro
logi
cal i
nves
tigat
io-
ns, M
eteo
rolo
gica
l obs
erva
tion
Sam
plin
g an
d ch
emic
al a
nalys
esof
pre
cipita
tion
and
surfa
ce w
ater
Labo
rato
ry e
xam
inat
ions
(Pet
rolo
gica
l/Min
eral
ogic
al/P
etro
phys
ical
/Roc
km
echa
nica
l cha
ract
eriza
tion,
Age
datin
g te
st, H
ydra
ulic
test
)
Core
logg
ing
Inve
stig
atio
ns o
f bor
ehol
e w
all
imag
e
Geo
phys
ical
logg
ing
Flui
d lo
ggin
g
Sing
le-h
ole
hydr
aulic
test
Sam
plin
g an
d ch
emic
al a
nalys
esof
gro
undw
ater
In-s
itu ro
ck m
echa
nica
l tes
ts
VSP
surv
ey
Cros
s-ho
le to
mog
raph
y su
rvey
Cros
s-ho
le h
ydra
ulic
test
Labo
rato
ry e
xam
inat
ions
(Pet
rolo
gica
l/Min
eral
ogic
al/P
etro
phys
ical
/Roc
km
echa
nica
l cha
ract
eriza
tion,
Age
datin
g te
st, H
ydra
ulic
test
)
Mon
itorin
g of
hyd
raul
ic re
spon
sedu
e to
bor
ehol
e dr
illing
Long
-term
hyd
raul
ic m
onito
ring
Data
Inte
rpre
tatio
n / D
atas
etCo
ncep
tual
izat
ion
/ Mod
elin
g / S
imul
atio
nIm
porta
nt fa
ctor
s to
be
char
acte
rized
and
data
requ
irem
ents
Aerialexploration
Topo
grap
hica
l dat
a
Stra
tigra
phic
al a
nd L
ithol
ogica
lda
ta (G
eolo
gica
l map
and
colu
mns
etc
)
Data
of g
eolo
gica
l stru
ctur
e(L
inea
men
t/Fau
lt/Jo
int d
istri
butio
n)
Petro
logi
cal a
nd m
iner
alog
ical
data
(Roc
k te
xtur
e, M
iner
alog
ical
com
posi
tion
etc)
Geo
chem
ical d
ata
(Che
mic
al/Is
otop
ic c
ompo
sitio
n et
c)
Petro
phys
ical d
ata
(Por
osity
, Den
sity
etc
)
Surfa
ce h
ydro
logi
cal d
ata
(Riv
er fl
ux, P
reci
pita
tion,
Evap
otra
nspi
ratio
n, G
roun
dwat
erle
vel e
tc)
Deep
hyd
raul
ic d
ata
(Inflo
w p
oint
s, H
ydra
ulic
cond
uctiv
ity,T
rans
mis
sivity
,St
orag
e co
effic
ient
etc
)
Long
-term
gro
undw
ater
leve
l/p
ress
ure
chan
ges
Hydr
oche
mic
al d
ata
of s
urfa
cewa
ter (
Che
mica
l/Iso
topi
cco
mpo
sitio
n et
c)
Hydr
oche
mic
al d
ata
ofgr
ound
wat
er (C
hem
ical/I
soto
pic
com
posi
tion,
Col
loid
s, O
rgan
icm
atte
rs, M
icrob
es e
tc)
Solu
te tr
ansp
ort/r
etar
datio
n da
ta(S
orpt
ion/
Diffu
sion
coe
fficie
nt,
Pore
stru
ctur
e et
c)
Rock
mec
hani
cal a
nd th
erm
al d
a-ta
(Unc
onfin
ed c
ompr
essio
n st
ren-
gth,
Youn
g's
mod
ulus
,The
rmal
cond
uctiv
ity, G
eoth
erm
al g
radi
ent)
Initi
al s
tress
dat
a
Sedi
men
tary
cov
er- H
oriz
onta
l sid
tribu
tion
- Stra
tigra
phy
and
Lith
olog
y- M
iner
alog
ical/P
etro
logi
cal
cha
ract
eris
tics
Base
men
t gra
nite
- Dep
th a
nd g
eom
etry
of
unc
onfo
rmity
- Lith
olog
ical a
nd s
truct
ural
dom
ain
- Pet
rolo
gica
l/Min
eral
ogic
al c
hara
cter
istic
s
Disc
ontin
uitie
s (F
ault/
Join
t)- 3
D d
istri
butio
n an
d ge
omet
ry- P
etro
logi
cal/M
iner
alog
ical
cha
ract
eris
tics
Gro
undw
ater
tabl
e di
strib
utio
n
Rec
harg
e ra
te (I
nfilt
ratio
n)
Sedi
men
tary
cov
er- H
ydra
ulic
char
acte
ristic
s (
Hydr
aulic
pro
perty
)- F
low
poro
sity
Base
men
t gra
nite
- Hyd
raul
ic ch
arac
teris
tics
(Hy
drau
lic p
rope
rty)
- Flo
w po
rosit
y
Disc
ontin
uitie
s (F
ault/
Join
t)- H
ydra
ulic
char
acte
ristic
s (
Hydr
aulic
pro
perty
)- F
low
poro
sity
Hyd
raul
ic h
ead
dist
ribut
ion
Gro
undw
ater
in s
edim
enta
ry c
over
- Dis
tribu
tion
of g
roun
dwat
er c
hem
istry
- Orig
in a
nd re
siden
ce ti
me
of g
roun
dwat
er
Gro
undw
ater
in g
rani
te- D
istri
butio
n of
gro
undw
ater
che
mis
try- O
rigin
and
resid
ence
tim
e of
gro
undw
ater
- Che
mic
al c
hara
cter
istic
s of
col
loid
s, o
rgan
ic m
atte
rs a
nd m
icro
bes
Sedi
men
tary
cov
er- S
orpt
ion/
Diffu
sion
char
acte
ristic
s- G
eom
etric
al s
truct
ure
of s
olut
e t
rans
port
field
Base
men
t gra
nite
- Sor
ptio
n/D
iffusio
n ch
arac
teris
tics
- Geo
met
ry o
f pat
hway
s/po
rosi
ties
- Por
e st
ruct
ure
char
acte
ristic
s
Disc
ontin
uitie
s (fa
ult a
nd jo
int)
- Sor
ptio
n ch
arac
teris
tics
- Dep
th o
f mat
rix d
iffusi
on- P
ore
stru
ctur
e ch
arac
teris
tics
Sedi
men
tary
cov
er /
Gra
nite
- Roc
k m
echa
nica
l/The
rmal
cha
ract
eris
tics
Initi
al s
tress
sta
te
Topo
grap
hica
l mod
el
Geo
logi
cal m
odel
(Reg
iona
l sca
le)
Hydr
ogeo
logi
cal m
odel
(Reg
iona
l sca
le)
Gro
undw
ater
flow
sim
ulat
ion
(Reg
iona
l sca
le)
Geo
logi
cal m
odel
(Loc
al s
cale
)
Hyd
roge
olog
ical
mod
el(L
ocal
sca
le)
Gro
undw
ater
flow
sim
ulat
ion
(Loc
al s
cale
)
Hyd
roch
emic
al s
imul
atio
n(L
ocal
sca
le)
Hyd
roch
emica
l mod
el(L
ocal
sca
le)
Geo
logi
cal m
odel
(Site
sca
le)
Hyd
roge
olog
ical
mod
el(S
ite s
cale
)G
roun
dwat
er fl
ow s
imul
atio
n(S
ite s
cale
)
Hydr
oche
mic
al s
imul
atio
n(S
ite s
cale
)H
ydro
chem
ical m
odel
(Site
sca
le)
Solu
te tr
ansp
ort c
once
ptua
lm
odel
Roc
k m
echa
nica
l mod
el(B
lock
sca
le)
Stre
ss/E
xcav
atio
n an
alys
is(B
lock
sca
le)
Spat
ial v
aria
bility
of g
eoth
erm
algr
adie
nt
Ther
mal
rock
pro
perti
es
Loca
l stre
ss re
gim
e
Spat
ial v
aria
bility
of
petro
phys
ical/g
eom
echa
nica
lpr
oper
ties
of ro
cks
Volu
me
of in
flow
into
unde
rgro
und
tunn
els
Size
and
stru
ctur
e of
ED
Z;pe
troph
ysica
l/geo
mec
hani
cal
prop
ertie
s of
EDZ
Dist
ribut
ion
of d
isco
ntin
uitie
sin
ters
ectin
g un
derg
roun
dtu
nnel
s
Geomechanical/hydraulicpropertiesoftunnelnear-fieldenvironment
Subsurfacethermalconditions
Size
and
geo
met
ry o
f hos
t roc
k;he
tero
gene
ity w
ithin
hos
t roc
k
Size
and
ext
ent o
f sur
roun
ding
form
atio
ns
Spat
ial d
istrib
utio
n an
d ge
om-
etry
of t
rans
port
path
way
s(g
roun
dwat
er fl
owpa
ths)
Geologicalstructure
Spat
ial v
aria
bility
of m
agni
tude
of h
ydra
ulic
grad
ient
Spat
ial v
aria
bility
of h
ydra
ulic
prop
ertie
s of
rock
s
Groundwaterflowcharacteristics
Red
ox c
ondi
tions
Spat
ial v
aria
bility
of
grou
ndwa
ter p
H va
lues
Spat
ial d
istrib
utio
n of
diffe
rent
grou
ndwa
ters
; deg
ree
ofgr
ound
wate
r min
eral
izat
ion
Geochemicalcharacteristicsofgroundwater
Sorp
tion
capa
city
and
diffu
sivi
tyof
rock
mat
rix a
nd o
f tra
nspo
rtpa
thwa
ys
Geo
met
ry o
f tra
nspo
rt pa
thw
ays;
dept
h of
diffu
sion
-acc
essi
ble
rock
mat
rix
Effe
ct o
f col
loid
/org
anic
s/m
icro
bes
on n
uclid
etra
nspo
rt/re
tard
atio
n
Spat
ial d
istrib
utio
n of
high
er-p
erm
eabi
lity
rock
s,aq
uife
rs a
nd s
urfa
ce w
ater
s
Spat
ial v
aria
bility
of w
ater
flux
esin
hig
her-p
erm
eabi
lity ro
cks,
aqui
fers
and
sur
face
wat
ers
Transport/retardationofnuclides Dilutionofnuclides
Fig
ure
2:
Exa
mpl
e of
a s
ectio
n of
the
geo
synt
hesi
sda
ta fl
ow d
iagr
am fo
cuse
d on
inte
rpre
ting
the
data
from
bor
ehol
es p
rodu
ced
duri
ng s
tep
3

239
Application of the geosynthesis methodology for hydrogeological characterisation
Concept of the stepwise surface-based investigations
The five steps of site investigations (Step 0 to 4) have now been completed in Phase I of the MIU project (Figure 3). Following evaluation of relevant pre-existing information, field investigations began with fault mapping. This was followed by reflection seismic and vertical seismic profile surveys. In addition, a large programme of investigations was carried out in boreholes, ranging from 100 to 1,300 m deep, including in situ measurements during and after drilling and comprehensive analysis of carefully collected core and water samples. This was extended by subsequent cross-hole seismic and resistivity tomography, and hydraulic tests between the deep boreholes. Such input is utilised for the stepwise construction, testing and improvement of geological and hydrogeological models, hydrogeochemical evolution simulations and other quantitative representations of the properties of the geological environment (such an integrated model/database is termed by NUMO the “site descriptive model”).
Phase 2 excavation of shafts commenced in July 2003, and these had reached a depth of 230 m in March 2008. A range of geoscientific investigations is currently ongoing during shaft construction.
Figure 3. Concept of Phase I investigations
Phase II
• Compilation of acquired information
• Geological Mapping
• Reflection seismic survey
• Existing borehole investigations
• Shallow borehole investigations
• Deep borehole investigations
• Cross-hole tomography
• Cross-hole hydraulic test
• Construction of underground facility
Phase I
Sedimentary cover
Basement granite
Existing borehole
Shallow borehole
Deep borehole
Cross-holeUnderground facility
Step 0 Step 1 Step 3Step 2 Step 4
Fault / Joint zone Estimated / Determined
Hydrogeological characterisation
To illustrate application of the geosynthesis methodology in detail, this paper focuses on the hydrogeological characterisation carried out in the vicinity of the MIU construction site (“site scale” area; approximately 4 km2). This has the stated goals of developing understanding of groundwater flow characteristics, such as spatial variability of magnitude of hydraulic gradient and hydraulic properties of the various rocks and geological structures found at this location. As the groundwater flux has a great impact on design and groundwater flow scenarios are the main focus of post-closure performance assessment, resultant models are of great value for integrating investigation results. Evaluation of the impact of uncertainties in the hydrogeological model is also important, in order to identify and prioritise key issues for further investigations.

240
Hydrogeological characterisation in Step 0
Geoscientific studies at and around the nearby Tono mine have been carried out since 1987 [11-12]. Key hydrogeological information which had been accumulated prior to formal initiation of the MIU project, such as the hydraulic conductivity of the basement granite and of major fault zones such as the Tsukiyoshi fault, dominant groundwater flow directions and overall hydraulic gradient, was derived predominantly from the Regional Hydrogeological Study (RHS) [13]. The RHS project involved a broad scientific study of the deep hydrogeological environment at the scale of a complete flow system, from recharge to discharge (tens of km2; Local scale area). Remote sensing, airborne/ground geophysical surveys, surface-water/meteorological observations, deep borehole investigations, etc. were carried out over this area [13]. Based on the results of these investigations, a conceptual geological model for the site scale area was constructed (Figure 4) [8,9]. This describes significant geological/lithological elements that influence groundwater flow characteristics. The geological model shows the presence of joints and faults of varying scale within the basement granite. Large-scale faults, which have trace lengths over several hundred metres, may act as either as major conduits of water flow or as hydraulic barriers. An initial 3-D geological model [Figure 5(a)] of the site scale area was also constructed [8,9], which takes into account best estimates of the geometry of the main geological/lithological units and the major fault zone described in the 2-D model (Figure 4).
Figure 4. Geological conceptual model (see text for explanation)
Sedimentary cover
Basement Granite
Upper HighlyFractured Domain(UHFD)
Lower SparselyFractured Domain(LSFD)
Large-scale Fault
Unconformity
Fractured zone along the large-scale fault
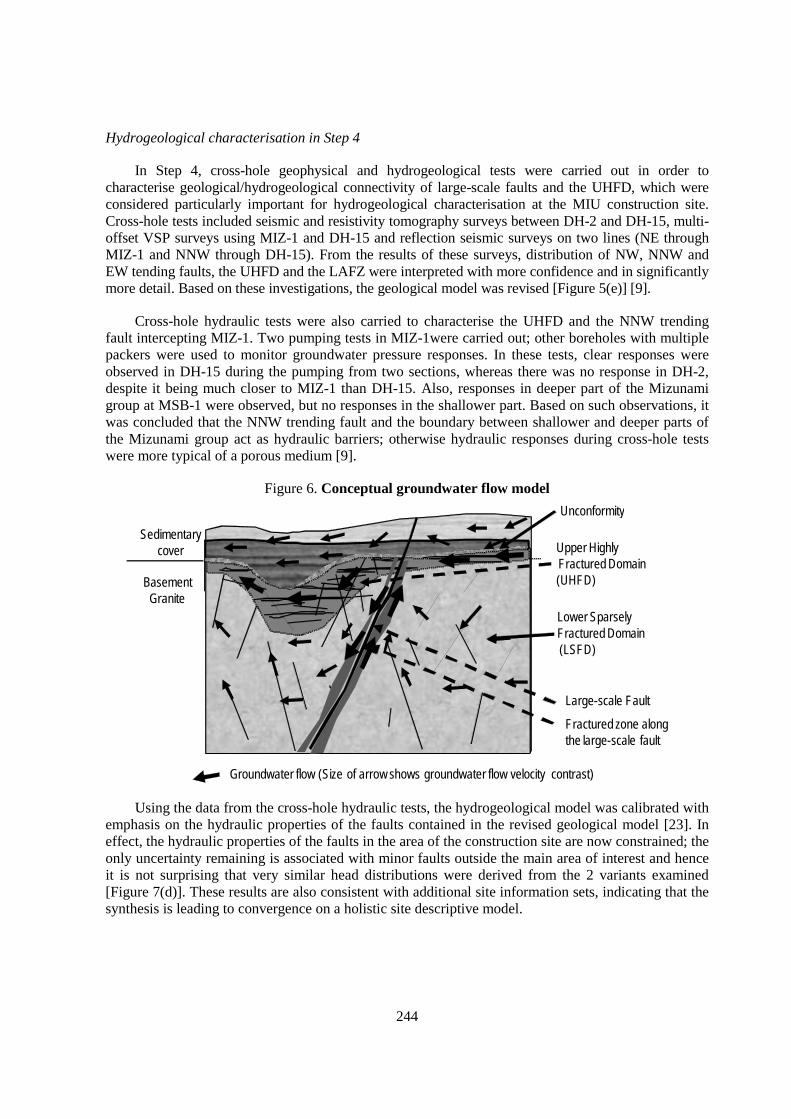
This forms the basis for the first hydrogeological model, which allows groundwater flow simulations to be carried out [14] using hydraulic characteristics based on the data obtained in the RHS project. The conceptual groundwater flow model is illustrated in Figure 6. Although topographical gradients explain the general pattern of flow near the surface, it is clear that major fault zones have a dominant role in defining deeper flows – especially the hydraulic gradient downstream of the fault and sub-vertical components of such flow. This is particularly evident when they effectively form hydraulic barriers. Fluxes and flow velocities in the basement are related to the density of smaller water-conducting faults and fractures – either distributed throughout the rock mass or concentrated in damaged zones around major faults. A key goal of subsequent hydrogeological characterisation was thus to better define the role of larger faults on the site scale flow system.
Hydrogeological characterisation in Step 1
In Step 1, detailed geological mapping and reflection seismic surveys were carried out in order to improve the geological model of the MIU construction site [8-9]. Based on such information, complemented by lineament interpretations using aerial photographs, a revised geological model containing a representation of all large-scale faults was produced [Figure 5(b)] [15].
241
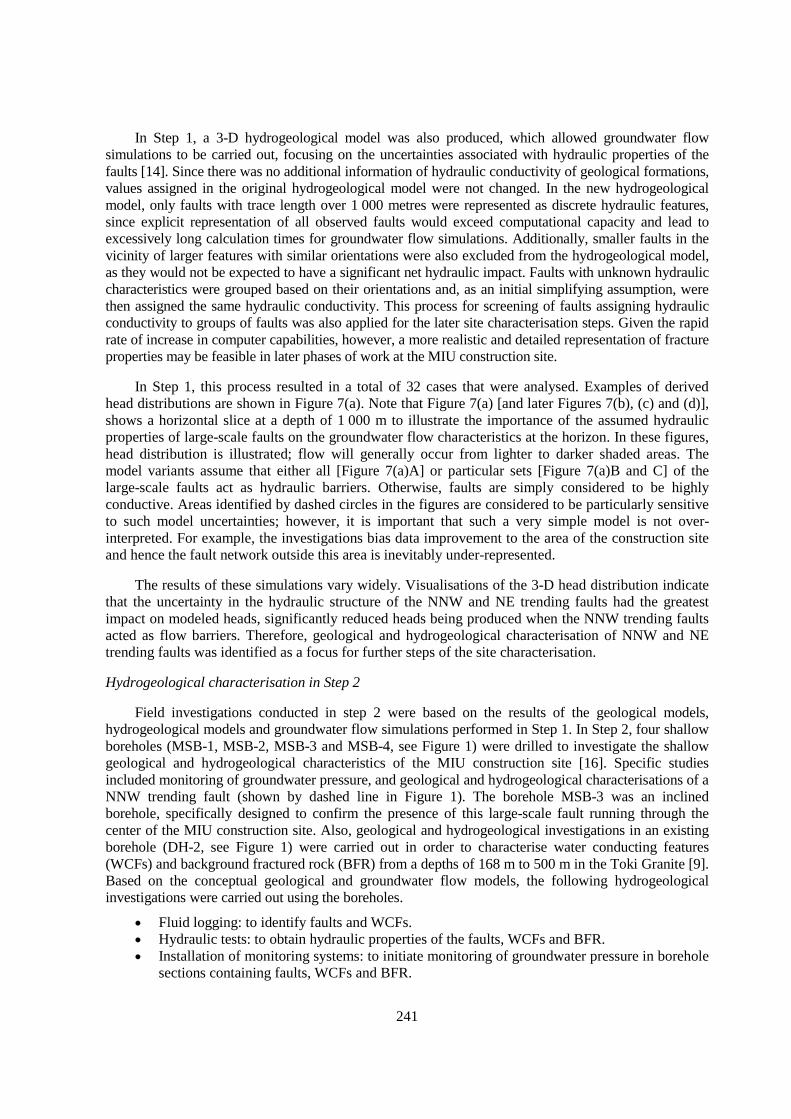
In Step 1, a 3-D hydrogeological model was also produced, which allowed groundwater flow simulations to be carried out, focusing on the uncertainties associated with hydraulic properties of the faults [14]. Since there was no additional information of hydraulic conductivity of geological formations, values assigned in the original hydrogeological model were not changed. In the new hydrogeological model, only faults with trace length over 1 000 metres were represented as discrete hydraulic features, since explicit representation of all observed faults would exceed computational capacity and lead to excessively long calculation times for groundwater flow simulations. Additionally, smaller faults in the vicinity of larger features with similar orientations were also excluded from the hydrogeological model, as they would not be expected to have a significant net hydraulic impact. Faults with unknown hydraulic characteristics were grouped based on their orientations and, as an initial simplifying assumption, were then assigned the same hydraulic conductivity. This process for screening of faults assigning hydraulic conductivity to groups of faults was also applied for the later site characterisation steps. Given the rapid rate of increase in computer capabilities, however, a more realistic and detailed representation of fracture properties may be feasible in later phases of work at the MIU construction site.
In Step 1, this process resulted in a total of 32 cases that were analysed. Examples of derived head distributions are shown in Figure 7(a). Note that Figure 7(a) [and later Figures 7(b), (c) and (d)], shows a horizontal slice at a depth of 1 000 m to illustrate the importance of the assumed hydraulic properties of large-scale faults on the groundwater flow characteristics at the horizon. In these figures, head distribution is illustrated; flow will generally occur from lighter to darker shaded areas. The model variants assume that either all [Figure 7(a)A] or particular sets [Figure 7(a)B and C] of the large-scale faults act as hydraulic barriers. Otherwise, faults are simply considered to be highly conductive. Areas identified by dashed circles in the figures are considered to be particularly sensitive to such model uncertainties; however, it is important that such a very simple model is not over-interpreted. For example, the investigations bias data improvement to the area of the construction site and hence the fault network outside this area is inevitably under-represented.
The results of these simulations vary widely. Visualisations of the 3-D head distribution indicate that the uncertainty in the hydraulic structure of the NNW and NE trending faults had the greatest impact on modeled heads, significantly reduced heads being produced when the NNW trending faults acted as flow barriers. Therefore, geological and hydrogeological characterisation of NNW and NE trending faults was identified as a focus for further steps of the site characterisation.
Hydrogeological characterisation in Step 2
Field investigations conducted in step 2 were based on the results of the geological models, hydrogeological models and groundwater flow simulations performed in Step 1. In Step 2, four shallow boreholes (MSB-1, MSB-2, MSB-3 and MSB-4, see Figure 1) were drilled to investigate the shallow geological and hydrogeological characteristics of the MIU construction site [16]. Specific studies included monitoring of groundwater pressure, and geological and hydrogeological characterisations of a NNW trending fault (shown by dashed line in Figure 1). The borehole MSB-3 was an inclined borehole, specifically designed to confirm the presence of this large-scale fault running through the center of the MIU construction site. Also, geological and hydrogeological investigations in an existing borehole (DH-2, see Figure 1) were carried out in order to characterise water conducting features (WCFs) and background fractured rock (BFR) from a depths of 168 m to 500 m in the Toki Granite [9]. Based on the conceptual geological and groundwater flow models, the following hydrogeological investigations were carried out using the boreholes.
• Fluid logging: to identify faults and WCFs. • Hydraulic tests: to obtain hydraulic properties of the faults, WCFs and BFR. • Installation of monitoring systems: to initiate monitoring of groundwater pressure in borehole
sections containing faults, WCFs and BFR.
242
From the shallow borehole investigations, the geological, hydrogeological and hydrochemical features of sedimentary rocks were determined, with a special emphasis on the geometry and characteristics of the major NNW trending fault that cuts them. Also, from the DH-2 borehole investigations, such characterisation was extended into the UHFD; this includes a low angle fracture zone (LAFZ), which is a hydraulically significant feature, and NNW and EW trending faults that penetrate basement granite. Based on this input, a revised geological model was produced [Figure 5(c)] [15]. In particular, the interpretations of orientation, connectivity and continuity of some large-scale faults were significantly changed.
This input was, in turn, used to modify the hydrogeological model [17]; subsequent groundwater flow simulations focused again on systematic variation in the hydraulic property groups large-scale faults with similar orientations [Figure 7(b)]. The revised geological model resulted in the number of different fault groups being decreased, while the hydraulic conductivities of the faults hydraulically characterised in basement granite were now fixed – significantly decreasing the number of variants to a total of 12 cases that had to be analysed. Areas identified by dashed ellipses are considered to be significantly influenced by the uncertainties of the hydrogeological models – but here again the fundamental limitations of the model should be borne in mind, as should the limited support for the assumptions that hydraulic properties measured in an extensive fault near the surface can be extrapolated to greater depth and to all parts of a feature that may extend over several kilometers.
It was clearly shown from the sensitivity studies that the NNW, NW and EW trending faults in the basement granite had a significant influence on groundwater flow conditions at the reference –1 000 m horizon. Therefore, geological and hydrogeological characterisation of such faults within deeper parts of the Toki Granite was identified as a key focus of site characterisation activities in Step 3 [17].
Hydrogeological characterisation in Step 3
Field investigations conducted in Step 3 were also based on the results of geological models, hydrogeological models and groundwater flow simulations performed in Steps 1 and 2. In Step 3, a deviated deep borehole (MIZ-1, see Figure 1) was drilled with the main goal to characterise NNW, NW and EW trending faults. Geological, hydraulic and geochemical data were acquired from downhole measurements and analysis of core and water samples [18]. Also, geological, hydrogeological and hydrochemical investigations in a deep borehole (DH-15, see Figure 1), which was newly drilled to 1 000 m deep in basement granite, were carried out aimed at characterising an EW trending fault [19]. From these deep borehole investigations, properties of the NNW, NW and EW trending faults in the basement granite were directly characterised in some detail, and WCFs and BFR from the surface to over 1 000 m deep in granite were also investigated [9,20]. Based on a synthesis of such information, a revised geological model was produced [Figure 5(d)] [9].
The hydraulic properties of the faults were estimated based on the groundwater pressure responses observed at monitoring boreholes, MSB-1 to MSB-4 and DH-2, during activities in MIZ-1 and DH-15 that resulted in hydraulic signals, such as drilling fluid loss and pumping tests. Groundwater pressure responses were observed in the shallow boreholes, but not DH-2. Based on the results of such monitoring, most of NNW and EW trending faults can be classified as either being hydraulic barriers or not. Basically, any fault identified as lying between hydraulically connected boreholes was excluded as a potential barrier. In addition, since pressure responses were not observed in DH-2, which is relatively close to MIZ-1, it was concluded that the fault located between these boreholes acts as a hydraulic barrier.

243
Figure 5. Geological models constructed and revised based on the results from field investigations (Step 0 to 4)
Elevation[m]
500
0
-500
-1000
-1500
-2000
N
※The model is constructed in consideration of the lineament investigation result.
Elevation[m]
500
0
-500
-1000
-1500
-2000
N
※The model is constructed in consideration of the lineament investigation result.
Elevation[m]
500
0
-500
-1000
-1500
-2000
N
※Lineament analysis results were considered in constructing the model.
(a) Step 0
(c) Step 2 (d) Step 3
(e) Step 4
Legend
Seto G. Toki gravelMizunami G. Oidawara Fm.Mizunami G. Akeyo/Hongo Fm.Mizunami G. Akeyo/Hongo Fm. basal conglomerateMizunami G. Toki Lignite-bearing Fm.Mizunami G. Toki Lignite-bearing Fm. basal conglomerateToki Granite Upper highly fractured domainToki Granite Low-angle fractured zoneToki Granite Lower sparsely fractured domainHighly fractured zone along Tsukiyoshi FaultLarge-scale fault
Elevation[m]
500
0
-500
-1000
-1500
-2000
NElevation[m]
500
0
-500
-1000
-1500
-2000
N
※ Lineament analysis results were considered in constructing the model.(b) Step 1
The hydrogeological model was updated on the principles discussed above which, based on the improved characterisation of fractures, required only 8 variant simulation cases to cover remaining uncertainties in the hydraulic characteristics of specific groups of fractures [Figure 7(c)] [21]. The resultant range of the simulated head distributions was noted to be less than in previous steps. The conceptual model of groundwater flow for the simulations was also examined by qualitative assessment of compatibility with a hydrochemical conceptual model [22] developed in Step 3. Overall, it is considered that groundwater pressure responses during deep borehole investigations significantly increased the understanding of the hydraulic properties of key groups of faults.
244
Hydrogeological characterisation in Step 4
In Step 4, cross-hole geophysical and hydrogeological tests were carried out in order to characterise geological/hydrogeological connectivity of large-scale faults and the UHFD, which were considered particularly important for hydrogeological characterisation at the MIU construction site. Cross-hole tests included seismic and resistivity tomography surveys between DH-2 and DH-15, multi-offset VSP surveys using MIZ-1 and DH-15 and reflection seismic surveys on two lines (NE through MIZ-1 and NNW through DH-15). From the results of these surveys, distribution of NW, NNW and EW tending faults, the UHFD and the LAFZ were interpreted with more confidence and in significantly more detail. Based on these investigations, the geological model was revised [Figure 5(e)] [9].
Cross-hole hydraulic tests were also carried to characterise the UHFD and the NNW trending fault intercepting MIZ-1. Two pumping tests in MIZ-1were carried out; other boreholes with multiple packers were used to monitor groundwater pressure responses. In these tests, clear responses were observed in DH-15 during the pumping from two sections, whereas there was no response in DH-2, despite it being much closer to MIZ-1 than DH-15. Also, responses in deeper part of the Mizunami group at MSB-1 were observed, but no responses in the shallower part. Based on such observations, it was concluded that the NNW trending fault and the boundary between shallower and deeper parts of the Mizunami group act as hydraulic barriers; otherwise hydraulic responses during cross-hole tests were more typical of a porous medium [9].
Figure 6. Conceptual groundwater flow model
Groundwater flow (Size of arrow shows groundwater flow velocity contrast)
Sedimentary cover
Basement Granite
Upper HighlyFractured Domain(UHFD)
Lower SparselyFractured Domain(LSFD)
Large-scale Fault
Unconformity
Fractured zone along the large-scale fault
Using the data from the cross-hole hydraulic tests, the hydrogeological model was calibrated with emphasis on the hydraulic properties of the faults contained in the revised geological model [23]. In effect, the hydraulic properties of the faults in the area of the construction site are now constrained; the only uncertainty remaining is associated with minor faults outside the main area of interest and hence it is not surprising that very similar head distributions were derived from the 2 variants examined [Figure 7(d)]. These results are also consistent with additional site information sets, indicating that the synthesis is leading to convergence on a holistic site descriptive model.

245
Figure 7. Example of simulated head distributions
N
S
N
S
N
S
E.L. [m]
50 0
0
-500
-1000
-150 0
E.L.[m]
500
0
- 500
-1000
- 1500
E.L. [m]
500
0
-500
-1000
-1500
N
S
N
S
N
S
E.L. [m]
50 0
0
-500
-1000
-150 0
E.L.[m]
500
0
- 500
-1000
- 1500
E.L. [m]
500
0
-500
-1000
-1500
N
S
N
S
N
S
E.L. [m]
50 0
0
-500
-1000
-150 0
E.L.[m]
500
0
- 500
-1000
- 1500
E.L. [m]
500
0
-500
-1000
-1500
N
S
E.L. [m]
500
0
-5 00
-100 0
-1500
N
S
E.L. [m]
500
0
-500
-1000
-15 00
(d) Step 4
(c) Step 3
(b) Step 2
(a) Step 1
280 240 200 160
Head (meter above sea level)
Large-scale fault with anisotropic hydraulic property
Area having significant differences between the model runs
Large-scale fault with high hydraulic property
MIU construction site
Boundaries of geological/lithological units
A B C
A B C
A B C
A B
Improvement in understanding of hydrogeological environments
In order to evaluate and quantify the improvement in the hydrogeological models developed at each step of the hydrogeological characterisation programme, the result of all groundwater flow variants were compared to the best measured heads from 19 measuring intervals (in boreholes MSB-1, MSB-3 and DH-2) after the completion of Phase 1 investigations. These head values were selected in cases where reasonably stable groundwater pressures were observed during long term monitoring. This criterion excluded values from MIZ-1 and DH-15, since groundwater pressure fluctuated in these boreholes, possibly as response to the perturbation caused by installation of monitoring equipment and shaft sinking. However, it was considered that head values from DH-2 were able to represent the basement granite and be used for the comparison.

246
An integrated presentation of these comparisons is illustrated in Figure 8, which was developed by calculating the root mean square of differences between measured and calculated heads. Results show that this approach reduces the number of model cases that need to be analysed, the variation of results from sensitivity analyses and the discrepancy between measured and calculated heads as site characterisation proceeds. Further testing and modelling in phases 2 and 3 will extend these results and may confirm or disprove the models generated at the end of phase 1.
Figure 8. Quantitative evaluation of the convergence of hydrogeological models
20
25
30
35
40
45
50
1 2 3 4 5 6 7 8 9 10 11 12 13 14 15 16 17 18 19 20 21 22 23 24 25 26 27 28 29 30 31 32
m
Number of model case
Step1 Step2
Step3 Step4
Conclusion and future study
In this study, stepwise site characterisation was carried out utilising a geosynthesis methodology, involving iterative development of data flow diagrams. For the particular case of hydrogeological characterisation, it is concluded that this methodology leads to an improved understanding of the deep hydrogeological environment that allows repository-relevant datasets to be produced in an efficient and traceable manner. This stepwise approach focusing site characterisations on the basis of structured geosynthesis methodology will be continued in Phase II and Phase III of the MIU project.
Acknowledgements
The authors would like to gratefully acknowledge the support of the large team of researchers and engineers involved in the MIU project.
References
1) Japan Nuclear Cycle Development Institute: “Master Plan of the Mizunami Underground Research Laboratory Project”, JNC TN7410 2003-001, (2002).
2) Japan Atomic Energy Commission (AEC), “Framework for Nuclear Energy Policy” (2005).
3) Sato, T., M. Imazu, S. Mikake, T. Tamai, M. Yamamoto, M. Sakamaki, “Current status of shaft sinking at the Mizunami Underground Research Laboratory”, Proceedings of SKB Excavation Workshop, (2003).
4) Itoigawa, J. “Geology of the Mizunami district, central Japan”, Monograph of the Mizunami Fossil Museum, 1, 1-50, (1980).
Roo
tmea
n sq
uare
of
the
diff
eren
ces
betw
een
mea
sure
d an
d ca
lcul
ated
hea
ds
[m]
Number of model case
247
5) Matsuzawa, I. T. Uemura, “Geotectonic studies on the Toki Miocene sedimentary basin, central Japan”, Journal of Earth and Planetary Sciences Nagoya University, 15, 35-79, (1967).
6) Japan Nuclear Cycle Development Institute (JNC), “H12: Project to Establish the Scientific and Technical Basis for HLW Disposal in Japan, Second Progress Report on Research and Development for the Geological Disposal of HLW in Japan”, JNC TN1410 2000-001, (2000).
7) Nuclear Waste Management Organization of Japan (NUMO), Evaluating Site Suitability for a HLW Repository: Scientific Background and Practical Application of NUMO Siting Factors, NUMO-TR-04-04, (2004).
8) Japan Nuclear Cycle Development Institute: “H17: Development and management of the technical knowledge base for the geological disposal of HLW, Supporting Report 1: Geoscience study”, JNC TN1400 2005-014, (2005).
9) Saegusa, H., Y. Seno, S. Nakama, T. Tsuruta, T. Iwatsuki, K. Amano, R. Takeuchi, T. Matsuoka, H. Onoe, T. Mizuno, T. Ohyama, K. Hama, T. Sato, M. Kuji, H. Kuroda, T. Seba, M. Uchida, K. Sugihara, M. Sakamaki, “Final Report on the Surface-based Investigation (Phase I) at the Mizunami Underground Laboratory Project”, JAEA-Research 2007-043, (2007).
10) Nagra: “Geosynthese Wellenberg 1996, Ergebnisse der Untersuchungsphasen I und II”, Nagra Technical Report NTB96-01 (1997).
11) Sugihara, K., K. Yanagizawa, H. Yoshioka, H. Osawa. “Development of an observation system and data acquisition for hydrological study –Shaft Excavation Effects (SEE) project in a sedimentary formation. In: Japan”, Proceedings of OECD NEA SEDE Workshop Helsinki, 9-11 September 1991, pp.154-165, (1991).
12) K. Yanagizawa, H. Imai, K. Huruya, M. Nishigaki, “The effect of a shaft excavation experiment on the hydrology of the Tono research field, Japan”, Journal of Hydrology, 171, pp.165-190, (1995).
13) Japan Nuclear Cycle Development Institute: “Regional Hydrogeological Study Project. Results from 1992-1999 Period”, JNC TN7400 2000-014, (2000).
14) Ohyama, T., H. Saegusa, H. Onoe, Y. Endo, “Stepwise Hydrogeological Modeling and Groundwater Flow Analysis on Site Scale (Step0 and Step1)”, JNC TN7400 2005-008, (2005).
15) Matsuoka, T., N. Kumazaki, H. Saegusa, K. Sasaki, Y. Endo, K. Amano, “The construction of geological model using an iterative approach (Step1 and Step2)”, JNC TN7400 2005-007, (2005).
16) Kumazaki, N., K. Ikeda, J. Goto, K. Mukai, T. Iwatsuki, R. Furue, “Synthesis of the Shallow Borehole Investigations at the MIU Construction Site”, JNC TN7400 2003-005, (2003).
17) Onoe, H., H. Saegusa, Y. Endo, “Stepwise Hydrogeological Modeling and Groundwater Flow Analysis on Site Scale (Step2)”, JNC TN7400 2005-006, (2005).
18) Nakano, K., K. Amano, S. Takeuchi, K. Ikeda, H. Saegusa, K. Hama, N. Kumazaki, T. Iwatsuki, S. Yabuuchi, T. Sato, “Working Program for MIZ-1 Borehole Investigations”, JNC TN7400 2002-008, (2003).
19) Tsuruta, T., K. Abumi, H. Mie, H. Fujishiro, Y. Fujita, “The DH-15 Borehole Investigations in the Regional Hydrogeological Study Project”, JNC-TN7400 2005-025, (2005).
20) Ota, K., S. Takeuchi, K. Ikeda, K. Amano, T. Matsuoka, T. Iwatsuki, S. Yabuuchi, T. Sato, “Overview of MIZ-1 Borehole Investigations”, JNC TN7400 2005-024, (2005).
21) Onoe, H., H. Saegusa, Y. Endo, “Stepwise Hydrogeological Modeling and Groundwater Flow Analysis on Site Scale (The Former Part of the Step3)”, JNC TN7400 2005-012, (2005).

248
22) Iwatsuki, T., R. Furue, H. Mie, S. Ioka, T. Mizuno, “Hydrochemical baseline condition of groundwater at the Mizunami underground research laboratory (MIU)”, Applied Geochemistry, 20, pp.2283-2302, (2005).
23) Onoe, H., H. Saegusa, T. Ohyama, Y. Endo, “Stepwise Hydrogeological Modeling and Groundwater Flow Analysis on Site Scale (Step4)”, JAEA-Research 2007-034, (2007).