stefan bringezu director research group material flows & resource management research foresight...
TRANSCRIPT

Stefan BringezuDirectorResearch Group Material Flows & Resource Management
Research foresight for Environment and SustainabilityWorkshop on mega-trends and surprises
EEA, Copenhagen, 14-15 May 2007
Environmentally important mega-trends

Ste
fan
Bri
ng
ezu
|
ww
w.w
up
peri
nst
.org
|
Rese
arc
h F
ore
sig
ht
15
-05
-20
07
Megatrends
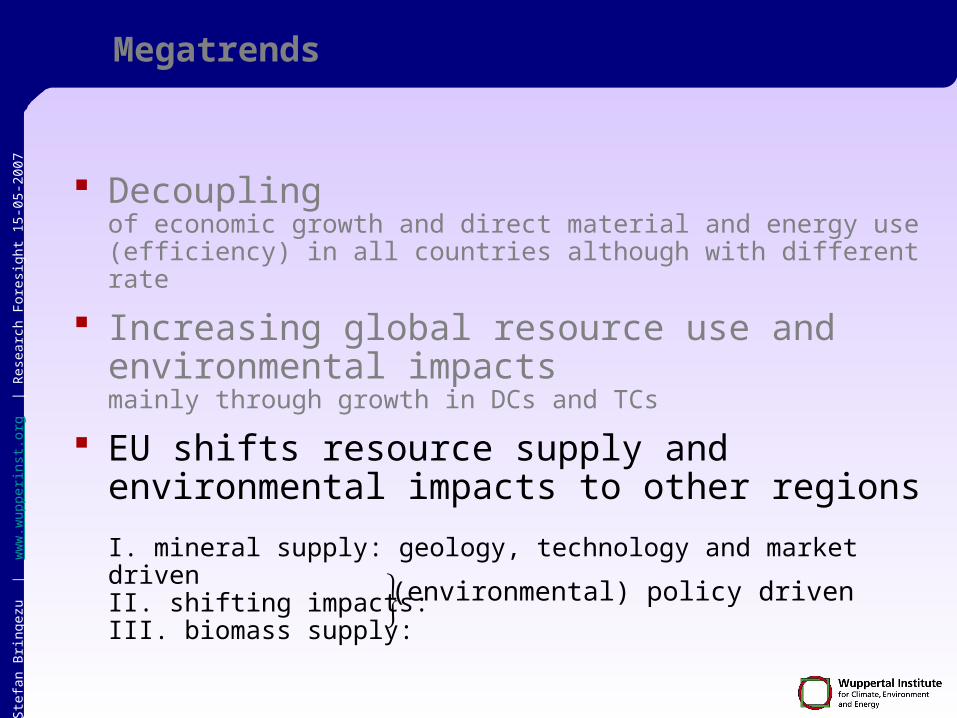
Decouplingof economic growth and direct material and energy use (efficiency) in all countries although with different rate
Increasing global resource use and environmental impactsmainly through growth in DCs and TCs
EU shifts resource supply and environmental impacts to other regionslike other old-industrial countries, while improving domestic environmental quality

Ste
fan
Bri
ng
ezu
|
ww
w.w
up
peri
nst
.org
|
Rese
arc
h F
ore
sig
ht
15
-05
-20
07
Decouplingof economic growth and direct material and energy use (efficiency) in all countries although with different rate
Increasing global resource use and environmental impactsmainly through growth in DCs and TCs
EU shifts resource supply and environmental impacts to other regionslike other old-industrial countries, while improving domestic environmental quality
Megatrends

Ste
fan
Bri
ng
ezu
|
ww
w.w
up
peri
nst
.org
|
Rese
arc
h F
ore
sig
ht
15
-05
-20
07
Decoupling of resource use and environmental pressures
80
85
90
95
100
105
110
115
120
125
130
1990 1991 1992 1993 1994 1995 1996 1997 1998 1999 2000 2001 2002
Index 1990=100 Gross domestic product at market prices [Millions of euro (at 1995 prices and exchange rates)]
Gross inland energy consumption [Thousands tonnes of oil equivalent (TOE)]
Emission of greenhouse gases [Global warming potential, CO2 equivalent, 1000 tonnes]
EMC (environmentally weighted material consumption) [Normalised (World 95) and equally weighted scores]
DMC [1000 tonnes]
Source: Eurostat NewCronos online database (GDP, energy, greenhouse gas emissions); van der Voet et al. 2004 (EMC); Eurostat/IFF 2004 (DMC); see also EEA Report no. 9/2005: Figure 3.3, p.20
EU15

Ste
fan
Bri
ng
ezu
|
ww
w.w
up
peri
nst
.org
|
Rese
arc
h F
ore
sig
ht
15
-05
-20
07
Decoupling aggregate material use and GDP
Source: EEA report 4/2005
06
47
e
Technological progress needs time: Given a certain rate of increase of material productivity (GDP/material use) relative decoupling is higher with lower rates of economic growth
GDP growth p.a.: 2.3 % (EU15), 3.5 % (EU-10) GDP growth p.a.: 1.6 % (EU15), 3.2 % (EU-10)

Ste
fan
Bri
ng
ezu
|
ww
w.w
up
peri
nst
.org
|
Rese
arc
h F
ore
sig
ht
15
-05
-20
07
Decouplingof economic growth and direct material and energy use (efficiency) in all countries although with different rate
Increasing global resource use and environmental impactsmainly through growth in DCs and TCs
EU shifts resource supply and environmental impacts to other regionslike other old-industrial countries, while improving domestic environmental quality
Megatrends

Ste
fan
Bri
ng
ezu
|
ww
w.w
up
peri
nst
.org
|
Rese
arc
h F
ore
sig
ht
15
-05
-20
07
0
10
20
30
40
50
60
70
80
90
1980 1985 1990 1995 2000 2005 2010 2015 2020
Billion Tons
Biomass Coal Crude Oil Natural Gas Metal Ores Ind. & Constr. Minerals
Worldwide used extraction of resources
MOSUS Baseline scenario
Source: SERI; Giljum et al. 2007

Ste
fan
Bri
ng
ezu
|
ww
w.w
up
peri
nst
.org
|
Rese
arc
h F
ore
sig
ht
15
-05
-20
07
Total material requirement and economic growth
1
1
0
20
40
60
80
100
120
0 5 10 15 20 25 30 35GDP per capita in `000 US$
TMR per capita in TonsV JP
USA
Japan
Finland
Netherlands
West-D
Czech Republic
Poland
China West-GermanyEU
UK
Italy
Germany
TMR per cap. in t
Source: different sources and Bringezu and Schütz 2001
Ste
fan
Bri
ng
ezu
|
ww
w.w
up
peri
nst
.org
|
Rese
arc
h F
ore
sig
ht
15
-05
-20
07
Decouplingof economic growth and direct material and energy use (efficiency) in all countries although with different rate
Increasing global resource use and environmental impactsmainly through growth in DCs and TCs
EU shifts resource supply and environmental impacts to other regions
I. mineral supply: geology, technology and market drivenII. shifting impacts: III. biomass supply:
Megatrends
(environmental) policy driven

Ste
fan
Bri
ng
ezu
|
ww
w.w
up
peri
nst
.org
|
Rese
arc
h F
ore
sig
ht
15
-05
-20
07
The EU has a growing net demand of foreign resources
PTB absolute
PTB of HF
PTB of TMR trade
Million tonnes
Source: Schütz et al. 2003
Physical trade balance of EU-15 considering hidden flows of imports and exports
Ste
fan
Bri
ng
ezu
|
ww
w.w
up
peri
nst
.org
|
Rese
arc
h F
ore
sig
ht
15
-05
-20
07
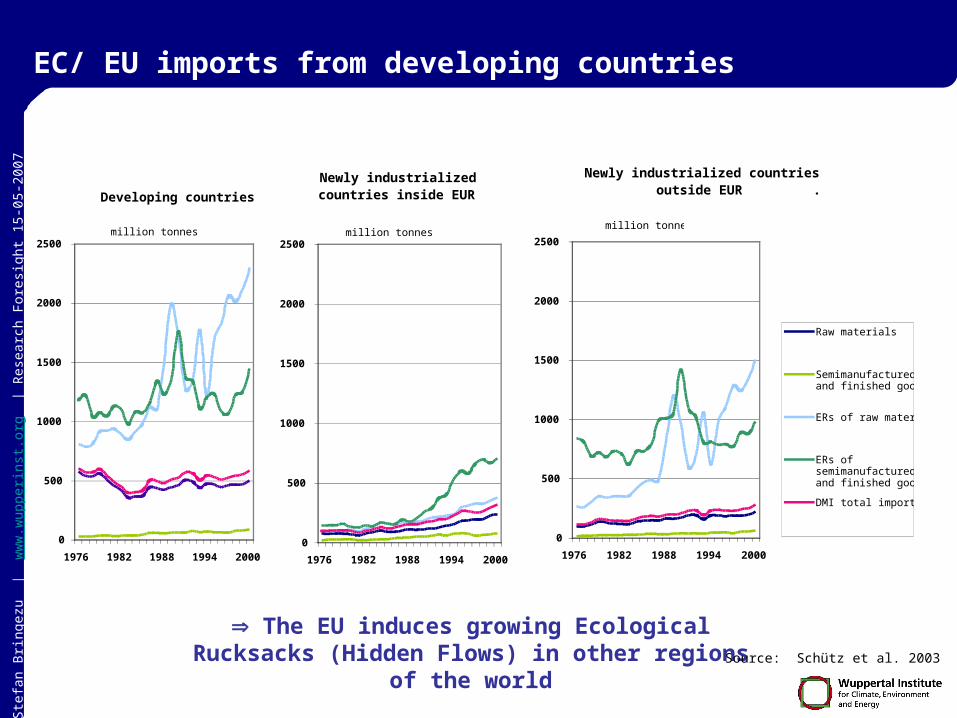
EC/ EU imports from developing countries
Developing countries .
0
500
1000
1500
2000
2500
1976 1982 1988 1994 2000
million tonnes
Newly industrialized . countries inside EUR .
0
500
1000
1500
2000
2500
1976 1982 1988 1994 2000
million tonnes
Newly industrialized countries . outside EUR .
0
500
1000
1500
2000
2500
1976 1982 1988 1994 2000
Raw materials
Semimanufacturedand finished goods
ERs of raw materials
ERs ofsemimanufacturedand finished goods
DMI total imports
million tonnes
The EU induces growing Ecological Rucksacks (Hidden Flows) in other regions of the world Source: Schütz et al. 2003

Ste
fan
Bri
ng
ezu
|
ww
w.w
up
peri
nst
.org
|
Rese
arc
h F
ore
sig
ht
15
-05
-20
07
Resource-intensive imports from “Anchor countries”- MOSUS baseline EU-25
Resource intensive imports will increase
0
50
100
150
200
250
1990 1992 1994 1996 1998 2000 2002 2004 2006 2008 2010 2012 2014 2016 2018 2020
in billion US$
Turkey Mexico China Indonesia India Thailand Argentina Brasil
Source: SERI; Giljum et al. 2007

Ste
fan
Bri
ng
ezu
|
ww
w.w
up
peri
nst
.org
|
Rese
arc
h F
ore
sig
ht
15
-05
-20
07
Ever decreasing ore grades are going to be used
Source: U. Dorner after PreConsultants 2002

Ste
fan
Bri
ng
ezu
|
ww
w.w
up
peri
nst
.org
|
Rese
arc
h F
ore
sig
ht
15
-05
-20
07
Environmental Impact of Copper Mine Ok Tedi Mine, Papua New Guinea
These images show environmental impact of the mine
• 1990: Both the mine and township of Tabubil, are clearly visible
• 2004: Raised river beds, forest damage and decline in biodiversity are some impacts

Ste
fan
Bri
ng
ezu
|
ww
w.w
up
peri
nst
.org
|
Rese
arc
h F
ore
sig
ht
15
-05
-20
07
Shifting problems: the case of Platinum Group Metals
* Assumptions: 1.4-2 L cylinder capacity, Euro III, 3.5 g PGM / car, 100 000 km / car during lifetime, -1.8 g NOx / km, -0.07 g CH4 / km, +1 g CO2 / km
The use of primary PGM in Europe implies:
• extremely high SO2 emissions in Siberia (outdated technology for the smelting process)
• high CO2 emissions in South Africa (92 % of power generation from coal)
• extreme amounts of TMR and related mining waste
For the production of 1 t primary PGM
• 1800 t SO2eq emissions
• 23 450 t CO2eq emissions
• 388 600 t TMReq
… occur concentrated in other regions
Source: Mathieu Saurat and Stefan Bringezu
1 t primary PGM used in car catalysts* would help to avoid
• 51 400 t NOx 36 000 t SO2eq
• 2000 t CH4 (28 600 t CO2eq) 17 400 t CO2eq
… diffusely emitted in Europe
equivalent to
equivalent to+ increased fuel cons. net effect

Ste
fan
Bri
ng
ezu
|
ww
w.w
up
peri
nst
.org
|
Rese
arc
h F
ore
sig
ht
15
-05
-20
07
Global land use for consumption of agricultural goods in 1.000 m2/cap
Source: Bringezu 2005 / Steger 2005
Ste
fan
Bri
ng
ezu
|
ww
w.w
up
peri
nst
.org
|
Rese
arc
h F
ore
sig
ht
15
-05
-20
07
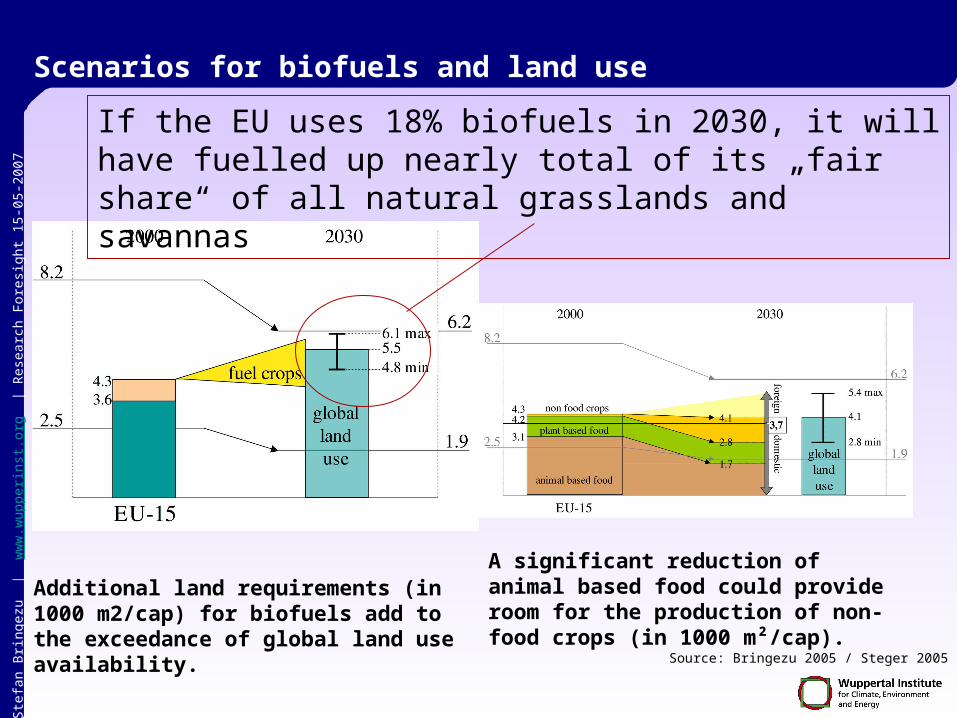
Scenarios for biofuels and land use
Additional land requirements (in 1000 m2/cap) for biofuels add to the exceedance of global land use availability.
A significant reduction of animal based food could provide room for the production of non-food crops (in 1000 m²/cap).
Source: Bringezu 2005 / Steger 2005
If the EU uses 18% biofuels in 2030, it will have fuelled up nearly total of its „fair share“ of all natural grasslands and savannas
Ste
fan
Bri
ng
ezu
|
ww
w.w
up
peri
nst
.org
|
Rese
arc
h F
ore
sig
ht
15
-05
-20
07
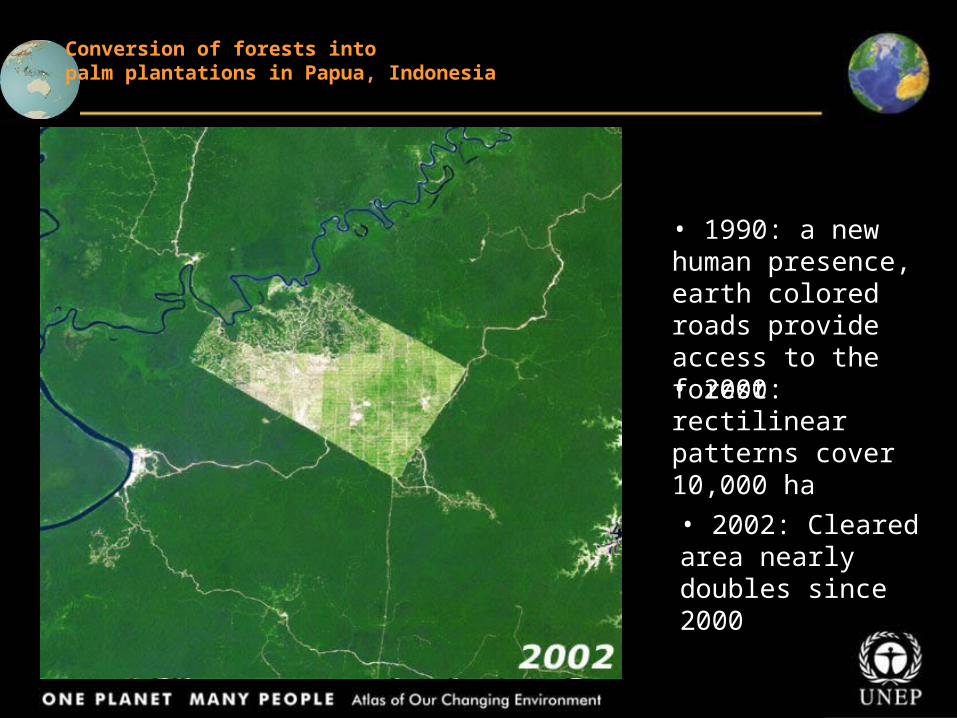
Conversion of forests into palm plantations in Papua, Indonesia
• 1990: a new human presence, earth colored roads provide access to the forest
• 2000: rectilinear patterns cover 10,000 ha
• 2002: Cleared area nearly doubles since 2000
Ste
fan
Bri
ng
ezu
|
ww
w.w
up
peri
nst
.org
|
Rese
arc
h F
ore
sig
ht
15
-05
-20
07
Conclusions
We need more information on
the EU´s global resource use- material resources- land use
shifts of burden to regions outside the EU- environmental impacts- socio-economic implications- security issues
potentials for absolute reduction and a more balanced pattern of domestic and foreign resource use