steam reforming of oxygenated hydrocarbons for hydrogen ...glycerol steam reforming (effect of...
TRANSCRIPT

0
Steam Reforming of
Oxygenated Hydrocarbons
for Hydrogen Production
MOHAMMAD TAZLI AZIZAN
A thesis submitted for the Degree of Doctor of Philosophy and the Diploma of Imperial College London
Department of Chemical Engineering Faculty of Engineering
Imperial College London

1
ABSTRACT
Hydrogen is widely used in petrochemical industries as a feedstock for the production of
other chemicals and is considered as economical and environmentally safe for industrial use.
However, the existing production of hydrogen from natural gas steam reforming is not
sustainable due to the depleting feedstock of natural gas. One of the proposed strategies to
overcome this issue is to utilise oxygenated hydrocarbons derived from biomass sources that
have undergone similar reforming. In this doctoral research, it is of interest to see whether the
selected oxygenates, i.e. ethanol, ethylene glycol, propylene glycol and glycerol, are able to
be co-fed with natural gas in a steam reforming process in the future. It is also aimed to
determine whether a cost-effective catalyst can be used to produce high yields of hydrogen
from these oxygenates. In addition, this catalyst is hoped to be stable for long operational
hours. For the purpose of this doctoral research, simulation studies and experimental work
were carried out to investigate the thermodynamic properties of the steam reforming reaction
of ethanol to glycerol homologues and the catalytic activity of Ca doped Ni/Al2O3 catalyst to
the respective process. The simulation studies involved thermodynamic equilibrium analysis
using the Gibbs energy minimisation method via Aspen-HYSYS. It was discovered that
ethanol and ethylene glycol might produce high hydrogen yield since both hydrocarbons have
two carbon atoms, hence the reactions are not as complex as propylene glycol and glycerol.
The experimental studies were conducted for all four oxygenates using a commercially
available catalyst, known as Hi-FUEL R110 (Hi-FUEL). The main purpose of these
experimental studies was to investigate the reaction feasibility and make comparisons against
the simulations. The catalyst used for these experiments consisted of nickel (18 wt. %),
calcium (12 wt. %) and alumina. Hi-FUEL was tested with variable parametric studies in
glycerol steam reforming (effect of space-time, reaction temperature, steam partial pressure)
to identify the intermediates produced in the reaction, and, eventually, to understand the
reaction pathway of glycerol reforming via this particular catalyst. Some other catalysts were
also prepared (xCa/Al2O3 and 15 wt. % Ni on xCa/Al2O3) and characterised. These catalysts
were tested for glycerol steam reforming, together with another commercial catalyst of
Ni/Al2O3 to validate the reactions involved in the Hi-FUEL catalyst and to further optimise
the calcium doped nickel/alumina catalyst for the high selectivity of hydrogen. The spent
catalysts were analysed to quantify any coke formed on the surface of the catalyst. This work
revealed that a high hydrogen yield and selectivity could be achieved over a Ca doped
Ni/Al2O3 catalyst in comparison to the typical Ni/Al2O3 catalyst. However, a high CO yield

2
was produced with an increasing Ca/Ni ratio due to the hydrogenolysis reaction. It should be
highlighted that hydrogenolysis was found to be favourable under the influence and presence
of calcium. The coke formed was mainly from CO as its precursor, which, in turn, produced
amorphous and filamentous carbons that are not only easily regenerated but would not easily
deactivate the catalyst. Due to the discovery of value added chemicals as the intermediates
from this study and their reaction pathways, it is recommended that the Ca doped Ni/Al2O3
catalyst be tested in the aqueous phase reforming as part of the integrated bio-refinery
concept in the future.

3
ACKNOWLEDGEMENTS
My utmost gratitude and praise to Allah, the God Almighty for enabling me to continue my
PhD journey despite all the challenges that I endured throughout the journey. He instilled a
high spirit in me and a never-ending self-motivation to finish what I started four years ago.
My special thanks to both of my supervisors, Dr Klaus Hellgardt and Professor David
Chadwick for their guidance, encouragement and valuable advice throughout this course. I
have been given chances and support to fulfil my potential and my appreciation goes to them
for understanding the challenges that I faced throughout these years. My special
acknowledgement goes to my employer, Universiti Teknologi PETRONAS, for approving
my study leave and allowing me to follow up on my PhD at Imperial College together with
fiscal and technological documentation, as well as my utmost gratitude to the Commonwealth
Scholarships for the scholarship granted to fund my study at Imperial College.
My special thanks to Dr Zhang Dazhi and Dr Sami Barri for all the assistance and guidance
in the laboratory. This likewise goes to my lab mates, Raul, Diana, Kai, and Saeed, for
always being there whenever I called for help and for sharing the happy and sad moments
together. I will definitely miss the time spent together in the lab. I would also like to
acknowledge Susi Underwood for always being there to assist me in postgraduate and
registration matters due to the continuous interruption of my studies, as well as Dr Patricia
Carry for technical support in the analytical lab. Many thanks to Dr Hellgardt’s research
group members and my officemates for being my friends and acquaintances at the
department. My special thanks to Sharmini Abdullah for spending her time proofreading my
thesis chapter by chapter, even though she herself was busy with her PhD and with children
to look after. I must note here that she aided me with this at no cost at all, and may Allah
bless you and ease your PhD journey.
My heartfelt thanks to my many Malaysian friends who lived in London and elsewhere in the
United Kingdom; whether working or pursuing their undergraduate, masters or PhD studies
for being part of my big family in the UK. I will never forget the time spent together during
weekends and holidays and for being good listeners at times when I was feeling down. My
sincere thanks to my friends and relatives in Malaysia who are always offering their prayers
for my successful journey, especially my Facebook friends.

4
This PhD is a family affair and I would not have been successful without their strong support.
My wholehearted love goes to my beloved mother, Hasiah Harun for her continuous love and
care and to my mother-in-law, Raja Norhamidah as both of them boarded planes from
Malaysia on numerous occasions to spend their time looking after my children whenever my
wife and I had to go to the lab. Similarly, this goes to my siblings and brothers-in-law for
always being there for us, especially Adi who spent many months with us, fetching the
children from school and preparing dinner for us. This also goes for my father-in-law, Dr
Buang, who is also a PhD holder and an associate professor in his field, for his countless
advice, and my special gratitude goes to my beloved and respected dad, Azizan Saleh, for his
financial assistance whenever I needed help and who I know offered daily prayers asking
Allah for my success in my PhD.
My thesis is dedicated wholeheartedly to my beloved wife, Putri Nurizatulshira, who is
always there by my side in the happy and sad moments; for her willingness to leave her
career just for the sake of being with me, taking care of our children and always instilling in
them that their daddy is a hero to the family. She is my wife, a loving and caring mother to
my children and my best friend forever. Your time to complete the PhD will be very soon,
that is my prayer for you my dear.
To Amanina, Falah, and Nurhan and to Ihsan, ‘Abi’ loves you so much and all of you mean
so much to me and your mother. All of you are my strong motivation to complete this PhD
journey because I want to continuously be your hero and your role model.

5
THE JOURNEY
Once I graduated from the University of Sheffield for my BEng and Newcastle University for
my MSc, I learnt how chemical engineering knowledge is very valuable to me, and, hence,
inspired me to become an academician in my own country, Malaysia. To become a capable
academician and researcher, I therefore needed to pursue my PhD, hence, my reason for
returning to the UK, this time to Imperial College London. However, this is not what I
wanted to share here. This PhD is not only a journey to climb the career ladder as an
academician. It is a spiritual journey, the toughest that I have encountered so far in my life. I
started my PhD in October 2009. My wife in her third pregnancy had to forget her career the
first time we arrived here since she was not allowed unpaid leave to accompany me here. I
was a young father with two going to be three kids at the age of 28 when I started my PhD.
We left our big family, big home and luxurious car in Malaysia and commenced to hold out
for another four years in a little apartment in London. Without any other family members
except us, this left me juggling between the household and my PhD work. I had to make sure
while doing my PhD that the needs of my wife and children would never be overlooked.
Paying a high rent and rationing food were part of the price to pay, but it did not deter me
from moving forward.
As time moved on, things went as usual until one day I was infected with scarlet fever or
scarlatina, a rare disease today. It was for a month prior to my MPhil to PhD transfer exam.
My two sons were also infected and one of them had to be hospitalised for the antibiotic
course. Fortunately, I managed to pass my transfer exam. Afterwards, my wife began her
PhD in Petroleum Engineering and my family members from Malaysia had a rotating
schedule to get to London to look after our children. Unfortunately, I was again infected with
a dental related illness, which consumed three weeks of my precious time as I was bedridden.
After a month, the third disease attacked me, which was related to arthritis, and about which
neither my GP nor I had any idea about until then. I was a healthy person back in Malaysia
and again I was prevented from doing my PhD work for a few weeks until finally being
cured.
Starting from then, I tried to lead a healthy life and felt much more active and healthy. I was
enjoying the third year of my PhD, collecting and analysing data from the experimental
works, until one day, disaster struck when our lab caught fire due to a hydrogen explosion. I
was demoralised and demotivated from not being able to retrieve anything. I made up my

6
mind to go back to Malaysia, to meet my employer and request for an extension and to do
some analytical works there. However, after I got my catalysts out of the affected lab to be
brought back together to Malaysia, a further incident happened when a postgraduate student
fell from the window of my office while watching the Skyfall 007 red carpet moment outside
the Royal Albert Hall; apparently she ruined my catalysts located on my desk. Some of the
prepared and spent catalysts were ruined and were not able to be salvaged. I was later
interrupted from my PhD for 5 months, and not able to do any further experiments.
One fine day during my period of interruption, my wife found that she was pregnant for the
fourth time, which was unplanned. I consulted with my supervisors on the results and the data
that I received earlier and decided to start writing my thesis. My wife wanted to deliver the
baby in Malaysia and switched her PhD program to Malaysia for reasons of childcare, and we
went back there during my writing up period. Again, my stress moment arrived when I
continued struggling with my writing and juggling with taking care of the children and doing
the household chores, since my wife was heavily pregnant, but, finally, I was able to
complete the whole draft for submission.
This journey taught me about patience, love and being benevolent to others. There are things
in this world that I cannot control and I seek forgiveness and help from the God Almighty. I
have learnt that everything happens for a reason and that this PhD journey is just a sign that
we might not get everything that we want, but whatever we do have, are the most precious
things that no other people might have. However depressed and unlucky I was throughout my
PhD progress, the most important thing is that my wife, my children and my family members
and friends were always there to support me and it is my responsibility to care for them the
most. There is no point in me venting my anger at them, even though I had arrived at my
lowest point in life. I learnt to balance between the work and family matters, and there is
nothing more important than a strong family bond.
My wife quoted this and I want to share it here:
“Sometimes all He wanted us to learn was the meaning of endurance and patience.
When we feel like we cannot go on anymore, that is when we have to endure a little bit
more. When we thought things could not get any worse that is when we have to be patient
with the tides that keep on coming. May this lesson enable us to endure the ever-challenging
and testing life of this world. And to be patient and have patience with anything that will be
inflicted upon us throughout our life until it finally ends.”

7
DECLARATION OF ORIGINALITY
I hereby declare that this thesis and the work reported herein was composed by and originated
entirely from me. Information derived from the published and unpublished works of others
has been acknowledged in the text and the relevant references are included in this thesis.
Mohammad Tazli Azizan
Imperial College London, March 2014
COPYRIGHT DECLARATION
The copyright of this thesis rests with the author and is made available under a Creative
Commons Attribution Non-Commercial No Derivatives licence. Researchers are free to copy,
distribute or transmit the thesis on the condition that they attribute it, that they do not use it
for commercial purposes and that they do not alter, transform or build upon it. For any reuse
or redistribution, researchers must make clear to others the licence terms of this work.

8
TABLE OF CONTENTS
ABSTRACT .............................................................................................................................. 1
ACKNOWLEDGEMENTS .................................................................................................... 3
THE JOURNEY ....................................................................................................................... 5
DECLARATION OF ORIGINALITY .................................................................................. 7
COPYRIGHT DECLARATION ............................................................................................ 7
TABLE OF CONTENT ........................................................................................................... 8
LIST OF TABLES ................................................................................................................. 14
LIST OF FIGURES ............................................................................................................... 17
LIST OF ABBREVIATIONS ............................................................................................... 26
LIST OF SYMBOLS ............................................................................................................. 30
CHAPTER 1: INTRODUCTION ......................................................................................... 33
1.1 Research Objectives ....................................................................................................... 37
1.2 Thesis Description .......................................................................................................... 41
1.3 References ...................................................................................................................... 43
CHAPTER 2: LITERATURE REVIEWS .......................................................................... 46
2.1 Oxygenated Hydrocarbons ............................................................................................. 46
2.1.1 Ethanol ..................................................................................................................... 46
2.1.2 Glycerol ................................................................................................................... 47
2.1.3 Ethylene Glycol and Propylene Glycol ................................................................... 47
2.2 Reforming Technology .................................................................................................. 48
2.2.1 Steam Reforming ..................................................................................................... 48
2.2.2 Catalytic Reforming ................................................................................................ 54
2.2.3 Autothermal Reforming........................................................................................... 54
2.2.4 Dry Reforming......................................................................................................... 57
2.2.5 Partial Oxidation ...................................................................................................... 58

9
2.2.6 Aqueous Phase Reforming ...................................................................................... 59
2.3 Thermodynamic Analysis of Oxygenated Hydrocarbons Reforming ............................ 61
2.4 Reactor Technology ..................................................................................................... 63
2.5 Catalyst Development .................................................................................................... 66
2.5.1 Nickel Catalyst ........................................................................................................ 66
2.5.2 Noble Metals and Other Catalysts ........................................................................... 69
2.5.3 Effect of Promoters.................................................................................................. 71
2.5.4 CO 2 Sorption Materials ........................................................................................... 72
2.6 Catalyst Preparation Methods ........................................................................................ 73
2.7 Catalyst Deactivation ..................................................................................................... 76
2.7.1 Coking ..................................................................................................................... 76
2.8 Conclusion on Literature Review ................................................................................... 78
2.9 References ...................................................................................................................... 79
CHAPTER 3: THERMODYNAMIC ANALYSIS ............................................................. 96
3.1 Theoretical Approach ..................................................................................................... 96
3.2 Simulation Layout ........................................................................................................ 100
3.3 Model Validation .......................................................................................................... 103
3.3.1 This Work versus Authayanun et al. (2010) ......................................................... 103
3.3.2 This Work versus Rossi et al. (2009) .................................................................... 104
3.3.3 This Work versus Adhikari et al. (2007) ............................................................... 105
3.4 Comparison of Property Packages ............................................................................... 107
3.5 Autothermal Reforming at Thermoneutral Condition Study ....................................... 108
3.5.1 Self-sustainability Study & Effect of Reactor Inlet Temperature ........................ 108
3.5.2 Effect of O/C Ratio ............................................................................................... 114
3.6 Steam Reforming Study ............................................................................................... 117
3.6.1 Effect Steam to Fuel Molar Ratio ......................................................................... 117
3.6.2 Effect of Temperature ........................................................................................... 120

10
3.6.3 Case Study: A Comparison on Thermodynamic Analysis Study of Ethanol and
Glycerol Steam Reforming ............................................................................................ 122
3.7 Steam Reforming Study: Investigation at Real Experimental Conditions ................... 126
3.8 Conclusion .................................................................................................................... 127
3.9 References .................................................................................................................... 129
CHAPTER 4: CATALYST CHARACTERIZATION AND GENERAL
EXPERIMENTAL SETUP ................................................................................................ 132
4.1 Introduction .................................................................................................................. 132
4.2 Catalyst Preparation and Characterization ................................................................... 132
4.3 Characterization Results ............................................................................................... 134
4.3.1 XRF and BET Analysis ........................................................................................ 134
4.3.2 Temperature Program Reduction Analysis (TPR) ................................................ 135
4.3.3 Field Emission Scanning Electron Microscopy (FESEM) & Transmission Electron
Miscroscopy (TEM) ....................................................................................................... 140
4.4 Experimental Setup ...................................................................................................... 144
4.4.1 General Process Description ................................................................................. 146
4.4.2 Catalyst Loading ................................................................................................... 148
4.4.3 Study of Mass and Heat Transfer Limitation ....................................................... 148
4.4.4 Pressure Drop Calculations .................................................................................. 154
4.4.5 Catalyst Reduction ................................................................................................ 156
4.4.6 Catalyst Test ......................................................................................................... 156
4.4.7 Products Sampling ................................................................................................ 158
4.4.8 Products Analysis ................................................................................................. 159
4.4.9 Shutting Down Procedures ................................................................................... 159
4.5 Conclusions .................................................................................................................. 160
4.6 References .................................................................................................................... 161
CHAPTER 5: STEAM REFORMING OF OXYGENATED HYDROCARBON
HOMOLOGUES OVER HI-FUEL CATALYSTS........................................................... 162

11
5.1 Introduction .................................................................................................................. 162
5.2 Experimental Setup and Calculations .......................................................................... 162
5.3 Ethanol Steam Reforming over Hi-FUEL catalyst ..................................................... 163
5.4 Ethylene Glycol and Propylene Glycol Steam Reforming over Hi-FUEL catalyst .... 167
5.5 Glycerol Steam Reforming over Hi-FUEL catalyst .................................................... 172
5.6 Water Gas Shift Reaction over Hi-FUEL catalyst ...................................................... 174
5.7 Conclusions .................................................................................................................. 176
5.8 References .................................................................................................................... 178
CHAPTER 6: GLYCEROL STEAM REFORMING: THERMODYNAMIC STUDIES
& REACTION PATHWAY INVESTIGATION ............................................................. 180
6.1 Introduction .................................................................................................................. 180
6.2 Experimental Setup and Calculations .......................................................................... 181
6.3 Glycerol Blank Test Study ........................................................................................... 182
6.4 Glycerol Steam Reforming over Hi-FUEL at 400 oC ................................................. 187
6.5 Effect of Adding External Hydrogen on Glycerol Steam Reforming at 400 oC ......... 193
6.6 Glycerol Steam Reforming over Hi-FUEL at 600 oC ................................................. 196
6.7 Effect of Reaction Temperature to Glycerol Steam Reforming over Hi-FUEL ......... 202
6.8 Effect of Steam to Glycerol Ratio to Glycerol Steam Reforming over Hi-FUEL ...... 207
6.9 Comparison between Hi-FUEL and Commercial Ni/Al2O3 on Glycerol Steam
Reforming .......................................................................................................................... 209
6.10 Time on Stream (TOS) Analysis on Glycerol Steam Reforming over Hi-FUEL ..... 213
6.11 Conclusions ............................................................................................................... 215
6.12 References ................................................................................................................. 218
CHAPTER 7: EFFECT OF DOPING CALCIUM TO NICKEL/ALUMINA
CATALYST IN GLYCEROL STEAM REFORMING ................................................... 221
7.1 Introduction .................................................................................................................. 221
7.2 Comparison between Synthesised Ni/Al2O3 and Commercial Ni/Al2O3 ..................... 221

12
7.3 Effects of Calcium Loading to Alumina ..................................................................... 223
7.4 Effect of Calcium Loading to Nickel/Alumina Catalyst ............................................. 232
7.5 Comparison with Other Group II Metals as Promoter on Ni/Al2O3, Ni-Based or
Alumina Supported Catalysts ............................................................................................ 235
7.6 Proposed Reaction Pathway of Glycerol Steam Reforming over Ni-Ca/Al2O3
(Hi-FUEL) .......................................................................................................................... 237
7.7 Conclusions ................................................................................................................. 240
7.8 References ................................................................................................................... 241
CHAPTER 8: COKE FORMATION STUDY AND ANALYSIS ................................... 243
8.1 Introduction .................................................................................................................. 243
8.2 The Study of Carbon Deposition on Hi-FUEL Catalyst from Steam Reforming of
Oxygenated Hydrocarbons ................................................................................................ 243
8.3 Coke Analysis for Ethanol Steam Reforming over Hi-FUEL catalyst ....................... 245
8.4 Glycerol Steam Reforming over Hi-FUEL at 400 and 600 oC .................................... 251
8.5 Coke Study on Glycerol Steam Reforming over Hi-FUEL at various temperatures .. 259
8.6 Carbon Formation at Elevated Steam Partial Pressure ................................................ 261
8.7 Comparison on Coke Deposition between Ni/Al2O3 and Ni-Ca/Al2O3 Catalysts ...... 262
8.8 Comparison on Carbon Production for Synthesised Ni/Al2O3 (NiAl(S)) and
Commercial Ni/Al2O3 (NiAl(C)) ....................................................................................... 264
8.9 The Effects of Calcium Loadings to The Carbon Production ..................................... 264
8.10 Carbon Formation on Calcium Doped Nickel/Alumina ........................................... 266
8.11 Conclusions ............................................................................................................... 270
8.12 References ................................................................................................................. 271
CHAPTER 9: CONCLUSIONS, LIMITATIONS OF STUDIES AND
RECOMMENDATIONS FOR FUTURE WORK ........................................................... 274
9.1 Overall Conclusions ..................................................................................................... 274
9.1.1 Thermodynamic Equilibrium Study ..................................................................... 275
9.1.2 Oxygenated Hydrocarbons Suitability .................................................................. 276
13
9.1.3 Glycerol Steam Reforming over Hi-FUEL Catalyst ............................................ 277
9.1.4 Hi-FUEL versus NiAl(C) ...................................................................................... 278
9.1.5 The Influence of Calcium Doped on Ni/Al2O3 Catalyst ....................................... 278
9.1.6 The Coke Deposition Studies ............................................................................... 279
9.2 Limitations and Future Improvement .......................................................................... 280
9.2.1 Thermodynamic Equilibrium Study with Coke Formation Analysis ................... 280
9.2.2 Experimental Setup .............................................................................................. 280
9.2.3 Kinetic Analysis Regime ...................................................................................... 280
9.2.4 Limited Tests of Other Catalysts .......................................................................... 281
9.2.5 TGA and XRD Limitations .................................................................................. 282
9.3 Limitations and Future Improvement .......................................................................... 283
9.3.1 Extended Study on Kinetic Analysis of Glycerol Steam Reforming over Hi-FUEL
........................................................................................................................................ 283
9.3.2 Extended Study on Comparison of Hi-FUEL with NiAl(C) and Other Prepared
Catalysts (15Ni3Ca, 15Ni7Ca) ...................................................................................... 283
9.3.3 Exploration of Group II Doped to Nickel/Alumina Catalyst on Glycerol Steam
Reforming ...................................................................................................................... 284
9.3.4 Comparisons of Calcium Doped on Ni/Al2O3 and Noble Metals ......................... 285
9.3.5 Comparison of Hi-FUEL with Ni/Al2O3 and The Prepared Catalysts on Other
Oxygenates Steam Reforming ........................................................................................ 285
9.3.6 Ethylene Glycol Steam Reforming Detailed Study and Analysis ........................ 285
9.3.7 Autothermal Steam Reforming of Oxygenated Hydrocarbons over Calcium Doped
Nickel/Alumina Catalyst ............................................................................................... 286
9.3.8 Aqueous Phase Reforming or Supercritical Water Reforming of Glycerol and
Glycerol Hydrogenolysis for The Production of Value Added Chemicals over Calcium
Doped Ni/Alumina Catalyst ........................................................................................... 286
9.4 References ................................................................................................................... 287
APPENDIX .......................................................................................................................... 290

14
LIST OF TABLES
Table 3.1 Components predicted as reactor effluents for the homologues
Table 3.2 Vaporiser temperature and reactants’ flow rates setting for simulated
oxygenated hydrocarbons
Table 3.3
Table 3.4
Summary of bond enthalpies calculations for each homologue
x,y,z values of the oxygenate homologues with the respective ratios and
hydrogen molar flow rate at 600 oC for both conditions (O/C=0 and
O/C=0.75)
Table 3.5 Conditions set for Aspen-HYSYS simulation based on the experimental
setup
Table 3.6 Simulation results based on real experimental conditions for ethanol,
ethylene glycol and propylene glycol
Table 3.7 Simulation results based on real experimental conditions for glycerol
Table 4.1 Catalysts’ elemental and morphology properties analysis (* as measured by
XRF Spectroscopy, **
as measured by BET Analyser)
Table 4.2 Hydrogen adsorption peaks of metal elements after reduction using the
(TPR) method
Table 4.3 Reynolds number of the homologues studied at different particle size
Table 4.4 Reynolds number after dilution with 750 microns size of SiC
Table 4.5 The binary diffusion, Dm , Schmidt number (Sc), Peclet number (Pe) and
Bodenstein (Bd) number of respective oxygenates in diluted catalyst bed
Table 4.6 Experimental Data for Thiele Modulus calculations
Table 4.7 The pressure drop calculations based on Ergun Equation
Table 4.8 Products Expected from Oxygenated Hydrocarbons Steam Reforming
15
Table 5.1 Corresponding WHSV and residence time for each catalyst loading at fixed
reactants flow rate of 4.48 g/hour (GHSV=800 cm3 flow/cm
3 bed hour)
Table 5.2 Comparison of results obtained from this work and other research works on
ethanol steam reforming over Ni-Ca/Alumina catalyst
Table 5.3 CO conversion and H2 yield in blank test of water-gas shift reaction
Table 5.4 CO conversion, H2 yield, and CO2 yield of the water-gas shift reaction in the
presence of Hi-FUEL catalyst
Table 6.1 Corresponding WHSV and space-time for each catalyst loading at fixed gas
flow rate of 7.65 g/hr (with N2) and GHSV=2220 cm3
gas flow/cm3
bed volume hr
Table 6.2 Glycerol conversion, X (%) from glycerol steam reforming at 600 oC over
Hi-FUEL catalyst
Table 6.3 The selectivity of hydrocarbons produced at 400 oC and atmospheric
pressure
Table 6.4 Glycerol conversion, X (%) from glycerol steam reforming at 600oC over
Hi-FUEL catalyst
Table 6.5
Table 6.6
Comparison of results obtained from Medrano et al. (2009) and this work
Comparison between Cheng et al. and this work on Ni/Al2O3 and Hi-FUEL
Table 7.1 Thermodynamic analysis of glycerol hydrogenolysis at 600oC, 1 atm
via Aspen-HYSYS
Table 7.2 Corresponding Ca/Ni Ratio with respect to each catalyst tested
Table 7.3 Comparison of results from Wang-Mg and this work
Table 8.1 The relationship between total carbon produced, carbon deposited and free
carbon on all oxygenates, produced by steam reforming over Hi-FUEL
Table 8.2 Comparison of carbon production between NiAl(C) and NiAl(S)
Table A.1 Bond Enthalpy
16
Table A.2
Table A.3
Table A.4
Table A.5
Table A.6
Steam reforming of ethanol reaction enthalpy calculations at 298K
Steam reforming of ethylene glycol reaction enthalpy calculations at 298K
Steam reforming of propylene glycol reaction enthalpy calculations at 298K
Steam reforming of glycerol reaction enthalpy calculations at 298K
Ethanol/steam/nitrogen flow setting
Table A.7 Ethylene glycol/steam/nitrogen flow setting
Table A.8 Propylene glycol/steam/nitrogen flow setting
Table A.9 Glycerol/steam/nitrogen flow setting
Table A.10 Example of aqueous phase detection of glycerol steam reforming over
Hi-FUEL (50mg Hi-FUEL), WHSV = 104.8 gflow/gcatalyst hour
Table A.11 Example of outlet gas quantification of glycerol steam reforming over Hi-
FUEL (50mg Hi-FUEL), WHSV = 104.8 gflow/gcatalyst hour
Table A.12 Simulation study via Aspen-HYSYS on allyl alcohol production
Table A.13 Aqueous phase products from glycerol steam reforming at 300 oC
Table A.14 Gas phase products selectivity from glycerol steam reforming at 300 oC

17
LIST OF FIGURES
Figure 1.1 Alternative world energy outlook until 2100 – Total primary energy supply
Figure 1.2 The hydrogen supply and demand model
Figure 1.3 The research focus in this thesis
Figure 2.1 A summary of hydrogen production routes. (Tokarev et al.)
Figure 2.2 Diagram of the different accepted structures of CNF and CNT
Figure 3.1 The homologues of the chosen oxygenated hydrocarbons
Figure 3.2 Simulation environment for all tested parameters
Figure 3.3 Model validation of autothermal reforming of 100% pure glycerol (this work
vs. Authayanun et al.)
Figure 3.4 Ethanol steam reforming thermodynamic analysis at equimolar mixture
(water:ethanol), 1 atm (This Work)
Figure 3.5 Ethanol steam reforming thermodynamic analysis at equimolar mixture
(water:ethanol), 1 atm (Rossi et al.)
Figure 3.6 Number of moles of H2 and mole fraction of H2 based on steam reforming of
glycerol thermodynamic analysis at 1 atm (Adhikari et al.)
Figure 3.7 (a) Number of moles of H2 and (b) mole fraction of H2 based on steam
reforming of glycerol thermodynamic analysis at 1 atm (This Work)
Figure 3.8 Molar enthalpy ( ) and heat flow ( ) for glycerol steam reforming products via
PR-Twu property package
Figure 3.9 Reactor's temperature profile for different feedstock entering temperature ((a)
O/C=0 and (b) O/C = 0.75)
Figure 3.10 Hydrogen molar flow (mol/hour) for different reactor inlet temperature:
(a) O/C = 0, (b) O/C = 0.75

18
Figure 3.11 Methane molar flow (mol/hour) for different reactor inlet temperature:
(a) O/C = 0, (b) O/C = 0.75
Figure 3.12 CO molar flow (mol/hour) for different reactor inlet temperature:
(a) O/C = 0, (b) O/C = 0.75
Figure 3.13 CO2 molar flow (mol/hour) for different reactor inlet temperature:
(a) O/C = 0, (b) O/C = 0.75
Figure 3.14 Steam/ Water Consumed (%) in Autothermal Steam Reforming Reactor:
(a) O/C=0, (b) O/C= 0.75
Figure 3.15 CO/CO2 ratio for different reactor inlet temperature: (a) O/C=0, (b) O/C= 0.75
Figure 3.16 Reactor’s adiabatic temperature and CO/CO2 ratio with respect to
oxygen/carbon (O/C) ratio
Figure 3.17 Products molar flow rate with respect to oxygen/carbon (O/C) ratio
(a) Hydrogen, (b) Methane, (c) CO, (d) CO2
Figure 3.18 Steam/ water consumed (%) with respect to O/C Ratio
Figure 3.19 Effect of steam to ethanol ratio to gas products selectivity and
CO/CO2 ratio at Treactor= 600 oC
Figure 3.20 Effect of steam to ethylene glycol ratio to gas products selectivity and
CO/CO2 ratio at Treactor= 600 oC
Figure 3.21 Effect of steam to propylene glycol ratio to gas products selectivity and
CO/CO2 ratio at Treactor= 600 oC
Figure 3.22 Effect of steam to glycerol ratio to gas products selectivity and
CO/CO2 ratio at Treactor= 600 oC
Figure 3.23 The percentage of steam/water consumed in the oxygenates steam reforming
reactor
Figure 3.24 Effect of temperature to gas selectivity on ethanol steam reforming
Figure 3.25 Effect of temperature to gas selectivity on ethylene glycol steam reforming

19
Figure 3.26 Effect of temperature to gas selectivity on propylene glycol steam reforming
Figure 3.27 Effect of temperature to gas selectivity on glycerol steam reforming
Figure 3.28 (a) Rossi et al. vs (b) This work (revisited): Comparison with the presence of
additional species in this work to equimolar mixture ethanol steam reforming
thermodynamic analysis at 1 atm
Figure 3.29 This work (a) vs Vasudeva et al. (b): Comparison of thermodynamic analysis
of ethanol steam reforming at 1000 K
Figure 3.30 (a) Wang et al. vs (b) This Work: Comparison of thermodynamic analysis on
glycerin steam reforming at 1 atm, steam to fuel ratio of 3:1
Figure 4.1 Temperature Programme Reduction (TPR) profiles of fresh calcined samples
of Al2O3 supported catalysts
Figure 4.2 TPR Profiles for fresh Hi-FUEL catalyst at different heating rates
Figure 4.3 Activation energy determinations via Kissinger Plot
Figure 4.4 FESEM images of fresh Hi-FUEL: (a) Magnification of 10.00 K X,
(b) Magnification of 50.00 K X
Figure 4.5 FESEM images of reduced Hi-FUEL at 750 oC for 1 hour under 75ml/min H2
flow: (a) Magnification of 10.00 K X, (b) Magnification of 50.00 K X
Figure 4.6 TEM images of fresh Hi-FUEL catalyst: (a) 1: 100 nm, (b) 1: 50nm,
(c) 1: 10 nm
Figure 4.7 TEM Images on 15Ni3Ca: (a) 1:100nm (b) 1:50nm (c)1:10nm
Figure 4.8 TEM Images of prepared calcium/alumina catalysts with scale 1:10nm:
(a) 3Ca, (b) 9Ca
Figure 4.9 The images of the test rig
Figure 4.10 Experimental general setup process flow diagram (PFD)
Figure 4.11 Vaporiser’s diagram
Figure 4.12 Relationship of particle size and pressure drop in this study

20
Figure 5.1 Effect of space-time, τ/hour to gas products selectivity
Figure 5.2 Comparison between experimental results and Gibbs equilibrium data on
Hydrogen Yield and CO/CO2 Ratio
Figure 5.3 Carbon gas products selectivity of ethanol steam reforming over Hi-FUEL at
500 and 600 oC
Figure 5.4 CO/CO2 ratio and H2 yield of ethanol steam reforming over Hi-FUEL at 500
and 600 oC
Figure 5.5 Carbon gas products selectivity of ethylene glycol steam reforming over Hi-
FUEL at 500 and 600 oC
Figure 5.6 CO/CO2 ratio and H2 yield of ethylene glycol steam reforming over
Hi-FUEL at 500 and 600 oC
Figure 5.7 Carbon gas products selectivity of propylene glycol steam reforming over Hi-
FUEL at 500 and 600 oC
Figure 5.8 CO/CO2 ratio and H2 yield of propylene glycol steam reforming over
Hi-FUEL at 500 and 600 oC
Figure 5.9 Carbon gas products selectivity of glycerol steam reforming over Hi-FUEL at
500 and 600 oC
Figure 5.10 CO/CO2 ratio and H2 yield of glycerol steam reforming over Hi-FUEL at 500
and 600 oC
Figure 5.11 Hydrogen yield and carbon gas products selectivity for two different bed
volumes/GHSV of Glycerol Steam Reforming over Hi-FUEL at 500 oC
Figure 5.12 Hydrogen yield and carbon gas products selectivity for two different bed
volumes/GHSV of Glycerol Steam Reforming over Hi-FUEL at 600 oC
Figure 6.1 The products yield with respect to three conditions in the blank test
experiment, i.e. Blank Tube (BT), Quartz Wool (QW), and Silica Carbide
(SiC): (a)Allyl Alcohol, (b) Acetol, (c) Acetaldehyde, (d) Acrolein, (e)
Condensation Products, and (f) Propane
21
Figure 6.2 The aqueous phase yield (%) from glycerol steam reforming at 400 oC
over Hi-FUEL
Figure 6.3 The main products (H2, CO2, CO, and CH4) yield from glycerol steam
reforming at 400 oC over Hi-FUEL
Figure 6.4 The primary carbon gas selectivity (%) and CO/CO2 ratio of glycerol steam
reforming at 400 oC over Hi-FUEL
Figure 6.5 The carbon yield of gas phase carbon products from glycerol steam reforming
at 400 oC over Hi-FUEL
Figure 6.6 The comparison of aqueous phase products selectivity (%) of glycerol steam
reforming at 400 oC over Hi-FUEL with/without the presence of an external
supply of hydrogen
Figure 6.7 The comparison of gas phase products selectivity (%) of glycerol steam
reforming at 400 oC over Hi-FUEL with/without the presence of an external
supply of hydrogen
Figure 6.8 The yield of the aqueous phase products from glycerol steam reforming at
600 oC over Hi-FUEL
Figure 6.9 The yield of the main products (H2, CO2, CO and CH4) from glycerol steam
reforming at 600 oC over Hi-FUEL
Figure 6.10 The primary carbon gas selectivity (%) and CO/CO2 ratio of glycerol steam
reforming at 600 oC over Hi-FUEL
Figure 6.11 The carbon yield of gas phase carbon products from glycerol steam reforming
at 600 oC over Hi-FUEL
Figure 6.12 Effect of reaction temperature to the product yield in the gas phase from the
glycerol steam reforming over Hi-FUEL
Figure 6.13 Effect of reaction temperature to the product selectivity in the glycerol steam
reforming over Hi-FUEL
22
Figure 6.14 Effect of reaction temperature to gas selectivity in the glycerol steam
reforming predicted by Gibbs free energy minimisation method in Aspen-
HYSYS
Figure 6.15 Effect of reaction temperature to carbon yield in gas phase in the glycerol
steam reforming over Hi-FUEL
Figure 6.16 Hydrogen yield and CO/CO2 ratio with respect to the different steam partial
pressure of glycerol steam reforming at 600 oC over Hi-FUEL catalyst
Figure 6.17 Gas selectivity with respect to the different steam partial pressure of glycerol
steam reforming at 600 oC over Hi-FUEL catalyst
Figure 6.18 Gas phase carbon yield with respect to the different steam partial pressure of
glycerol steam reforming at 600 oC over Hi-FUEL catalyst
Figure 6.19 Aqueous phase product yield from the glycerol steam reforming over NiAl(C)
and Hi-FUEL at 600 oC, 1 atm, S/F = 8.1/1
Figure 6.20 Gas phase products selectivity (%) from the glycerol steam reforming over
NiAl(C) and Hi-FUEL at 600 oC, 1 atm, S/F = 8.1/1
Figure 6.21 Hydrogen yield, YH2 and carbon yield, YCi (%) of gas products from glycerol
steam reforming over NiAl(C) and Hi-FUEL at 600 oC, 1 atm, S/F = 8.1/1
Figure 6.22 Gas phase products selectivity from TOS of glycerol steam reforming over Hi-
FUEL catalyst at 600 oC, 1 atm and S/F = 8.1/1
Figure 6.23 Hydrogen yield and gas phase carbon yield from TOS of glycerol steam
reforming over Hi-FUEL catalyst at 600 oC, 1 atm and S/F = 8.1/1
Figure 7.1 The selectivity of gaseous phase products for both catalysts on glycerol steam
reforming at 600 oC, steam to fuel ratio 8.1:1, WHSV = 10.48 gflow/gcatalyst hour
Figure 7.2 Hydrogen yield, YH2 and carbon yield, YCi based gases produced from
glycerol steam reforming over NiAl(C) and NiAl(S)
Figure 7.3 Chemical reactions (re-sketched) occurring during glycerol hydrogenolysis as
summarised by (a) Miyazawa et al. (b) Bildea et al.
23
Figure 7.4 Aqueous phase productyield (%) from glycerol steam reforming over Al2O3,
3Ca, 7Ca and 9Ca at 600 oC, steam to fuel ratio 8.1:1, 1 atm
Figure 7.5 Carbon gas products selectivity of glycerol steam reforming over prepared
xCa/Al2O3 catalysts at 600 oC and 1 atm
Figure 7.6 Carbon yield of gas phase products from glycerol steam reforming over the
prepared xCa/Al2O3 catalysts at 600 oC and 1 atm
Figure 7.7 Hydrogen yield and CO/CO2 ratio of the glycerol steam reforming at 600 oC
and 1 atm over xCa/Al2O3 (x=0, 3, 7 and 9 wt% of Ca)
Figure 7.8 The image of aqueous phase product, which was suspected to contain
acetaldol over xCa/Al2O3 catalysts
Figure 7.9 Reaction mechanism of glycerol hydrogenation for propane production
Figure 7.10 Gas products selectivity of glycerol steam reforming over prepared 15NixCa
and Hi-FUEL catalysts at 600 oC and 1 atm
Figure 7.11 Carbon yield of gas phase products from glycerol steam reforming over
prepared 15NixCa and Hi-FUEL catalysts at 600 oC and 1 atm
Figure 7.12 Hydrogen yield, YH2and CO/CO2 ratio of glycerol steam reforming at 600 oC
and 1 atm over 15Ni-xCa/Al2O3 catalysts with varied Ca/Ni ratio
Figure 7.13 Illustration of calcium doped nickel-alumina surface activity from glycerol
steam reforming reaction
Figure 7.14 Proposed reaction pathway to the production of primary products in glycerol
steam reforming over Hi-FUEL catalyst
Figure 8.1 (a) Carbon deposited and (b) free carbon on different oxygenate steam
reforming at 600 oC over 1g Hi-FUEL
Figure 8.2 FESEM images of spent Hi-FUEL catalyst for all oxygenated hydrocarbons
steam reforming activity at 600 oC, 1 atm and 1 gram catalyst loading – (a)
Ethanol, (b) Ethylene Glycol, (c) Propylene Glycol and (d) Glycerol
24
Figure 8.3 Carbon deposited (g) on spent Hi-FUEL catalyst of ethanol steam reforming at
600 oC of steam to a fuel ratio of 6.5:1 as analysed using a CHNS Analyser
Figure 8.4 (a) The carbon deposition on Hi-FUEL spent catalyst and (b) free carbon
produced from ethanol and propylene glycol steam reforming at 500 and
600 oC with 1g catalyst loading
Figure 8.5 (a) Carbon deposition (g) on Hi-FUEL spent catalyst and (b) Free carbon
formed from glycerol steam reforming activity at 400 and 600 oC
Figure 8.6 The TGA derivative plot (dw/dT) of the spent Hi-FUEL catalysts at different
glycerol steam reforming reaction temperatures
Figure 8.7 TEM images of spent Hi-FUEL catalyst of 500mg tested on glycerol steam
reforming (a) 1: 20nm (b) 1:100nm for 400 oC; (c) 1:200nm
(d) 1:100nm for 600 oC
Figure 8.8 FESEM images of spent Hi-FUEL catalyst of 500mg tested on glycerol steam
reforming at (a) 400 oC (b) 600
oC
Figure 8.9 The final weight loss from the TGA plot and the carbon content via CHNS
Analyser of the spent Hi-FUEL catalyst, tested at 400 and 600 oC.
Figure 8.10 Carbon yield from Steam Reforming of Glycerol over Hi-FUEL catalyst at
400 and 600 oC, (a) CO and (b) CH4, C2H4 and C2H6
Figure 8.11 Carbon deposited and free carbon produced from glycerol steam reforming
over the Hi-FUEL catalyst of 1 g loading at various reaction temperatures
Figure 8.12 FESEM images of the spent Hi-FUEL catalyst tested at different glycerol
steam reforming reaction temperatures: (a) 400 oC, (b) 500
oC, (c) 600
oC, (d)
700 oC
Figure 8.13 Effect of steam partial pressure/kPa of glycerol steam reforming via Hi-FUEL
catalyst at 600 oC to the total, free and deposited carbon on the spent catalyst
Figure 8.14 The amount of carbon deposited (weight %) as analysed using the CHNS
analyser
25
Figure 8.15 Free carbon produced (mol/hour) for Hi-FUEL and NiAl(C) at
two catalyst loadings
Figure 8.16 The TGA derivative plot (dW/dT) of the spent Hi-FUEL catalyst and the
NiAl(C) tested to glycerol steam reforming at 600 oC and 1 atm
Figure 8.17 Total carbon produced, free carbon and carbon deposited on xCa/Al2O3 from
glycerol steam reforming at 600 oC
Figure 8.18 TEM images of fresh and spent catalysts (a) Fresh 3Ca, (b) Spent 3Ca, (c)
Fresh 9Ca, (d) Spent 9Ca
Figure 8.19 Total carbon produced at different Ca doped to Ni/Al2O3 catalysts from
glycerol steam reforming at 600 oC
Figure 8.20 Derivative of TGA (dW/dT) profiles for different catalysts underwent glycerol
steam reforming at 600 oC
Figure 8.21 TEM images of 15Ni3Ca spent catalysts, (a) filamentous carbon formed at
1:100nm, (b) filamentous carbon formed at 1:20nm
Figure A.1 Mass flow controller calibration curve for hydrogen
Figure A.2 Mass flow controller calibration curve for 10% CO in Argon
Figure A.3 Mass flow controller calibration curve for nitrogen as carrier gas
Figure A.4 Mass flow controller calibration curve for nitrogen as purge gas
Figure A.5 Syringe pump calibration curve for BD Plastipak 50-60 cm3 size
Figure A.6 Aspen-HYSYS simulation layout using Gibbs reactor
26
LIST OF ABBREVIATIONS
15Ni3Ca 15 wt% Ni, 3wt% Ca on alumina
15Ni7Ca 15wt% Ni, 7 wt% Ca on alumina
3Ca 3wt% Ca on alumina
7Ca 7wt% Ca on alumina
9Ca 9wt% Ca on alumina
AA Allyl alcohol
Ac Acetol
Acro Acrolein
Al2O3 Alumina
APR Aqueous phase reforming
Ar Argon
ATR Autothermal reforming
ATRE Autothermal reforming of ethanol
BET Brunauer–Emmett–Teller Analysis
C2H4 Ethylene
C2H5OH or EtOH Ethanol
C2H6 Ethane
C2H6O2 or EG Ethylene glycol
C3H6 Propylene
C3H8 Propane
C3H8O2 or PG 1,2 – propane diol or propylene glycol

27
C3H8O3 or Gly Glycerol
Ca Calcium
Ca/Al2O3 Calcium – alumina
Ce Cerium
CH3CHO Acetaldehyde
CH4 Methane
CHNS Carbon, hydrogen, nitrogen, sulphur analyser
CO Carbon monoxide
Co Cobalt
CO2 Carbon dioxide
CP Condensation Products
CxHy Hydrocarbons with x C atoms and y H atoms in one molecule
DEG Diethylene glycol
DI De-ionised water
DRE Dry reforming of ethanol
FESEM Field Emission Scanning Electron Miscroscopy
FID Flame Ionisation Detector
GC Gas Chromatography
GC-MS Gas Chromatography coupled with Mass Spectrometer
GHSV Gas hourly space velocity
(volumetric flow rate/ volume of catalyst bed = cm3
flow/cm3
bed hour)
GSR Glycerol steam reforming
H2 Hydrogen

28
H2O Steam or water
He Helium
Hi-FUEL Hi-FUEL R110 (Alfa Aesar) catalyst
IEA International Energy Agency
Ir Iridium
N2 Nitrogen
Ni/Al2O3 Nickel – alumina
NiAl(C) Commercial nickel/alumina catalyst
NiAl(S) Self-prepared nickel/alumina catalyst
Ni-Ca/Al2O3 Nickel – calcium – alumina
O/C Oxygen atom to carbon atom ratio
O2 Oxygen
OSR Oxidative steam reforming
Pd Palladium
POx Partial oxidation
PR Peng-Robinson equation of state
Pt Platinum
QW Quartz wool
RF Response Factor
Rh Rhodium
Ru Ruthenium
RWGS Reverse water gas shift reaction
S/F Steam to fuel ratio
29
SEM Scanning electron microscope
SiC Silica Carbide
SOFC Solid Oxide Fuel Cell
SRE Steam reforming of ethanol
SRK Soave-Redlich-Kwong equation of state
TCD Thermal Conductivity Detector
TEM Transmission Electron Microscopy
TGA Thermo Gravimetric Analyser
TPR Temperature Programmed Reduction
WGS Water gas shift reaction
WHSV Weight hourly space velocity
(mass flow rate/ mass of catalyst = gflow/gcatalyst hour)
XRD X-Ray Diffraction
XRF X-Ray Fluorescence
Zn Zinc
α- Al2O3 Alpha alumina
γ- Al2O3 Gamma alumina

30
LIST OF SYMBOLS
parameter of at critical temperature, Tc
activation energy (kJ/mol)
bi b coefficient of species i
Bd Bodenstein number
bulk density of the catalyst, g/cm3
bulk reactant concentration, mol/m3
carbon species i
catalyst particle density, g/cm3
μi chemical potential of species i (J/mol)
constant for Kissinger plot
density of mixture (oxygenate/inert gas/steam at respective
temperature), g/cm3
density of the particle, g/cm3
diffusivity, cm2/s
dynamic viscosity of mixture, cm/(g.s)
effective diffusivity = 0.1 x Dm , cm2/s
Dm gas diffusivities of each oxygenate mixture, cm2/s
G Gibbs free energy (J/mol)
Gi0 initial Gibbs free energy, J/mol
ni0 initial number of moles for species i
kil interaction coefficient between species i and l
L length of the bed, cm

31
mass transfer coefficient, m/s
ṅ molar flow rate, mol/hour
molecular weight
nij number of moles of species i in j phase in the system
C number of species in the system
partial fugacity coefficient
particle diameter, cm
reactant concentration at the catalyst surface, mol/cm3
Thiele modulus
CWP Weisz-Prater criterion
Ph number of potential phases in the system
P pressure, bar or atm
P0 initial pressure, bar
Pc critical pressure, bar
Pe Péclet number
R universal gas constant (kJ/kmolK)
rate of reaction of species A (kmol/kgcat.s)
observed rate of reaction (kmol/kgcat.s)
Re Reynolds Numbers
catalyst particle radius, m or cm
Sc Schmidt number
T temperature, K or oC

32
Tmax maximum peak temperature, K
Tr reduced temperature, K
superficial velocity, cm/s
v molar volume
atomic diffusion volume for species i
X conversion
Xi mole fraction of species i in liquid phase
xi molar fraction of species i
xl molar fraction of species l
YCi carbon yield of species i
YH2 Hydrogen yield
Yi yield of species i
Z compressibility factor
temperature dependent function
heating rate (K-1
)
βzi number of atoms of element z in species i
catalyst void fraction,
Δp pressure drop, g/cm.s2
effectiveness factor
2ϴ diffraction angle, o

33
CHAPTER 1: INTRODUCTION
The pursuit for a greener environment and the struggle to reduce the dependency on fossil
fuels has driven mankind to devise better energy solutions. Some of the effective solutions to
combat the problem of fossil fuel dependency are the introduction of renewable energy, such
as solar energy, wind power and biomass. Extensive research has proven that renewable
energy not only extends the shelf life of the exhausting non-renewable fossil fuel but also
reduces the level of carbon dioxide in the earth’s atmosphere. Renewable energy sources,
however, are generally located at some specific locations. Although they are readily
available, these sources are intermittent, such as solar and wind energy, and therefore
unstable [1]. The International Energy Agency (IEA) predicts an increasing share of primary
energy used from renewables in the future due to support from the government, the falling
costs of renewable energy, change in the price of CO2 emissions in certain regions and the
rising price of fossil fuels in the long-term [2].
Figure 1.1: Alternative world energy outlook until 2100 – Total primary energy supply [3]
Figure 1.1 illustrates the future prediction of the total primary energy supply from non-
renewable energy sources, such as oil, gas and coal. As demonstrated, the primary energy
supply is estimated to reach the maximum peak within a few years, and, subsequently,
decline in the coming few decades. In the future, renewable sources will become more in
demand and are predicted to become the primary energy sources of the next century. By

34
2090, significant portions of primary energy supply are predicted to be generated from wind
power, solar energy and biomass.
One possible energy solution is the utilisation of hydrogen, always known as the energy
carrier since the hydrogen atom cannot exist on its own. On planet Earth, hydrogen is found
bonded as part of the molecules of water, hydrocarbons and organic materials [4], and, hence,
external energy is required to extract the hydrogen atoms [5]. Hydrogen has been identified
as an ideal, sustainable energy carrier due to its abundance and high energy density [3, 6, 7].
Conventionally, it is produced from natural gas reforming and coal gasification [8].
Approximately 96% of world hydrogen comes from fossil fuels [9]. Utilising hydrogen as an
energy carrier in the future is very beneficial as it preserves the environment, is economical
and can be safely handled [10-12].
Figure 1.2 depicts the supply and demand of hydrogen based on the European Commission
Model in 2003 [13]. With the recent development of fuel cell technology and the need for
alternative energy, it has been widely researched and investigated that hydrogen can be
produced by using various technologies and from a number of sources, such as biomass,
solar, wind, hydro and nuclear energy, i.e. from the renewables as mentioned earlier.
Hydrogen can also be produced from liquid fuels originating from biomass, which can
undergo similar technology as natural gas reforming. In addition, these fuels are mostly
derived from sustainable sources that contain oxygen, also known as oxygenated
hydrocarbons [8]. The main emphasis of this research work is represented by a tiny black
spot as seen in Figure 1.2 and the output of hydrogen is focused by a tiny white spot with a
black outline on the same model.

35
Figure 1.2: The hydrogen supply and demand model [13]
Prior to the consumption of hydrogen for the fuel cell and transportation era, large amounts of
hydrogen were used as a feedstock for other chemical productions. Hydrogen is consumed in
ammonia production, petroleum refining industry and methanol production [14, 15].
Hydrogen for petrochemical utilisation came in fourth place in which hydrogenolysis and
hydrogenation account for most of the hydrogen consumed in this industry [15]. This is
provided on a large-scale from the steam reforming of natural gas as well as the by-product of
petroleum refining and chemical production, mainly from the catalytic reforming process
[16]. In nature, natural gas is not sustainable; therefore, the utilization of alternative fuels,
such as oxygenated hydrocarbons from biomass, is not only a sustainable source but can be
found in abundance. The biomass can be transformed into different fuels in solid, liquid or
gas forms by applying different technologies, namely, pyrolysis, gasification, reforming and
other bio-based processes.
Reforming is a well-developed thermal technology in which the desired product is mainly
hydrogen (H2) with carbon dioxide (CO2), carbon monoxide (CO) and methane (CH4) being
the usual side products. The reformer’s effluents can be varied either thermodynamically or
by using different types of catalysts to obtain a high yield of H2 or syngas. To date, many
reforming processes utilising oxygenated hydrocarbons have been researched. These include
dry gas reforming, also known as CO2 reforming, steam reforming, hydrothermal reforming
(also known as aqueous phase reforming), partial oxidation and autothermal reforming [1].

36
Among the growing interests of oxygenated hydrocarbons undergoing reforming
technologies are the short chain alcohols (monohydric alcohols), such as methanol and
ethanol (or bio-ethanol)[17-21], and polyhydric alcohols, such as glycerol [22-25]. The
biomass oil (bio-oil), which is obtained via pyrolysis activity, may also be used to undergo
the reforming process, however, the bio-oil consists of a more complex mixture that may
include aldehydes, ketones and carboxylic acids [26]. Most of these mentioned oxygenates
can be obtained from biomass derivative products [27, 28]. Glycerol (C3H8O3), as an
example, is a by-product of biodiesel production [28, 29]. Glycerol is widely used in many
applications including personal care, food, oral care, tobacco, polymer and pharmaceutical
applications [30]. However, the crude glycerol that is obtained from biodiesel production has
to undergo an energy intensive distillation process to purify glycerol to an acceptable purity,
which is costly [28]. Avasthi et al. [29] reported that, at the moment, biodiesel production is
costlier than the petroleum diesel, and that one of the ways to reduce the cost is to utilize the
by-product (glycerol) effectively, which is further supported by Quispe et al. [31].
There are still many challenges that have not been fully addressed in catalysis and reaction
engineering of oxygenates, such as the most effective reformer design, its performance
efficiency as well as the catalyst development. The techno-economic assessment of these
oxygenates is not widely reported except for several general biomass compounds, such as
ethanol, glycerol and bio-oil [32-34]. In terms of the technical aspects, among the challenges
that are yet to be tackled at this stage include the deactivation, resulting from coking of the
catalyst, metal sintering of the catalysts at high temperature, high CH4 selectivity that leads to
difficulties in product separation and non-ideal reactors. Other challenges may comprise
determining the mechanisms and kinetics of the process as well as intensifying the
conventional technology to accelerate the hydrogen production. Although some of the
catalysts may give high yield and selectivity of the desired products, the cost may be
expensive and unfeasible to be utilized on an industrial scale.
The aim of this research work is to investigate the feasibility of oxygenated hydrocarbons
reforming via commercially available catalysts and to understand the reaction pathways to the
final desired products. This catalyst is made for natural gas reforming and if this could be
used for oxygenated hydrocarbons, a further cost saving in catalyst development could be
made. It is of future interest to investigate whether these oxygenated hydrocarbons can be co-
fed to the existing natural gas reforming facilities for a sustainable hydrogen or syngas
production. However, the reaction mechanisms and thermodynamic properties of the

37
oxygenated hydrocarbon reforming require a thorough investigation. In addition, some
modifications of the catalyst will be made to ensure a reasonable cost effective catalyst could
be used.
1.1 Research Objectives
The specific objectives of this research are:
1.1.1 To implement a thorough literature review on general reforming technology,
specifically on oxygenated hydrocarbons reforming, reactors and catalyst
development and their challenges.
Initially, the available reforming technology will be touched upon, such as steam
reforming, autothermal reforming, dry / CO2 reforming, aqueous phase reforming and
partial oxidation, as researched by previous researchers. It is essential to identify the
strengths and weaknesses in each process and compare them against each other. In
these comparisons, oxygenated hydrocarbons are the main subject matter. Oxygenated
hydrocarbons utilised by other researchers will also be surveyed. The reactors and
catalysts developed by other researchers are studied in terms of the reactor efficiency
and catalytic activities. Finally, the challenges posed on the reforming technology and
oxygenates used, as well as the reactors and catalysts selected are elucidated.
Sintering and coking are two main issues in oxygenated reforming, but the main focus
will be on carbon deposition on the catalyst surface, which potentially deactivates the
catalyst.
1.1.2 To conduct a thermodynamic equilibrium study of the oxygenated hydrocarbons
reforming of choice for comparison with the experimental work.
Thermodynamic equilibrium study is essential to indicate the achievable selectivity
and yield of any process with specific conditions and parameters. Aspen-HYSYS is
used for this purpose. The results are used to assist the experimental works carried out
to ensure the results are deemed reliable. This also provides guidance for future
kinetic studies to ensure that a correct regime is selected for the kinetic evaluation, i.e.
catalyst activity not approaching equilibrium. In addition, a better catalyst comparison

38
can be conducted in the future while the equilibrium line acts as the baseline or target
to be achieved.
1.1.3 To explore, evaluate and screen the suitability of oxygenated hydrocarbons for steam
reforming via a fixed bed reformer using nickel based catalysts.
The selected oxygenates are ethanol, ethylene glycol, propylene glycol and glycerol,
which are interrelated as a series of homologues. These homologues represent a series
of poly-ols consisting of mono-ol (ethanol), di-ol (ethylene glycol and propylene
glycol) and tri-ol (glycerol). These oxygenates will be tested on steam reforming
technology using a nickel based commercial catalyst, which is usually used for
methane/natural gas steam reforming and compared against thermodynamic
equilibrium data. The main interest will be the yield, selectivity and CO/CO2 ratio of
the primary gases (H2, CO2, CO and CH4) in each reaction set at a specific catalyst
loading and parameters and to comment on the suitability and feasibility of these
oxygenates for steam reforming based on experimental results.
1.1.4 To explore and elucidate the reaction pathway and mechanism for glycerol as the
selected oxygenated hydrocarbons steam reforming over the commercial catalyst
selected and compare with other findings.
The glycerol steam reforming is assumed to consist of complex multiple reactions.
Therefore, understanding the reaction pathway to yield the final products over a
commercial nickel based catalyst is an interesting discovery to be made. Although
many works have been carried out previously on glycerol steam reforming, to date,
very few works have addressed the reaction pathway. By understanding the reaction
pathway, the catalyst modification could be carried out to address the challenge that
might appear via an existing commercial catalyst.
1.1.5 To investigate, prepare, characterize and test nickel catalysts to enhance hydrogen
production from the glycerol steam reforming and compare with the previously used
commercial nickel catalyst.

39
After the steam reforming of glycerol is carried out via the nickel based commercial
catalyst, a similar type of catalyst is intended to be prepared and characterised with
some modifications (with a different weight percentage of promoter’s loading) for
comparative studies. The outcome of this test will highlight the capability of the
commercial catalyst in oxygenates steam reforming as well as the influence of the
promoter on the catalyst. Some of the catalysts will also be prepared solely to
investigate the role of different components to the glycerol steam reforming reaction.
1.1.6 To study the coke formation in the reaction involves one of the main challenges in
steam reforming of oxygenated hydrocarbons.
One of the main challenges that need to be addressed in oxygenated hydrocarbons
steam reforming is the formation and deposition of coke on the catalyst’s surfaces.
The deposition of coke may lead to catalyst deactivation, hence affecting the final
yield of the intended products. The study will address the quantity and type of coke
deposited on a similar type of catalyst tested on different oxygenates in various
conditions. It will also address the coke deposition on different types of catalyst tested
on glycerol steam reforming. The study can be concluded by investigating whether
the catalyst used can be easily deactivated in the presence of carbon or not.

40
Reforming
Technology
Catalyst
Development
Aqueous Phase
Reforming
Dry Reforming
Partial
Oxidation
Autothermal
Reforming
Steam
Reforming
Nickel - based
Other metals
& Noble
metals
Ethanol
C2H
5OH
Ethylene
Glycol
C2H
4(OH)
2
Propylene
Glycol
C3H
6(OH)
2
Glycerol
C3H
5(OH)
3
Glycerol steam reforming
on nickel catalyst
Parametric studies of
selected catalyst
Effect of calcium
addition on Ni/Al2O
3
catalyst
Coke formation study
on all catalysts
Thermodynamic Analysis
Studies via Gibbs Energy
Minimisation Method
Main Focus Secondary Focus Overview Legend:
Figure 1.3: The research focus in this thesis
41
1.2 Thesis Description
This thesis will discuss the steam reforming of oxygenated hydrocarbon homologues, namely
ethanol, ethylene glycol, 1,2-propylene glycol and glycerol, over nickel/alumina catalysts
promoted with calcium. The work is based on experimental work augmented by
thermodynamic and kinetic simulations and analysis.
The first chapter of the thesis provides the background and objectives of the study, followed
by the second chapter describing the literature pertinent to the subject matter.
In chapter three, a thermodynamic analysis is presented of the steam and autothermal
reforming of oxygenated hydrocarbon homologues using a Gibbs free energy minimisation
method. The simulation results are discussed and compared with the literature.
The devised experimental methodology is provided in chapter four. This chapter covers the
catalyst preparation and characterisation as well as the general rig setup for the reforming
reactions, highlighting the associated operating procedures.
In chapter five, the steam reforming of ethanol to glycerol homologues over a commercial
catalyst (Ni-Ca/Al – Hi-FUEL) is presented. The effect of space-time on the conversion and
product selectivities for ethanol steam reforming, and effect of temperature on the steam
reforming of all selected homologues (including ethanol) is discussed and elaborated upon.
Chapter six specifically discusses glycerol steam reforming over commercial Hi-FUEL
catalysts since glycerol reforming involves a complex, multiple reaction network. The effects
of space-time, temperature, steam partial pressure and time on stream are quantified. The
importance of considering hydrogenolysis reactions to describe the intermediates formed is
highlighted. Finally, a detailed comparison of the activity and selectivity of the commercial
catalyst with that of a typical unpromoted Ni/Al2O3 catalyst is made.
In chapter seven, the commercial catalyst together with the synthesized, unpromoted
Ni/Al2O3 are compared with catalysts consisting of xCa/Al2O3 and Ni-xCa/Al2O3
(with x ranging from 3 to 7 wt-%) in order to identify the optimum calcium loading yielding
the highest hydrogen selectivity.
In chapter eight, the carbon formation/deposition rates onto the catalysts’ surfaces are
quantified for all catalysts and all oxygenated hydrocarbon homologues.

42
The thesis concludes with chapter nine in which the major findings are summarised;
suggestions for future lines of work are made and detailed recommendation are given.

43
1.3 References
[1] M. Ni, D. Y. C. Leung, and M. K. H. Leung, "A review on reforming bio-ethanol for
hydrogen production," International Journal of Hydrogen Energy, vol. 32, pp. 3238-
3247, 2007.
[2] IEA, World Energy Outlook 2012: OECD Publishing.
[3] M. Zerta, P. R. Schmidt, C. Stiller, and H. Landinger, "Alternative World Energy
Outlook (AWEO) and the role of hydrogen in a changing energy landscape,"
International Journal of Hydrogen Energy, vol. 33, pp. 3021-3025, Jun 2008.
[4] B. Sørensen, Hydrogen and Fuel Cells: Emerging Technologies and Applications:
Elsevier Academic Press, 2005.
[5] M. F. Hordeski, Alternative Fuels: The Future of Hydrogen: Fairmont Press/CRC
Press, 2006.
[6] M. Balat and H. Balat, "Recent trends in global production and utilization of bio-
ethanol fuel," Applied Energy, vol. 86, pp. 2273-2282, 2009.
[7] S. M. Aceves, G. D. Berry, J. Martinez-Frias, and F. Espinosa-Loza, "Vehicular
storage of hydrogen in insulated pressure vessels," International Journal of Hydrogen
Energy, vol. 31, pp. 2274-2283, Dec 2006.
[8] I. E. Agency, O. f. E. Co-operation, and Development, Hydrogen and Fuel Cells:
International Energy Agency/Organisation for Economic Co-operation and
Development, 2004.
[9] J. Dufour, D. P. Serrano, J. L. Gálvez, J. Moreno, and C. García, "Life cycle
assessment of processes for hydrogen production. Environmental feasibility and
reduction of greenhouse gases emissions," International Journal of Hydrogen Energy,
vol. 34, pp. 1370-1376, 2009.
[10] C. C. Cormos, "Integrated assessment of IGCC power generation technology with
carbon capture and storage (CCS)," Energy, vol. 42, pp. 434-445, Jun 2012.
[11] A. Almansoori and N. Shah, "Design and operation of a stochastic hydrogen supply
chain network under demand uncertainty," International Journal of Hydrogen Energy,
vol. 37, pp. 3965-3977, Mar 2012.
[12] N. V. Gnanapragasam, B. V. Reddy, and M. A. Rosen, "Feasibility of an energy
conversion system in Canada involving large-scale integrated hydrogen production
using solid fuels," International Journal of Hydrogen Energy, vol. 35, pp. 4788-4807,
May 2010.

44
[13] E. C. Directorate-General for Research and Innovation, Directorate-General for
Mobility and Transport, and D.-G. f. Energy, Hydrogen energy and fuel cells, A vision
of our future : final report of the High Level Group, 2003.
[14] R. Ramachandran and R. K. Menon, "An overview of industrial uses of hydrogen,"
International Journal of Hydrogen Energy, vol. 23, pp. 593-598, 1998.
[15] H. H. Gunardson, Industrial Gases in Petrochemical Processing: Chemical
Industries: Taylor & Francis, 1997.
[16] D. Moon, "Hydrogen Production by Catalytic Reforming of Liquid Hydrocarbons,"
Catalysis Surveys from Asia, vol. 15, pp. 25-36, 2011/03/01 2011.
[17] P. K. Seelam, S. Liguori, A. Iulianelli, P. Pinacci, V. Calabro, M. Huuhtanen, R.
Keiski, V. Piemonte, S. Tosti, M. De Falco, and A. Basile, "Hydrogen production
from bio-ethanol steam reforming reaction in a Pd/PSS membrane reactor," Catalysis
Today, vol. 193, pp. 42-48, Oct 15 2012.
[18] A. V. Tokarev, A. V. Kirilin, E. V. Murzina, K. Eränen, L. M. Kustov, D. Y. Murzin,
and J. P. Mikkola, "The role of bio-ethanol in aqueous phase reforming to sustainable
hydrogen," International Journal of Hydrogen Energy, vol. 35, pp. 12642-12649,
2010.
[19] J. Comas, F. Mariño, M. Laborde, and N. Amadeo, "Bio-ethanol steam reforming on
Ni/Al2O3 catalyst," Chemical Engineering Journal, vol. 98, pp. 61-68, 2004.
[20] V. Collins-Martinez, M. Escobedo Bretado, M. Meléndez Zaragoza, J. Salinas
Gutiérrez, and A. L. Ortiz, "Absorption enhanced reforming of light alcohols
(methanol and ethanol) for the production of hydrogen: Thermodynamic modeling,"
International Journal of Hydrogen Energy, vol. 38, pp. 12539-12553, 2013.
[21] D. Palo, R. Dagle, and J. Holladay, "Methanol Steam Reforming for Hydrogen
Production," Chemical Reviews, vol. 107, pp. 3992 - 4021, 2007.
[22] G. Wu, S. Li, C. Zhang, T. Wang, and J. Gong, "Glycerol steam reforming over
perovskite-derived nickel-based catalysts," Applied Catalysis B: Environmental, vol.
144, pp. 277-285, 2014.
[23] M. L. Dieuzeide, M. Jobbagy, and N. Amadeo, "Glycerol steam reforming over Ni/γ-
Al2O3 catalysts, modified with Mg(II). Effect of Mg (II) content," Catalysis Today,
vol. 213, pp. 50-57, 2013.

45
[24] E. Markočič, B. Kramberger, J. G. van Bennekom, H. Jan Heeres, J. Vos, and Ž.
Knez, "Glycerol reforming in supercritical water; a short review," Renewable and
Sustainable Energy Reviews, vol. 23, pp. 40-48, 2013.
[25] Y.-C. Lin, "Catalytic valorization of glycerol to hydrogen and syngas," International
Journal of Hydrogen Energy, vol. 38, pp. 2678-2700, 2013.
[26] P. N. Kechagiopoulos, S. S. Voutetakis, A. A. Lemonidou, and I. A. Vasalos,
"Hydrogen Production via Reforming of the Aqueous Phase of Bio-Oil over
Ni/Olivine Catalysts in a Spouted Bed Reactor," Industrial & Engineering Chemistry
Research, vol. 48, pp. 1400-1408, Feb 4 2009.
[27] J. He and W. N. Zhang, "Techno-economic evaluation of thermo-chemical biomass-
to-ethanol," Applied Energy, vol. 88, pp. 1224-1232, Apr 2011.
[28] H. W. Tan, A. R. Abdul Aziz, and M. K. Aroua, "Glycerol production and its
applications as a raw material: A review," Renewable and Sustainable Energy
Reviews, vol. 27, pp. 118-127, 2013.
[29] K. S. Avasthi, R. N. Reddy, and S. Patel, "Challenges in the Production of Hydrogen
from Glycerol – A Biodiesel Byproduct Via Steam Reforming Process," Procedia
Engineering, vol. 51, pp. 423-429, 2013.
[30] R. Christoph, B. Schmidt, U. Steinberner, W. Dilla, and R. Karinen, Glycerol: Wiley-
VCH Verlag GmbH & Co. KGaA, 2000.
[31] C. A. G. Quispe, C. J. R. Coronado, and J. A. Carvalho Jr, "Glycerol: Production,
consumption, prices, characterization and new trends in combustion," Renewable and
Sustainable Energy Reviews, vol. 27, pp. 475-493, 2013.
[32] J. A. Posada, L. E. Rincon, and C. A. Cardona, "Design and analysis of biorefineries
based on raw glycerol: Addressing the glycerol problem," Bioresource Technology,
vol. 111, pp. 282-293, May 2012.
[33] C. Reyes Valle, A. L. Villanueva Perales, F. Vidal-Barrero, and A. Gómez-Barea,
"Techno-economic assessment of biomass-to-ethanol by indirect fluidized bed
gasification: Impact of reforming technologies and comparison with entrained flow
gasification," Applied Energy, vol. 109, pp. 254-266, 2013.
[34] Y. Zhang, T. R. Brown, G. Hu, and R. C. Brown, "Comparative techno-economic
analysis of biohydrogen production via bio-oil gasification and bio-oil reforming,"
Biomass and Bioenergy, vol. 51, pp. 99-108, 2013.

46
CHAPTER 2: LITERATURE REVIEW
This chapter will provide a broad review of the previous works carried out by other
researchers focusing on oxygenated hydrocarbons of choice, reforming technologies,
thermodynamic analyses of respective reforming technologies, catalyst and reactor
development associated with reforming reactions, and, finally, the challenges in the
reforming of oxygenated hydrocarbons.
2.1 Oxygenated Hydrocarbons
Oxygenated hydrocarbons are considered to be one of the potential sources of fuel for the
reforming technology to complement the utilisation of natural gas (methane). The growing
interest in oxygenated hydrocarbons includes the short chain alcohols (monohydric alcohols),
such as methanol and ethanol (or bio-ethanol), and polyhydric alcohols, such as glycerol, due
to their availability from bio-derivative resources, which means that they can be sustainably
produced. The biomass oil (bio-oil), which is obtained via pyrolysis activity, may also be
reformed [1]. The bio-oil may include aldehydes, carboxylic acids and ketones; however, the
reactions involved are complex and may lead to deactivation via coking of the catalyst [1].
For the purpose of this doctoral research, particular attention is focused on four main alcohols
forming a series of poly-ols homologues: ethanol (mono-ol), ethylene glycol and propylene
glycol (1,2-propane diol) forming di-ols and glycerol (tri-ols).
2.1.1 Ethanol
Since the steam reforming process is an endothermic process [2], which requires a high
temperature [3], it is highly beneficial to use oxygenated hydrocarbons as the fuel source to
complement the amount of heat used, and, ultimately, save the heating cost. Among the
alcohols that are beneficial for reforming is ethanol. Ethanol (C2H5OH) has a relatively high
hydrogen content, is widely available, non-toxic and can be stored and handled safely [4].
The boiling point of ethanol is 78.4 oC and the industrial practice of ethanol production is via
hydration of ethylene between 250 – 300 oC and 5 – 8 MPa [5]. However, the reaction is
reversible and there is a possibility that ethanol may dehydrate to form ethylene. In addition,
ethanol can be produced not only from fossil fuel sources, but by fermentation of biomass
sources, such as agricultural wastes or municipal solid waste (MSW) [4] and is often called
bio-ethanol. The United States and Brazil are currently the leaders of bio-ethanol production,
and accounted for approximately 50% and 38% of the total world fuel production in 2007 [6].

47
2.1.2 Glycerol
Glycerol is an odourless, clear when it is pure, highly viscous, sweet-tasting liquid and has a
boiling point of 290 o
C. Usually, native glycerol, also known as natural glycerol, is produced
from transesterification reaction as well as saponification reaction. Synthetic glycerol
however is produced from propene [7]. With the increased production of biodiesel, a surplus
of glycerol is expected in the world market, and, therefore, it is essential to find useful
applications for glycerol [8]. Glycerol is widely used in many applications including personal
care, food, oral care, tobacco, polymer and pharmaceutical applications [9]. In order to be
used in personal care, pharmaceutical and food industries, glycerol has to undergo an
expensive distillation process; however, the low price of glycerol makes it uneconomic to do
so [10]. At present, most of the crude glycerol obtained from biodiesel plants is sent to water
treatment for digestion, however, this process is slow, expensive and has low yield [11] By
observing the current condition, it is obvious that there is a major need to find an alternative
use for glycerol.
2.1.3 Ethylene Glycol and Propylene Glycol
Another two more components that are of interest are ethylene glycol (C2H6O2) and 1,2-
propane diol (C3H8O2), also known as propylene glycol. These poly-ols are part of the
glycerol building block. Ethylene glycol is a clear, colourless and viscous liquid with a
boiling point of 197.6 oC. It is widely used as an anti-freeze in car radiators since it can easily
lower the freezing point of water. Additionally, it is a commercially important raw material
for the manufacturing of polyester fibres [12]. At the industrial scale currently, the widely
used method of ethylene glycol production is via non-catalytic thermal hydrolysis of ethylene
oxide, which is a product of the direct oxidation of ethylene in air or oxygen.
Propylene glycol has a similar property to ethylene glycol, as reported by Sullivan [13]. It is a
clear, colourless and strongly hygroscopic liquid, which is more viscous than ethylene glycol.
In addition, propylene glycol is readily biodegradable. The boiling point is slightly lower, i.e.
187.9 oC. Propylene glycol is highly demanded as feedstock in the development of polyester
resins. Propylene glycol is also widely used in the food, pharmaceutical and cosmetic
industries since it is generally regarded as safe (GRAS), as approved by the FDA United

48
States [13]. Sullivan further adds that direct hydrolysis of propylene oxide with water is the
only practical and industrially accepted method for propylene glycol production.
2.2 Reforming technologies
Reforming is a well-developed technology for converting hydrocarbon into molecular
hydrogen, and carbon dioxide or syngas (hydrogen and carbon monoxide) at a high
temperature of usually between 400 to 800 oC. Generally, several main reactions occur during
the reforming process. However, it is vital to be aware that reforming technology is highly
dependent on the type of reactant used during the process. Hydrogen (H2) and carbon dioxide
(CO2) are normally released as the main products of a full reactant conversion. However,
there are times that carbon monoxide (CO) and methane (CH4) may also be produced during
the process. To date, considerable reforming research and developments have been
implemented. These include steam reforming, dry gas reforming, also known as CO2
reforming, hydrothermal reforming (also known as aqueous phase reforming), partial
oxidation and autothermal reforming.
2.2.1 Steam Reforming
Steam reforming is the most common and deep-rooted reforming technology, and is well
developed in the petrochemical industry to convert natural gas (mainly methane) into
hydrogen. This reaction is endothermic in nature. Many research works have focused on
improving the performance of this technology using other hydrocarbons, e.g. oxygenated
hydrocarbons (e.g. methanol, ethanol, glycerol, dimethyl ether) or heavier hydrocarbons (C3 –
C10 components).
For oxygenated hydrocarbons, the stoichiometric reaction mechanism is as follows:
(2.1)
In a complete conversion of an oxygenated hydrocarbon, the reforming reaction is normally
accompanied by a water gas shift reaction, as follows:
( = -41.2 kJ/mol) (2.2)
Steam reforming is usually carried out at high temperature (400 – 800 oC) and atmospheric
pressure, but, sometimes, at elevated pressure for industrial practice [14]. The operating
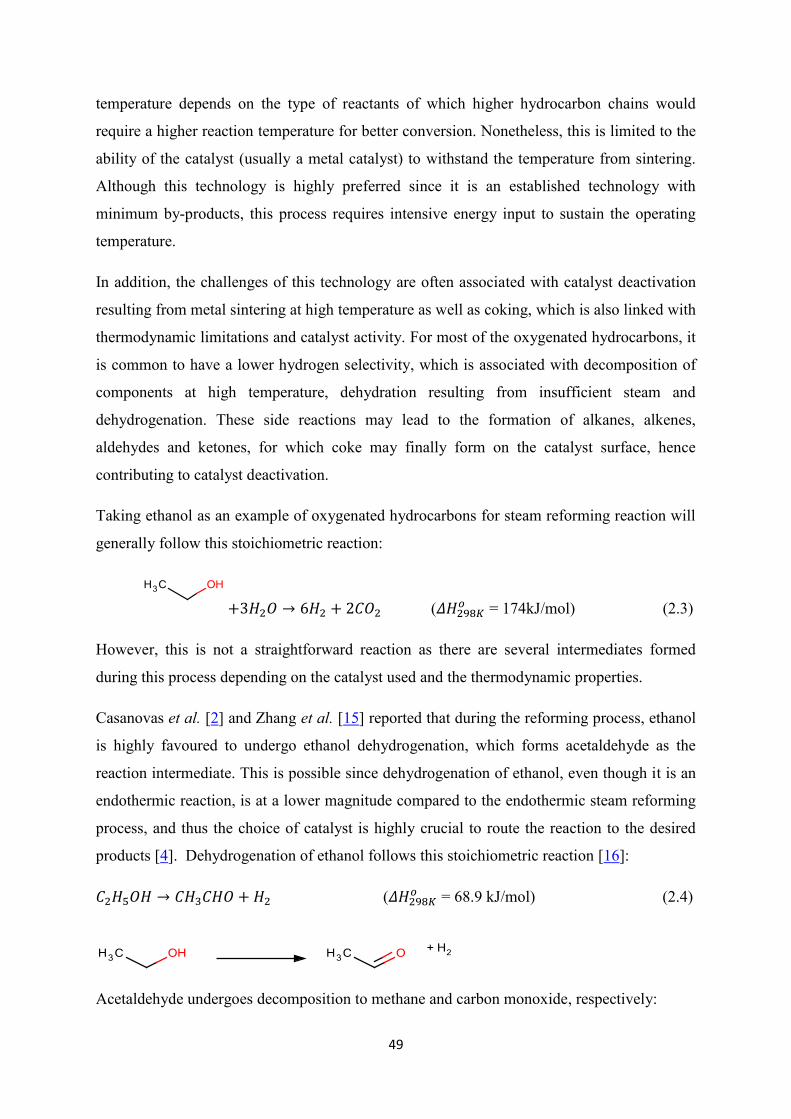
49
temperature depends on the type of reactants of which higher hydrocarbon chains would
require a higher reaction temperature for better conversion. Nonetheless, this is limited to the
ability of the catalyst (usually a metal catalyst) to withstand the temperature from sintering.
Although this technology is highly preferred since it is an established technology with
minimum by-products, this process requires intensive energy input to sustain the operating
temperature.
In addition, the challenges of this technology are often associated with catalyst deactivation
resulting from metal sintering at high temperature as well as coking, which is also linked with
thermodynamic limitations and catalyst activity. For most of the oxygenated hydrocarbons, it
is common to have a lower hydrogen selectivity, which is associated with decomposition of
components at high temperature, dehydration resulting from insufficient steam and
dehydrogenation. These side reactions may lead to the formation of alkanes, alkenes,
aldehydes and ketones, for which coke may finally form on the catalyst surface, hence
contributing to catalyst deactivation.
Taking ethanol as an example of oxygenated hydrocarbons for steam reforming reaction will
generally follow this stoichiometric reaction:
( = 174kJ/mol) (2.3)
However, this is not a straightforward reaction as there are several intermediates formed
during this process depending on the catalyst used and the thermodynamic properties.
Casanovas et al. [2] and Zhang et al. [15] reported that during the reforming process, ethanol
is highly favoured to undergo ethanol dehydrogenation, which forms acetaldehyde as the
reaction intermediate. This is possible since dehydrogenation of ethanol, even though it is an
endothermic reaction, is at a lower magnitude compared to the endothermic steam reforming
process, and thus the choice of catalyst is highly crucial to route the reaction to the desired
products [4]. Dehydrogenation of ethanol follows this stoichiometric reaction [16]:
( = 68.9 kJ/mol) (2.4)
Acetaldehyde undergoes decomposition to methane and carbon monoxide, respectively:

50
( = -19.2 kJ/mol) (2.5)
Otherwise, acetaldehyde may undergo steam reforming, as follows:
( = 296.5 kJ/mol) (2.6)
If reaction (2.5) has high methane selectivity, eventually, CH4 will undergo steam reforming
to produce hydrogen with CO2 and/or CO, as shown in equations 2.7 and 2.8. CO will further
undergo water gas shift reaction (WGS) to produce CO2 and H2, as shown earlier in equation
(2.2).
( = 165 kJ/mol) (2.7)
( = 206 kJ/mol) ` (2.8)
The temperature range for operating ethanol steam reforming is quite wide, ranging from
300 – 650 oC [15, 17-19]. With the presence of a catalyst, it is possible to achieve complete
conversion of ethanol at 350 oC and at atmospheric pressure, whilst a non-catalytic reaction
may require a higher temperature for a complete conversion [19].
Glycerol steam reforming research work has been reported by many researchers [9, 20-38].
Glycerol steam reforming follows this stoichiometric reaction:
( = 128 kJ/mol) (2.9)
There are a few possible routes of reactions, depending on the type of catalyst and conditions
provided to the system, e.g. sufficient steam to fuel ratio as well as operating temperature.
However, most of the research works reported that glycerol decomposed into acetaldehyde,
propanal, acetone, acrolein and other short chain alcohols, resulting from competing
dehydration and dehydrogenation [31, 39]. Chiodo et al. [27], however, reported that glycerol
underwent the phenomenon of pyrolysis at high temperature in which it was decomposed into
primary and secondary pyrolysis products prior to reaching the catalyst surface. Thus,

51
reaction (2.2), (2.8) and glycerol decomposition, as shown in equation (2.10), may occur
apart from the glycerol steam reforming reaction:
( = 251 kJ/mol) (2.10)
Other possible decomposition reaction resulting from dehydration of glycerol to 3-
hydroxypropanal, which becomes the precursor of acrolein formation [40]:
→ (
= 450 kJ/mol) (2.11)
→ (
= -36 kJ/mol) (2.12)
According to Chiodo et al. [27], acrolein may further decompose into aldehydes and ketones
whilst ethane may decompose into ethylene and form coke at the end of the reaction.
Chiodo et al. further reported on blank test results (without the addition of a catalyst) at high
temperature (800 oC). At this temperature and above, glycerol is not stable and decomposes
into several compounds among which ethylene is the intermediate of coke formation.
Ethylene is formed from C-C cleavage, which leads to the formation of CH2(OH)-CH(OH)
and CH2-OH radicals. These radicals lead to the formation of more stable compounds, such
as C2H4, H2 and CH4. In Chiodo’s research work, a huge amount of CO and CH4 is formed as
by-products associated with the large formation of acetaldehyde and its decomposition
products. However, CO2 is much lower, which suggests that the water gas shift reaction
(WGS) did not take place and that the 10% production of H2 is only based on the
dehydrogenation reaction. Zhang et al. [9] further confirmed that methane production is
highly favourable during glycerol steam reforming as a result of the decomposition of
glycerol.
Slinn et al. [41] demonstrated that steam reforming of pure glycerol and raw glycerol from a
biodiesel plant produces hydrogen. The reaction pathways, as adapted from
Sutton et al. [42], are shown as follows with the respective reaction enthalpy ( ):
+128 kJ/mol (2.13 – 2.20)
+251 kJ/mol
52
+131 kJ/mol
-41 kJ/mol
+75 kJ/mol
-206 kJ/mol
-165 kJ/mol
+172 kJ/mol
The experimental work from Slinn et al. compared the performance of both pure glycerol and
by-product glycerol from a biodiesel plant in a Solid Oxide Fuel Cell (SOFC) using a
platinum-alumina (Pt/Al2O3) catalyst. The temperature and the glycerol flow rate effects were
studied during the process. It was observed that by using pure glycerol, the fuel cell was still
functional when it operated 30 hours non-stop. However, by using raw glycerol, the longest
run under constant operating conditions reached the maximum 10 hours of operation, after
which the fuel cell was degraded by carbon deposition. By varying the temperature, a greater
yield of hydrogen and carbon monoxide (CO), as high as 85%, was achieved at a higher
temperature, i.e. at 880 °C, with the hydrogen selectivity reaching 70%. By decreasing the
temperature, the gas yield dropped since complex liquid products and tars formed, and, thus,
the hydrogen selectivity was lowered. By increasing the glycerol flow rates, it was
demonstrated that the gas yield was constant throughout the experiment but that the hydrogen
selectivity decreased. However, the insufficient contact time of the reactant with the catalyst
thereby causing the reactant molecules to undergo pyrolysis prior to reaching the catalyst
surface. This resulted in increasing amount of CO with the increasing glycerol flow rate.
Recently (2012 until now), glycerol steam reforming has been researched under supercritical
water conditions with or without the presence of a catalyst [43-49]. Markoḉiḉ et al. [47], in
their review article, explained that supercritical water condition means the operating pressure
and the temperature exceeds the water critical point, i.e. Tc = 647 K (274 oC) and Pc = 22.1
MPa. They highlighted several research works conducted earlier in which supercritical water
reforming of glycerol may yield light molecular weight aqueous phase hydrocarbons and
gases within the temperature range of 300 to 600 oC. All the other experimental work carried
out above this range only reported the production of gaseous products with almost or
complete glycerol conversion. Most of the work reported the presence of acrolein and
acetaldehyde, apart from the production of hydrogen, CO2, CO, and other CxHy gases.

53
Gutiérrez Ortiz et al. [45] conducted supercritical water reforming of glycerol without the
presence of any catalyst in the range of 750 to 850 oC and 240 bars. From the experimental
studies, they concluded that by operating at low glycerol feed and extending the residence
time, the glycerol to gas conversion and the hydrogen yield can be enhanced. In the absence
of a catalyst, catalytic activity occurred on the reactor’s material, which had nickel particles
on it (Inconel 625), hence producing carbon nanotubes. Research work on ethylene glycol
steam reforming was conducted by Kechagiopoulos et al. [1, 50, 51]. Ethylene glycol steam
reforming follows this stoichiometric reaction:
( = 85.9 kJ/mol) (2.21)
In the work of Kechagiopoulos et al. on commercial Ni-based catalysts, it was found that the
higher the steam to fuel ratio (S/F), the higher the H2 and CO2 production [51]. However, an
increase in temperature reduced the production of CO2, and, ultimately, H2, since the reverse
water gas shift reaction occurred, which favoured CO production. For the range of
temperatures and steam to fuel ratios tested, the hydrogen selectivity was always well above
80% with S/F = 6 at 700 oC being the most favourable condition when the H2 selectivity
reached 93%. The work also reported on the coking tendency of ethylene glycol, which is
highly dependent on the operating variables. A reactor blockage occurred for S/F ≤ 3 after
approximately 7 hours. However, there was no significant coking issue for temperature
variation since a high steam to fuel ratio was utilised. The carbon balance was not 100%,
which was given as evidence of a small amount of carbon loss in coking. This could be
prevented by operating at excess steam to suppress the coke formation.
To date, in respect of propylene glycol, although none of the work mentioned above covered
propylene glycol steam reforming or other reforming technologies, it is a possible reaction
with the following theoretical stoichiometric equation:
(2.22)
The maximum hydrogen molecular yield possible to be achieved in propylene glycol steam
reforming is 2.67 mol/mol C, which is higher than ethylene glycol (YH2 = 2.5) and glycerol

54
(YH2 = 2.33), but relatively lower than ethanol (YH2 = 3). Propylene glycol however has been
researched to be produced by glycerol, via hydrogenolysis [52, 53]. All four oxygenated
hydrocarbons chosen make up a series of homologues, which form an interesting set for
investigation.
2.2.2 Catalytic Reforming
In petroleum refineries, catalytic reforming is widely used to convert the low-octane
hydrocarbons to a more valuable high-octane component without changing their carbon
numbers significantly [54]. Among the reactions that may occur in a catalytic reformer are
dehydrogenation, dehydroisomerisation, isomerisation, dehydrocyclisation, hydrocracking,
hydrogenation as well as carbon formation [54]. In this technology, hydrogen is largely
produced as the by-product, but it is also consumed internally for hydrogenation and
hydrogenolysis reaction [55]. Catalytic reforming in a petroleum refinery is usually operated
near the range of 500 oC and the reactor’s operation pressure is varied according to the high-
pressure processes (20-50 bar), medium pressure (10-20 bar) and low-pressure (3-10 bar),
depending on the feedstock quality [54].
To date, little research has been carried out on the selected oxygenated hydrocarbons catalytic
reforming, specifically, without steam addition; however, several works were published
earlier with reference to glycerol degradation [56], glycerol hydrogenolysis [52, 53, 57-60],
glycerol and bio-oil valorisation to bio-fuels [40, 61-63], as well as aqueous phase reforming,
which will be discussed in section 2.2.6.
It is anticipated that via catalytic reforming of oxygenated hydrocarbons, a large amount of
hydrogen may be produced as its by-products, however, this is highly demanded for
hydrodeoxygenation in bio-fuel refineries [64-68].
2.2.3 Autothermal Reforming
Autothermal reforming, also called oxidative steam reforming, is a combination of a partial
oxidation process, which is a highly exothermic reaction, and steam reforming as an
endothermic reaction [69]. Autothermal, emerging from the idea of self-sustained reforming,
is an attractive option since it has higher energy efficiency, improves the system temperature
control, reduces the formation of hot spots and avoids catalyst deactivation by sintering or

55
carbon deposition [69]. Aartun et al. [70] reported that autothermal reforming or oxidative
steam reforming has the main advantage of initial oxidation reaction that is extremely
exothermic, in which it can generate heat for the subsequent endothermic reforming
reactions. Thus, this technology has high potential for saving heating costs that complements
the amount of hydrogen produced. However, autothermal reforming poses difficulty in
controlling for a steady-state operation, and, therefore, utilisation of the catalyst is under
optimised [71].
The efficiency of autothermal reforming is always countered by lower hydrogen yield
compared to steam reforming due to its thermodynamic limitation. Another setback is the
cost of the separation process if air is used. Otherwise, if pure oxygen is used, there is a
requirement to set up an additional plant for oxygen generation, hence incurring very high
cost [14]. A general stoichiometric reaction for a complete conversion of an oxygenated
hydrocarbon is as follows:
[ ]
[ ]
(2.23)
Taking the example of ethanol as one type of oxygenated hydrocarbon undergoing
autothermal reforming process, ethanol is converted to the products, following the
combination of partial oxidation of ethanol and steam reforming of ethanol, as follows [4]:
Partial oxidation:
(2.24)
Combining with equation 2.3, yields as follows:
Autothermal reforming of ethanol (ATRE):
(2.25)
The autothermal reforming of ethanol is usually operated between 500 – 800 oC and it
operates at atmospheric pressure [2, 72-75]. The feedstock, which consists of the mixture of
hydrogen and ethanol, is vaporized between 180 and 200 oC [74]. Prior to feeding the
reactants into the reactor, the mixture is injected with oxygen, which heats up the reactor and
thus enables it to reach a higher temperature range.
Chen et al. [73] made a comparison of several noble metal catalysts and oxide supports by
using oxidative steam reforming (OSR) and autothermal reforming (ATR). OSR is used when
oxygen is supplied together with external heating, while autothermal reforming is solely

56
dependent on the amount of oxygen injected to boost the temperature. Further testing
discovered that the oxygen was fully consumed during ATR and it was recommended that the
optimum molar ratio of ethanol to oxygen should be kept within 0.9 – 1.0 since increasing the
molar ratio would lead to the production of unwanted by-products with low hydrogen
selectivity.
Glycerol has also been used in autothermal reforming research work, as reported by
Dauenhauer et al. [76]. The steam to carbon (S/C) ratio was varied from 0 to 4.5, while the
oxygen to carbon ratio (O/C) was varied from 0.9 – 1.6. The catalyst tested was Rh promoted
with ceria on ceramic and washcoated with γ-Al2O3. As compared to ethanol, glycerol
achieved a higher reaction temperature when oxygen was provided, i.e. reaching a
temperature between 900 – 1200 oC. However, the maximum hydrogen selectivity (79%)
was achieved when S/C= 4.5 and O/C=0.9. An increase in the oxygen to carbon ratio of more
than 1.0 will reduce the back face temperature, and, hence, the conversion and hydrogen
selectivity.
Dauenhauer and colleagues [76] observed during their test that glycerol underwent
dehydration and that acetaldehyde (CH3CHO) was produced as an intermediate.
Acetaldehyde was further adsorbed onto the catalytic surface, while the C-C bond broke up
into methyl and CO. Whilst CO undergoes a water gas shift reaction, methyl is further
converted into methane and undergoes methane reforming. It was also observed that as the
oxygen to carbon ratio increased, the methane selectivity decreased and the acetaldehyde
selectivity increased indicating acetaldehyde decarbonylation taking place.
In the same research work, Dauenhauer et al. [76] reported on ethylene glycol autothermal
reforming, which follows this stoichiometric reaction:
(2.26)
In comparison, between the three oxygenates being tested in their experimental work, i.e.
methanol (representing oxygenated C1 component), ethylene glycol (C2) and glycerol (C3)
using similar Rh-based catalyst, ethylene glycol is highly likely to be adsorbed on Rh on both
oxygen atoms. Initially, there was O-H scission, which produced dioxy intermediate, and this
intermediate continued to decompose to C-H and C-C scission. The C-O bond as a leftover
however did not dissociate, and, therefore, it was maintained as CO, and did not produce
other by-products. This is consistent with the high selectivity to gas products observed at high
57
O/C ratios. The conversion of ethylene glycol was reported to be more than 99% for all O/C
less than 1.6, but less for O/C≥ 1.6. The hydrogen selectivity reached 92% but none of the
tested parameters reached the equilibrium as predicted by Gibbs’ free energy minimisation.
Autothermal reforming on glycerol was also studied by Lin et al. [77] by comparing the
performance of this process in a typical packed bed reactor and Pd/Ag alloy membrane
reactor. The catalyst used was Ni/Ce-Al2O3 for both reactors. It was found that the Pd/Ag
alloy membrane reactor improved the glycerol conversion and hydrogen selectivity in
comparison to a packed bed reactor as hydrogen was continuously removed once it was
formed via the membrane pores. The increase of hydrogen yield is based on Le-Chatelier’s
principle, whereby the removal of hydrogen will lead to the formation of more. However,
increasing the reactor pressure will lead to the reduction of glycerol conversion as well as
hydrogen yield. As an example, the global reaction of glycerol steam reforming, as
demonstrated in stoichiometric equation (2.9), is revisited. From the equation, there is one
mole of glycerol in gaseous state and three moles of steam on the left side of the equation in
contrast to three moles of CO2 and seven moles of H2 on the product side. By increasing the
reactor pressure, the overall partial pressure of the gases will increase; hence, the system will
achieve the equilibrium by shifting the reaction to the left. The system will counteract the
increase in partial pressure of gas molecules on the product’s side; hence, this will lower the
glycerol conversion. With respect to propylene glycol, similar to steam reforming, there is no
reported work on propylene glycol autothermal reforming to date.
2.2.4 Dry Reforming
Dry reforming, also known as carbon dioxide reforming, is a reforming reaction between
oxygenates and carbon dioxide to produce syn gas, i.e. hydrogen and carbon monoxide. To
date, in comparing among all the oxygenates selected; only ethanol has been researched so
far in the context of dry reforming [16, 78-82]. Although research on carbon dioxide
reforming of ethanol, known as dry reforming of ethanol (DRE), is not as established as SRE
and ATRE, there is a growing interest in this reforming technology due to cheap reactant
costs and a commitment to the reduction of CO2 in the environment, hence converting the
syngas into a valuable product [16].
DRE is a strongly endothermic reaction (∆Ho
298K= 296.7 KJ/mol). The stoichiometric
reaction of DRE is as follows:

58
(2.27)
However, the above reaction needs to be carefully controlled since there are many
competitive side reactions taking place, such as dehydrogenation of ethanol to acetaldehyde,
dehydration of ethanol to ethylene or decomposition of ethanol into CO, CO2 or acetone.
Thus, sufficient CO2 supply is highly crucial to ensure optimum H2 production. DRE may
take place between 500 – 1100 oC with the optimum range reported to be between 950 – 1050
oC. It is important to operate DRE at a high temperature to reduce coke formation, and,
ultimately, high H2 selectivity [16].
In the early stage of dry reforming research work, DRE was used to convert ethanol into
filamentous carbon nanotubes, whilst at the same time producing hydrogen, as demonstrated
by Oliveira-Vigier et al. [80]. Stainless steel 316 was used as the catalyst to ensure that the
carbon deposited could be removed easily. It was found that the optimum operating
temperature for the production of both carbon nanotube and hydrogen was around 600 oC.
This is however subject to the pre-treatment of the catalyst in which SS316 was heated up to
800 oC prior to the experiment for optimum performance.
Wang and Wang [16] investigated the DRE thermodynamic equilibrium using the Gibbs free
energy minimisation method. They recommended that by operating at a higher temperature
(>900 K), the formation of coke can be avoided since only DRE, decomposition to acetone,
CO and H2 and decomposition to methane govern this temperature region. The reaction
should be operated at atmospheric pressure, since increasing the pressure will increase the
tendency for coking. By operating at their suggested optimal operating conditions, it was
claimed that the hydrogen yield might reach up to approximately 95%.
2.2.5 Partial Oxidation
Partial oxidation is another reforming technology to convert the oxygenated hydrocarbons
into hydrogen and CO2 or syn gas. In this reforming technology, the reaction is exothermic in
nature, where it is not required to provide external heating other than the supply of air or pure
oxygen. Complete oxidation (air supply in excess) will burn the fuel or reactant completely,
hence reducing the amount of hydrogen produced. Therefore, the amount of air or oxygen
supplied may need to be carefully controlled to yield the optimum products. The
stoichiometric equation of partial oxidation is as follows and applies to all oxygenates:
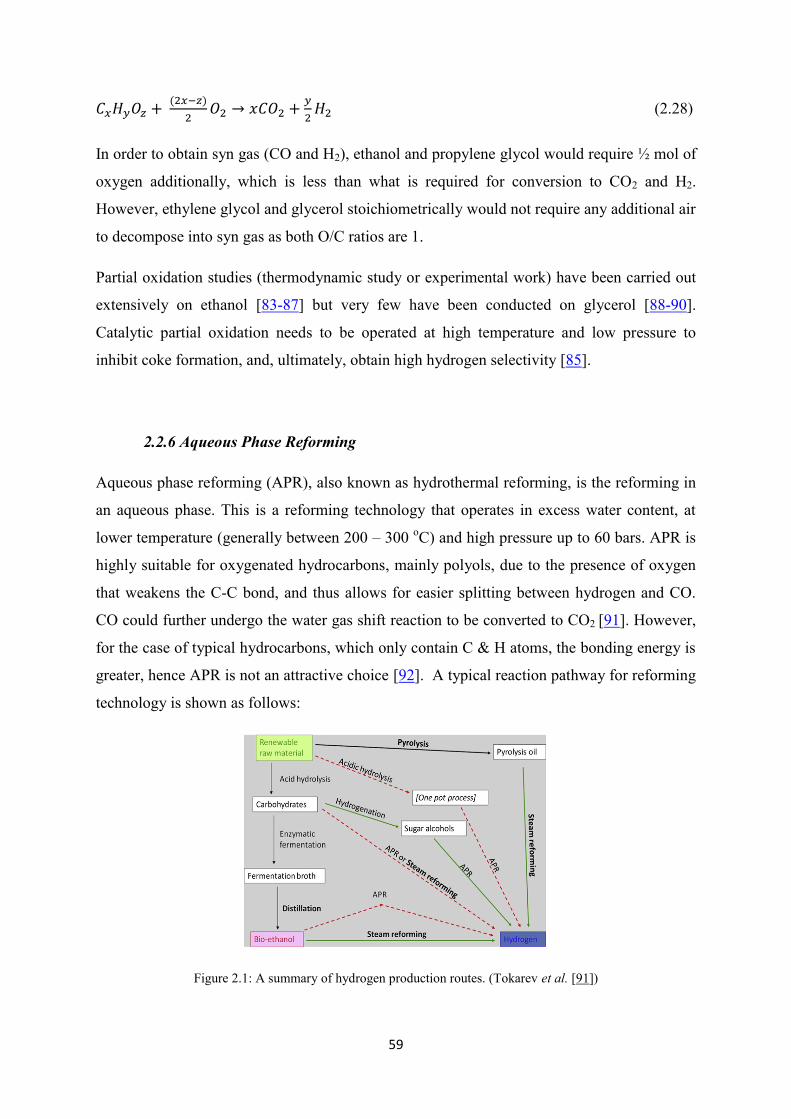
59
(2.28)
In order to obtain syn gas (CO and H2), ethanol and propylene glycol would require ½ mol of
oxygen additionally, which is less than what is required for conversion to CO2 and H2.
However, ethylene glycol and glycerol stoichiometrically would not require any additional air
to decompose into syn gas as both O/C ratios are 1.
Partial oxidation studies (thermodynamic study or experimental work) have been carried out
extensively on ethanol [83-87] but very few have been conducted on glycerol [88-90].
Catalytic partial oxidation needs to be operated at high temperature and low pressure to
inhibit coke formation, and, ultimately, obtain high hydrogen selectivity [85].
2.2.6 Aqueous Phase Reforming
Aqueous phase reforming (APR), also known as hydrothermal reforming, is the reforming in
an aqueous phase. This is a reforming technology that operates in excess water content, at
lower temperature (generally between 200 – 300 oC) and high pressure up to 60 bars. APR is
highly suitable for oxygenated hydrocarbons, mainly polyols, due to the presence of oxygen
that weakens the C-C bond, and thus allows for easier splitting between hydrogen and CO.
CO could further undergo the water gas shift reaction to be converted to CO2 [91]. However,
for the case of typical hydrocarbons, which only contain C & H atoms, the bonding energy is
greater, hence APR is not an attractive choice [92]. A typical reaction pathway for reforming
technology is shown as follows:
Figure 2.1: A summary of hydrogen production routes. (Tokarev et al. [91])

60
In order to improve the hydrogen production and lower the CO level, in their work, Xu et al.
[93] improved the alkalinity of the process, i.e. by using alkaline-based support for the
catalyst. This is supported by Wen et al. [94] who, by using Pt- on alkaline support, yielded a
much higher hydrogen molar concentration as well as a higher hydrogen formation rate. In
addition, by using acidic support, the formation of alkanes is increased.
APR was also conducted in glycerol [94, 95] and ethylene glycol [96, 97]. Manfro and
colleagues [95] outlined the reaction route of the process, which involves the breaking of C-C
cleavage bonds as well as C-H bonds to form adsorbed species on the catalyst surface,
especially CO (Equation 2.29). Once CO is adsorbed, it will undergo a water gas shift
reaction, as shown in Equation 2.30. The reaction scheme is shown as follows:
(2.29)
(2.30)
The reaction was carried out by purging He to remove air, in which 250 mL of aqueous
solution was used, consisting of either 1 or 10 wt% of glycerol. The catalytic test was
performed at 250 and 270 oC, resulting in autogeneous pressure of 37 and 52 atm. The
maximum conversion reached during the catalytic test was 30%, within 6 reaction hours, with
the hydrogen mole fraction on a dry basis being between 70 – 90%. Based on the test, they
suggested that by increasing the weight percentage of glycerol from 1% to 10%, a decrease in
glycerol conversion and hydrogen production was discovered.
Luo et al. [98] investigated the effect of Pt/Al2O3 composition and reaction conditions in the
aqueous phase reforming of glycerol to produce hydrogen. This type of reforming was
claimed to reduce the amount of carbon monoxide to a sufficiently low level in the reformed
gas and the endothermic reaction with a high equilibrium constant allowing the reforming
activity to be conducted at a relatively low temperature. Pt/Al2O3 was prepared using the
incipient wetness method in which γ-Al2O3 was impregnated with H2PtCl6 solution. The
reforming was conducted in a fixed bed reactor. One of the effects tested was the metal
loading on the catalyst where the hydrogen and methane selectivity were obtained at 70% and
10%, respectively. As for the reaction temperature and pressure, it was demonstrated that a
relatively high temperature (of 220 °C), with a system pressure of 2.50 MPa would facilitate
the reforming process to produce a high hydrogen yield, i.e. at 70%. It was observed that the
pathway to produce hydrogen by using aqueous reforming was accompanied by other parallel
reactions, such as dehydration, hydrogenation and methanation, which enable other liquid
61
products, such as methanol, ethanol, acetone and more chemicals to be produced. This will
remain as a major challenge for the hydrogen production.
2.3 Thermodynamic Analysis of Oxygenated Hydrocarbons Reforming
Thermodynamic equilibrium studies have been conducted by many researchers on
oxygenated hydrocarbons reforming. With reference to the homologues studied, most of the
work published focused on the steam or autothermal steam reforming of ethanol and glycerol
[20, 24, 37, 38, 99-112]. Very few thermodynamic analysis studies have been carried out on
ethylene glycol [113-116], and, to date, no publication has been reported on propylene glycol.
Various solver packages have been used, which include, but are not limited to the following:
ChemCAD, Aspen, Matlab Solver and Microsoft Excel.
The thermodynamic analysis on ethanol reforming consisted of steam reforming, partial
oxidation and autothermal reforming study. According to Rabenstein et al. [117] and Sun et
al. [105], based on the thermodynamic analysis conducted, the hydrogen yield represented in
moles is of this order: steam reforming (SR) > autothermal reforming (ATR)> partial
oxidation (POx). Steam reforming operates in an endothermic reaction, autothermal
reforming operates in a thermoneutral condition and partial oxidation operates in an
exothermic reaction. In order to operate within a carbon-free region in steam reforming, Lima
da Silva et al. [118] suggested that ethanol reforming should be operated free from the
ethylene formation region because ethanol is prone to ethylene formation. Wang and Wang
[119] observed that operating in inert gases, such as nitrogen, had a negative effect on partial
oxidation since it reduces the reaction exothermicity.
Thermodynamic equilibrium analysis work on ethylene glycol was conducted by Vagia and
Lemonidou [113, 114], and Xie et. al [116]. In the work of Vagia and Lemonidou, on steam
reforming of ethylene glycol thermodynamic analysis, they described that ethylene glycol can
be easily converted into gaseous products with the maximum temperature of hydrogen
production at 900 K (627 oC), which coincides with the full conversion temperature of
methane. They also demonstrated that more hydrogen, and less CO and CH4 could be
obtained at a higher steam to fuel ratio, and a carbon free region when the steam to fuel ratio
is three. Subsequently, Vagia and Lemonidou conducted similar research work, but this time
around on autothermal reforming. At a steam to fuel ratio of 6/1, with an oxygen to fuel ratio

62
of 0.26 and the entering temperature for oxygen similar to the reactor’s temperature of 900 K,
the hydrogen yield is the highest, which is lower but less than 10% different to the H2 yield in
comparison to the steam reforming of ethylene glycol.
Many researchers were interested in studying the thermodynamic analysis of glycerol in
comparison to the previously mentioned homologues. These studies consisted of steam
reforming [20, 24, 37, 38, 100-103, 111] and autothermal reforming [88, 112, 120-122].
Adhikari et al. [20] were among the early batch of researchers venturing into glycerol steam
reforming and conducted thermodynamic analysis of glycerol steam reforming. They
reported that steam reforming of glycerol would achieve a higher hydrogen yield of above
900K at atmospheric pressure with a steam to fuel ratio of 9/1. The finding is further
supported by Diuzeide and Amadeo [102] on thermodynamic analysis using the
stoichiometric method, which also suggested that a high yield of hydrogen is obtainable at a
high temperature and a high steam to glycerol ratio. Chen et al. [24] compared their
experimental findings at a pilot plant scale with the thermodynamic analysis of glycerol using
minimisation of Gibbs energy method (non-stoichiometric). They developed their in house
FORTRAN code and similarly found that the optimum steam to fuel ratio to obtain higher
hydrogen yield is at 9:1. Meanwhile, their experimental results yield lower hydrogen due to
incomplete steam conversion.
The thermodynamic analysis of glycerol reforming also incorporated a study on the presence
of a sorption element to adsorb CO2 in order to promote efficient water gas shift reaction and
thus inhibit the coke formation [37, 100, 101, 111, 123]. Chen et al. [100] conducted a
thermodynamic analysis study using the Gibbs free energy minimisation method and
assuming that CO2 is adsorbed and removed. According to Le Chatelier’s Principle, the
removal of CO2 may increase the formation of more CO2, and, ultimately, hydrogen via the
water gas shift reaction. The stoichiometric equation (2.2) is revisited:
( = -41.2 kJ/mol) (2.2)
The reduction of CO2 concentration on the right side of the equation (since it has been
adsorbed) will shift the reaction to the right to achieve the equilibrium of the reaction. In
return, the hydrogen mole per mole of glycerol can be improved from six moles to seven
molesH2/moleglycerol. They also suggested that the presence of a CO2 adsorbent assists the
reaction to perform similarly at 100K lower than the reaction without the adsorbent. Wang et
al. [37] also conducted a comparison between thermodynamic analysis using the non-

63
stoichiometric method and experimental work using CaO as the CO2 adsorbent. The results
were promising in minimising the CO content. In addition, Wei et al. [111] incorporated the
presence of calcium oxide (CaO) and iron oxide (Fe2O3) in their study to improve the
hydrogen yield. CaO is considered as the CO2 adsorbent whilst Fe2O3 acts as a solid oxygen
transfer material. Based on their thermodynamic analysis study, a high purity of hydrogen
(99.8%) with 12ppm CO is predicted without carbon formation at 450 °C and at atmospheric
pressure.
2.4 Reactor Technology
In order to obtain an acceptable reaction kinetic data in a lab scale study, a microchannel flow
reactor was used and reported in steam reforming and autothermal reforming reactions [2,
19]. The microchannel reactor consisted of two or more small channels, with each channel
having a depth and width at approximately 103 microns and the catalysts were pre-coated
prior to the experiments [19]. Cai et al. [19] demonstrated the usage of a 28 microchannel
reactor in SRE to investigate the effectiveness of Ir/CeO2, which was pre-coated on the
microchannel. It was demonstrated that by using similar conditions in the conventional fixed-
bed reactor and microchannel reactor, the ethanol conversion at 400 oC was 25% and 56%,
respectively. It was claimed that there was an improvement in the contact between the gas
phase and catalyst bed using a microchannel reactor. Further experiments demonstrated that
when a similar catalyst operated at 500 o
C, complete conversion was obtained initially for
both reactors. However, after 65 hours non-stop in a fixed-bed reactor, the conversion
dropped to 45% whilst it took 160 hours for the conversion to drop to 60% in the
microchannel reactor. The hydrogen concentration was reported as being higher in the
microchannel reactor (approximately 60%), by a few magnitudes higher than the fixed-bed
reactor. It was further claimed that the main difference between these two reactors was due to
the better heat management in the microchannel, which limits ceria sintering, and thus
enables it to operate for long hours, non-stop.
Cao et al. [124] developed an integrated microchannel reactor to study the kinetics of
methanol steam reforming over a Pd/ZnO catalyst. They claimed that this reactor provided a
completely isothermal environment; eliminating the ‘cold’ spots due to the temperature
gradient that leads to underestimation of the catalyst activity. A comparison has been made
between the microchannel and conventional fixed-bed reactor using a similar amount of

64
catalyst and weight hourly space velocity (WHSV). The conversion of methanol in the
microchannel reactor was relatively 10% higher compared to the fixed-bed reactor at a higher
temperature.
Casanovas et al. [2] demonstrated the performance of autothermal reforming in a
microreactor. Two platelets with a separate feed inlet were used with an interchangeable plate
located at the centre of the reactor. The roughness of the plates was varied by using two
treatments: acid or basic pickling treatment. The roughness of the plates was measured using
the Taylor-Hobson roughness tester apparatus. It was found that the roughness of the plates
did not affect the catalyst adherence. One side of the plate operated as the SRE mode using
Co/ZnO catalyst whilst the other operated as the ethanol combustion mode using a CuMnOx
catalyst. Even though the cobalt catalyst could be operated at a lower temperature, it formed
metallic cobalt on the surface, and thus oxidative steam reforming cannot be conducted on
the metallic surface to avoid aggregation and sintering. This is the main reason for the
existence of two separate plates for the separate modes. The efficiency of the microreactor
for this operation was calculated to be 71% based on a comparison between the amount of
ethanol practically required for combustion and the amount dictated by the thermodynamics
of oxidative steam reforming, as well as calculating the amount of hydrogen produced with
respect to the hydrogen formed by stoichiometry.
In addition, Tang et al. [125] made a comparison between steam and the autothermal
reforming of methanol using a packed-bed low-cost copper catalyst. Three reactor geometries
were used in this experimental and modelling work; they represented a large-radius reactor,
small-radius reactor and shorter length reactor. Since steam reforming is endothermic in
nature, the thermal resistance of the packed bed did not benefit this process, in comparison to
autothermal reforming. However, the temperature gradient in the steam reforming process
can be reduced provided that a longer and small-radius reactor is employed.
Apart from the microchannel reactor, the membrane reactor was also used for reforming
technology [18, 77, 126-131]. Yu et al. [18] demonstrated the efficiency of the membrane
reactor in ethanol steam reforming, which also includes water gas shift reaction. Ethanol and
water reacted over a Rh/SiO2 catalyst on steam reforming, and the effluent permeated through
a catalytic membrane, which, in this case, was a Pt/Knudsen membrane. By embedding the
WGS reaction, the permeated gas reacted in the presence of a Pt/Degussa P25 (TiO2) catalyst.
A comparison was made with a conventional reactor (CR), ethanol catalytic reforming in a

65
catalytic membrane reactor (ECR), and ethanol catalytic reforming in a catalytic membrane
together with water gas shift reaction (ECRW). It was deduced that ECRW greatly improved
the reduction of CO concentration at the permeate site compared to CR at a temperature
range of 300 to 450 oC with the lowest temperature giving the highest CO reduction (<1.0%).
ECR also reduced the CO concentration with a large difference compared to the CR from 400
to 500 oC but at a higher CO concentration compared to ECRW (5.1 – 8.4%). However, at
600 oC, the CO concentration for ECR and ECRW increased resulting from the reverse WGS,
which appeared to have an almost similar CO concentration to the CR (between 4.6 – 9.7%).
Kechagiopoulos et al. [1, 50] conducted their thermal decomposition, steam reforming and
autothermal reforming of ethylene glycol in a spouted bed reactor. A spouted bed reactor has
several advantages, such as short residence time, close to perfection particle mixing, efficient
heat circulation based on the cyclic movement of particles, low pressure drop and able to
withstand unstable oxygenate, such as bio-oil and heavier fractions of oxygenated
hydrocarbons. The steam and the vaporized ethylene glycol were injected into the reactor
from the pre-heated region, using the nozzles located at the cone apex. The mixture of the
steam and gas created jets, further entrained the catalyst particles and formed a spout within
the centreline of the reactor. The created spout acted as a dilute phase, and there was a slowly
moving annular dense bed through which the gas and the particles exchanged currents,
surrounding the spout. The used catalysts were separated from the product gases from the
spout region area in the parabolic fountain above the bed surface at very high momentum.
The catalysts used in this work consisted of a combination of Ni- and olivine. It was found
that the maximum hydrogen selectivity reached 95% using this reactor. In addition, coke
formation was minimised, resulting from rapid mixing between hot solid particles and cold
injected reactants.
66
2.5 Catalyst Development
The catalysts that can be used for other oxygenates are classified into noble metal and non-
noble metal catalysts.
2.5.1 Nickel catalyst
A common non-noble metal catalyst that is usually used is nickel, which has been long
established for natural gas reforming, with alumina (γ-Al2O3) as its support [72]. However,
oxygenates can easily dehydrate and form ethylene, which can pose serious coking problems
by undergoing polymerization that is promoted by the acid sites of alumina [23, 132, 133].
Ethanol steam reforming via Ni/Al2O3 was also studied by several researchers [132-139],
mainly to investigate any possibility of modification. Comas et al. [139] investigated the bio-
ethanol steam reforming via Ni/Al2O3 catalyst between 300 and 500 oC. The catalyst is of
very low surface area (15 m2/g) with a Ni loading of 35 wt%. Ethanol steam reforming via
this catalyst is active at 400 oC and above whilst at 500
oC and high steam to fuel ratio (6:1),
hydrogen reached up to 91% selectivity. They found that via this catalyst, ethanol would
dehydrogenate to acetaldehyde and dehydrate to ethylene, which would later be converted
into final gaseous products. They also suggested that there was no evidence of Ni/Al2O3
promoting the water gas shift reaction as the CO2 selectivity was lower; this finding is in
contrast to the finding made earlier by Aupretre et al. [140] who used 9.7 wt% Ni/Al2O3
catalyst for a similar test for which the selectivity of CO2 was high in their respective work.
Although it was not reported in the work of Aupretre et al., two possibilities (but interrelated
to each other) that may cause this difference are i) low surface area of Ni/Al2O3 catalyst in
Comas et al. work and ii) the difference in Ni weight % loading for both cases.
Buitrago-Sierra et al. [135] investigated the effects of adding Zn and Pt to Ni/Al2O3 with the
aim of reducing the dehydration reaction that produces ethylene. Zn and Pt were claimed by
D Duprez [141] to be able to promote a water gas shift reaction. In addition, Zn has been used
as an additive to reduce the acidity of alumina. The finding suggested that adding both
promoters inhibited ethylene production with a different mechanism, i.e. Zn, would alter the
alumina property by forming Zn(Al2O4)2 and un-reduced 1wt% Pt on Ni/Zn-Al2O3 would
not produce ethylene for up to 6 hours of operation.
Zhang et al. [17] made a modification of Ni/Al2O3 by including a second additional metal and
silica as support together with Al2O3. They reported that at 400 oC and a molar ratio of

67
hydrogen to ethanol of 4:1, with the addition of La and Co as the second metal, the hydrogen
selectivity was boosted by more than 20% (Co – 72.7% and La – 68.6%) compared to
Ni/Al2O3.SiO2 alone. Apart from that, CO selectivity was the lowest for La addition (0 – 1%).
Furthermore, the use of 30 wt% Ni with 5% La (30Ni5La/Al2O3.SiO2) can stabilize the SRE
for 44 hours without forming any intermediate as the effluent at 400 oC. It was further
claimed that the addition of a second metal greatly influenced the reducibility of the Ni
catalyst and made the catalyst active. However, the addition of an extra loading of a second
metal ( > 5 wt%) caused the reducibility to become difficult as the reducing temperature
shifted to a higher temperature.
The use of a Ni catalyst was also reported in DRE, using two oxides as support, i.e. Y2O3 and
ZrO2 (Bellido et al., 2009). There were two different loadings of Ni catalyst prepared, i.e.
5wt% and 10wt%. While it was observed that the hydrogen concentration was higher in 10
wt% loading (10NiYZ), compared to 5NiYZ from 700 – 800 oC, the carbon deposited was
also slightly higher on 10NiYZ. This resulted due to the greater Ni load on a similar total
surface area of oxides, and, thus, the Ni species on 10NiYZ tended to aggregate; hence, there
was less oxygen vacancy to activate the oxygen in CO2. As a result, the CO2 and CH4
conversion was relatively low compared to 5NiYZ.
As for glycerol, a Ni-based catalyst has also been widely used in much of the research.
Sanchez et al. [34], Adhikari et al. [39] and Cheng et al. [26] demonstrated steam reforming
of glycerol using a Ni-catalyst. Sanchez et al. and Cheng et al. worked on a Ni/Al2O3
catalyst. Both findings agreed that coke formation is inevitable with this type of catalyst.
Sanchez and colleagues focused on a Ni catalyst with Al2O3 as support, and operating at a
very high steam to fuel ratio (16:1) to avoid possible dehydration. Based on the Temperature
Programmed Reduction (TPR) analysis, Ni- in Al2O3 existed within three states: (i) Bulk or
free NiO (< 400 oC) (ii) NiO bonded to Al2O3 (between 400 and 690
oC) and (iii) NiO
incorporated into Al2O3, i.e. formation of NiAl2O4 (> 700 oC). The formation of NiAl2O4 may
result in a difficulty to reduce the nickel prior to the reforming reaction. They further
concluded that the catalyst deactivation was associated with the increase in the weight hourly
space velocity (WHSV), i.e. operating at low catalyst loading, hence affecting the hydrogen
selectivity. However, the changes of temperature (within range of 600 – 700 oC), did not
significantly affect the hydrogen selectivity. Nevertheless, a stable catalyst can be achieved
for a longer period at a higher operating temperature.

68
Cheng et al. worked a higher nickel loading (15 wt% Ni) in comparison to Sanchez et al. (5.8
wt% Ni). They concluded that the strong acid site heavily populated the catalyst surface, and
the rate behaviour can be represented using the Langmuir-Hinshelwood (LH) model with the
surface reaction as the rate determinant step. Glycerol undergoes molecular adsorption while
dissociative chemisorption of steam occurred on two different sites, i.e. acid and basic sites.
The coking formation has a positive dependency on increasing the glycerol to steam ratio, but
had an inverse effect on the increase in the steam to glycerol ratio.
Meanwhile, Adkhari et al. worked with different oxide supports, such as MgO, CeO2 and
TiO2, prepared via the wet impregnation method. From thermogravimetric (TGA) analysis,
each support had two peaks corresponding to the weight loss associated with the
decomposition or oxidation of nitrates and precursor materials from the catalyst. In all the
catalysts, sharp peaks were observed before 400 oC and no more weight loss was observed
after 500 oC; hence, calcination of catalyst was carried out at 500
oC. The XRD measurement
for the calcined catalyst suggested that the MgO peaks exhibited a strong peak, developing a
tetragonal peak whilst the other two supports only developed a monoclinic phase, hence
strong interaction developed between the Ni and MgO. The gas conversion was the highest
using the MgO support. H2 selectivity was comparable using MgO with CeO2 at 650 oC, with
a selectivity of 66%, whereas CeO2 with the highest selectivity attained was 67% at 550 oC.
TiO2 achieved the highest hydrogen selectivity at 650 oC with 62 %. The coke formation was
the highest in CeO2.
The use of Ni- in glycerol steam reforming was also reported by
Iriondo et al. [30] incorporating a modification of the γ-alumina with impregnated La2O3.
Cheng et al. [25] also introduced a bi-metallic catalyst of Co-Ni on alumina to increase the
catalyst activity of glycerol steam reforming.
Similarly, for ethylene glycol steam reforming, Kechagiopoulos et al. [51] also reported
using a commercial Ni-catalyst (C11-NK from Süd Chemie) in their attempt to mix ethylene
glycol, together with acetone and acetic acid as a model compound for bio-oil. For other
reforming technologies, Manfro et al. [95] conducted APR of glycerol using Ni/CeO2. They
reported that the increased use of glycerol reduced the hydrogen yield and that the glycerol
conversion was lower.
69
2.5.2 Noble Metals and Other Catalysts
Apart from nickel, noble metal catalysts have also been widely investigated. These include
the use of Rh, Ru, Pt, Pd, and Ir. It was claimed that the Rh catalyst is among the most
efficient catalysts for the reforming process as experimented by Cai et al. [74]. Cai et al.
demonstrated that the autothermal reforming with 1 wt% loading of Rh catalyst and CeO2 as
support was able to convert ethanol into H2 and C1 products at 400 oC with no detectable
intermediates. This suggested that Rh is favoured for the dissociation of C-C bond due to
lower intrinsic activation barrier. The highest hydrogen concentration was found to be 67 mol
% at 650 oC. However, high CO was also observed due to the reverse water gas shift
(RWGS) reaction that takes place above 650 oC. The results obtained from the time-on-
stream (TOS) experiment further suggests that the catalyst was stable at either 550 oC or 650
oC for 70 hours with no detectable deactivation. Although the ceria particle tended to
aggregate, and increased in crystalline size at a higher temperature, the size was still
sufficient for the reaction to take place.
Zhang et al. [142] tested three types of ceria-supported metal catalysts: Ir/CeO2, Ni/CeO2 and
Co/CeO2, in the steam reforming of glycerol and ethanol steam reforming to produce
hydrogen. All of the catalysts were prepared using the deposition-precipitation method. The
steam reforming was conducted in a continuous flow fixed-bed quartz micro-reactor under
atmospheric pressure within the temperature range of 250-600 °C. It was demonstrated that
the CeO2-supported Ir, Co and Ni catalysts are significantly active and selective for hydrogen
production from the steam reforming of ethanol and glycerol, in particular the Ir/CeO2, which
showed a promising catalytic performance for both reactions. The outlet H2 composition for
glycerol reforming reached 68.7 vol% and the selectivity was as high as 94.1%. This superior
performance of Ir/CeO2 was deduced from intimate contact between the Ir particles and ceria
based on the ceria-mediated redox process, which greatly promoted the reforming reaction
and the water gas shift reaction. It was reported that the deactivation problem was
encountered and no remarkable carbon was deposited on the catalyst site.
Luo et al. [98] investigated the effect of Pt/Al2O3 composition and reaction conditions in the
aqueous phase reforming of glycerol to produce hydrogen. One of the effects tested were the
metal loading on the catalyst where the hydrogen and methane selectivity were obtained at
70% and 10%, respectively. As for the reaction temperature and pressure, it was
70
demonstrated that a relatively high temperature (of 220 °C), with a corresponding system
pressure of 2.50 MPa would facilitate the reforming process to produce high hydrogen yield.
Apart from alumina as an excellent support, CeO2 is another support that has gained high
interest at the moment. CeO2 is claimed to be a better promoter that can lead to higher
dispersion of metal particles and strong interaction between the metal and the support.
Improved stability has also been reported [143]. However, a frequent start-up and shutdown
of the system may lead to the -CeO2 deactivation due to the formation of carbonate on the
surface of the catalyst [144]. Liu and colleagues investigated the phenomenon of Pt/CeO2
deactivation in water gas shift reaction and discovered that the shutdown of the system may
reduce the conversion of CO from 85% to 15%. A few tests were conducted and it was
confirmed that carbonates were formed on the CeO2 surface as well as on the Pt surface and
exerted an effect on the electronic properties on the Pt, thus deactivating the catalyst. It was
also observed that as the temperature went lower (i.e. became deactivated) more carbonates
formed. The regeneration of the catalyst was only possible by heating up the catalyst at a
temperature above 400 oC in air.
Zhang et al. [15] demonstrated the effectiveness of Ir/CeO2 on SRE. It was claimed that ceria
exhibited strong coke resistance due to its high oxygen-release capacity, and iridium formed a
strong interaction with ceria, and was stable and highly active. It was further observed that
ethanol was fully converted at a relatively low temperature (300 oC). The hydrogen
concentration was reported to be stable and consistent at 73% for 16 hours of reaction at 500
oC. Due to effective water gas shift reaction at higher temperature, CO was notably
eliminated from 400 oC and above. It was suggested that, by using Ir/CeO2, ethanol is
decomposed into acetaldehyde as the major intermediate. Later, acetaldehyde
dehydrogenated into CO and CH4 or decarbonylate into acetone. The CO and CH4 produced,
converted into CO2 and H2 through WGS and steam reforming of methane whilst acetone
underwent steam reforming of acetone for CO2 and H2 production. It was noted that at 450
oC, deactivation occurred after 20 hours of operation, caused by heavy coke deposition and
thus lowering the products output. CeO2 was found to aggregate and thus the crystalline size
increased accordingly. This is highly likely due to the large amount of acetone produced at
this temperature, which led to oligomeration that caused coke formation. However, at a
higher temperature (650 oC), there was no detectable coke formation for 300 hours of
operation since it was prevented by the strong interaction of Ir-CeO2, and acetone was fully
reformed into CO2 and H2.

71
Chen and colleagues [73] performed autothermal reforming (ATR) and oxidative steam
reforming (OSR) of ethanol using a few noble metal catalysts, such as Rh, Ru, Ir and Pd
combined with several oxides, such as Al2O3, ZnO, CeO2 and La2O3. It was observed that
Ir/La2O3 gave the best ethanol conversion on OSR at 400 oC, compared to the other Ir-based
catalysts of different oxides. Ir/La2O3 exhibited a similar performance for ATR with the
highest catalytic activity, but with a conversion rate of between 85-93% and an ethanol to
oxygen molar ratio of 0.9 – 1.3, with the best ratio being obtained between 0.9 and 1.0. From
the experiment, it was concluded that Ir/La2O3 was an excellent catalyst due to the high
hydrogen selectivity (1 wt% Ir gave H2 selectivity from 38 – 50% between 400 and 700 oC on
OSR and 60% H2 selectivity on ATR for an ethanol to oxygen molar ratio = 0.9), low by-
product (the lowest in methane compared to other combinations), low in acetaldehyde as well
as ethylene. Rh/La2O3 is also an excellent catalyst since it hindered the formation of
acetaldehyde and ethylene but was set back due to its cost. In addition, the Ru-catalyst
showed almost comparable performance to the Ir-catalyst. The combination of Ir/Al2O3 was
the worst since it produced large by-products, e.g. acetaldehyde, methane and ethylene, and
was prone to long-term coking.
The use of noble metals has also been reported by several authors in either ethylene glycol or
glycerol reforming technologies, such as Dauenhauer et al. (2006) on autothermal reforming
of both components (Rh, Rh-Ce, Rh-La, Pt with ceramic as support), and Chiodo et al. (2010)
on the comparison of Rh- with Ni- performance on glycerol steam reforming.
2.5.3 Effect of Promoters
Promoters are usually added to the catalyst for modifying the catalytic support structure, and,
hence, the electron distribution property within the catalyst system to enhance its reaction
performance. However, using it alone had no catalytic effect on the reaction. Among the
promoters that have been tested for the purpose of research in reforming works were: Ca
[133, 136, 145-149], Mg [35, 146, 147, 150-152], Gd [153-155], Nb [156], Zr [28, 157], and
La [158-161].
The research work on group II-doped catalysts on oxygenated hydrocarbons reforming is one
of recent interest. Due to its basicity, doping with calcium and magnesium is hypothesised to
be able to reduce the acidity of alumina as support; hence, inhibiting the dehydration of
oxygenates that lead to the formation of ethylene. The research works associated with
promoting calcium to Ni/Al2O3 were carried out by Choong et al. [132, 136], Elias et al.
72
[133] and Vizcaino et al. [162] on ethanol steam reforming. Vizcaino et al. also studied on
Mg addition to Ni/Al2O3 [152, 162].
Youn et al. introduced Mg and other metals as a second metal in Ni/Al2O3 catalyst for
autothermal ethanol reforming [163]. Carrerro et al. [164] also investigated the addition of
Mg and Ca to Ni-Cu/SiO2 catalyst for ethanol steam reforming. In another report, Medrano et
al. [149] doped Ni/Al2O3 with Ca and Mg on acetic acid and acetol steam reforming. With
regard to glycerol steam reforming, Wang et al. [165] doped Mg to Ni/Al2O3 catalyst and
calcium doped Ir/La2O3 had also been reported by Yang et al. on glycerol oxidative steam
reforming [145].
Choong et al. and Elias et al. showed a general agreement on their work and demonstrated
the following by doping Ca to Ni/Al2O3: i) reducing acidity of alumina, hence reducing the
dehydration to ethylene and ii) a stable reaction due to a significant reduction of coke. Elias
et al. further reported that an impregnated catalyst performed better than co-precipitated
catalyst. Choong et al. [136] reported that the coke produced is amorphous in nature via the
Ca promoted Ni/Al2O3 catalyst, and, hence, can be easily re-generated. While Ca reduced the
coke formation, the promotion of Mg was claimed to improve hydrogen selectivity [149,
164].
2.5.4 CO2 Sorption Materials
In enhancing higher hydrogen selectivity and improving water gas shift reaction, the
introduction of CO2 adsorption-enhanced material, such as dolomite of formula CaMg(CO3)2
was investigated in oxygenated hydrocarbons steam reforming. This was reported by
Dou et al. [29, 166] and Chen et al. [100]. Prior to these, CO2 sorption was also incorporated
in methane steam reforming as reported by Ding & Alpay [167]. Dou et al. [29] worked on
pure glycerol steam reforming with commercial Ni-catalyst, and a steam to carbon ratio of
3:1 (steam to fuel ratio of 9:1). By introducing dolomite, the hydrogen purity was greater
than 90%. The CO content in addition was lower compared to no sorption material, resulting
from the effect of CO2 sorption, and, therefore, increased the glycerol conversion to 100%.
However, CO2 sorption was no longer efficient at 700 oC resulting from carbonate
decomposition (calcination effect) in the presence of steam. The optimum temperature for
using calcined dolomite was at 500 oC, in respect of the highest hydrogen purity (97%) and
the longest CO2 breakthrough time. Chen et al., in their work on analysing the
thermodynamics of adsorption-enhanced steam reforming of glycerol, reported that the

73
maximum number of moles of hydrogen produced per mole of glycerol can be increased from
six to seven due to CO2 adsorption. Dou and colleagues also conducted a similar experiment
by using crude glycerol and the results were promising where the crude glycerol, consisting
of 70-90 wt% of glycerol with 15 wt% of water and methanol, had a gas conversion of 100%
[166].
2.6 Catalyst Preparation Method
Methods of preparing the catalyst also influence the effectiveness of the reforming
technology. The resulting output differed from each method in terms of the surface area
available for catalytic activity, the strength of the interaction between the metal catalyst and
the oxide support, the resulting particle shapes and sizes, and the homogeneity of the catalyst.
Among the preparation methods is the deposition-precipitation method, as performed by Cai
et al. [74] on Rh/CeO2. CeO2 was prepared by precipitation of ammonia cerium nitrate with
urea, whilst Rh of 1 wt% loading was prepared by suspending CeO2 powder into Rh-
contained aqueous solution (RhCl3.nH2O), heated and stirred until 175 oC and Na2O3 was
further added until the pH reached 9.0. The resulting mixture was dried overnight at 100 oC
and further calcined for 5 hours at 500 oC. It was reported that Rh slightly reduced the surface
area of ceria and was highly dispersed since it was not detected on XRD. This catalyst
exhibited stable activity for 70 hours non-stop operation without significant deactivation.
Youn et al. [168] demonstrated the effect of different preparation methods on ZrO2 support
catalyst. Two methods were used – sol-gel method (S-ZrO2) and templating sol-gel method
(M-ZrO2) – and compared with commercial ZrO2 (C-ZrO2). The metal catalyst used was Ni-,
of which they used the incipient wetness method to combine Ni with the prepared ZrO2
catalysts. It was found that by using different preparation methods, the particle shapes as
observed on TEM were totally different to each other. Whilst C-ZrO2 retained its spherical
shape and large particle size (>50 nm), S-ZrO2 formed more spherical and uniform particles
with the size ranging from 5 – 10 nm, and with textural pores formed by aggregation of the
particles. M-ZrO2, however, formed a mesoporous structure and sponge-like pore
morphology, with the smallest range of particle size. Whilst M-ZrO2 developed the highest
peak of tetragonal phase, as observed in XRD, followed by S-ZrO2, there was a mixture of
small tetragonal peaks and monoclinic phase observed for C-ZrO2. When the catalysts were
calcined, the XRD images depicted Ni oxidized to NiO indicating that all the catalysts were
well supported on the Zr surface without the formation of a solid-solution or incorporation

74
into a Zr lattice. When the catalysts were reduced, the XRD patterns indicated the presence
of Ni metallic. According to Scherrer’s calculation, the crystalline sizes of nickel species
decreases with increasing surface area, which suggests that Ni has a relatively weak
interaction after reduction due to the aggregation of Ni species. It was found that M-ZrO2 has
the highest H2 selectivity (~57%), slightly above S-ZrO2 and C-ZrO2, with most methane
being observed on C-ZrO2, and the least on M-ZrO2 after 15 hours of operation. This
suggests that M-ZrO2 had accelerated the reaction due to its framework porosity and firm
tetragonal phase.
Another method that attracted the researchers’ interest is the polymerization method. This has
been widely researched by Bellido et al. [78] in the dry reforming of ethanol (DRE) over
a Ni/Y2O3-ZrO2 catalyst. It was reported earlier that ZrO2 exhibited interesting metal-support
interactions on Ni, and even ZrO2-CeO2 support demonstrated high activity and was generally
stable. Therefore, it was intended to investigate the possibility of DRE by using
Ni/Y2O3-ZrO2 prepared by the one-step polymerization method, also known as the Pechini
method. There were three catalysts of which two were prepared using polymerization
methods with different Ni loadings, i.e. 5wt% (5NiYZ) and 10 wt% (10NiYZ). Another
catalyst was prepared by the impregnation method but the support was prepared by the
polymerization method, known as 5NiYZ (i). The total BET surface area was the least for
5NiYZ (i) due to the different preparation method. A firm tetragonal phase was observed on
XRD for both catalysts prepared using the polymerization method, suggesting a strong
interaction between Ni and the support. However, for 5NiYZ (i), both a tetragonal crystalline
and monoclinic phase were observed. In terms of crystalline size, 5NiYZ had half the
crystalline size of 5NiYZ (i), suggesting that the polymerization method assisted the catalyst
to aggregate to a lesser degree. In terms of catalytic performance, hydrogen production was
consistently stable for all catalysts above 700 oC for 350 minutes of operation. At 600
oC,
there was a significant drop in hydrogen concentration, since, thermodynamically, ethanol
decomposes into hydrogen, CO and CH4, which is an exothermic reaction, and is highly
favoured at low temperature, rather than DRE, which is endothermic in nature. Ethanol
dehydration occurred the most in 5NiYZ (i) and was very rapid at 800 oC, resulting in a high
amount of ethylene that led to possible coking. From the TPR results, it was observed that
most of the Ni species interacted with the oxygen vacancies on the support of 5NiYZ, with
less interaction on 5NiYZ (i) and 10NiYZ. This reflects the capability of 5NiYZ activating
the oxygen of CO2, and catalysing the removal of coke deposition whilst 5NiYZ (i), with less

75
vacancies of oxygen due to the aggregation of NiO, had the most carbon deposited on the
surface.
Casanovas et al. [2] conducted autothermal reforming of ethanol in microreactor, using two
platelets with two different modes, hence two different catalysts, i.e. Co/ZnO and CuMnOx.
In order for these catalysts to be coated on the microchannel, four methods were employed,
i.e. washcoating, in-situ co-precipitation, in-situ urea assisted co-precipitation and sol-gel.
The washcoating was prepared by ex-situ precipitation, and, for in-situ co-precipitation, it
was similar to washcoating except that the solution was controlled into the channels via a
capillary system. For in-situ with urea-assisted co-precipitation, instead of using nitrate
solution alone, as in the first two methods, urea was mixed together with the nitrate solution
and deposited into the channels. For the sol-gel method, the solution was prepared using the
necessary precursor earlier and introduced into the channels. It was found that washcoating
was the worst method for coating the catalyst since the weight loss was very high after the
reaction took place. This was followed by in-situ co-precipitation and the sol-gel method. In-
situ urea assisted was the best coating method, which resulted from the strong influence on
the heating rate between 1-10 oC/min. Heating at a high rate can cause low homogeneity and
poor adherence of coatings. Furthermore, the scanning electroscope microscopy (SEM)
images showed that by using the in-situ urea assisted method, the catalyst layer appeared
perfectly homogenous for Co/ZnO and slightly low for CuMnOx. However, at the microscale
level, both coated catalysts were distributed homogeneously with a narrow size distribution
pattern.
Manfro et al. [95] varied three methods – impregnation (NiCe-Imp), co-precipitation (NiCe-
CP) and combustion (NiCE-Com) – of Ni/CeO2 synthesis for the application in aqueous
phase reforming (APR) with nominal NiO content of 20wt% for all samples. While the
impregnation and co-precipitation methods are widely used, Ni/CeO2 by the combustion
method was prepared by melting the Ni & Ce precursors on a hot plate at 150 oC, and urea
was added to the molten solid. The mixture was combusted in a furnace at 600 oC and
calcined in flowing air at 700 oC for 3 hours. Based on catalyst characterization studies, the
BET surface area was the lowest in NiCe-Com, but there was no significant deviation
between the other two methods. Prior to reduction, NiCe-Com has the highest crystalline size
resulting from the sintering effect as calculated by the Scherrer equation, but reduced to the
smallest crystalline size after reduction. Upon catalyst testing, NiCe-Imp performed the best
at 250 oC in terms of glycerol conversion (20%), but at a higher temperature (270
oC), and,

76
ultimately, higher pressure, NiCe-Com reached a higher conversion (30%) after several hours
of experiment. Meanwhile, higher hydrogen selectivity was observed in NiCe-Com, as
compared to the other two methods, resulting from the lower Ni crystalline size after the
reduction.
2.7 Catalyst Deactivation
Catalyst deactivation in reforming is always associated with poisoning, sintering or coking
issues. Sehested [169] highlighted the four challenges in Ni-based steam reforming as
catalyst activity, sulphur poisoning, carbon formation and sintering. Although Cu- and Ni-
are both commercially cheaper than other noble metal catalysts, and give higher hydrogen
yield and selectivity, they are prone to sintering in industrial scale applications [170, 171].
This is the reason why copper is only used for methanol steam reforming, which occurs at a
relatively lower temperature compared to other oxygenates, to avoid metal sintering.
However, sintering may have an influence in resisting catalyst poisoning by reducing the
available sulphur absorption surface area as well as reducing the coking tendency by
increasing the catalyst particle size [172].
2.7.1 Coking
The most common issue associated with oxygenates reforming is coking, which results from
the uncatalytic reaction in the reactor bed, such as decomposition and dehydration of
oxygenated hydrocarbons. The coke deposition on the catalyst surface blocks the active sites
in long-term operation. The coke may be either an amorphous type of carbon or graphitic
crystalline carbon produced via different reaction routes. Trimm [173] classified the
formations of carbon from steam reforming activity as follows:
( = -172.4 kJ/mol) (2.31)
( = - 74.9 kJ/mol) (2.32)
( = -131 kJ/mol) (2.33)
(2.34)
In addition to these, the following reaction scheme was introduced [174]:

77
( = -90.1 kJ/mol) (2.35)
As for most cases, ethylene could also be possibly produced on the acid site of the catalyst
via dehydration, hence undergoing oligomerisation to form olefins and encapsulating the
active metal site [27, 134, 136].
Many catalysts were designed to either reduce the coke formation during the reaction or the
catalyst can self-regenerate by favouring defective carbon production that can easily be
combustible in-situ [164]. A typical Ni/Al2O3 catalyst is known by its tendency to form
graphitic carbon or carbon that encapsulates and blocks the active site causing deactivation,
which is very stable and difficult to be gasified. Catalytic activity via nickel may also cause
the formation of coke relating to catalytic methane decomposition, as shown in equation 8.2
[175].
Martin-Gullon et al. [176] highlighted the difference of the crystalline type of carbon that
may exist on the catalyst surface, which consists of several types of carbon nanotube (CNT)
and carbon nanofibre (CNF), as depicted in Figure 2.2. The formation of whisker carbons,
however, may destroy the catalyst due to its strength, and, therefore, must be inhibited [177].
Figure 2.2: Diagram of the different accepted structures of CNF and CNT. (Martin-Gullon et al.)
78
2.8 Conclusion on Literature Review
Based on this literature review, several conclusions could be drawn. Reforming processes for
hydrogen gas production are highly feasible for oxygenated hydrocarbons and they could
assist in energy saving. There are many technologies associated with reforming, such as
steam reforming, autothermal reforming, partial oxidation, dry reforming and aqueous phase
reforming. However, these processes are susceptible to other side reactions, such as
decomposition, dehydration and dehydrogenation that lead to the formation of coke and
hence deactivate the catalyst. Therefore, the choices of catalysts including the method of
preparing the catalysts are important in ensuring high hydrogen selectivity, apart from the
manipulation of thermodynamic properties, such as steam to fuel ratio (steam reforming and
APR), temperature and oxygen to carbon ratio (in autothermal reforming). Introducing
promoters may assist the catalyst activity in reforming by either inhibiting the carbon
formation or enhancing the reaction for higher hydrogen yield. These parameters are
important to reduce the side products that would lead to coke formation, hence deactivating
the catalyst.
Based on this literature study, it is found that the oxygenated hydrocarbons steam reforming
is feasible as demonstrated by many researchers. However, with relation to the series of poly-
ols homologues chosen, only propylene glycol reforming research has not been reported
elsewhere, while researches are intensely focused on ethanol and glycerol reforming. Nickel
is a common catalyst, with many modifications carried out to improve its performance either
by using a different support other than alumina, or introducing a promoter to enhance the
outlet gas selectivity. The research on calcium doping to nickel/alumina had only been
investigated to date on ethanol steam reforming, but not yet on other homologues, such as
ethylene glycol, propylene glycol and glycerol. While it was reported that encapsulating
carbon and graphitic carbon might form on a typical nickel/alumina catalyst surface, the
presence of calcium as a promoter to this nickel/alumina catalyst is yet to be investigated.
This literature review is therefore helpful in giving proper direction for this doctoral research
work.

79
2.8 References
[1] P. N. Kechagiopoulos, S. S. Voutetakis, A. A. Lemonidou, and I. A. Vasalos,
"Hydrogen Production via Reforming of the Aqueous Phase of Bio-Oil over
Ni/Olivine Catalysts in a Spouted Bed Reactor," Industrial & Engineering Chemistry
Research, vol. 48, pp. 1400-1408, Feb 4 2009.
[2] A. Casanovas, M. Saint-Gerons, F. Griffon, and J. Llorca, "Autothermal generation of
hydrogen from ethanol in a microreactor," International Journal of Hydrogen Energy,
vol. 33, pp. 1827-1833, 2008.
[3] L. Guo, X. B. Li, Q. Wang, and S. R. Wang, "Steam Reforming of Acetic Acid for
Hydrogen Production: Thermodynamic Calculations," Advanced Research on
Material Science and Environmental Science, vol. 534, pp. 141-145, 2012.
[4] M. Ni, D. Y. C. Leung, and M. K. H. Leung, "A review on reforming bio-ethanol for
hydrogen production," International Journal of Hydrogen Energy, vol. 32, pp. 3238-
3247, 2007.
[5] N. Kosaric, Z. Duvnjak, A. Farkas, H. Sahm, S. Bringer-Meyer, O. Goebel, and D.
Mayer, Ethanol: Wiley-VCH Verlag GmbH & Co. KGaA, 2000.
[6] (2008). Ethanol World Production Statistics. Available:
http://ethanol.net/2008/08/24/ethanol-world-production-statistics/
[7] R. Christoph, B. Schmidt, U. Steinberner, W. Dilla, and R. Karinen, Glycerol: Wiley-
VCH Verlag GmbH & Co. KGaA, 2000.
[8] K. S. Avasthi, R. N. Reddy, and S. Patel, "Challenges in the Production of Hydrogen
from Glycerol – A Biodiesel Byproduct Via Steam Reforming Process," Procedia
Engineering, vol. 51, pp. 423-429, 2013.
[9] B. Zhang, X. Tang, Y. Li, Y. Xu, and W. Shen, "Hydrogen production from steam
reforming of ethanol and glycerol over ceria-supported metal catalysts," International
Journal of Hydrogen Energy, vol. 32, pp. 2367-2373, 2007.
[10] Y. Zhang, M. A. Dubé, D. D. McLean, and M. Kates, "Biodiesel production from
waste cooking oil: 2. Economic assessment and sensitivity analysis," Bioresource
Technology, vol. 90, pp. 229-240, 2003.
[11] A. Nopharatana, P. C. Pullammanappallil, and W. P. Clarke, "Kinetics and dynamic
modelling of batch anaerobic digestion of municipal solid waste in a stirred reactor,"
Waste Management, vol. 27, pp. 595-603, 2007.

80
[12] S. Rebsdat and D. Mayer, Ethylene Glycol: Wiley-VCH Verlag GmbH & Co. KGaA,
2000.
[13] C. J. Sullivan, Propanediols: Wiley-VCH Verlag GmbH & Co. KGaA, 2000.
[14] A. M. Karim, Y. Su, J. Sun, C. Yang, J. J. Strohm, D. L. King, and Y. Wang, "A
comparative study between Co and Rh for steam reforming of ethanol," Applied
Catalysis B: Environmental, vol. 96, pp. 441-448, 2010.
[15] B. Zhang, W. Cai, Y. Li, Y. Xu, and W. Shen, "Hydrogen production by steam
reforming of ethanol over an Ir/CeO2 catalyst: Reaction mechanism and stability of
the catalyst," International Journal of Hydrogen Energy, vol. 33, pp. 4377-4386,
2008.
[16] W. Wang and Y. Wang, "Dry reforming of ethanol for hydrogen production:
Thermodynamic investigation," International Journal of Hydrogen Energy, vol. 34,
pp. 5382-5389, 2009.
[17] L. Zhang, W. Li, J. Liu, C. Guo, Y. Wang, and J. Zhang, "Ethanol steam reforming
reactions over Al2O3 · SiO2-supported Ni-La catalysts," Fuel, vol. 88, pp. 511-518,
2009.
[18] C.-Y. Yu, D.-W. Lee, S.-J. Park, K.-Y. Lee, and K.-H. Lee, "Study on a catalytic
membrane reactor for hydrogen production from ethanol steam reforming,"
International Journal of Hydrogen Energy, vol. 34, pp. 2947-2954, 2009.
[19] W. Cai, F. Wang, A. van Veen, C. Descorme, Y. Schuurman, W. Shen, and C.
Mirodatos, "Hydrogen production from ethanol steam reforming in a micro-channel
reactor," International Journal of Hydrogen Energy, vol. 35, pp. 1152-1159, 2010.
[20] S. Adhikari, S. Fernando, S. R. Gwaltney, S. D. Filip To, R. Mark Bricka, P. H.
Steele, and A. Haryanto, "A thermodynamic analysis of hydrogen production by
steam reforming of glycerol," International Journal of Hydrogen Energy, vol. 32, pp.
2875-2880, 2007.
[21] S. Adhikari, S. D. Fernando, and A. Haryanto, "Hydrogen production from glycerol:
An update," Energy Conversion and Management, vol. 50, pp. 2600-2604, 2009.
[22] S. Authayanun, A. Arpornwichanop, Y. Patcharauorachot, W. Wiyaratn, and S.
Assabumrungrat, "Hydrogen production from glycerol steam reforming for low- and
high-temperature PEMFCs," International Journal of Hydrogen Energy, vol. 36, pp.
267-275, Jan 2011.
81
[23] I. N. Buffoni, F. Pompeo, G. F. Santori, and N. N. Nichio, "Nickel catalysts applied in
steam reforming of glycerol for hydrogen production," Catalysis Communications,
vol. 10, pp. 1656-1660, Jul 25 2009.
[24] H. Chen, Y. Ding, N. T. Cong, B. Dou, V. Dupont, M. Ghadiri, and P. T. Williams,
"A comparative study on hydrogen production from steam-glycerol reforming:
thermodynamics and experimental," Renewable Energy, vol. 36, pp. 779-788, 2011.
[25] C. K. Cheng, S. Y. Foo, and A. A. Adesina, "Glycerol Steam Reforming over
Bimetallic Co-Ni/Al2O3," Industrial & Engineering Chemistry Research, vol. 49, pp.
10804-10817, Nov 3 2010.
[26] C. K. Cheng, S. Y. Foo, and A. A. Adesina, "Steam reforming of glycerol over
Ni/Al2O3 catalyst," Catalysis Today, vol. 178, pp. 25-33, Dec 15 2011.
[27] V. Chiodo, S. Freni, A. Galvagno, N. Mondello, and F. Frusteri, "Catalytic features of
Rh and Ni supported catalysts in the steam reforming of glycerol to produce
hydrogen," Applied Catalysis A: General, vol. 381, pp. 1-7, 2010.
[28] C. D. Dave and K. K. Pant, "Renewable hydrogen generation by steam reforming of
glycerol over zirconia promoted ceria supported catalyst," Renewable Energy, vol. 36,
pp. 3195-3202, Nov 2011.
[29] B. Dou, V. Dupont, G. Rickett, N. Blakeman, P. T. Williams, H. Chen, Y. Ding, and
M. Ghadiri, "Hydrogen production by sorption-enhanced steam reforming of
glycerol," Bioresource Technology, vol. 100, pp. 3540-3547, 2009.
[30] A. Iriondo, V. L. Barrio, J. F. Cambra, P. L. Arias, M. B. Güemez, R. M. Navarro, M.
C. Sanchez-Sanchez, and J. L. G. Fierro, "Influence of La2O3 modified support and
Ni and Pt active phases on glycerol steam reforming to produce hydrogen," Catalysis
Communications, vol. 10, pp. 1275-1278, 2009.
[31] A. Iriondo, V. L. Barrio, J. F. Cambra, P. L. Arias, M. B. Guemez, M. C. Sanchez-
Sanchez, R. M. Navarro, and J. L. G. Fierro, "Glycerol steam reforming over Ni
catalysts supported on ceria and ceria-promoted alumina," International Journal of
Hydrogen Energy, vol. 35, pp. 11622-11633, 2010.
[32] J. C. Li, H. Yu, G. X. Yang, F. Peng, D. L. Xie, H. J. Wang, and J. Yang, "Steam
Reforming of Oxygenate Fuels for Hydrogen Production: A Thermodynamic Study,"
Energy & Fuels, vol. 25, pp. 2643-2650, Jun 2011.
[33] K. K. Pant, R. Jain, and S. Jain, "Renewable hydrogen production by steam reforming
of glycerol over Ni/CeO2 catalyst prepared by precipitation deposition method,"
Korean Journal of Chemical Engineering, vol. 28, pp. 1859-1866, Sep 2011.
82
[34] E. A. Sánchez, M. A. D'Angelo, and R. A. Comelli, "Hydrogen production from
glycerol on Ni/Al2O3 catalyst," International Journal of Hydrogen Energy, vol. 35,
pp. 5902-5907, 2010.
[35] C. Wang, B. Dou, H. Chen, Y. Song, Y. Xu, X. Du, T. Luo, and C. Tan, "Hydrogen
production from steam reforming of glycerol by Ni–Mg–Al based catalysts in a fixed-
bed reactor," Chemical Engineering Journal, vol. 220, pp. 133-142, 2013.
[36] C. Wang, B. Dou, H. Chen, Y. Song, Y. Xu, X. Du, L. Zhang, T. Luo, and C. Tan,
"Renewable hydrogen production from steam reforming of glycerol by Ni–Cu–Al,
Ni–Cu–Mg, Ni–Mg catalysts," International Journal of Hydrogen Energy, vol. 38,
pp. 3562-3571, 2013.
[37] X. D. Wang, M. S. Li, S. R. Li, H. Wang, S. P. Wang, and X. B. Ma, "Hydrogen
production by glycerol steam reforming with/without calcium oxide sorbent A
comparative study of thermodynamic and experimental work," Fuel Processing
Technology, vol. 91, pp. 1812-1818, Dec 2010.
[38] X. D. Wang, N. Wang, M. S. Li, S. R. Li, S. P. Wang, and X. B. Ma, "Hydrogen
production by glycerol steam reforming with in situ hydrogen separation: A
thermodynamic investigation," International Journal of Hydrogen Energy, vol. 35,
pp. 10252-10256, Oct 2010.
[39] S. Adhikari, S. D. Fernando, and A. Haryanto, "Hydrogen production from glycerin
by steam reforming over nickel catalysts," Renewable Energy, vol. 33, pp. 1097-1100,
2008.
[40] Y.-C. Lin, "Catalytic valorization of glycerol to hydrogen and syngas," International
Journal of Hydrogen Energy, vol. 38, pp. 2678-2700, 2013.
[41] M. Slinn, K. Kendall, C. Mallon, and J. Andrews, "Steam reforming of biodiesel by-
product to make renewable hydrogen," Bioresource Technology, vol. 99, pp. 5851-
5858, 2008.
[42] D. Sutton, B. Kelleher, and J. R. H. Ross, "Review of literature on catalysts for
biomass gasification," Fuel Processing Technology, vol. 73, pp. 155-173, 2001.
[43] S. Guo, L. Guo, J. Yin, and H. Jin, "Supercritical water gasification of glycerol:
Intermediates and kinetics," The Journal of Supercritical Fluids, vol. 78, pp. 95-102,
2013.
[44] F. J. Gutiérrez Ortiz, P. Ollero, A. Serrera, and S. Galera, "Optimization of power and
hydrogen production from glycerol by supercritical water reforming," Chemical
Engineering Journal, vol. 218, pp. 309-318, 2013.
83
[45] F. J. Gutiérrez Ortiz, A. Serrera, S. Galera, and P. Ollero, "Experimental study of the
supercritical water reforming of glycerol without the addition of a catalyst," Energy,
vol. 56, pp. 193-206, 2013.
[46] Q. Liu, L. Liao, Z. Liu, and X. Dong, "Hydrogen production by glycerol reforming in
supercritical water over Ni/MgO-ZrO2 catalyst," Journal of Energy Chemistry, vol.
22, pp. 665-670, 2013.
[47] E. Markočič, B. Kramberger, J. G. van Bennekom, H. Jan Heeres, J. Vos, and Ž.
Knez, "Glycerol reforming in supercritical water; a short review," Renewable and
Sustainable Energy Reviews, vol. 23, pp. 40-48, 2013.
[48] T. Pairojpiriyakul, E. Croiset, W. Kiatkittipong, K. Kiatkittipong, A.
Arpornwichanop, and S. Assabumrungrat, "Hydrogen production from catalytic
supercritical water reforming of glycerol with cobalt-based catalysts," International
Journal of Hydrogen Energy, vol. 38, pp. 4368-4379, 2013.
[49] B. F. Tapah, R. C. D. Santos, and G. A. Leeke, "Processing of glycerol under sub and
supercritical water conditions," Renewable Energy, vol. 62, pp. 353-361, 2014.
[50] P. N. Kechagiopoulos, S. S. Voutetakis, A. A. Lemonidou, and I. A. Vasalos,
"Sustainable hydrogen production via reforming of ethylene glycol using a novel
spouted bed reactor," Catalysis Today, vol. 127, pp. 246-255, 2007.
[51] P. N. Kechagiopoulos, S. S. Voutetakis, A. A. Lemonidou, and I. A. Vasalos,
"Hydrogen Production via Steam Reforming of the Aqueous Phase of Bio-Oil in a
Fixed Bed Reactor," Energy & Fuels, vol. 20, pp. 2155-2163, 2006.
[52] M. A. Dasari, P. P. Kiatsimkul, W. R. Sutterlin, and G. J. Suppes, "Low-pressure
hydrogenolysis of glycerol to propylene glycol," Applied Catalysis a-General, vol.
281, pp. 225-231, Mar 18 2005.
[53] E. P. Maris and R. J. Davis, "Hydrogenolysis of glycerol over carbon-supported Ru
and Pt catalysts," Journal of Catalysis, vol. 249, pp. 328-337, Jul 25 2007.
[54] M. Baerns, Basic Principles in Applied Catalysis: Springer, 2004.
[55] H. H. Gunardson, Industrial Gases in Petrochemical Processing: Chemical
Industries: Taylor & Francis, 1997.
[56] L. Qadariyah, Mahfud, Sumarno, S. Machmudah, Wahyudiono, M. Sasaki, and M.
Goto, "Degradation of glycerol using hydrothermal process," Bioresource
Technology, vol. 102, pp. 9267-9271, 2011.

84
[57] L. Ma and D. H. He, "Hydrogenolysis of Glycerol to Propanediols Over Highly
Active Ru-Re Bimetallic Catalysts," Topics in Catalysis, vol. 52, pp. 834-844, Jun
2009.
[58] T. Miyazawa, S. Koso, K. Kunimori, and K. Tomishige, "Glycerol hydrogenolysis to
1,2-propanediol catalyzed by a heat-resistant ion-exchange resin combined with
Ru/C," Applied Catalysis a-General, vol. 329, pp. 30-35, Oct 1 2007.
[59] E. P. Maris, W. C. Ketchie, M. Murayama, and R. J. Davis, "Glycerol hydrogenolysis
on carbon-supported PtRu and AuRu bimetallic catalysts," Journal of Catalysis, vol.
251, pp. 281-294, Oct 25 2007.
[60] B. C. Miranda, R. J. Chimentão, J. B. O. Santos, F. Gispert-Guirado, J. Llorca, F.
Medina, F. L. Bonillo, and J. E. Sueiras, "Conversion of glycerol over 10%Ni/γ-
Al2O3 catalyst," Applied Catalysis B: Environmental.
[61] R. P. V. Faria, C. S. M. Pereira, V. M. T. M. Silva, J. M. Loureiro, and A. E.
Rodrigues, "Glycerol Valorization as Biofuel: Thermodynamic and Kinetic Study of
the Acetalization of Glycerol with Acetaldehyde," Industrial & Engineering
Chemistry Research, vol. 52, pp. 1538-1547, Jan 30 2013.
[62] M. E. Domine, E. E. Iojoiu, T. Davidian, N. Guilhaume, and C. Mirodatos,
"Hydrogen production from biomass-derived oil over monolithic Pt- and Rh-based
catalysts using steam reforming and sequential cracking processes," Catalysis Today,
vol. 133, pp. 565-573, Apr-Jun 2008.
[63] S. Wang, X. Li, F. Zhang, Q. Cai, Y. Wang, and Z. Luo, "Bio-oil catalytic reforming
without steam addition: Application to hydrogen production and studies on its
mechanism," International Journal of Hydrogen Energy, vol. 38, pp. 16038-16047,
2013.
[64] L. Zhang, R. H. Liu, R. Z. Yin, and Y. F. Mei, "Upgrading of bio-oil from biomass
fast pyrolysis in China: A review," Renewable & Sustainable Energy Reviews, vol.
24, pp. 66-72, Aug 2013.
[65] M. Mohammad, T. Kandaramath Hari, Z. Yaakob, Y. Chandra Sharma, and K.
Sopian, "Overview on the production of paraffin based-biofuels via catalytic
hydrodeoxygenation," Renewable and Sustainable Energy Reviews, vol. 22, pp. 121-
132, 2013.
[66] Q. Bu, H. W. Lei, A. H. Zacher, L. Wang, S. J. Ren, J. Liang, Y. Wei, Y. P. Liu, J. M.
Tang, Q. Zhang, and R. Ruan, "A review of catalytic hydrodeoxygenation of lignin-

85
derived phenols from biomass pyrolysis," Bioresource Technology, vol. 124, pp. 470-
477, Nov 2012.
[67] Y. Wang, T. He, K. Liu, J. Wu, and Y. Fang, "From biomass to advanced bio-fuel by
catalytic pyrolysis/hydro-processing: Hydrodeoxygenation of bio-oil derived from
biomass catalytic pyrolysis," Bioresource Technology, vol. 108, pp. 280-284, 2012.
[68] A. Wawrzetz, B. Peng, A. Hrabar, A. Jentys, A. A. Lemonidou, and J. A. Lercher,
"Towards understanding the bifunctional hydrodeoxygenation and aqueous phase
reforming of glycerol," Journal of Catalysis, vol. 269, pp. 411-420, 2010.
[69] N. Liu, Z. S. Yuan, C. W. Wang, S. D. Wang, C. X. Zhang, and S. J. Wang, "The role
of CeO(2)-ZrO(2) as support in the ZnO-ZnCr(2)O(4) catalysts for autothermal
reforming of methanol," Fuel Processing Technology, vol. 89, pp. 574-581, Jun 2008.
[70] I. Aartun, T. Gjervan, H. Venvik, O. Görke, P. Pfeifer, M. Fathi, A. Holmen, and K.
Schubert, "Catalytic conversion of propane to hydrogen in microstructured reactors,"
Chemical Engineering Journal, vol. 101, pp. 93-99, 2004.
[71] L. M. Gandia, G. Arzamedi, and P. M. Dieguez, Renewable Hydrogen Technologies:
Production, Purification, Storage, Applications and Safety: Elsevier Science, 2013.
[72] M. H. Youn, J. G. Seo, K. M. Cho, S. Park, D. R. Park, J. C. Jung, and I. K. Song,
"Hydrogen production by auto-thermal reforming of ethanol over nickel catalysts
supported on Ce-modified mesoporous zirconia: Effect of Ce/Zr molar ratio,"
International Journal of Hydrogen Energy, vol. 33, pp. 5052-5059, 2008.
[73] H. Chen, H. Yu, Y. Tang, M. Pan, G. Yang, F. Peng, H. Wang, and J. Yang,
"Hydrogen production via autothermal reforming of ethanol over noble metal
catalysts supported on oxides," Journal of Natural Gas Chemistry, vol. 18, pp. 191-
198, 2009.
[74] W. Cai, F. Wang, A. C. Van Veen, H. Provendier, C. Mirodatos, and W. Shen,
"Autothermal reforming of ethanol for hydrogen production over an Rh/CeO2
catalyst," Catalysis Today, vol. 138, pp. 152-156, 2008.
[75] D. Markova, G. Bazbauers, K. Valters, R. Alhucema Arias, C. Weuffen, and L.
Rochlitz, "Optimization of bio-ethanol autothermal reforming and carbon monoxide
removal processes," Journal of Power Sources, vol. 193, pp. 9-16, 2009.
[76] P. J. Dauenhauer, J. R. Salge, and L. D. Schmidt, "Renewable hydrogen by
autothermal steam reforming of volatile carbohydrates," Journal of Catalysis, vol.
244, pp. 238-247, 2006.
86
[77] K.-H. Lin, A. C. C. Chang, W.-H. Lin, S.-H. Chen, C.-Y. Chang, and H.-F. Chang,
"Autothermal steam reforming of glycerol for hydrogen production over packed-bed
and Pd/Ag alloy membrane reactors," International Journal of Hydrogen Energy, vol.
38, pp. 12946-12952, 2013.
[78] J. D. A. Bellido, E. Y. Tanabe, and E. M. Assaf, "Carbon dioxide reforming of
ethanol over Ni/Y2O3-ZrO2 catalysts," Applied Catalysis B: Environmental, vol. 90,
pp. 485-488, 2009.
[79] J. Blanchard, H. Oudghiri-Hassani, N. Abatzoglou, S. Jankhah, and F. Gitzhofer,
"Synthesis of nanocarbons via ethanol dry reforming over a carbon steel catalyst,"
Chemical Engineering Journal, vol. 143, pp. 186-194, 2008.
[80] K. De Oliveira-Vigier, N. Abatzoglou, and F. Gitzhofer, "Dry-Reforming of Ethanol
in the Presence of a 316 Stainless Steel Catalyst," The Canadian Journal of Chemical
Engineering, vol. 83, pp. 978-984, 2005.
[81] S. Jankhah, N. Abatzoglou, and F. Gitzhofer, "Thermal and catalytic dry reforming
and cracking of ethanol for hydrogen and carbon nanofilaments' production,"
International Journal of Hydrogen Energy, vol. 33, pp. 4769-4779, 2008.
[82] G. R. Kale and B. D. Kulkarni, "Thermoneutral point analysis of ethanol dry
autothermal reforming," Chemical Engineering Journal, vol. 165, pp. 864-873, 2010.
[83] Z. Al-Hamamre and M. A. Hararah, "Hydrogen production by thermal partial
oxidation of ethanol: Thermodynamics and kinetics study," International Journal of
Hydrogen Energy, vol. 35, pp. 5367-5377, 2010.
[84] D. K. Liguras, K. Goundani, and X. E. Verykios, "Production of hydrogen for fuel
cells by catalytic partial oxidation of ethanol over structured Ni catalysts," Journal of
Power Sources, vol. 130, pp. 30-37, 2004.
[85] W. Wang and Y. Wang, "Thermodynamic analysis of hydrogen production via partial
oxidation of ethanol," International Journal of Hydrogen Energy, vol. 33, pp. 5035-
5044, 2008.
[86] E. Kraleva, S. Sokolov, M. Schneider, and H. Ehrich, "Support effects on the
properties of Co and Ni catalysts for the hydrogen production from bio-ethanol partial
oxidation," International Journal of Hydrogen Energy, vol. 38, pp. 4380-4388, 2013.
[87] C. P. Rodrigues and M. Schmal, "Nickel–alumina washcoating on monoliths for the
partial oxidation of ethanol to hydrogen production," International Journal of
Hydrogen Energy, vol. 36, pp. 10709-10718, 2011.

87
[88] W. Wang, "Thermodynamic analysis of glycerol partial oxidation for hydrogen
production," Fuel Processing Technology, vol. 91, pp. 1401-1408, 2010.
[89] D. C. Rennard, J. S. Kruger, B. C. Michael, and L. D. Schmidt, "Long-Time Behavior
of the Catalytic Partial Oxidation of Glycerol in an Autothermal Reactor," Industrial
& Engineering Chemistry Research, vol. 49, pp. 8424-8432, Sep 15 2010.
[90] D. C. Rennard, J. S. Kruger, and L. D. Schmidt, "Autothermal Catalytic Partial
Oxidation of Glycerol to Syngas and to Non-Equilibrium Products," Chemsuschem,
vol. 2, pp. 89-98, 2009.
[91] A. V. Tokarev, A. V. Kirilin, E. V. Murzina, K. Eränen, L. M. Kustov, D. Y. Murzin,
and J. P. Mikkola, "The role of bio-ethanol in aqueous phase reforming to sustainable
hydrogen," International Journal of Hydrogen Energy, vol. 35, pp. 12642-12649,
2010.
[92] R. R. Davda, J. W. Shabaker, G. W. Huber, R. D. Cortright, and J. A. Dumesic, "A
review of catalytic issues and process conditions for renewable hydrogen and alkanes
by aqueous-phase reforming of oxygenated hydrocarbons over supported metal
catalysts," Applied Catalysis B: Environmental, vol. 56, pp. 171-186, 2005.
[93] Y. Xu, Z. Tian, G. Wen, Z. Xu, W. Qu, and L. Lin, "Production of COx-free
Hydrogen by Alkali Enhanced Hydrothermal Catalytic Reforming of Biomass-derived
Alcohols," Chemistry Letters, vol. 35, pp. 216-217, 2006.
[94] G. Wen, Y. Xu, H. Ma, Z. Xu, and Z. Tian, "Production of hydrogen by aqueous-
phase reforming of glycerol," International Journal of Hydrogen Energy, vol. 33, pp.
6657-6666, 2008.
[95] R. L. Manfro, A. F. da Costa, N. F. P. Ribeiro, and M. M. V. M. Souza, "Hydrogen
production by aqueous-phase reforming of glycerol over nickel catalysts supported on
CeO2," Fuel Processing Technology, vol. 92, pp. 330-335, 2011.
[96] J. W. Shabaker, G. W. Huber, R. R. Davda, R. D. Cortright, and J. A. Dumesic,
"Aqueous-phase reforming of ethylene glycol over supported platinum catalysts,"
Catalysis Letters, vol. 88, pp. 1-8, May 2003.
[97] R. R. Davda, J. W. Shabaker, G. W. Huber, R. D. Cortright, and J. A. Dumesic,
"Aqueous-phase reforming of ethylene glycol on silica-supported metal catalysts,"
Applied Catalysis B: Environmental, vol. 43, pp. 13-26, 2003.
[98] N. Luo, X. Fu, F. Cao, T. Xiao, and P. P. Edwards, "Glycerol aqueous phase
reforming for hydrogen generation over Pt catalyst - Effect of catalyst composition
and reaction conditions," Fuel, vol. 87, pp. 3483-3489, 2008.

88
[99] S. Adhikari, S. Fernando, and A. Haryanto, "A comparative thermodynamic and
experimental analysis on hydrogen production by steam reforming of glycerin,"
Energy & Fuels, vol. 21, pp. 2306-2310, Jul-Aug 2007.
[100] H. S. Chen, T. F. Zhang, B. L. Dou, V. Dupont, P. Williams, M. Ghadiri, and Y. L.
Ding, "Thermodynamic analyses of adsorption-enhanced steam reforming of glycerol
for hydrogen production," International Journal of Hydrogen Energy, vol. 34, pp.
7208-7222, Sep 2009.
[101] C. K. Cheng, S. Y. Foo, and A. A. Adesina, "Thermodynamic analysis of glycerol-
steam reforming in the presence of CO2 or H-2 as carbon gasifying agent,"
International Journal of Hydrogen Energy, vol. 37, pp. 10101-10110, Jul 2012.
[102] M. L. Dieuzeide and N. Amadeo, "Thermodynamic Analysis of Glycerol Steam
Reforming," Chemical Engineering & Technology, vol. 33, pp. 89-96, Jan 2010.
[103] Y. H. Li, W. J. Wang, B. H. Chen, and Y. Y. Cao, "Thermodynamic analysis of
hydrogen production via glycerol steam reforming with CO(2) adsorption,"
International Journal of Hydrogen Energy, vol. 35, pp. 7768-7777, Aug 2010.
[104] C. C. R. S. Rossi, C. G. Alonso, O. A. C. Antunes, R. Guirardello, and L. Cardozo,
"Thermodynamic analysis of steam reforming of ethanol and glycerine for hydrogen
production," International Journal of Hydrogen Energy, vol. 34, pp. 323-332, Jan
2009.
[105] S. H. Sun, W. Yan, P. Q. Sun, and J. W. Chen, "Thermodynamic analysis of ethanol
reforming for hydrogen production," Energy, vol. 44, pp. 911-924, Aug 2012.
[106] K. Vasudeva, N. Mitra, P. Umasankar, and S. C. Dhingra, "Steam reforming of
ethanol for hydrogen production: Thermodynamic analysis," International Journal of
Hydrogen Energy, vol. 21, pp. 13-18, Jan 1996.
[107] W. Wang and Y. Q. Wang, "Thermodynamic analysis of steam reforming of ethanol
for hydrogen generation," International Journal of Energy Research, vol. 32, pp.
1432-1443, Dec 2008.
[108] W. J. Wang and Y. Y. Cao, "A combined thermodynamic and experimental study on
chemical-looping ethanol reforming with carbon dioxide capture for hydrogen
generation," International Journal of Energy Research, vol. 37, pp. 25-34, Jan 2013.
[109] W. J. Wang and Y. Y. Cao, "Combined Carbon Dioxide Reforming with Steam
Reforming of Ethanol for Hydrogen Production: Thermodynamic Analysis,"
International Journal of Green Energy, vol. 9, pp. 503-516, 2012.

89
[110] X. D. Wang, S. R. Li, H. Wang, B. Liu, and X. B. Ma, "Thermodynamic Analysis of
Glycerin Steam Reforming," Energy & Fuels, vol. 22, pp. 4285-4291, Nov-Dec 2008.
[111] L. G. Wei, K. L. Li, and Y. C. Ma, "Thermodynamic Analysis of Glycerol Steam
Reforming using Calcium Oxide and Iron Oxide for High-Purity Hydrogen
Production," International Journal of Chemical Reactor Engineering, vol. 10, 2012.
[112] S. Authayanun, A. Arpornwichanop, W. Paengjuntuek, and S. Assabumrungrat,
"Thermodynamic study of hydrogen production from crude glycerol autothermal
reforming for fuel cell applications," International Journal of Hydrogen Energy, vol.
35, pp. 6617-6623, 2010.
[113] E. C. Vagia and A. A. Lemonidou, "Thermodynamic analysis of hydrogen production
via autothermal steam reforming of selected components of aqueous bio-oil fraction,"
International Journal of Hydrogen Energy, vol. 33, pp. 2489-2500, May 2008.
[114] E. C. Vagia and A. A. Lemonidou, "Thermodynamic analysis of hydrogen production
via steam reforming of selected components of aqueous bio-oil fraction,"
International Journal of Hydrogen Energy, vol. 32, pp. 212-223, Feb 2007.
[115] N. Wang, N. Perret, and A. Foster, "Sustainable hydrogen production for fuel cells by
steam reforming of ethylene glycol: A consideration of reaction thermodynamics,"
International Journal of Hydrogen Energy, vol. 36, pp. 5932-5940, May 2011.
[116] J. J. Xie, D. R. Su, X. L. Yin, C. Z. Wu, and J. X. Zhu, "Thermodynamic analysis of
aqueous phase reforming of three model compounds in bio-oil for hydrogen
production," International Journal of Hydrogen Energy, vol. 36, pp. 15561-15572,
Dec 2011.
[117] G. Rabenstein and V. Hacker, "Hydrogen for fuel cells from ethanol by steam-
reforming, partial-oxidation and combined auto-thermal reforming: A thermodynamic
analysis," Journal of Power Sources, vol. 185, pp. 1293-1304, Dec 1 2008.
[118] A. Lima da Silva, C. d. F. Malfatti, and I. L. Müller, "Thermodynamic analysis of
ethanol steam reforming using Gibbs energy minimization method: A detailed study
of the conditions of carbon deposition," International Journal of Hydrogen Energy,
vol. 34, pp. 4321-4330, 2009.
[119] W. J. Wang and Y. Q. Wang, "Dry reforming of ethanol for hydrogen production:
Thermodynamic investigation," International Journal of Hydrogen Energy, vol. 34,
pp. 5382-5389, Jul 2009.
[120] G. R. Kale and B. D. Kulkarni, "Thermodynamic analysis of dry autothermal
reforming of glycerol," Fuel Processing Technology, vol. 91, pp. 520-530, May 2010.

90
[121] H. Wang, X. D. Wang, M. S. Li, S. R. Li, S. P. Wang, and X. B. Ma,
"Thermodynamic analysis of hydrogen production from glycerol autothermal
reforming," International Journal of Hydrogen Energy, vol. 34, pp. 5683-5690, Jul
2009.
[122] G. Yang, H. Yu, F. Peng, H. Wang, J. Yang, and D. Xie, "Thermodynamic analysis of
hydrogen generation via oxidative steam reforming of glycerol," Renewable Energy,
vol. 36, pp. 2120-2127, 2011.
[123] L. He, J. M. S. Parra, E. A. Blekkan, and D. Chen, "Towards efficient hydrogen
production from glycerol by sorption enhanced steam reforming," Energy &
Environmental Science, vol. 3, pp. 1046-1056, 2010.
[124] C. S. Cao, G. Xia, J. Holladay, E. Jones, and Y. Wang, "Kinetic studies of methanol
steam reforming over Pd/ZnO catalyst using a microchannel reactor," Applied
Catalysis a-General, vol. 262, pp. 19-29, May 10 2004.
[125] H.-Y. Tang, P. Erickson, H. C. Yoon, and C.-H. Liao, "Comparison of steam and
autothermal reforming of methanol using a packed-bed low-cost copper catalyst,"
International Journal of Hydrogen Energy, vol. 34, pp. 7656-7665, 2009.
[126] A. Iulianelli, T. Longo, and A. Basile, "CO-free hydrogen production by steam
reforming of acetic acid carried out in a Pd-Ag membrane reactor: The effect of co-
current and counter-current mode," International Journal of Hydrogen Energy, vol.
33, pp. 4091-4096, Aug 2008.
[127] D. Jansen, J. W. Dijkstra, R. W. van den Brink, T. A. Peters, M. Stange, R. Bredesen,
A. Goldbach, H. Y. Xu, A. Gottschalk, and A. Doukelis, "Hydrogen membrane
reactors for CO2 capture," Greenhouse Gas Control Technologies 9, vol. 1, pp. 253-
260, 2009.
[128] P. K. Seelam, S. Liguori, A. Iulianelli, P. Pinacci, V. Calabro, M. Huuhtanen, R.
Keiski, V. Piemonte, S. Tosti, M. De Falco, and A. Basile, "Hydrogen production
from bio-ethanol steam reforming reaction in a Pd/PSS membrane reactor," Catalysis
Today, vol. 193, pp. 42-48, Oct 15 2012.
[129] S. Tosti, M. Zerbo, A. Basile, V. Calabro, F. Borgognoni, and A. Santucci, "Pd-based
membrane reactors for producing ultra pure hydrogen: Oxidative reforming of bio-
ethanol," International Journal of Hydrogen Energy, vol. 38, pp. 701-707, Jan 11
2013.
[130] D. L. Xie, W. Y. Qiao, Z. L. Wang, W. X. Wang, H. Yu, and F. Peng,
"Reaction/separation coupled equilibrium modeling of steam methane reforming in

91
fluidized bed membrane reactors," International Journal of Hydrogen Energy, vol.
35, pp. 11798-11809, Nov 2010.
[131] X. L. Zhang, W. P. Wang, G. X. Xiong, and W. S. Yang, "Hydrogen Permeation in a
Thin Pd-Cu Alloy Membrane Reactor for Steam Reforming of Ethanol," Chinese
Journal of Catalysis, vol. 31, pp. 1049-1053, Aug 2010.
[132] C. K. S. Choong, L. Huang, Z. Y. Zhong, J. Y. Lin, L. Hong, and L. W. Chen, "Effect
of calcium addition on catalytic ethanol steam reforming of Ni/Al2O3: II.
Acidity/basicity, water adsorption and catalytic activity," Applied Catalysis a-
General, vol. 407, pp. 155-162, Nov 4 2011.
[133] K. F. M. Elias, A. F. Lucredio, and E. M. Assaf, "Effect of CaO addition on acid
properties of Ni-Ca/Al2O3 catalysts applied to ethanol steam reforming,"
International Journal of Hydrogen Energy, vol. 38, pp. 4407-4417, Apr 15 2013.
[134] A. L. Alberton, M. M. V. M. Souza, and M. Schmal, "Carbon formation and its
influence on ethanol steam reforming over Ni/Al2O3 catalysts," Catalysis Today, vol.
123, pp. 257-264, 2007.
[135] R. Buitrago-Sierra, J. Ruiz-Martínez, J. C. Serrano-Ruiz, F. Rodríguez-Reinoso, and
A. Sepúlveda-Escribano, "Ethanol steam reforming on Ni/Al2O3 catalysts: Effect of
the addition of Zn and Pt," Journal of Colloid and Interface Science, vol. 383, pp.
148-154, 2012.
[136] C. K. S. Choong, Z. Y. Zhong, L. Huang, Z. Wang, T. P. Ang, A. Borgna, J. Y. Lin,
L. Hong, and L. W. Chen, "Effect of calcium addition on catalytic ethanol steam
reforming of Ni/Al2O3: I. Catalytic stability, electronic properties and coking
mechanism," Applied Catalysis a-General, vol. 407, pp. 145-154, Nov 4 2011.
[137] H. V. Fajardo and L. F. D. Probst, "Production of hydrogen by steam reforming of
ethanol over Ni/Al2O3 spherical catalysts," Applied Catalysis A: General, vol. 306,
pp. 134-141, 2006.
[138] N. Palmeri, V. Chiodo, S. Freni, F. Frusteri, J. C. J. Bart, and S. Cavallaro, "Hydrogen
from oxygenated solvents by steam reforming on Ni/Al2O3 catalyst," International
Journal of Hydrogen Energy, vol. 33, pp. 6627-6634, 2008.
[139] J. Comas, F. Mariño, M. Laborde, and N. Amadeo, "Bio-ethanol steam reforming on
Ni/Al2O3 catalyst," Chemical Engineering Journal, vol. 98, pp. 61-68, 2004.
[140] F. Aupretre, C. Descorme, and D. Duprez, "Bio-ethanol catalytic steam reforming
over supported metal catalysts," Catalysis Communications, vol. 3, pp. 263-267, Jun
2002.
92
[141] D. Duprez, "Selective Steam Reforming of Aromatic-Compounds on Metal-
Catalysts," Applied Catalysis a-General, vol. 82, pp. 111-157, Mar 16 1992.
[142] B. Zhang, X. Tang, Y. Li, W. Cai, Y. Xu, and W. Shen, "Steam reforming of bio-
ethanol for the production of hydrogen over ceria-supported Co, Ir and Ni catalysts,"
Catalysis Communications, vol. 7, pp. 367-372, 2006.
[143] D. Palo, R. Dagle, and J. Holladay, "Methanol Steam Reforming for Hydrogen
Production," Chemical Reviews, vol. 107, pp. 3992 - 4021, 2007.
[144] X. Liu, W. Ruettinger, X. Xu, and R. Farrauto, "Deactivation of Pt/CeO2 water-gas
shift catalysts due to shutdown/startup modes for fuel cell applications," Applied
Catalysis B: Environmental, vol. 56, pp. 69-75, 2005.
[145] G. Yang, H. Yu, X. Huang, F. Peng, and H. Wang, "Effect of calcium dopant on
catalysis of Ir/La2O3 for hydrogen production by oxidative steam reforming of
glycerol," Applied Catalysis B: Environmental, vol. 127, pp. 89-98, 2012.
[146] A. Carrero, J. A. Calles, and A. J. Vizcaíno, "Effect of Mg and Ca addition on coke
deposition over Cu-Ni/SiO2 catalysts for ethanol steam reforming," Chemical
Engineering Journal, vol. 163, pp. 395-402, 2010.
[147] A. J. Vizcaino, A. Carrero, and J. A. Calles, "Ethanol steam reforming on Mg- and
Ca-modified Cu-Ni/SBA-15 catalysts," Catalysis Today, vol. 146, pp. 63-70, Aug 15
2009.
[148] P. Biswas and D. Kunzru, "Steam reforming of ethanol on Ni-CeO2-ZrO2 catalysts:
Effect of doping with copper, cobalt and calcium," Catalysis Letters, vol. 118, pp. 36-
49, Oct 2007.
[149] J. A. Medrano, M. Oliva, J. Ruiz, L. Garcia, and J. Afauzo, "Catalytic steam
reforming of model compounds of biomass pyrolysis liquids in fluidized bed reactor
with modified Ni/Al catalysts," Journal of Analytical and Applied Pyrolysis, vol. 85,
pp. 214-225, May 2009.
[150] F. Bimbela, D. Chen, J. Ruiz, L. Garcia, and J. Arauzo, "Ni/Al coprecipitated
catalysts modified with magnesium and copper for the catalytic steam reforming of
model compounds from biomass pyrolysis liquids," Applied Catalysis B-
Environmental, vol. 119, pp. 1-12, May 30 2012.
[151] M. L. Dieuzeide, M. Jobbagy, and N. Amadeo, "Glycerol steam reforming over Ni/γ-
Al2O3 catalysts, modified with Mg(II). Effect of Mg (II) content," Catalysis Today,
vol. 213, pp. 50-57, 2013.

93
[152] A. J. Vizcaino, P. Arena, G. Baronetti, A. Carrero, J. A. Calles, M. A. Laborde, and
N. Amadeo, "Ethanol steam reforming on Ni/Al(2)O(3) catalysts: Effect of Mg
addition," International Journal of Hydrogen Energy, vol. 33, pp. 3489-3492, Jul
2008.
[153] T. J. Huang and H. M. Chen, "Hydrogen production via steam reforming of methanol
over Cu/(Ce,Gd)O2-x catalysts," International Journal of Hydrogen Energy, vol. 35,
pp. 6218-6226, Jun 2010.
[154] M. Godinho, R. D. Goncalves, E. R. Leite, C. W. Raubach, N. L. V. Carreno, L. F. D.
Probst, E. Longo, and H. V. Fajardo, "Gadolinium-doped cerium oxide nanorods:
novel active catalysts for ethanol reforming," Journal of Materials Science, vol. 45,
pp. 593-598, Feb 2010.
[155] J. Papavasiliou, G. Avgouropoulos, and T. Ioannides, "Effect of dopants on the
performance of CuO-CeO2 catalysts in methanol steam reforming," Applied Catalysis
B-Environmental, vol. 69, pp. 226-234, Jan 15 2007.
[156] E. Ramirez-Cabrera, N. Laosiripojana, A. Atkinson, and D. Chadwick, "Methane
conversion over Nb-doped ceria," Catalysis Today, vol. 78, pp. 433-438, Feb 28 2003.
[157] S. J. Yoon, Y. C. Choi, and J. G. Lee, "Hydrogen production from biomass tar by
catalytic steam reforming," Energy Conversion and Management, vol. 51, pp. 42-47,
Jan 2010.
[158] M. Sugisawa, K. Takanabe, M. Harada, J. Kubota, and K. Domen, "Effects of La
addition to Ni/Al2O3 catalysts on rates and carbon deposition during steam reforming
of n-dodecane," Fuel Processing Technology, vol. 92, pp. 21-25, Jan 2011.
[159] W. Wang, R. Ran, and Z. P. Shao, "Lithium and lanthanum promoted Ni-Al2O3 as an
active and highly coking resistant catalyst layer for solid-oxide fuel cells operating on
methane," Journal of Power Sources, vol. 196, pp. 90-97, Jan 1 2011.
[160] A. Serrano-Lotina, L. Rodriguez, G. Munoz, and L. Daza, "Biogas reforming on La-
promoted NiMgAl catalysts derived from hydrotalcite-like precursors," Journal of
Power Sources, vol. 196, pp. 4404-4410, May 1 2011.
[161] S. M. Stagg-Williams, F. B. Noronha, G. Fendley, and D. E. Resasco, "CO2
reforming of CH4 over Pt/ZrO2 catalysts promoted with La and Ce oxides," Journal
of Catalysis, vol. 194, pp. 240-249, Sep 10 2000.
[162] A. J. Vizcaino, M. Lindo, A. Carrero, and J. A. Calles, "Hydrogen production by
steam reforming of ethanol using Ni catalysts based on ternary mixed oxides prepared

94
by coprecipitation," International Journal of Hydrogen Energy, vol. 37, pp. 1985-
1992, Jan 2012.
[163] M. H. Youn, J. G. Seo, P. Kim, J. J. Kim, H.-I. Lee, and I. K. Song, "Hydrogen
production by auto-thermal reforming of ethanol over Ni/[gamma]-Al2O3 catalysts:
Effect of second metal addition," Journal of Power Sources, vol. 162, pp. 1270-1274,
2006.
[164] A. Carrero, J. A. Calles, and A. J. Vizcaino, "Effect of Mg and Ca addition on coke
deposition over Cu-Ni/SiO2 catalysts for ethanol steam reforming," Chemical
Engineering Journal, vol. 163, pp. 395-402, Oct 1 2010.
[165] C. Wang, B. L. Dou, H. S. Chen, Y. C. Song, Y. J. Xu, X. Du, T. T. Luo, and C. Q.
Tan, "Hydrogen production from steam reforming of glycerol by Ni-Mg-Al based
catalysts in a fixed-bed reactor," Chemical Engineering Journal, vol. 220, pp. 133-
142, Mar 15 2013.
[166] B. Dou, G. L. Rickett, V. Dupont, P. T. Williams, H. Chen, Y. Ding, and M. Ghadiri,
"Steam reforming of crude glycerol with in situ CO2 sorption," Bioresource
Technology, vol. 101, pp. 2436-2442, 2010.
[167] Y. Ding and E. Alpay, "Adsorption-enhanced steam-methane reforming," Chemical
Engineering Science, vol. 55, pp. 3929-3940, 2000.
[168] M. H. Youn, J. G. Seo, J. C. Jung, S. Park, D. R. Park, S.-B. Lee, and I. K. Song,
"Hydrogen production by auto-thermal reforming of ethanol over Ni catalyst
supported on ZrO2 prepared by a sol-gel method: Effect of H2O/P123 mass ratio in
the preparation of ZrO2," Catalysis Today, vol. 146, pp. 57-62, 2009.
[169] J. Sehested, "Four challenges for nickel steam-reforming catalysts," Catalysis Today,
vol. 111, pp. 103-110, Jan 15 2006.
[170] J. Sehested, "Sintering of nickel steam-reforming catalysts," Journal of Catalysis, vol.
217, pp. 417-426, Jul 25 2003.
[171] G. Xia, J. D. Holladay, R. A. Dagle, E. O. Jones, and Y. Wang, "Development of
Highly Active Pd-ZnO/Al2O3 Catalysts for Microscale Fuel Processor Applications,"
Chemical Engineering & Technology, vol. 28, pp. 515-519, 2005.
[172] J. R. Rostrup-Nielsen, J. Sehested, and J. K. Norskov, "Hydrogen and synthesis gas
by steam- and CO2 reforming," Advances in Catalysis, Vol 47, vol. 47, pp. 65-139,
2002.
[173] D. L. Trimm, "Coke formation and minimisation during steam reforming reactions,"
Catalysis Today, vol. 37, pp. 233-238, 1997.

95
[174] X. Hu and G. Lu, "Investigation of the steam reforming of a series of model
compounds derived from bio-oil for hydrogen production," Applied Catalysis B:
Environmental, vol. 88, pp. 376-385, 2009.
[175] D. Chen, K. O. Christensen, E. Ochoa-Fernandez, Z. X. Yu, B. Totdal, N. Latorre, A.
Monzon, and A. Holmen, "Synthesis of carbon nanofibers: effects of Ni crystal size
during methane decomposition," Journal of Catalysis, vol. 229, pp. 82-96, Jan 1 2005.
[176] I. Martin-Gullon, J. Vera, J. A. Conesa, J. L. González, and C. Merino, "Differences
between carbon nanofibers produced using Fe and Ni catalysts in a floating catalyst
reactor," Carbon, vol. 44, pp. 1572-1580, 2006.
[177] S. Helveg, J. Sehested, and J. R. Rostrup-Nielsen, "Whisker carbon in perspective,"
Catalysis Today, vol. 178, pp. 42-46, Dec 15 2011.

96
CHAPTER 3: THERMODYNAMIC ANALYSIS
3.1 Theoretical Approach
In this chapter, a thermodynamic equilibrium analysis is carried out in detail and is compared
with several other published works [1-5].
Gibbs free energy minimisation method, a non-stoichiometric method, is adopted in this
equilibrium study. The system is thermodynamically favourable at a given temperature and
pressure if the total Gibbs free energy is at its minimum [6]. The following equations, (3.1) to
(3.6), relate to the derivation of Gibbs as described by several researchers [4, 7-12]. With the
assumption of isothermal and isobaric conditions, the equilibrium system can be expressed as
follows:
∑ ∑
(3.1)
Where nij = number of moles of species i in j phase in the system
μi = chemical potential of species i (J/mol)
G = Gibbs free energy (J/mol)
C = number of species in the system
= number of potential phases in the system
A closed system consists of co-existing vapour and liquid phases in which each phase
contains C species in a state of equilibrium. It is assumed that each species obeys the Raoult’s
Law, , of which is the vapour pressure of species i above the liquid solution, Xi
is the mole fraction of species i in liquid phase, and is the vapour pressure of the pure
substance i at the same temperature. To ease the operation, the reference state of the pressure,
can always be assumed as atm. Thus, the chemical potential of species i, is
given by the following equation:
[ (
)] (3.2)
Substituting Raoult’s law in the equation results in the following:
[ (
)
] (3.3)
However, as for non-ideal gas, fugacity, is introduced to enable the non-ideal gas
approximation fits into the ideal gas equation. Substituting fugacity with the fugacity
97
coefficient in the equation with respect to the following equation, , allows the
chemical potential of species i, μi, to be defined as follows [8, 13]:
[ (
)
] (3.4)
Where R = universal gas constant (kJ/kmolK)
T = temperature, K
P = pressure, bar
P0 = standard pressure, bar
= partial fugacity coefficient
Xi = mole fraction of species i in liquid phase
Gi0
= standard Gibbs free energy, J/mol
At equilibrium, given a constant temperature and pressure, Gibbs free energy (G) will be at
minimum where the number of moles of species i (ni) must satisfy the constraints of mass
conservation and non-negativity.
The non-negativity of moles number is expressed as follows:
(3.5)
Mass conservation states that the mass balance of each atom must be in accordance with the
reactions stoichiometry; hence, the following expressions must be strictly followed:
∑ (3.6)
∑ ∑
(3.7)
Where βzi = number of atoms of element z in species i
ni0 = initial number of moles for species i
An inert gas is considered as a component that does not change the number of moles prior to,
or after the reaction.

98
The partial fugacity coefficient, for non-ideal gases, together with the mixtures containing
waters and alcohols, can be estimated through a series of calculation, which begins from the
equation of states developed by Peng-Robinson incorporated with Twu modification (PR-
Twu) [14]. The PR equation of state alone is not sufficient to predict the mixtures containing
waters and alcohols; hence, the Twu estimation is incorporated. In addition, Twu et al., found
the α function and the mixing rules of the attractive term are the key factors in improving the
thermodynamic property calculations [15].
The PR equation is defined as:
(3.8)
Where v = molar volume
with
= temperature dependent function
= parameter of at critical temperature, Tc
Pc = critical pressure
Twu et al. [15] derived an α function from a probability distribution function:
(3.9)
Tr is reduced temperature and the variables L, M, and N are adjustable parameters obtained
from vapour pressure data.
The Van der Waals mixing rule is used as follows to estimate the temperature-independent
repulsion and temperature-dependent attraction parameters for mixtures, am and bm :
∑ ∑ (3.10)

99
And (3.11)
∑ (3.12)
Where xi = molar fraction of species i
xl = molar fraction of species l
bi = b coefficient of species i
kil = interaction coefficient between species i and l
The interaction coefficient between species i and l, kil, can be estimated using the following
equation:
( )
(
)
(3.13)
Vc represents the critical volume of the related species and the unit is m3/kmol.
The dimensionless form of a and b for a mixture, A and B are introduced as follows:
(3.14)
(3.15)
Compressibility factor is also introduced in the PR-Twu equation with the following
equation:
(3.16)
PR is rewritten as a cubic equation using these dimensionless numbers and the
compressibility factor, Z:
(3.17)

100
Therefore, the partial molar fugacity coefficient was calculated using the following
equation:
√ (
∑
) (
( √ )
( √ ) ) (3.18)
3.2 Simulation Layout
By using the Aspen-HYSYS simulation package, the Gibbs reactor was chosen to perform
the aforementioned algorithm representing multiple and complex reactions in the system in
order to determine the most favourable route of reactions for all types of reactant. All
reactants, intermediates and products expected, were available via the HYSYS library
database and no other hypothetical component was created. A series of homologues from
ethanol to glycerol was studied (excluding 1,3 propane diol), which includes the following in
Figure 3.1:
Figure 3.1: The homologues of the chosen oxygenated hydrocarbons
The components chosen for this study were mainly based on the literature review of previous
experimental works that involved not only steam reforming of oxygenates, but other studies
including the thermal decomposition of the oxygenates [16-22] except for propylene glycol,
for which, to date, none of the articles that specifically discussed steam reforming of
propylene glycol were able to be located. Table 3.1 depicts the list of components that has
been predicted to appear as products for all the oxygenated hydrocarbons simulated.

101
Reactant/ Components
Water Acrolein CO2
Ethanol Propanal CO
Glycerol Acetaldehyde Ethylene
Ethylene Glycol Acetone Ethane
Propylene Glycol Carbon Propane
Methanol Nitrogen Propylene
2-Propanol Acetol Hydrogen
1-Propanol Allyl Alcohol Methane
Diethylene Glycol Acetic Acid
Table 3.1: Components predicted as reactor effluents for the homologues
Other than the PR-Twu property package, there were two other property packages available
to be compared with, i.e. Wilson (1964) and SRK-Twu. Although most of the equilibrium
studies carried out in ASPEN-Hysys used Peng-Robinson (PR) [23], or Soave modified
Redlich-Kwong (SRK) equation of states, this is not feasible in this case since PR and SRK
are incompatible with the presence of oxygenated compounds. The oxygenated hydrocarbon
flow rates and vaporiser temperatures for the main components entering the Gibbs reactor on
steam reforming reaction are depicted in Table 3.2.
Components Ethanol Glycerol Ethylene
Glycol
Propylene
Glycol
Temperature for Water’s Vaporiser (oC) 200 400 300 300
Temperature for Reactant’s Vaporiser (oC) 200 400 300 300
Entering N2 temperature (oC) 200 400 300 300
Reactant’s mass flow rate (kg/hr) 0.046 0.092 0.062 0.076
Reactant’s molar flow rate (mole/hr) 1 1 1 1
Table 3.2: Vaporiser temperature and reactants’ flow rates setting for simulated oxygenated
hydrocarbons
The simulation environment for all variables is depicted in Figure 3.2:
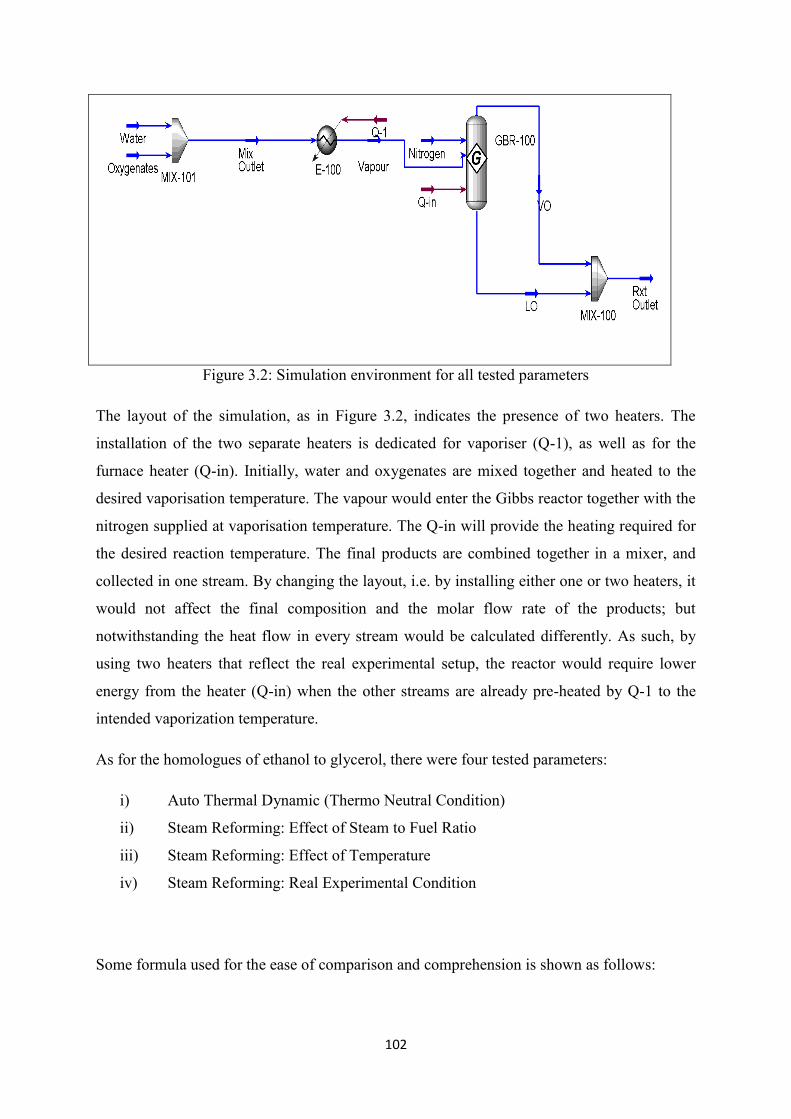
102
Figure 3.2: Simulation environment for all tested parameters
The layout of the simulation, as in Figure 3.2, indicates the presence of two heaters. The
installation of the two separate heaters is dedicated for vaporiser (Q-1), as well as for the
furnace heater (Q-in). Initially, water and oxygenates are mixed together and heated to the
desired vaporisation temperature. The vapour would enter the Gibbs reactor together with the
nitrogen supplied at vaporisation temperature. The Q-in will provide the heating required for
the desired reaction temperature. The final products are combined together in a mixer, and
collected in one stream. By changing the layout, i.e. by installing either one or two heaters, it
would not affect the final composition and the molar flow rate of the products; but
notwithstanding the heat flow in every stream would be calculated differently. As such, by
using two heaters that reflect the real experimental setup, the reactor would require lower
energy from the heater (Q-in) when the other streams are already pre-heated by Q-1 to the
intended vaporization temperature.
As for the homologues of ethanol to glycerol, there were four tested parameters:
i) Auto Thermal Dynamic (Thermo Neutral Condition)
ii) Steam Reforming: Effect of Steam to Fuel Ratio
iii) Steam Reforming: Effect of Temperature
iv) Steam Reforming: Real Experimental Condition
Some formula used for the ease of comparison and comprehension is shown as follows:
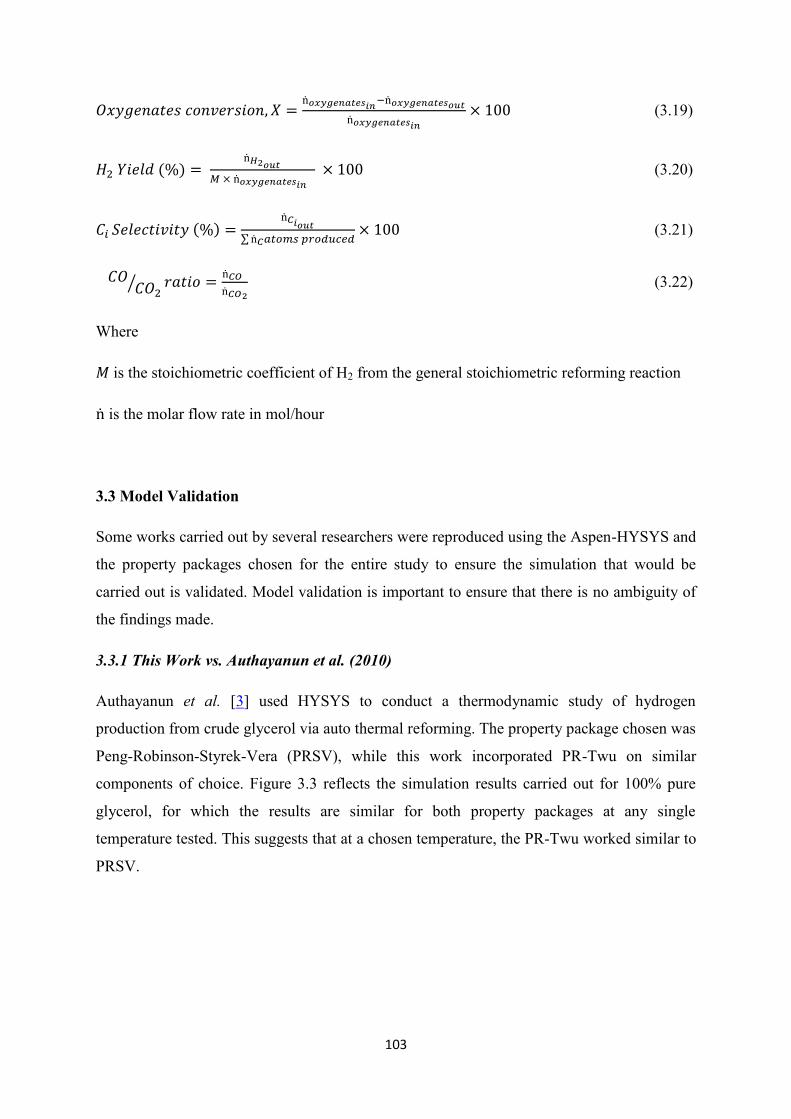
103
(3.19)
(3.20)
∑ (3.21)
⁄
(3.22)
Where
is the stoichiometric coefficient of H2 from the general stoichiometric reforming reaction
is the molar flow rate in mol/hour
3.3 Model Validation
Some works carried out by several researchers were reproduced using the Aspen-HYSYS and
the property packages chosen for the entire study to ensure the simulation that would be
carried out is validated. Model validation is important to ensure that there is no ambiguity of
the findings made.
3.3.1 This Work vs. Authayanun et al. (2010)
Authayanun et al. [3] used HYSYS to conduct a thermodynamic study of hydrogen
production from crude glycerol via auto thermal reforming. The property package chosen was
Peng-Robinson-Styrek-Vera (PRSV), while this work incorporated PR-Twu on similar
components of choice. Figure 3.3 reflects the simulation results carried out for 100% pure
glycerol, for which the results are similar for both property packages at any single
temperature tested. This suggests that at a chosen temperature, the PR-Twu worked similar to
PRSV.

104
Figure 3.3: Model Validation of Autothermal Reforming of 100% pure glycerol
(this work vs. Authayanun et al.)
3.3.2 This work vs. Rossi et al., (2009)
Rossi et al. [4] determined that the thermodynamic analysis of steam reforming of ethanol
and glycerine using GAMS® 2.5 with CONOPT2 solver can be done similar to the Aspen-
HYSYS using the PR-Twu equation of state property package. Their work on thermodynamic
analysis of ethanol steam reforming at equimolar water/ethanol feed at 1 atm, as shown in
Figure 3.5, yielded almost similar results in comparison to Figure 3.4 (this work) up to 700 K.
However, above 750 K, there were significant differences related to the mol fraction of CO,
CO2, and CH4. The thermodynamic analysis of ethanol steam reforming is discussed in detail
in section 3.6.
0.0
0.5
1.0
1.5
2.0
2.5
3.0
3.5
4.0
4.5
600 700 800 900 1000 1100 1200
Pro
du
cts
mo
lar
flo
w (
kgm
ole
/ho
ur)
Temperature (K) H2 (this work) CO (this work)
CO2 (this work) CH4 (this work)
H2 (Authayanun et.al., 2010) CO (Authayanun et.al., 2010)
CO2 (Authayanun et.al., 2010) CH4 (Authayanun et.al., 2010)
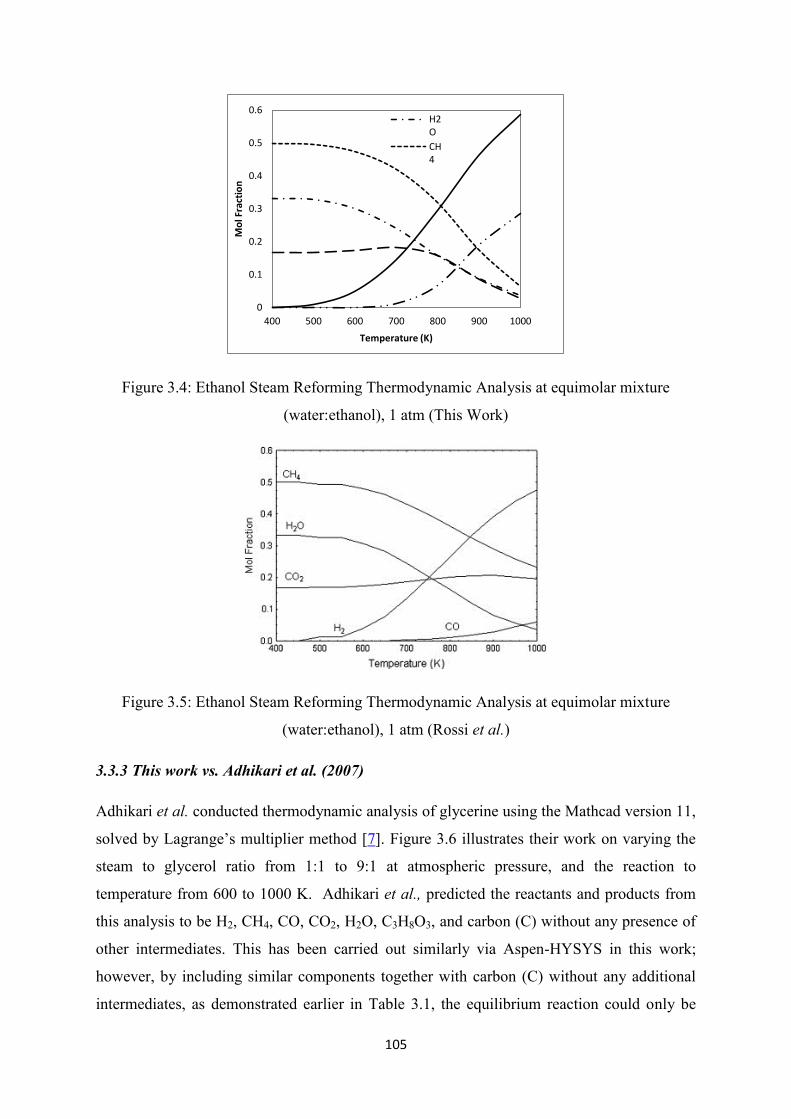
105
Figure 3.4: Ethanol Steam Reforming Thermodynamic Analysis at equimolar mixture
(water:ethanol), 1 atm (This Work)
Figure 3.5: Ethanol Steam Reforming Thermodynamic Analysis at equimolar mixture
(water:ethanol), 1 atm (Rossi et al.)
3.3.3 This work vs. Adhikari et al. (2007)
Adhikari et al. conducted thermodynamic analysis of glycerine using the Mathcad version 11,
solved by Lagrange’s multiplier method [7]. Figure 3.6 illustrates their work on varying the
steam to glycerol ratio from 1:1 to 9:1 at atmospheric pressure, and the reaction to
temperature from 600 to 1000 K. Adhikari et al., predicted the reactants and products from
this analysis to be H2, CH4, CO, CO2, H2O, C3H8O3, and carbon (C) without any presence of
other intermediates. This has been carried out similarly via Aspen-HYSYS in this work;
however, by including similar components together with carbon (C) without any additional
intermediates, as demonstrated earlier in Table 3.1, the equilibrium reaction could only be
0
0.1
0.2
0.3
0.4
0.5
0.6
400 500 600 700 800 900 1000
Mo
l Fra
ctio
n
Temperature (K)
H2O
CH4

106
calculated via Gibbs reactor at 950K and above. However, no reaction occurred below this
temperature. Nonetheless, by removing carbon from the list of components, similar results
could be obtained, as shown in Figure 3.7. The same results could also be obtained if carbon
is included, only if other components, as shown in Table 3.1, are also present.
Figure 3.6: Number of moles of H2 and mole fraction of H2 based on steam reforming of
glycerol thermodynamic analysis at 1 atm (Adhikari et al.)
(a) (b)
Figure 3.7: Number of moles of H2 and mole fraction of H2 based on steam reforming of
glycerol thermodynamic analysis at 1 atm (this work)
0
1
2
3
4
5
6
7
600 700 800 900 1000
Mo
les
of
H2
Temperature / K
01:0103:0106:0109:01
0
0.1
0.2
0.3
0.4
0.5
0.6
600 700 800 900 1000
Mo
le F
ract
ion
of
H2
Temperature/ K
01:0103:0106:0109:01
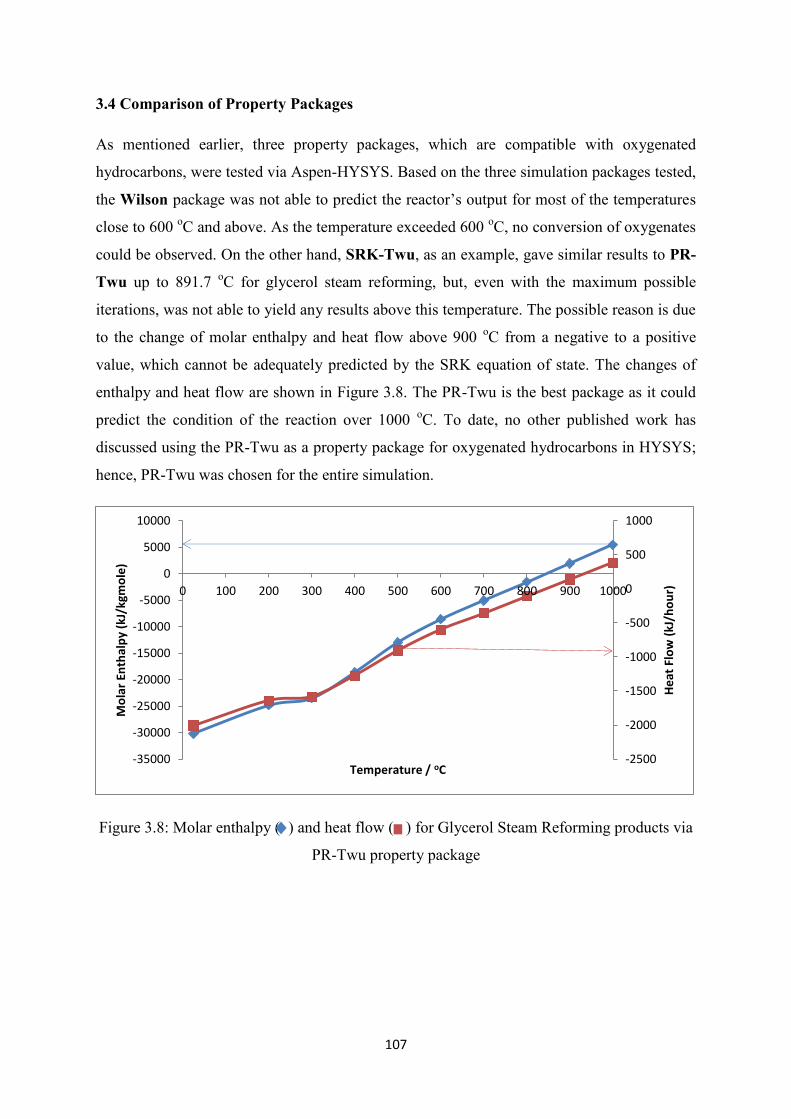
107
3.4 Comparison of Property Packages
As mentioned earlier, three property packages, which are compatible with oxygenated
hydrocarbons, were tested via Aspen-HYSYS. Based on the three simulation packages tested,
the Wilson package was not able to predict the reactor’s output for most of the temperatures
close to 600 oC and above. As the temperature exceeded 600
oC, no conversion of oxygenates
could be observed. On the other hand, SRK-Twu, as an example, gave similar results to PR-
Twu up to 891.7 oC for glycerol steam reforming, but, even with the maximum possible
iterations, was not able to yield any results above this temperature. The possible reason is due
to the change of molar enthalpy and heat flow above 900 oC from a negative to a positive
value, which cannot be adequately predicted by the SRK equation of state. The changes of
enthalpy and heat flow are shown in Figure 3.8. The PR-Twu is the best package as it could
predict the condition of the reaction over 1000 oC. To date, no other published work has
discussed using the PR-Twu as a property package for oxygenated hydrocarbons in HYSYS;
hence, PR-Twu was chosen for the entire simulation.
Figure 3.8: Molar enthalpy ( ) and heat flow ( ) for Glycerol Steam Reforming products via
PR-Twu property package
-2500
-2000
-1500
-1000
-500
0
500
1000
-35000
-30000
-25000
-20000
-15000
-10000
-5000
0
5000
10000
0 100 200 300 400 500 600 700 800 900 1000
He
at F
low
(kJ
/ho
ur)
Mo
lar
Enth
alp
y (k
J/kg
mo
le)
Temperature / oC

108
3.5 Autothermal Reforming at Thermoneutral Condition Study
Thermoneutral refers to the condition where the oxygen supplied at a certain temperature is
sufficient to heat the reactor and there is no requirement to provide external heating to the
reactor [3]. The reactor will therefore behave adiabatically.
3.5.1 Self-sustainability Study and the Effect of the Reactor Inlet Temperature
This study is conducted to investigate the self-sustainability of oxygenates to provide internal
heating energy via the oxygen atoms attached to them. The homologues, water, and nitrogen
streamline as an inert stream line in Aspen-HYSYS were preheated from 200 to 700 oC prior
to entering the reactor whereas, no heating was provided in the reactor itself. The steam to
fuel ratio was fixed at 6 to 1 for all oxygenates. Two conditions were tested, i.e. when there
was no additional air provided, hence the oxygen to carbon (O/C) ratio was 0, and when some
amount of external air was provided to fulfil the condition of O/C = 0.75 for all fuels. The
temperature profile obtained from the simulation is depicted in Figure 3.9.
(a)
(b)
Figure 3.9 (a) and (b): Reactor's Temperature Profile for Different Feedstock Entering
Temperature ((a) O/C=0 and (b) O/C = 0.75)
From the temperature profile in Figure 3.9 (a), it is interesting to observe that for the set of
homologues, they were only able to sustain the reaction’s temperature in the reactor up to 400
oC, whereas at this temperature only two oxygenates (glycerol and ethylene glycol) were able
to meet the pre-heated temperature and another two oxygenates (ethanol and propylene
200
300
400
500
600
700
800
900
200 300 400 500 600 700
Re
acto
r's
Tem
pe
ratu
re /
oC
Reactor Inlet Temperature, Tent oC
EtOH
EG
PG
Gly
Exo-Endo Line
Endothermic region
Exothermic region
200
300
400
500
600
700
800
900
200 300 400 500 600 700
Re
acto
r's
Tem
pe
ratu
re/
oC
Reactor Inlet Temperature, Tent oC
EtOH (O/C =0.75)EG (O/C =0.75)PG (O/C =0.75)Gly (O/C =0.75)Exo-Endo Line

109
glycol), fell below 400 oC. However, as the temperature increased, all oxygenates fell below
the pre-heated temperature in the endothermic region and were unable to sustain the intended
reaction’s operating temperature.
It was deduced that the inability of ethanol and propylene glycol to meet the required
temperature at 400 oC may be related to the deficiency of oxygen atoms to provide sufficient
internal energy to the reaction system. Ethanol has the oxygen to carbon (O/C) ratio of 0.5,
whereas for propylene glycol, the O/C is 0.67. The O/C for both ethylene glycol and glycerol
otherwise are 1. This explains the possibility of ethanol and propylene glycol to have a higher
temperature drop compared to other oxygenates. By adding some amount of air to the system,
at an approximate ratio of O/C=0.75 for all oxygenates, the pattern shown in Figure 3.9 (b) is
observed, which significantly improved the reactor’s operating temperature by always
maintaining the reaction temperature above the exothermic-endothermic line.
In order to support the abovementioned claim, the reaction was considered for each
homologue dissociating into CO2 and H2. The bond enthalpies, as shown in Appendix 1.1
[24], were used to calculate the amount of energy required from each homologue to produce
CO2 and H2. The enthalpy calculations are shown in Appendix 1.2 for each homologue and
the results are tabulated in Table 3.3.
Homologue Total bonds enthalpy
on reactant side, Hr
Total bonds enthalpy
on product side, Hp Hr - Hp = ΔHf298K
Ethanol
6045 5836 +209
Ethylene Glycol
5518 5400 +118
Propylene Glycol
8574 8318 +256
Glycerol
8047 7882 +165
Table 3.3: Summary of bond enthalpies calculations for each homologue
110
From Table 3.3, it can be demonstrated that ethylene glycol and glycerol require the least
external energy to be reformed into CO2 and H2 in contrast to both ethanol and propylene
glycol. This suggests that this finding corroborates with the earlier assumption of which
ethylene glycol and glycerol, both with O/C ratio of 1, have a higher internal energy to
sustain their thermoneutral condition at a certain temperature in comparison to ethanol and
propylene glycol.
(a)
(b)
Figure 3.10: Hydrogen molar flow (mol/hour) for different reactor inlet temperature:
(a) O/C = 0, (b) O/C = 0.75
The hydrogen molar flow rates for all oxygenates that underwent autothermal steam
reforming are shown in Figure 3.10. As the temperature increased, a higher molar flow rate of
hydrogen was observed due to the increased reverse methanation [3]. It was observed that for
this homologue series of CxHyOz, for a higher y value, i.e. the hydrogen atom in the
oxygenate molecules, a higher molar flow rate of hydrogen gas was expected. This also
depended on the y:z ratio, in which the higher the ratio, the greater the amount of hydrogen
produced. The summary of the respective ratios is shown in Table 3.4.
Interestingly, the addition of air lowered the amount of hydrogen produced compared to no
additional air provided, even though it maintained the reaction at a higher temperature than
the inlet temperature. This can be explained based on Figures 3.11 to 3.13 concerning the
production of methane, CO and CO2, which suggested that other side reactions existed in the
presence of additional oxygen.
0
1
2
3
4
5
6
7
8
9
10
200 300 400 500 600 700
Mo
lar
flo
w (
mo
l/h
ou
r)
Reactor Inlet Temperature, Tent oC
EtOHEGPGGly
0
1
2
3
4
5
6
7
8
9
10
200 300 400 500 600 700
Mo
lar
flo
w (
mo
l/h
r)
Reactor Inlet Temperature, Tent oC
EtOHEGPGGly
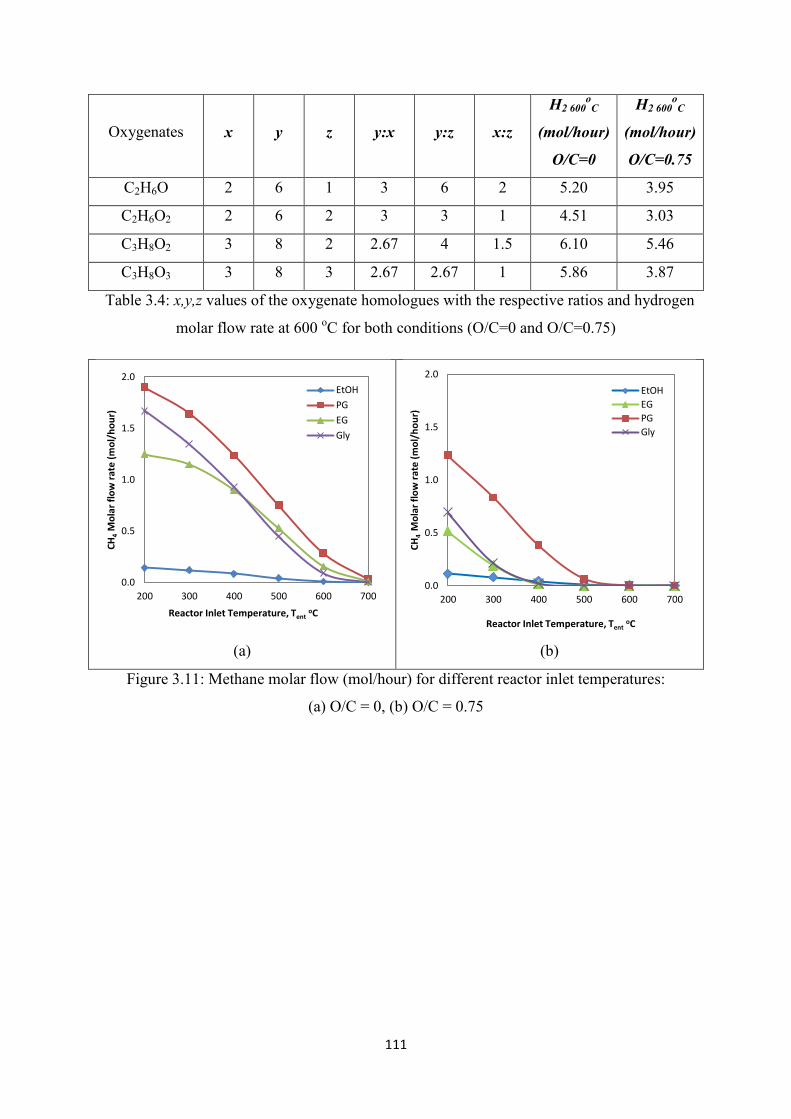
111
Oxygenates x y z y:x y:z x:z
H2 600o
C
(mol/hour)
O/C=0
H2 600o
C
(mol/hour)
O/C=0.75
C2H6O 2 6 1 3 6 2 5.20 3.95
C2H6O2 2 6 2 3 3 1 4.51 3.03
C3H8O2 3 8 2 2.67 4 1.5 6.10 5.46
C3H8O3 3 8 3 2.67 2.67 1 5.86 3.87
Table 3.4: x,y,z values of the oxygenate homologues with the respective ratios and hydrogen
molar flow rate at 600 oC for both conditions (O/C=0 and O/C=0.75)
(a)
(b)
Figure 3.11: Methane molar flow (mol/hour) for different reactor inlet temperatures:
(a) O/C = 0, (b) O/C = 0.75
0.0
0.5
1.0
1.5
2.0
200 300 400 500 600 700
CH
4 M
ola
r fl
ow
rat
e (
mo
l/h
ou
r)
Reactor Inlet Temperature, Tent oC
EtOH
PG
EG
Gly
0.0
0.5
1.0
1.5
2.0
200 300 400 500 600 700
CH
4 M
ola
r fl
ow
rat
e (
mo
l/h
ou
r)
Reactor Inlet Temperature, Tent oC
EtOH
EG
PG
Gly

112
(a)
(b)
Figure 3.12: CO molar flow (mol/hour) for different reactor inlet temperatures:
(a) O/C = 0, (b) O/C = 0.75
(a)
(b)
Figure 3.13: CO2 molar flow (mol/hour) for different reactor inlet temperatures:
(a) O/C = 0, (b) O/C = 0.75
The flow rate of methane produced with the presence of additional air was lower compared to
when no air was provided, resulting from the oxidation of methane to CO and CO2. This
explains the increase of CO2 and CO when there is additional air provided, especially at a
higher reaction temperature.
(3.23)
0.0
0.5
1.0
1.5
2.0
200 300 400 500 600 700
CO
Mo
lar
flo
w r
ate
(m
ol/
ho
ur)
Reactor Inlet Temperature, Tent oC
EtOHEGPGGly
0.0
0.5
1.0
1.5
2.0
200 300 400 500 600 700
CO
Mo
lar
flo
w r
ate
(m
ol/
ho
ur
Reactor Inlet Temperature, Tent oC
EtOhEGPGGly
0.0
0.5
1.0
1.5
2.0
2.5
3.0
200 300 400 500 600 700
CO
2 M
ola
r fl
ow
rat
e (
mo
l/h
ou
r)
Reactor Inlet Temperature, Tent oC
EtOh EG PG Gly
0.0
0.5
1.0
1.5
2.0
2.5
3.0
200 300 400 500 600 700
CO
2 M
ola
r fl
ow
rat
e (
mo
l/h
ou
r)
Reactor Inlet Temperature, Tent oC
EtOh PG EG Gly

113
(3.24)
It can be concluded that there was a competitive reaction taking place altogether with the
steam reforming when additional air was supplied, hence leading to the reduction of
hydrogen and methane flow rate. The observation on the steam net balance also showed a
significant difference of how much steam or water was consumed or produced, as shown in
Figure 3.14. A negative value indicates that more steam/water is produced rather than
consumed. This suggested that instead of steam reforming taking place, oxidation occurred
and produced more water and CO2 when more air was supplied (O/C=0.75).
(a)
(b)
Figure 3.14: Steam/ Water Consumed (%) in Autothermal Steam Reforming Reactor:
(a) O/C=0, (b) O/C= 0.75
The effectiveness of water gas shift reaction (WGS) was measured by calculating CO/CO2
ratio, as shown in Figure 3.15. As the temperature increased, CO increased, and CO2
decreased due to the reverse water gas shift reaction (RWGS). Whilst the addition of air
might reduce the CO/CO2 ratio of ethylene glycol and glycerol at temperatures of more than
600 oC, it can be observed that within a window temperature from 400 to 600
oC, higher CO
was observed with additional air presence due to the exothermicity of the reaction
environment. This leads to the partial oxidation of the fuel; taking the example of ethanol and
glycerol, as in the following:
(3.25)
(3.26)
-20
-10
0
10
20
30
40
50
200 300 400 500 600 700Ste
am/W
ate
r C
on
sum
ed
(%
)
Reactor Inlet Temperature, Tent/ oC
EtOH O/C = 0EG O/C = 0PG O/C=0Gly O/C=0
-20
-10
0
10
20
30
40
50
200 300 400 500 600 700Ste
am/W
ate
r C
on
sum
ed
(%
)
Reactor Inlet Temperature, Tent/ oC
EtOH O/C = 0.75EG O/C = 0.75PG O/C=0.75Gly O/C=0.75

114
(a)
(b)
Figure 3.15: CO/CO2 ratio for different reactor inlet temperature:
(a) O/C=0, (b) O/C= 0.75
3.5.2 Effect of O/C Ratio
A further simulation test was carried out to determine the effect of adding air into the system
by manipulating the oxygen to carbon (O/C) content. The entering feedstock temperature was
fixed at 400 oC for all oxygenated hydrocarbons to ensure that the highest boiling point
component, such as glycerol, would completely vaporise prior to entering the reactor. The
steam to fuel ratio was fixed at 6 to 1. The volumetric flow rate of nitrogen (inclusive of N2
from air stream) was fixed at 80% v/v. The oxygen to carbon ratio was varied from O/C=0 up
to O/C=2. The temperature profile of the reactor, CO/CO2 ratio and hydrogen selectivity is
shown in Figures 3.16 and 3.17, respectively.
From Figure 3.16, ethylene glycol and glycerol, being the oxygenated hydrocarbons with a
high O/C ratio in each molecule, shot to a higher temperature when air was fed into the
system, compared to ethanol and propylene glycol. Ethylene glycol also had a lower CO/CO2
ratio among the other oxygenates. It could also be implied that ethylene glycol and glycerol
only needed a small injection of air into the system, i.e. with O/C=0.5 to improve the
hydrogen yield, as shown in Figure 3.17 (a), compared to ethanol (O/C=0.75) and propylene
glycol (O/C=1.1). As O/C increased for all oxygenates beyond the optimum point, the
hydrogen, CO and methane flow rate fell resulting from the excess amount of oxygen that led
to complete oxidation, and suppressed steam reforming. The exothermicity of the reaction led
to complete oxidation that yielded more CO2. All the oxygen supplied for the O/C ratios
0
0.1
0.2
0.3
0.4
0.5
0.6
0.7
0.8
200 300 400 500 600 700
CO
/CO
2 R
atio
Reactor Inlet Temperature, Tent/ oC
EtOHEGPGGly
0
0.1
0.2
0.3
0.4
0.5
0.6
0.7
0.8
200 300 400 500 600 700
CO
/CO
2 R
atio
Reactor Inlet Temperature, Tent/ oC
EtOHEGPGGly

115
tested were completely consumed, whilst the percentage of water consumed reduced, as
shown in Figure 3.18, suggesting that, initially, all the fuels underwent oxidation reaction,
and only then followed by steam reforming reaction. While a more interesting discussion
could be generated here, the main focus in this chapter is in the next section; section 3.7.
Figure 3.16: Reactor’s adiabatic temperature and CO/CO2 ratio with respect to oxygen/carbon
(O/C) ratio
0
0.1
0.2
0.3
0.4
0.5
0
100
200
300
400
500
600
700
800
0 0.2 0.4 0.6 0.8 1 1.2 1.4 1.6 1.8 2
Re
acto
r's
Tem
pe
ratu
re, o
C
O/C Ratio
CO
/CO
2 Ratio
EtOH EG PG Gly CO/CO2 EtOH CO/CO2 EG CO/CO2 PG CO/CO2 Gly

116
Figure 3.17: Products molar flow rate with respect to oxygen/carbon (O/C) ratio
(a) Hydrogen, (b) Methane, (c) CO, (d) CO2
0
1
2
3
4
5
6
0 0.5 1 1.5 2
H2
Mo
lar
Flo
w, m
ol/
ho
ur
O/C Ratio
EtOHEGPGGly
0
0.2
0.4
0.6
0.8
1
1.2
1.4
0 0.5 1 1.5 2
CH
4 M
ola
r Fl
ow
, mo
l/h
ou
r
O/C Ratio
EtOHEGPGGly
0
0.1
0.2
0.3
0.4
0.5
0.6
0 0.5 1 1.5 2
CO
mo
lar
Flo
w, m
ol/
ho
ur
O/C Ratio
EtOH EG PG Gly
0
0.5
1
1.5
2
2.5
3
0 0.5 1 1.5 2
CO
2 m
ola
r Fl
ow
, mo
l/h
ou
r
O/C Ratio
EtOH EG
PG Gly
-60
-40
-20
0
20
40
60
0 0.5 1 1.5 2
Ste
am/W
ate
r C
on
sum
ed
(%
)
O/C Ratio
EtOH
EG
PG
Gly

117
Figure 3.18: Steam/ water consumed (%) with respect to O/C ratio
3.6 Steam Reforming Study
For a comparability study with experimental work, steam reforming simulation was carried
out using the Gibbs energy minimization method, by applying the available Gibbs reactor
from the simulation package. Steam reforming was conducted in the isothermal system where
there was no external air supplied but external heating was provided to the system.
3.6.1 Effect of Steam to Fuel Molar Ratio
The temperature in the reactor was fixed at 600 oC, while the steam to fuel ratio was varied
from 1 to 10. The vaporiser temperature for each oxygenate was set at 200 oC (ethanol), 300
oC (ethylene glycol and propylene glycol), and 400
oC (glycerol) to ensure the oxygenate was
completely vaporised to a gaseous state. It has been verified that the vaporiser temperature
does not affect the product output at a fixed reactor temperature. The molar flow rate of the
oxygenates was fixed at 1 mol/hour. While all the oxygenates undergo complete conversion
to gas, there was no other component present at the reactor effluent other than the hydrogen,
CO, CO2, and CH4. The selectivity for all gases, as well as CO/CO2 ratio as a measure of
water gas shift reaction (WGS), is depicted in Figures 3.19 to 3.22, respectively.
At a lower steam to fuel ratio for all oxygenates, the competitive parallel reaction in this
system was methane production. In ethanol steam reforming, methane was produced resulting
from the decomposition of ethanol. Casanovas et al. and Zhang et al. [25, 26] reported that
during the reforming process, ethanol was highly favoured to undergo ethanol
dehydrogenation, which ultimately formed acetaldehyde as the reaction intermediate. This
was possible since dehydrogenation of ethanol, even though it is endothermic in reaction, was
at a lower magnitude compared to the endothermic steam reforming process. Ethanol
dehydrogenated into acetaldehyde as an intermediate product and acetaldehyde (CH3CHO)
further decomposed into methane and carbon monoxide. The dehydrogenation of ethanol
produced acetaldehyde and hydrogen, which follows this stoichiometric reaction:
(3.27)
Acetaldehyde undergoes decomposition to methane and carbon monoxide, respectively:
(3.28)

118
Based on this, the choice of catalyst is highly crucial to route the reaction to the desired
products [27]. From the equilibrium study, a further check on the simulation results indicated
that acetaldehyde was produced as a trace compound, and there was a decreasing pattern of
methane and carbon monoxide as the steam to fuel ratio was increased.
As for other oxygenates, similar hydrogen selectivity increased with increasing steam-to-fuel
ratio. The CO/CO2 also decreased, suggesting that an active water gas shift reaction took
place at 600 oC. Ethylene glycol, as simulated, had shown its capability as an excellent
reactant for hydrogen production based on high H2 selectivity with the lowest CO/CO2 ratio
for the range specified. It is interesting to observe that for glycerol and ethylene glycol, the
CO/CO2 ratio for both reactants were lower than ethanol and propylene glycol even at a low
steam to fuel ratio. This was believed to be from the presence of sufficient oxygen atoms with
respect to the number of carbon atoms in each molecule. At a low steam to fuel ratio, all the
reactants have a tendency to decompose or dehydrate due to the insufficient amount of steam
provided, hence producing a larger amount of CO in comparison to CO2. It was only when
excess steam was provided that the water gas shifts reaction becomes active and converts CO
to CO2 at this particular temperature. The excess oxygen atom in each molecule is
proportionate to the production of CO2 at a low steam to fuel (S/F) ratio. The CO2 selectivity
for ethylene glycol and glycerol steam reforming at S/F=1 was 27.8 and 27.2, respectively.
However, as for propylene glycol and ethanol, at S/F=1, the CO2 selectivity was 9.5 and 8.1,
correspondingly.
Although operating at a higher steam to fuel ratio is desirable to yield higher H2, the reactor
loading would be huge and costly [28]. Therefore, with a good catalyst design, the steam to
fuel ratio may be reduced to achieve a considerable yield of hydrogen, reduced methane, and
low CO/CO2 ratio.
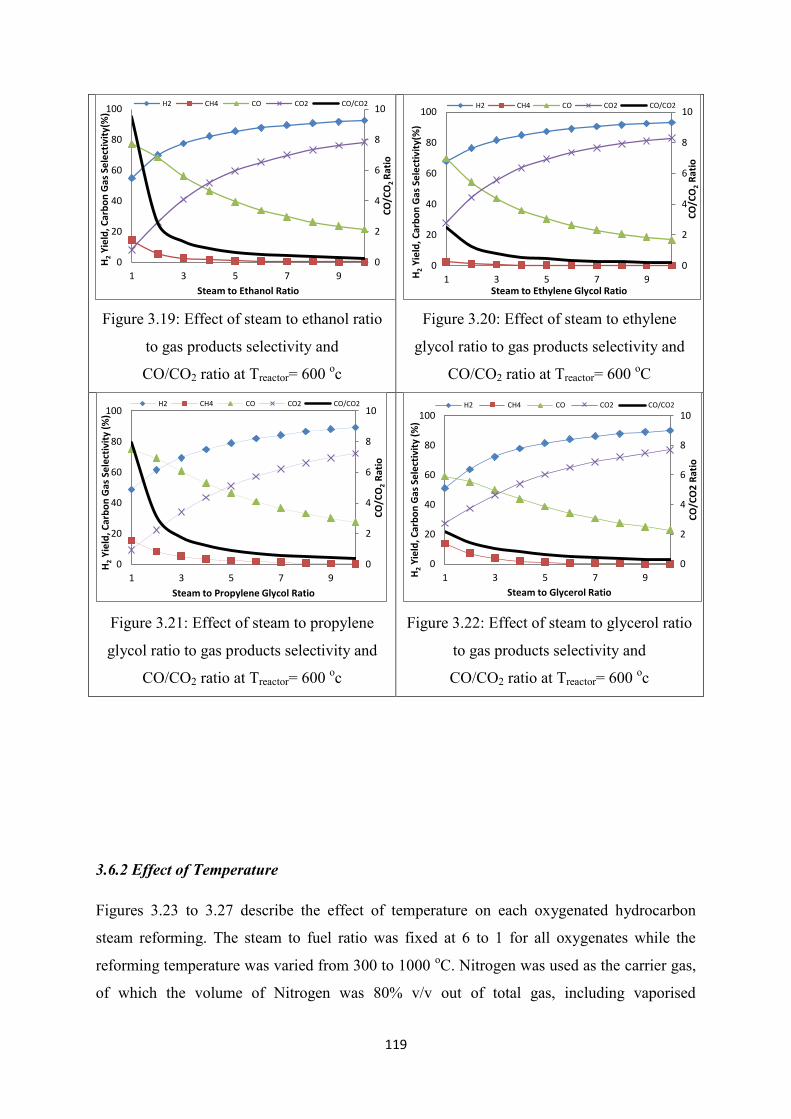
119
Figure 3.19: Effect of steam to ethanol ratio
to gas products selectivity and
CO/CO2 ratio at Treactor= 600 oc
Figure 3.20: Effect of steam to ethylene
glycol ratio to gas products selectivity and
CO/CO2 ratio at Treactor= 600 oC
Figure 3.21: Effect of steam to propylene
glycol ratio to gas products selectivity and
CO/CO2 ratio at Treactor= 600 oc
Figure 3.22: Effect of steam to glycerol ratio
to gas products selectivity and
CO/CO2 ratio at Treactor= 600 oc
3.6.2 Effect of Temperature
Figures 3.23 to 3.27 describe the effect of temperature on each oxygenated hydrocarbon
steam reforming. The steam to fuel ratio was fixed at 6 to 1 for all oxygenates while the
reforming temperature was varied from 300 to 1000 oC. Nitrogen was used as the carrier gas,
of which the volume of Nitrogen was 80% v/v out of total gas, including vaporised
0
2
4
6
8
10
0
20
40
60
80
100
1 3 5 7 9
CO
/CO
2 R
atio
H2 Y
ield
, Car
bo
n G
as S
ele
ctiv
ity(
%)
Steam to Ethanol Ratio
H2 CH4 CO CO2 CO/CO2
0
2
4
6
8
10
0
20
40
60
80
100
1 3 5 7 9
CO
/CO
2 R
atio
H2 Y
ield
, Car
bo
n G
as S
ele
ctiv
ity(
%)
Steam to Ethylene Glycol Ratio
H2 CH4 CO CO2 CO/CO2
0
2
4
6
8
10
0
20
40
60
80
100
1 3 5 7 9
CO
/CO
2 R
atio
H2
Yie
ld, C
arb
on
Gas
Se
lect
ivit
y (%
)
Steam to Propylene Glycol Ratio
H2 CH4 CO CO2 CO/CO2
0
2
4
6
8
10
0
20
40
60
80
100
1 3 5 7 9
CO
/CO
2 R
atio
H2 Y
ield
, Car
bo
n G
as S
ele
ctiv
ity
(%)
Steam to Glycerol Ratio
H2 CH4 CO CO2 CO/CO2

120
oxygenates and water prior to entering the reactor. Based on the observation, steam reforming
was highly active at 600 oC for all oxygenates where the hydrogen reached 80 to 90%
selectivity. This is supported based on the evidence obtained from Figure 3.23, of which the
steam was highly utilized at the optimum hydrogen production temperature. At 600 oC, the
amount of water/steam exited the reactor least, suggesting that steam reforming was highly
active at this temperature, as well as the water gas shift reaction.
Figure 3.23: The percentage of steam/water consumed in the oxygenates
steam reforming reactor
As for all oxygenated hydrocarbons steam reforming, hydrogen had the highest selectivity at
600 oC, whilst CO2 was the highest at 500
oC. This concurs with Sahoo et al. [29], for which
the water gas shift reaction was active at 500 oC and when the temperature increased beyond
600 oC, a reverse water gas shift reaction may occur resulting in an increased amount of
carbon monoxide, hence, the reduction of carbon dioxide. Methane decreased as the
temperature increased due to two possibilities, i.e. either methane was converted to H2 and
CO2 via steam reforming or steam reforming of oxygenates were more favourable over
decomposition at a higher temperature. Reverse methanation may also occur that decomposed
methane into carbon and hydrogen. Unfortunately, Aspen-HYSYS had limitations in
quantifying the carbon at equilibrium.
The decomposition of oxygenates was favoured at a temperature below 500 oC, as proven by
the high water flow rate exiting the reactor (less water being consumed, as shown in Figure
-5
5
15
25
35
45
300 400 500 600 700 800 900 1000
Ste
am/
Wat
er
con
sum
ed
(%)
Temperature/ oC
EtOH EG
PG Gly
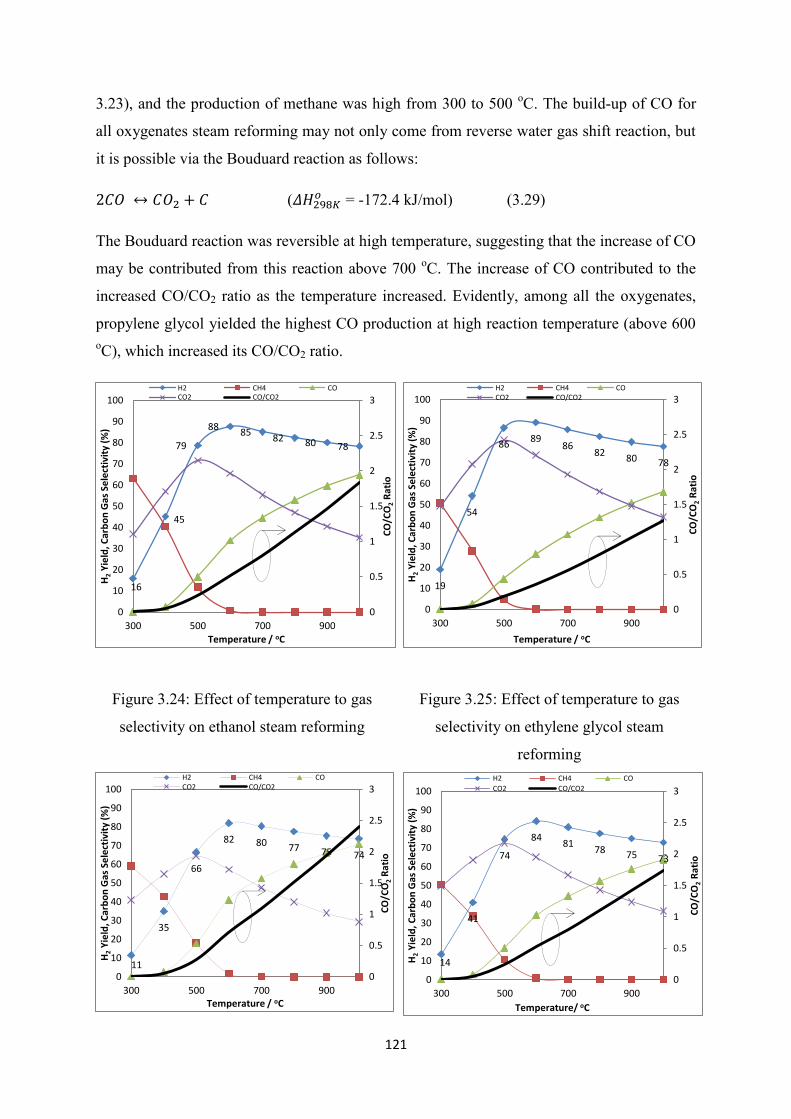
121
3.23), and the production of methane was high from 300 to 500 oC. The build-up of CO for
all oxygenates steam reforming may not only come from reverse water gas shift reaction, but
it is possible via the Bouduard reaction as follows:
( = -172.4 kJ/mol) (3.29)
The Bouduard reaction was reversible at high temperature, suggesting that the increase of CO
may be contributed from this reaction above 700 oC. The increase of CO contributed to the
increased CO/CO2 ratio as the temperature increased. Evidently, among all the oxygenates,
propylene glycol yielded the highest CO production at high reaction temperature (above 600
oC), which increased its CO/CO2 ratio.
Figure 3.24: Effect of temperature to gas
selectivity on ethanol steam reforming
Figure 3.25: Effect of temperature to gas
selectivity on ethylene glycol steam
reforming
16
45
79
88 85
82 80 78
0
0.5
1
1.5
2
2.5
3
0
10
20
30
40
50
60
70
80
90
100
300 500 700 900
CO
/CO
2 R
atio
H2
Yie
ld, C
arb
on
Gas
Se
lect
ivit
y (%
)
Temperature / oC
H2 CH4 COCO2 CO/CO2
19
54
86 89
86 82
80 78
0
0.5
1
1.5
2
2.5
3
0
10
20
30
40
50
60
70
80
90
100
300 500 700 900
CO
/CO
2 R
atio
H2
Yie
ld, C
arb
on
Gas
Se
lect
ivit
y (%
)
Temperature / oC
H2 CH4 COCO2 CO/CO2
11
35
66
82 80 77 75 74
0
0.5
1
1.5
2
2.5
3
0
10
20
30
40
50
60
70
80
90
100
300 500 700 900
CO
/CO
2 R
atio
H2
Yie
ld, C
arb
on
Gas
Se
lect
ivit
y (%
)
Temperature / oC
H2 CH4 COCO2 CO/CO2
14
41
74
84 81
78 75 73
0
0.5
1
1.5
2
2.5
3
0
10
20
30
40
50
60
70
80
90
100
300 500 700 900
CO
/CO
2 R
atio
H2
Yie
ld, C
arb
on
Gas
Se
lect
ivit
y (%
)
Temperature/ oC
H2 CH4 CO
CO2 CO/CO2
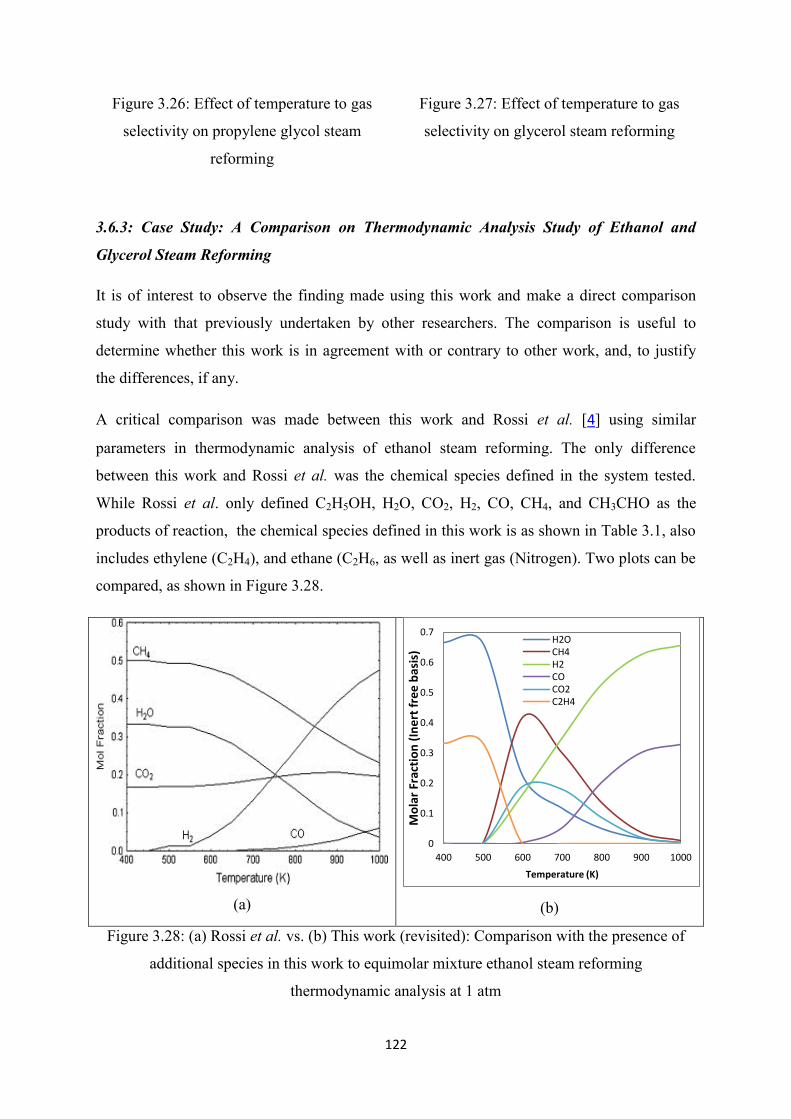
122
Figure 3.26: Effect of temperature to gas
selectivity on propylene glycol steam
reforming
Figure 3.27: Effect of temperature to gas
selectivity on glycerol steam reforming
3.6.3: Case Study: A Comparison on Thermodynamic Analysis Study of Ethanol and
Glycerol Steam Reforming
It is of interest to observe the finding made using this work and make a direct comparison
study with that previously undertaken by other researchers. The comparison is useful to
determine whether this work is in agreement with or contrary to other work, and, to justify
the differences, if any.
A critical comparison was made between this work and Rossi et al. [4] using similar
parameters in thermodynamic analysis of ethanol steam reforming. The only difference
between this work and Rossi et al. was the chemical species defined in the system tested.
While Rossi et al. only defined C2H5OH, H2O, CO2, H2, CO, CH4, and CH3CHO as the
products of reaction, the chemical species defined in this work is as shown in Table 3.1, also
includes ethylene (C2H4), and ethane (C2H6, as well as inert gas (Nitrogen). Two plots can be
compared, as shown in Figure 3.28.
(a)
(b)
Figure 3.28: (a) Rossi et al. vs. (b) This work (revisited): Comparison with the presence of
additional species in this work to equimolar mixture ethanol steam reforming
thermodynamic analysis at 1 atm
0
0.1
0.2
0.3
0.4
0.5
0.6
0.7
400 500 600 700 800 900 1000
Mo
lar
Frac
tio
n (
Ine
rt f
ree
bas
is)
Temperature (K)
H2OCH4H2COCO2C2H4

123
It can be observed from Figure 3.4, that, similarly, the work from Rossi et al. can be
reproduced, however, by introducing the additional components, it can be suggested that at
low temperature (100-300 oC), the reaction was prone to produce ethylene via dehydration,
which they failed to discuss. Significantly, the water or steam provided increased with the
increased production of ethylene. Thermal decomposition and steam reforming only occurred
above 600 K with an initial large amount of methane at this temperature, which results from
the decomposition of ethanol into methane, hydrogen, and CO:
(3.27)
Another comparison was made between this work and Vasudeva et al. [1]. They omitted
ethane, but included carbon in their work using sequential quadratic programming (SQP).
The reforming was studied at 1000 K (727 oC) and atmospheric pressure. The outcome is
shown in Figures 3.29 (a) and (b). It was found that this work is in agreement with Vasudeva
et al. for a steam to ethanol ratio of 2:1 and above. However, when there was no steam
present, i.e. a steam to ethanol ratio of 0:1, Vasudeva’s work predicted the presence of carbon
at this condition, whilst there was no indication of the presence of carbon in this work. They
did not include ethane species, but there is no significant difference between both works.
Even though there is a possibility that Vasudeva et al. might present it correctly at a steam to
fuel ratio of 0:1, for which they predicted the presence of carbon, there should be a
consideration of a reverse Bouduard reaction, which occurs at 700 oC and above.
In general, this work on thermodynamic analysis of ethanol steam reforming agrees more
with Vasudeva et al. in comparison to the work carried out by Rossi et al.

124
Figure 3.29: This work (a) vs. Vasudeva et al. (b): Comparison of thermodynamic analysis of
ethanol steam reforming at 1000 K
With respect to glycerol steam reforming thermodynamic analysis, this work is compared
with Adhikari et al. and Wang et al. [5, 7]. As previously discussed in section 3.4.3, the
property package chosen for Aspen-HYSYS with similar species (including carbon) was not
able to make a similar estimation to what Adhikari et al. predicted, except when the carbon
species was removed. However, when more species were included as intermediate species, as
can be referred to in Table 3.1, the inclusion of carbon as the additional species gave similar
results as Adhikari’s, hence the plots, as shown in Figure 3.7, remain unchanged. The only
limitation from Aspen-HYSYS is the capability for predicting the carbon formation as none
of the property packages tested could give any indication of carbon formation. In addition,
Gibbs reactor only predicted the liquid and vapour phases as the reactor effluent.
Wang et al. studied the thermodynamic analysis of glycerol steam reforming using Matlab
and Lagrange’s multiplier method, incorporating Soave-Redlich-Kwong (SRK) equation of
state. In comparison to their work, the plot, as shown in Figures 3.30 (a) and (b), indicates
there was no significant difference with the estimation of hydrogen molar flow rate at 1 atm,
with a steam to fuel ratio at 3:1 and temperature range from 500 to 1000 K. A higher
pressure operation was not in the best interests of this work, and, thus, no comparison was
carried out with Wang’s work.
0
1
2
3
4
5
6
0 5 10 15 20
Yie
ld (
mo
le s
pe
cie
s/m
ole
eth
ano
l)
Steam to Fuel Ratio
(a)
CH3CHO CH4CO CO2H2 C2H4
0
1
2
3
4
5
6
0 5 10 15 20
Yie
ld (
mo
le s
pe
cie
s/m
ole
eth
ano
l)
Steam to Fuel Ratio
(b)
CH3CHO CH4CO CO2H2 C2H4
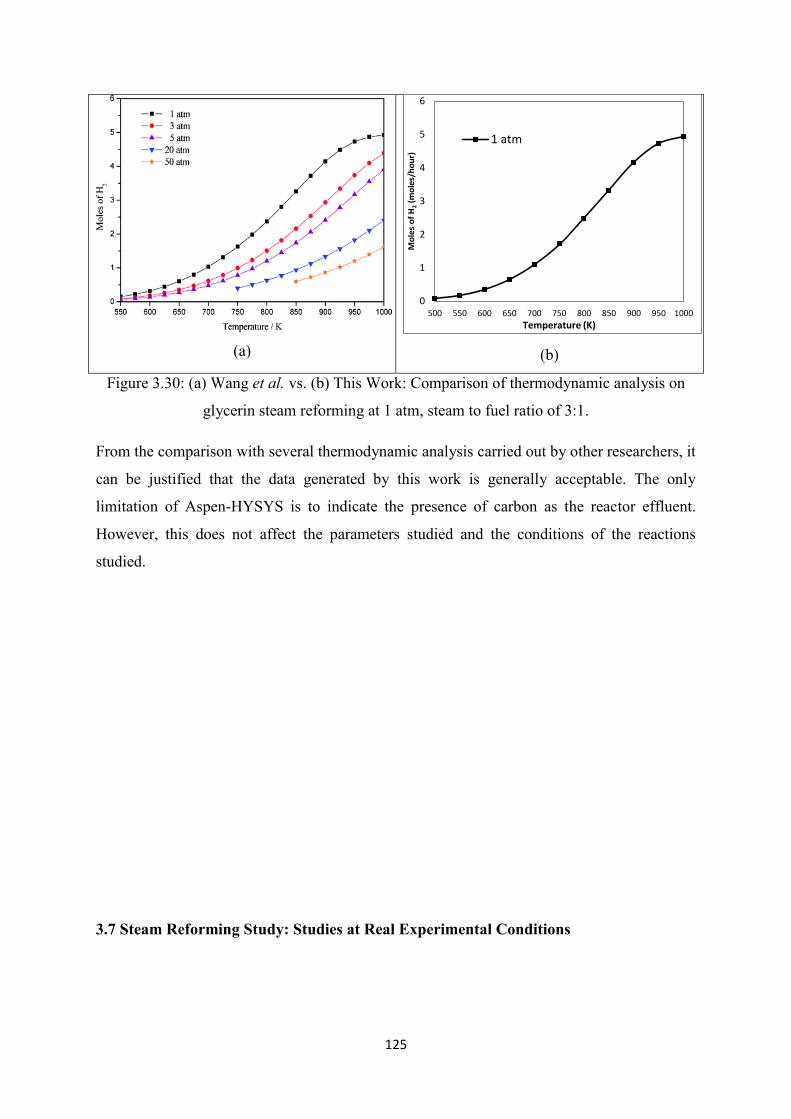
125
(a)
(b)
Figure 3.30: (a) Wang et al. vs. (b) This Work: Comparison of thermodynamic analysis on
glycerin steam reforming at 1 atm, steam to fuel ratio of 3:1.
From the comparison with several thermodynamic analysis carried out by other researchers, it
can be justified that the data generated by this work is generally acceptable. The only
limitation of Aspen-HYSYS is to indicate the presence of carbon as the reactor effluent.
However, this does not affect the parameters studied and the conditions of the reactions
studied.
3.7 Steam Reforming Study: Studies at Real Experimental Conditions
0
1
2
3
4
5
6
500 550 600 650 700 750 800 850 900 950 1000
Mo
les
of
H2 (
mo
les/
ho
ur)
Temperature (K)
1 atm
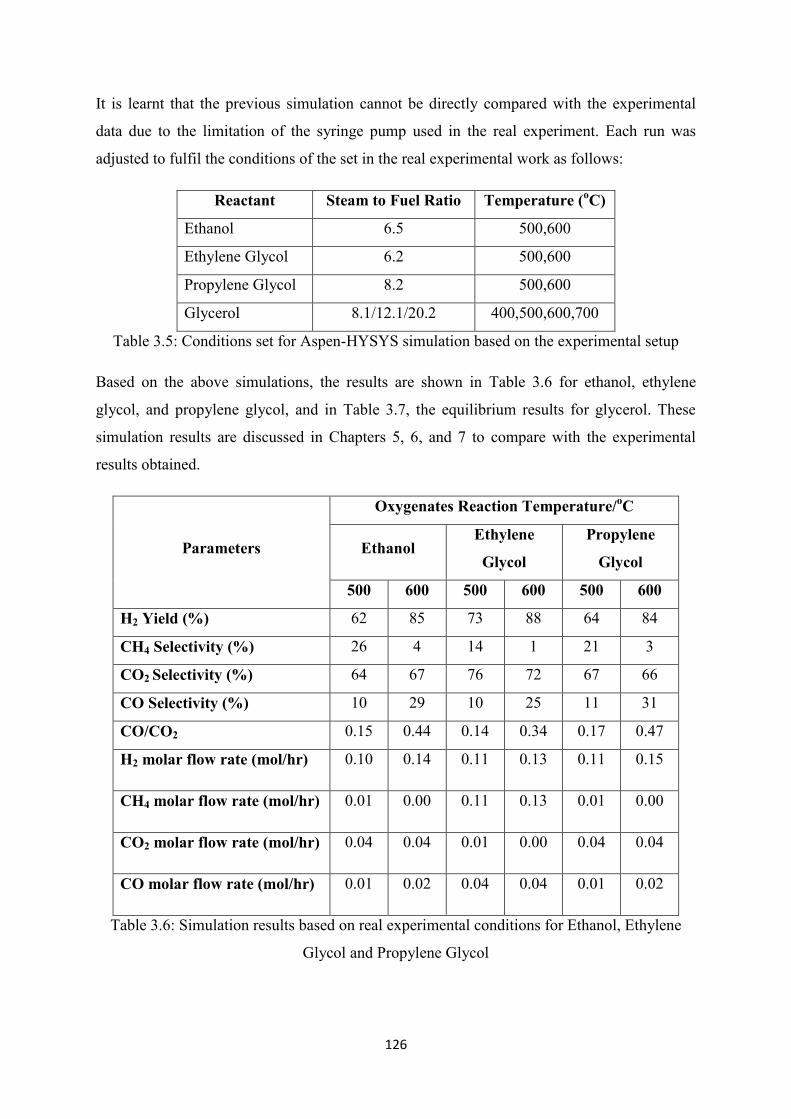
126
It is learnt that the previous simulation cannot be directly compared with the experimental
data due to the limitation of the syringe pump used in the real experiment. Each run was
adjusted to fulfil the conditions of the set in the real experimental work as follows:
Reactant Steam to Fuel Ratio Temperature (oC)
Ethanol 6.5 500,600
Ethylene Glycol 6.2 500,600
Propylene Glycol 8.2 500,600
Glycerol 8.1/12.1/20.2 400,500,600,700
Table 3.5: Conditions set for Aspen-HYSYS simulation based on the experimental setup
Based on the above simulations, the results are shown in Table 3.6 for ethanol, ethylene
glycol, and propylene glycol, and in Table 3.7, the equilibrium results for glycerol. These
simulation results are discussed in Chapters 5, 6, and 7 to compare with the experimental
results obtained.
Parameters
Oxygenates Reaction Temperature/oC
Ethanol Ethylene
Glycol
Propylene
Glycol
500 600 500 600 500 600
H2 Yield (%) 62 85 73 88 64 84
CH4 Selectivity (%) 26 4 14 1 21 3
CO2 Selectivity (%) 64 67 76 72 67 66
CO Selectivity (%) 10 29 10 25 11 31
CO/CO2 0.15 0.44 0.14 0.34 0.17 0.47
H2 molar flow rate (mol/hr) 0.10 0.14 0.11 0.13 0.11 0.15
CH4 molar flow rate (mol/hr) 0.01 0.00 0.11 0.13 0.01 0.00
CO2 molar flow rate (mol/hr) 0.04 0.04 0.01 0.00 0.04 0.04
CO molar flow rate (mol/hr) 0.01 0.02 0.04 0.04 0.01 0.02
Table 3.6: Simulation results based on real experimental conditions for Ethanol, Ethylene
Glycol and Propylene Glycol

127
Parameters
Steam to Fuel Ratio
(S/F = 8.1/1) 600
oC
400 500 600 700 S/F=
12.1/1
S/F=
20.2/1
H2 Yield (%) 27 58 82 84 88.20 94.02
CH4 Selectivity (%) 42 23 4.2 0.3 2.33 0.50
CO2 Selectivity (%) 57 70 71 63 79.47 87.59
CO Selectivity (%) 1.1 7.9 25 37 18.20 11.91
CO/CO2 0.02 0.11 0.35 0.58 0.23 0.14
H2 molar flow rate (mol/hr) 0.04 0.09 0.13 0.13 0.14 0.15
CH4 molar flow rate (mol/hr) 0.03 0.01 0.00 0.00 0.00 0.00
CO2 molar flow rate (mol/hr) 0.04 0.05 0.05 0.04 0.05 0.06
CO molar flow rate (mol/hr) 0.00 0.01 0.02 0.02 0.01 0.01
Table 3.7: Simulation results based on real experimental conditions for Glycerol
3.8 Conclusion
Thermodynamic analysis of oxygenated hydrocarbons reforming consisted of a homologues
series of ethanol to glycerol, which was studied using Gibbs minimisation energy method via
Aspen-HYSYS. The species presented in the reaction, however, was not compatible with the
typical equation of states, such as Peng-Robinson or Soave-Redlich-Kwong, and, therefore,
the modification of these equations were tested. The PR-Twu property package was chosen
and this was validated with the data obtained from the work of other researchers for similar
reactions. It can be confirmed that this model worked well and was compatible with all the
species predicted to be present in the reaction.
Autothermal steam reforming and steam reforming were studied for each oxygenate and the
optimum condition for each oxygenate was obtained accordingly. The initial oxygen to
carbon ratio (O/C) ratio for each oxygenate was significant to assist the reaction at a
thermoneutral condition. None of the reactants could sustain the heating at a supplied
temperature above 400 oC and fell in the endothermic region, and, therefore, needed some
external heat; in this study air/O2 was used to push the reactions into the exothermic region.
Whilst glycerol and ethylene glycol required a small amount of air injection to give optimum

128
performance, more air was required for ethanol and propylene glycol since the O/C ratio for
both ethanol and propylene glycol are low.
The steam reforming of these homologues was also studied according to the effect of the
steam to fuel ratio and the effect of the reaction temperature. The findings generally agreed
with other researchers that a higher steam to fuel ratio would yield higher hydrogen.
However, this has to be looked at in terms of the economic perspective of which the higher
loading of the steam will expand the reactor’s size, and therefore, is not economically wise to
do so. There is also a higher energy demand for raising the excess steam to achieve these high
steam ratios, which also increases the operating costs, as supported by Dupont et al. [30].
Steam reforming at atmospheric pressure is best to be conducted at between 600 and 700 oC
for all oxygenates to obtain a high yield of hydrogen and CO2 in the presence of a good
catalyst design. This will also reduce other by-products, such as methane. However, as for
syn gas (H2 & CO) formation, the operation temperature should go above 700 oC as the
reverse Bouduard reaction can assist at this temperature to give more CO.
Critical comparisons have been made between this work and several works on ethanol and
glycerol steam reforming thermodynamic analysis. The estimation made by this work
provided a generally acceptable outcome with the only limitation that Aspen-HYSYS cannot
make any prediction on carbon formation.
Finally, this equilibrium study was also carried out using real experimental conditions for all
oxygenates as a means to compare with the experimental results discussed in other chapters.
129
3.9 References
[1] K. Vasudeva, N. Mitra, P. Umasankar, and S. C. Dhingra, "Steam reforming of
ethanol for hydrogen production: Thermodynamic analysis," International Journal of
Hydrogen Energy, vol. 21, pp. 13-18, Jan 1996.
[2] S. Adhikari, S. Fernando, and A. Haryanto, "A comparative thermodynamic and
experimental analysis on hydrogen production by steam reforming of glycerin,"
Energy & Fuels, vol. 21, pp. 2306-2310, Jul-Aug 2007.
[3] S. Authayanun, A. Arpornwichanop, W. Paengjuntuek, and S. Assabumrungrat,
"Thermodynamic study of hydrogen production from crude glycerol autothermal
reforming for fuel cell applications," International Journal of Hydrogen Energy, vol.
35, pp. 6617-6623, 2010.
[4] C. C. R. S. Rossi, C. G. Alonso, O. A. C. Antunes, R. Guirardello, and L. Cardozo,
"Thermodynamic analysis of steam reforming of ethanol and glycerine for hydrogen
production," International Journal of Hydrogen Energy, vol. 34, pp. 323-332, Jan
2009.
[5] X. D. Wang, S. R. Li, H. Wang, B. Liu, and X. B. Ma, "Thermodynamic Analysis of
Glycerin Steam Reforming," Energy & Fuels, vol. 22, pp. 4285-4291, Nov-Dec 2008.
[6] S. Aktas, M. Karakaya, and A. K. Avci, "Thermodynamic analysis of steam assisted
conversions of bio-oil components to synthesis gas," International Journal of
Hydrogen Energy, vol. 34, pp. 1752-1759, Feb 2009.
[7] S. Adhikari, S. Fernando, S. R. Gwaltney, S. D. Filip To, R. Mark Bricka, P. H.
Steele, and A. Haryanto, "A thermodynamic analysis of hydrogen production by
steam reforming of glycerol," International Journal of Hydrogen Energy, vol. 32, pp.
2875-2880, 2007.
[8] Y. M. Alshammari and K. Hellgardt, "Thermodynamic analysis of hydrogen
production via hydrothermal gasification of hexadecane," International Journal of
Hydrogen Energy, vol. 37, pp. 5656-5664, Apr 2012.
[9] E. C. Vagia and A. A. Lemonidou, "Thermodynamic analysis of hydrogen production
via autothermal steam reforming of selected components of aqueous bio-oil fraction,"
International Journal of Hydrogen Energy, vol. 33, pp. 2489-2500, May 2008.
[10] W. Wang and Y. Wang, "Thermodynamic analysis of hydrogen production via partial
oxidation of ethanol," International Journal of Hydrogen Energy, vol. 33, pp. 5035-
5044, 2008.

130
[11] P. Atkins and J. de Paula, Atkins' Physical Chemistry: OUP Oxford, 2010.
[12] R. S. Berry, S. A. Rice, and J. Ross, Physical Chemistry: Oxford University Press,
2000.
[13] H. Q. Tang and K. Kitagawa, "Supercritical water gasification of biomass:
thermodynamic analysis with direct Gibbs free energy minimization," Chemical
Engineering Journal, vol. 106, pp. 261-267, Feb 28 2005.
[14] C. H. Twu, J. E. Coon, and J. R. Cunningham, "A New Cubic Equation of State,"
Fluid Phase Equilibria, vol. 75, pp. 65-79, Aug 14 1992.
[15] C. H. Twu, D. Bluck, J. R. Cunningham, and J. E. Coon, "A Cubic Equation of State
with a New Alpha Function and a New Mixing Rule," Fluid Phase Equilibria, vol.
69, pp. 33-50, Dec 10 1991.
[16] L. Qadariyah, Mahfud, Sumarno, S. Machmudah, Wahyudiono, M. Sasaki, and M.
Goto, "Degradation of glycerol using hydrothermal process," Bioresource
Technology, vol. 102, pp. 9267-9271, 2011.
[17] F. Auneau, C. Michel, F. Delbecq, C. Pinel, and P. Sautet, "Unravelling the
Mechanism of Glycerol Hydrogenolysis over Rhodium Catalyst through Combined
Experimental-Theoretical Investigations," Chemistry-a European Journal, vol. 17, pp.
14288-14299, Dec 2011.
[18] K. Kawasaki and K. Yamane, "Thermal Decomposition of Waste Glycerol,"
Proceedings of the International Conference on Power Engineering 2009 (Icope-09),
Vol 3, pp. 49-53, 2009.
[19] D. Z. Mezalira, L. D. Probst, S. Pronier, Y. Batonneau, and C. Batiot-Dupeyrat,
"Decomposition of ethanol over Ni/Al2O3 catalysts to produce hydrogen and carbon
nanostructured materials," Journal of Molecular Catalysis a-Chemical, vol. 340, pp.
15-23, Apr 23 2011.
[20] R. R. Davda, J. W. Shabaker, G. W. Huber, R. D. Cortright, and J. A. Dumesic,
"Aqueous-phase reforming of ethylene glycol on silica-supported metal catalysts,"
Applied Catalysis B: Environmental, vol. 43, pp. 13-26, 2003.
[21] D. J. M. de Vlieger, B. L. Mojet, L. Lefferts, and K. Seshan, "Aqueous Phase
Reforming of ethylene glycol - Role of intermediates in catalyst performance,"
Journal of Catalysis, vol. 292, pp. 239-245, Aug 2012.
[22] P. N. Kechagiopoulos, S. S. Voutetakis, A. A. Lemonidou, and I. A. Vasalos,
"Sustainable hydrogen production via reforming of ethylene glycol using a novel
spouted bed reactor," Catalysis Today, vol. 127, pp. 246-255, 2007.

131
[23] Ş. Özkara-Aydınoğlu, "Thermodynamic equilibrium analysis of combined carbon
dioxide reforming with steam reforming of methane to synthesis gas," International
Journal of Hydrogen Energy, vol. 35, pp. 12821-12828, 2010.
[24] J. Clark, Calculations in AS/A Level Chemistry: Longman, 2000.
[25] A. Casanovas, M. Saint-Gerons, F. Griffon, and J. Llorca, "Autothermal generation of
hydrogen from ethanol in a microreactor," International Journal of Hydrogen Energy,
vol. 33, pp. 1827-1833, 2008.
[26] B. Zhang, W. Cai, Y. Li, Y. Xu, and W. Shen, "Hydrogen production by steam
reforming of ethanol over an Ir/CeO2 catalyst: Reaction mechanism and stability of
the catalyst," International Journal of Hydrogen Energy, vol. 33, pp. 4377-4386,
2008.
[27] M. Ni, D. Y. C. Leung, and M. K. H. Leung, "A review on reforming bio-ethanol for
hydrogen production," International Journal of Hydrogen Energy, vol. 32, pp. 3238-
3247, 2007.
[28] A. M. Karim, Y. Su, J. Sun, C. Yang, J. J. Strohm, D. L. King, and Y. Wang, "A
comparative study between Co and Rh for steam reforming of ethanol," Applied
Catalysis B: Environmental, vol. 96, pp. 441-448, 2010.
[29] D. R. Sahoo, S. Vajpai, S. Patel, and K. K. Pant, "Kinetic modeling of steam
reforming of ethanol for the production of hydrogen over Co/Al2O3 catalyst,"
Chemical Engineering Journal, vol. 125, pp. 139-147, 2007.
[30] V. Dupont, M. V. Twigg, A. N. Rollinson, and J. M. Jones, "Thermodynamics of
hydrogen production from urea by steam reforming with and without in situ carbon
dioxide sorption," International Journal of Hydrogen Energy, vol. 38, pp. 10260-
10269, 2013.
132
CHAPTER 4: CATALYST CHARACTERISATION AND GENERAL
EXPERIMENTAL SETUP
4.1 Introduction
As mentioned earlier in the first chapter, the main objective of this doctoral research is to
investigate and analyse the performance of steam reforming of oxygenated hydrocarbons
using several catalysts. The catalysts used for the purposes of this research are solid in nature
and therefore heterogeneous reactions (gas-solid) will take place within the reactor bed.
Chapter 4 aims to describe the method of preparation and the characterisation of these
catalysts. This chapter will not only describe and illustrate the experimental setup and
methodology of the tests conducted, but will also highlight the calculations involved to
ensure the reliability and validity of the data collection.
4.2 Catalyst Preparation and Characterization
A commercial catalyst (18 wt% Ni, 12 wt% Ca) on alumina, obtained from Alfa Aesar,
known as Hi-FUEL R110 (Hi-FUEL) was used and investigated for the purposes of this
research. This catalyst is greyish in colour prior to reduction, shaped in a 4-flute dome
cylinder with the mean length of 13 mm and an average diameter of 10 mm. Each flute
diameter is 2 mm. The bulk density of this catalyst is 0.9 g/cm3, as reported by the
manufacturer. Another commercial Ni/Al2O3 catalyst (15 wt%Ni) was also used as a
comparison study with the above mentioned catalyst, denoted as NiAl(C). Altogether, there
were six other catalysts prepared via the impregnation method, i.e. 15wt% Ni on γ –alumina,
3, 7, and 9 wt% Ca on γ –alumina, as well as 15 wt% Ni promoted with 3 and 7 wt% Ca on γ
–alumina. These catalysts are denoted as follows: NiAl(S), 3Ca, 7Ca, 9Ca, 15Ni3Ca, and
15Ni7Ca, respectively.
For the preparation of the calcium based catalysts, the precursor of calcium (calcium acetate
hydrate, C4H6CaO4.xH2O, Sigma-Aldrich UK) was weighed accordingly and diluted in
5-10 ml of DI water. The alumina (ACROS ORGANICS, 99%, extra pure) was added to the
function as support and the mixture was stirred continuously at room temperature using a
magnetic stirrer for up to 24 hours.

133
With respect to the preparation of 15Ni3Ca and 15Ni7Ca, the nickel precursor (nickel nitrate,
Ni(NO3)2.6H2O, BDH Chemicals Ltd, Poole, England) was diluted and mixed with the
calcium precursor, as mentioned earlier. The mixture was stirred continuously using a
magnetic stirrer for 24 hours. Later, alumina was added and stirred continuously again at
room temperature for another 24 hours. Similarly, for the preparation of NiAl(S), the nickel
precursor was impregnated on alumina to make up for the 15wt% of the final Ni loading.
These prepared catalysts were dried at 80 oC for 12 hours using a hot plate to vaporise the
excessive water content. The dried catalysts were further heated in an oven at
110 oC for another 12 hours to completely remove any remaining moisture in the catalysts.
The prepared catalysts were calcined in batches in a static air oven at 773 K for 12 hours.
Similarly, alumina, which was also calcined using the same temperature for further tests, is
denoted as Al2O3.
All the catalysts (including the Hi-FUEL and NiAl(C)) were characterised using the XRF
Spectrometer to identify the components and the metal loading weight percentage. Nitrogen
physisorption (Micromeritics Tristar apparatus) was employed to determine the morphology
and physical properties of these catalysts of which the BET surface area, the total pore
volume, and the average pore diameters were determined. The samples were degassed at 220
oC to ensure that all the moisture was completely removed. The TPDRO machine (Thermo
Finnigan, 1100 SERIES) was used to study the temperature programme reduction (TPR) for
each catalyst at 10 oC/min up to 1173 K. A 50mg sample of the catalyst was loaded into a
glass column, which was placed inside the equipment under the flow of pure hydrogen at 20
ml/min. Hi-FUEL was also further tested with different heating rates, i.e. at 5, 10, and 15
oC/min to determine the activation energy associated with each peak.
The type and quantity of carbon deposited on the spent catalysts were analysed using a
CHNS Analyzer (LECO, VTF900) and Thermogravimetric Analyser (Perkin Elmer, Pyris 1).
TEM (LIBRA 200FE, Carl Zeiss) and FESEM (Supra 55VP, Carl Zeiss) were utilised to
produce images of the catalysts surface prior and after tests. In FESEM, the samples were
mounted on aluminium stubs using carbon tape. The images were taken at 5kV of the beam
voltages.
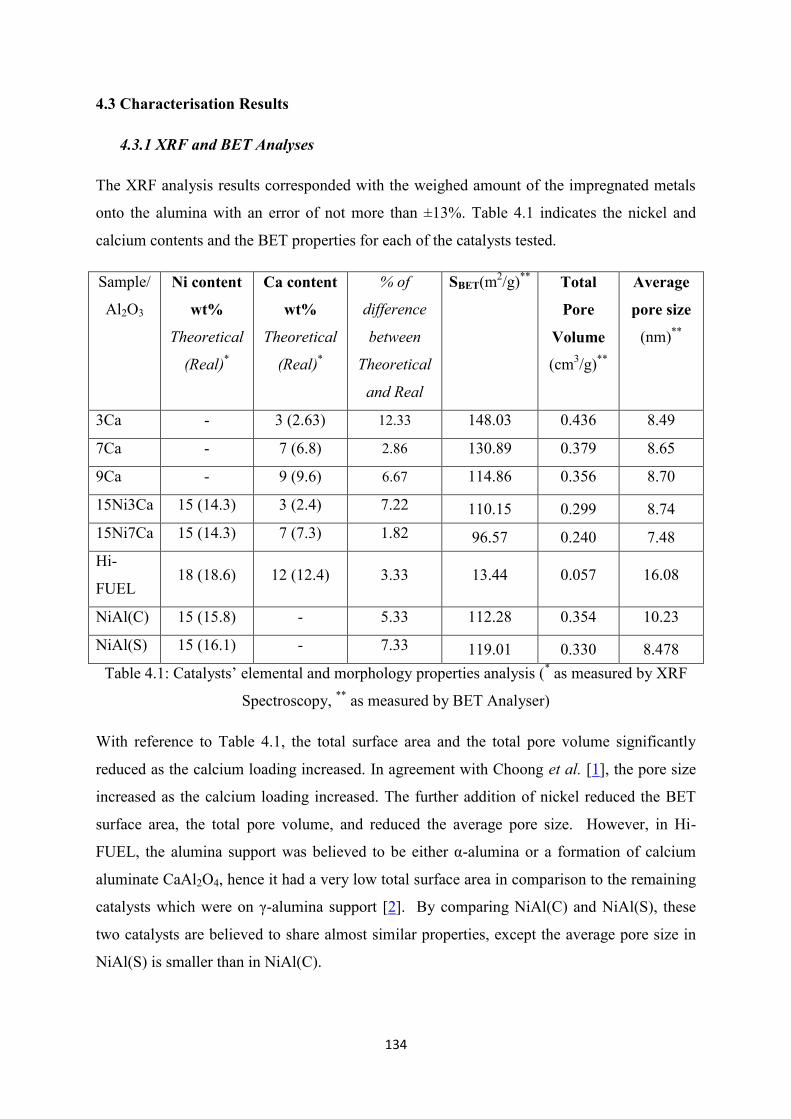
134
4.3 Characterisation Results
4.3.1 XRF and BET Analyses
The XRF analysis results corresponded with the weighed amount of the impregnated metals
onto the alumina with an error of not more than ±13%. Table 4.1 indicates the nickel and
calcium contents and the BET properties for each of the catalysts tested.
Sample/
Al2O3
Ni content
wt%
Theoretical
(Real)*
Ca content
wt%
Theoretical
(Real)*
% of
difference
between
Theoretical
and Real
SBET(m2/g)
** Total
Pore
Volume
(cm3/g)
**
Average
pore size
(nm)**
3Ca - 3 (2.63) 12.33 148.03 0.436 8.49
7Ca - 7 (6.8) 2.86 130.89 0.379 8.65
9Ca - 9 (9.6) 6.67 114.86 0.356 8.70
15Ni3Ca 15 (14.3) 3 (2.4) 7.22 110.15 0.299 8.74
15Ni7Ca 15 (14.3) 7 (7.3) 1.82 96.57 0.240 7.48
Hi-
FUEL 18 (18.6) 12 (12.4) 3.33 13.44 0.057 16.08
NiAl(C) 15 (15.8) - 5.33 112.28 0.354 10.23
NiAl(S) 15 (16.1) - 7.33 119.01 0.330 8.478
Table 4.1: Catalysts’ elemental and morphology properties analysis (* as measured by XRF
Spectroscopy, **
as measured by BET Analyser)
With reference to Table 4.1, the total surface area and the total pore volume significantly
reduced as the calcium loading increased. In agreement with Choong et al. [1], the pore size
increased as the calcium loading increased. The further addition of nickel reduced the BET
surface area, the total pore volume, and reduced the average pore size. However, in Hi-
FUEL, the alumina support was believed to be either α-alumina or a formation of calcium
aluminate CaAl2O4, hence it had a very low total surface area in comparison to the remaining
catalysts which were on γ-alumina support [2]. By comparing NiAl(C) and NiAl(S), these
two catalysts are believed to share almost similar properties, except the average pore size in
NiAl(S) is smaller than in NiAl(C).

135
4.3.2 Temperature Programme Reduction Analysis (TPR)
The hydrogen chemisorption study is presented in Figure 4.1 below. The peaks associated
with each catalyst are tabulated in Table 4.2:
Peaks
Temperature/
Catalyst
Bulk NiO
(Free Nickel)
(K)
NiO interacted
with Alumina
(Fixed Nickel)
(K)
Nickel
Aluminate
(NiAl2O4) (K)
CaO interacted
with Alumina
(K)
3Ca - - - 973
7Ca - - - 1010
9Ca - - - 1033
15Ni3Ca - 788 980 1107
15Ni7Ca 622 703 984 1110
Hi-FUEL - 723 953 1088
NiAl(C) 595 788 - -
NiAl(S) - 902 1071 -
Table 4.2: Hydrogen adsorption peaks of metal elements after reduction using the TPR
method
It can be observed from Table 4.2 and Figure 4.1 that CaO interacted with alumina and that it
could only be reduced by hydrogen above 900 K. The increase of calcium loading shifted the
calcium reduction temperature to the right with the following peaks temperature: 3Ca
(973 K), 7Ca (1010 K), and 9Ca (1033 K), respectively, which suggests the formation of
calcium aluminate. Nickel peaks can be identified from the several significant/noticeable
peaks; it is a bulk of NiO, known as ‘free nickel’ or ‘fixed nickel’ when supported with
alumina or it forms nickel aluminate (NiAl2O4), when it is heavily impregnated on alumina
[3]. On the Hi-FUEL catalyst surface, nickel was found to be present in fixed nickel and
formed nickel aluminate. Ca doped on Hi-FUEL was found to interact with the support based
on the TPR peak temperature at 1088 K. It is assumed to have similar peak properties to 3Ca,
7Ca, and 9Ca. It was observed that calcium doped on nickel/alumina catalyst shifted the
reduction temperature to the left, i.e. lowered the nickel reduction temperature by forming
more free nickel and fixed nickel, hence allowing the nickel metal to be more active in the
reaction afterwards. It is vital to mention here that the findings above matched that of Choong

136
et al. [1], whereby the presence of calcium lowered the tendency of nickel aluminate
formation and was likely to form calcium aluminate.
In NiAl(C) and NiAl(S), it was observed that more free nickel was obtained via NiAl(C),
whilst none was found on NiAl(S). This difference could be related to the method of
preparation for both catalysts. When a similar method of preparation of NiAl(S) was applied
in comparison to Hi-FUEL, 15Ni3Ca, and 15Ni7Ca, the temperature of reduction for nickel
in NiAl(S) shifted to the left due to the presence of the calcium promoter that shared similar
support.

137
Figure 4.1: Temperature Programme Reduction (TPR) profiles of fresh calcined samples of Al2O3 supported catalysts

138
Figure 4.2: TPR Profiles for fresh Hi-FUEL catalyst at different heating rates
Hi-FUEL was reduced at different heating rates to identify the activation energy of each
associated peak using the Kissinger method. The maximum temperatures of the peaks that
were associated with fixed nickel, nickel aluminate, and calcium on alumina were denoted as
I, II, and III, respectively, as shown in Figure 4.2. The Kissinger equation [4] is described as
follows:
(
) (
)
(4.1)
Where
= heating rate (K-1
)
Tmax = maximum peak temperature
= constant
= activation energy (kJ/mol)
R = gas constant (8.314 kJ mol-1
K-1
)
350 450 550 650 750 850 950 1050 1150
Temperature (K)
Hi-FUEL 5
Hi-FUEL 10
Hi-FUEL 15
I
II
III
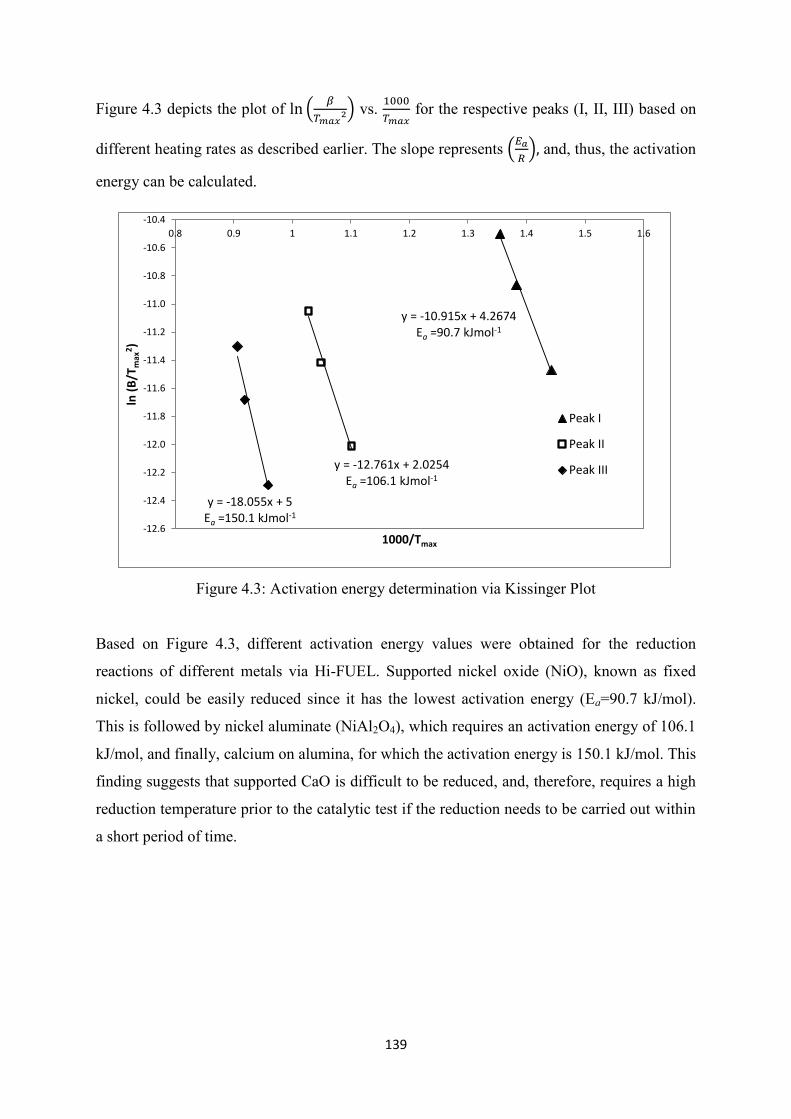
139
Figure 4.3 depicts the plot of (
) vs.
for the respective peaks (I, II, III) based on
different heating rates as described earlier. The slope represents (
) and, thus, the activation
energy can be calculated.
Figure 4.3: Activation energy determination via Kissinger Plot
Based on Figure 4.3, different activation energy values were obtained for the reduction
reactions of different metals via Hi-FUEL. Supported nickel oxide (NiO), known as fixed
nickel, could be easily reduced since it has the lowest activation energy (Ea=90.7 kJ/mol).
This is followed by nickel aluminate (NiAl2O4), which requires an activation energy of 106.1
kJ/mol, and finally, calcium on alumina, for which the activation energy is 150.1 kJ/mol. This
finding suggests that supported CaO is difficult to be reduced, and, therefore, requires a high
reduction temperature prior to the catalytic test if the reduction needs to be carried out within
a short period of time.
y = -10.915x + 4.2674 Ea =90.7 kJmol-1
y = -12.761x + 2.0254 Ea =106.1 kJmol-1
y = -18.055x + 5 Ea =150.1 kJmol-1
-12.6
-12.4
-12.2
-12.0
-11.8
-11.6
-11.4
-11.2
-11.0
-10.8
-10.6
-10.4
0.8 0.9 1 1.1 1.2 1.3 1.4 1.5 1.6
ln (
B/T
max
2 )
1000/Tmax
Peak I
Peak II
Peak III

140
4.3.3 Field Emission Scanning Electron Microscopy (FESEM) and Transmission
Electron Microscopy (TEM)
(a)
(b)
Figure 4.4: FESEM images of fresh Hi-FUEL:
(a) Magnification of 10.00 K X, (b) Magnification of 50.00 K X
(a)
(b)
Figure 4.5: FESEM images of reduced Hi-FUEL at 750 oC for 1 hour under
75ml/min H2 flow: (a) Magnification of 10.00 K X, (b) Magnification of 50.00 K X
The images, as shown in Figures 4.4 (a) and (b), illustrate the FESEM images of fresh
Hi-FUEL. Both figures 4.5 (a) and (b) display a reduced Hi-FUEL under pure hydrogen flow
at 75 ml/min at 750 oC for one hour, with the heating rate at 10
oC/min. Both images were
scanned under the SE2 signal instead of using In-Line since both images had charging effects
on the imaging process. These images reflect a significant difference on the catalyst surface

141
prior to and after the reduction process, which suggests sintering, i.e. the formation of
aggregates may occur.
(a)
(b)
(c)
Figure 4.6: TEM images of fresh Hi-FUEL catalyst: (a) 1: 100 nm, (b) 1: 50nm, (c) 1: 10 nm
Figures 4.6 (a) – (c) demonstrate the TEM images of fresh Hi-FUEL catalyst at different
scaling ratios. The nickel and calcium metals were well dispersed. Figure 4.6 (c) illustrates
nickel particles on alumina support. Alumina is seen as one big chunk, as circled on the
image, which agrees with the findings from the BET surface area, as mentioned earlier,
suggesting a low surface area of α-alumina or CaAl2O4.
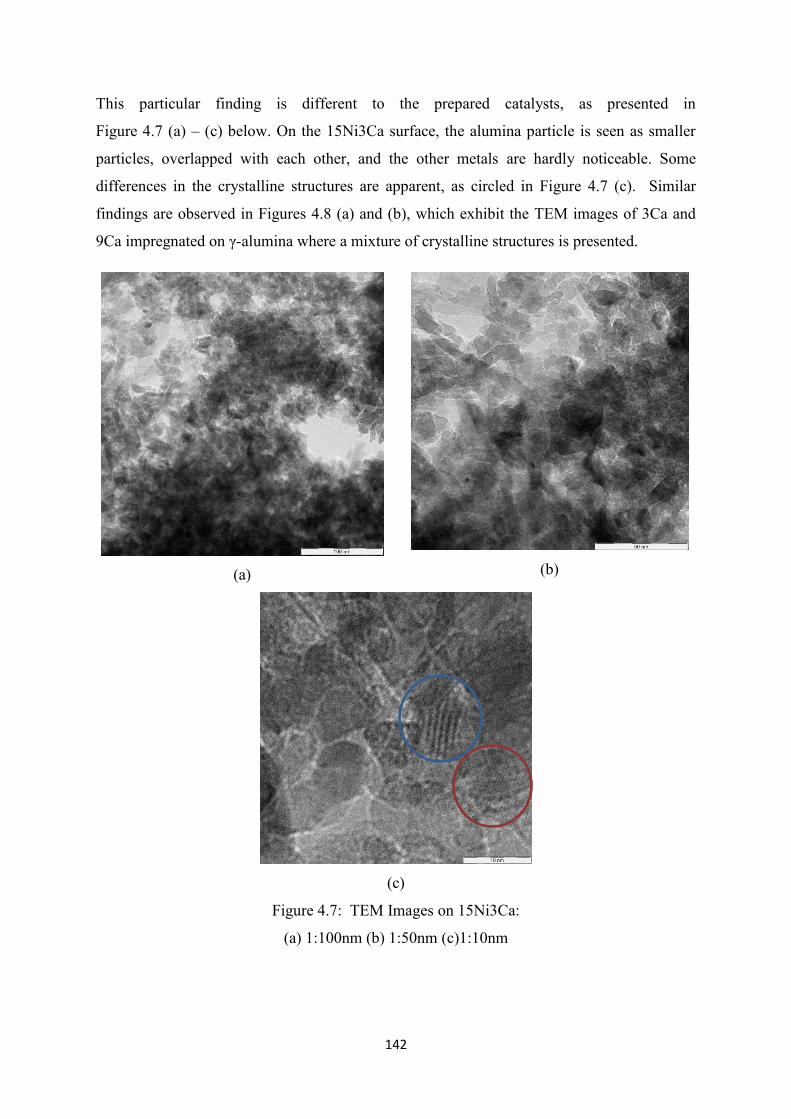
142
This particular finding is different to the prepared catalysts, as presented in
Figure 4.7 (a) – (c) below. On the 15Ni3Ca surface, the alumina particle is seen as smaller
particles, overlapped with each other, and the other metals are hardly noticeable. Some
differences in the crystalline structures are apparent, as circled in Figure 4.7 (c). Similar
findings are observed in Figures 4.8 (a) and (b), which exhibit the TEM images of 3Ca and
9Ca impregnated on γ-alumina where a mixture of crystalline structures is presented.
(a)
(b)
(c)
Figure 4.7: TEM Images on 15Ni3Ca:
(a) 1:100nm (b) 1:50nm (c)1:10nm

143
(a)
(b)
Figure 4.8: TEM Images of prepared calcium/alumina catalysts with scale 1:10nm:
(a) 3Ca, (b) 9Ca
All of these images were compared with the spent catalysts of a similar type to observe the
carbon formation on the catalyst surface and the type of carbon formed. This is discussed in
detail in Chapter 8.

144
4.4 Experimental Setup and Calculations
All the catalytic tests were carried out in a micro reactor as illustrated in Figures 4.9 (a) and
(b) and the process flow diagram (PFD) in Figure 4.10. The rig consists of the following
assets:
i. 1 Syringe pump (Razel R99-LF, 0.25 to 143 cm3/hour range)
ii. 4 Mass Flow Controller (Brooks 5850 TR Series):
a. N2 /vaporiser (MFC 4) – 0 – 200 ml/min N2 range
b. N2 /purge (MFC 3) – 0 – 1000 ml/min N2 range
c. H2 (MFC 1) – 0 – 200 ml/min H2 range
d. Air or CO (MFC 2) – 0 – 200 ml/min Air or CO range
iii. 1 Tube Furnace (Lenton CSC 12/--/300V, Serial Number: 20-400890) with
Eurotherm display (Type 3508)
iv. 2 Mass Flow Controller Display Unit (Brooks 5876)
a. 1 set for controlling H2 and Air/CO flow
b. 1 set for controlling N2 (vaporiser) and N2 (purge) flow
v. 1 Unit of Temperature Controller
Figure 4.9: The images of the test rig
Vent MFC Controller/
Read Out Unit
Tube
Furnace
Syringe
Pump
Temperature
Controller Unit
Vaporiser

145
Figure 4.10: Experimental general setup process flow diagram (PFD)

146
4.4.1 General Process Description
The reactant (a mixture of water and oxygenate) was prepared according to the required water
to fuel ratio prior to the test. Following the PFD, as shown in Figure 4.10, the reactant was
pumped into the vaporiser via a syringe pump (Razel R99-LF), and was connected to a non-
return valve (Swagelok) to avoid backpressure. A three-way valve (Swagelok) to fit the tube
of 1.5 mm diameter (1/16″) was fitted prior to the vaporiser and the sampling point was used
for calibration purposes. The vaporiser is illustrated in Figure 4.11.
Figure 4.11: Vaporiser’s diagram
The reactant entering the vaporiser was heated at a temperature according to the type of
oxygenate being tested: 200 oC for ethanol/water mixture, 300
oC for ethylene glycol/H2O
mixture, and propylene glycol/H2O mixture, and 400 oC for glycerol/ H2O mixture. The
vaporiser consisted of a stainless steel (SS316) tube of approximately 200 mm long with an
internal diameter of 8.5 mm (3/8″). The vaporiser was inserted with silica carbide of 750
microns in size to reduce the temperature gradient within it. The reactant was pumped from
the bottom part of the vaporiser via a 1.5 mm (1/16″) diameter tube and it slowly moved to

147
the top of the vaporiser while being heated. The nitrogen flow (BOC, Oxygen Free) acted as
the carrier gas and was supplied to the top of the vaporiser via a stainless steel tube of 3.2 mm
(1/8″) diameter and the flow was controlled by the mass flow controller, MFC 4. The
nitrogen was supplied at a constant flow, which is 30% v/v of the total gas phase flow. The
mixture of nitrogen and vaporised reactant is at the top of the vaporiser channel within the
silica carbide bed and enters the heated tube line from the tee (Swagelok) fitted at the bottom
of the vaporiser. The heated tube line’s diameter is 3.2 mm (1/8″) and the length is
approximately 500 mm. A high temperature check valve (Swagelok) was fitted prior to the
point where other gases, such as H2, CO or air (if they are utilised during the test), come in to
avoid any backflow to the vaporiser. Usually, the nitrogen flow from MFC 3 is supplied at a
high flow rate after the test is conducted to purge any remaining gases to the vent.
The vaporiser and the heated tube lines were heated with four coiled heaters (the power
supply is at 1449 W each) from 200 to 400 oC depending on the types of oxygenate used. The
vaporiser and the heated tube line temperatures were controlled via a temperature controller
unit as depicted in Figure 4.11(a) and the controllers are indicated in the PFD as TIC 102,
TIC 002, TIC 003 and TIC 202 as shown in Figure 4.10. The rig was also connected to
several Type-K thermocouples (TI-101, TI-001, TI-201 and TI-203), supplied by RS to
monitor and re-check the temperature along the line. Whilst TI-001 and TI-201
thermocouples were located outside the tube, TI101 and TI-203 were located inside the tube
to verify the actual temperatures in the tube line. Although there was no temperature profile
of the rig to be displayed here, it can be verified that the temperature reading was consistent
throughout the reaction and along the heated tube line. Therefore, it can be stated here that
the line was heated uniformly from the vaporiser to the inlet of the reactor tube. The heating
of the reactor tube was controlled by a Lenton tube furnace, however, it is unfortunate that no
thermocouple was located within the reactor tube to verify the actual operating temperature,
which can be 20-30 oC below the desired reaction temperature due to some temperature
gradient [5]. The pressure was constantly fixed at atmospheric pressure throughout the rig.

148
4.4.2 Catalyst Loading
A catalyst that had been already prepared was pelletized using a press machine (ATLAS
T25). The catalyst powder was filled into an evacuable pellet die of 20 mm diameter and
pressed at 10 bars. Next, these pelletised catalysts were crushed using a mortar and pestle and
covered with wet tissue to avoid inhalation. The catalyst was then sieved according to the
required size. The sieved catalyst was weighed accordingly to the required amount between 0
– 1000 mg. The weighed catalyst was diluted with silicon carbide (SiC) of specific size
(usually 750 microns) in a measuring cylinder to make up the intended catalyst bed volume,
i.e. either 5 or 10 cm3 bed volume.
The reactor tube of 500mm length and 12mm outer diameter size (10 mm i.d.) was pre-
divided into three sections. The bottom and the top part of the reactor were filled with pure
silica carbide (SiC). The catalyst with the diluent was placed in the middle section of the tube
and sealed by quartz wool.
4.4.3 Study of Mass and Heat Transfer Limitation
In order to achieve an ideal plug flow behaviour, the rule of thumb with regards to the length
of the catalyst bed (L), the inner diameter of the reactor tube (D), and the particle diameter
(Dp) were strictly followed, i.e. D/Dp ≥ 10 and for gas-solid systems, the catalyst bed length
should be at least 50 particles in diameter, L/Dp≥50 [5]. For the purpose of this doctoral
research, 750 microns of SiC was used as the largest particle present in the reactor tube and
based on this size, the calculated L/Dp was 66.7 and D/Dp=13.3, which satisfied both the
requirements. Integral operation was adopted here since glycerol steam reforming, for
example, is a complex multicomponent mixture of products, and, therefore, is difficult to
measure if differential operations are used [5]. Some calculations were employed to ensure
the requirements of acceptable kinetic test were fulfilled.
Reynolds number was used to determine the type of flow. Hence, equation (4.2) was applied
and this linked directly to the flow in the fixed bed reactor [6]:
(4.2)

149
Where
= density of mixture (oxygenate/inert gas/steam at respective temperature), g/cm3
= superficial velocity, cm/s
= particle diameter, cm
= dynamic viscosity of mixture, cm/(g.s)
= catalyst void fraction, calculated using this formula, [7]
The catalyst particle density was assumed to follow a normal particle density, which was set
at 2.65 g/cm3
[7],whereas the bulk density of Hi-FUEL, as given by the manufacturer’s
specification (which was assumed to be approximately similar for all other catalysts prepared
and NiAl(C)), was 0.95 g/cm3. The void fraction was calculated to be 0.36. Table 4.3 below
highlights the calculations for all the oxygenates at their respective vaporisation temperatures,
the required flow, and their Reynolds number in the gas phase.
Oxygenates Vaporisation
Temperature (oC)
Catalyst Particle
Size (dp, μm)
Reynolds
Number/ Re
Ethanol 200
450 2.1
300 1.4
106 0.5
Ethylene Glycol 300
450 1.8
300 1.2
106 0.4
Propylene Glycol 300
450 1.7
300 1.2
106 0.4
Glycerol 400
450 1.3
300 0.8
106 0.3
Table 4.3: Reynolds number of the homologues studied at different particle sizes

150
All of the physical properties related to the mixture ( were obtained via Aspen-
HYSYS. The Reynolds number shows that the flow was laminar in nature. By operating at a
smaller particle size, there was a huge tendency of pressure drop, as reported by Perego &
Peratello [5]. Therefore, the introduction of inert material of suitable size allowed good fluid
distribution and produced a low pressure drop. Alongside the tests, 750 microns size of silica
carbide was constantly used to limit the pressure drop and to increase the turbulence of the
flow. As a result, the Reynolds number improved as follows:
Oxygenates Reynolds Number / Re
Ethanol 3.5
Ethylene Glycol 3.0
Propylene Glycol 2.9
Glycerol 2.1
Table 4.4: Reynolds number after dilution with 750 microns size of SiC
The Schmidt number is a ratio of momentum diffusivity and mass diffusivity, and was
calculated using the following equation [8]:
(4.3)
The gas diffusivities of each oxygenate mixture, Dm was predicted via Fuller, Schettler, and
Giddings Correlation [7, 9]. As exhibited in the formula in equation 4.4, and taking into
account the oxygenates vaporisation temperatures, i.e. ethanol at 200 oC, ethylene glycol and
propylene glycol at 300 oC, and glycerol at 400
oC:
(
)
[ ∑ ∑
] (4.4)
Via nonlinear least-squares analysis, the empirical equation that gave the smallest standard
deviation to predict the values of a,b,c,d, g, and f is as follows:
(
)
[ ∑ ∑
]
(4.5)
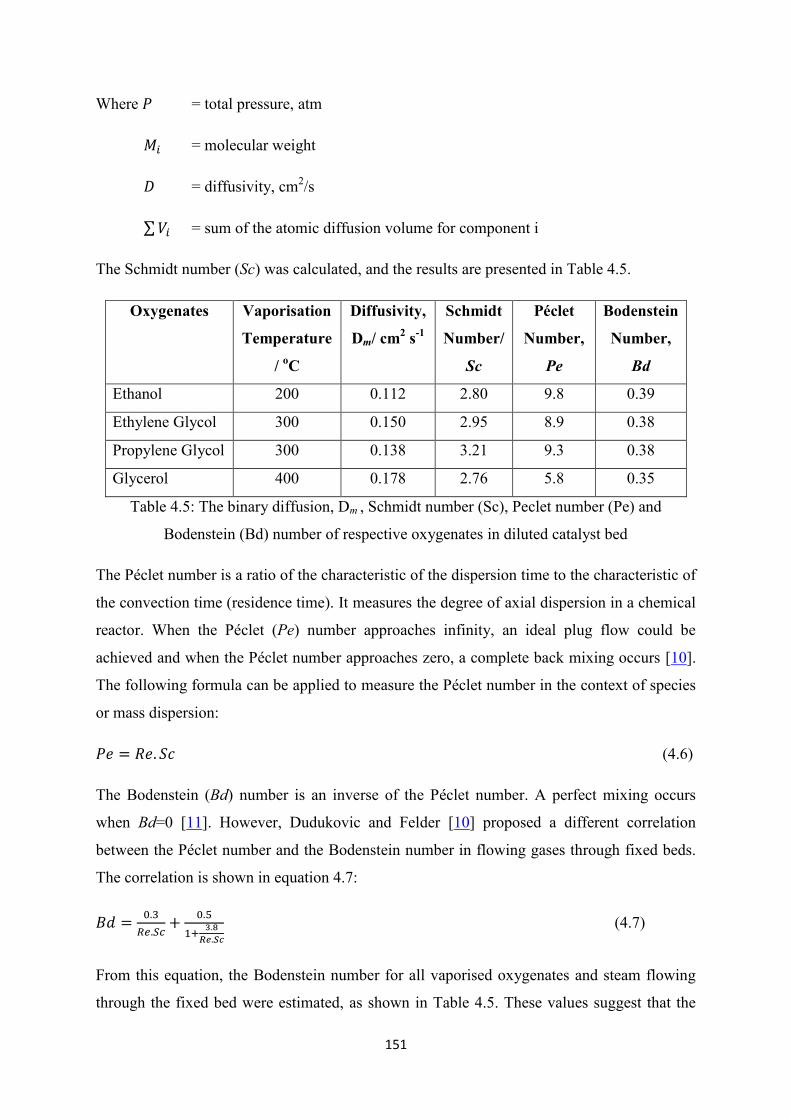
151
Where = total pressure, atm
= molecular weight
= diffusivity, cm2/s
∑ = sum of the atomic diffusion volume for component i
The Schmidt number (Sc) was calculated, and the results are presented in Table 4.5.
Oxygenates Vaporisation
Temperature
/ oC
Diffusivity,
Dm/ cm2 s
-1
Schmidt
Number/
Sc
Péclet
Number,
Pe
Bodenstein
Number,
Bd
Ethanol 200 0.112 2.80 9.8 0.39
Ethylene Glycol 300 0.150 2.95 8.9 0.38
Propylene Glycol 300 0.138 3.21 9.3 0.38
Glycerol 400 0.178 2.76 5.8 0.35
Table 4.5: The binary diffusion, Dm , Schmidt number (Sc), Peclet number (Pe) and
Bodenstein (Bd) number of respective oxygenates in diluted catalyst bed
The Péclet number is a ratio of the characteristic of the dispersion time to the characteristic of
the convection time (residence time). It measures the degree of axial dispersion in a chemical
reactor. When the Péclet (Pe) number approaches infinity, an ideal plug flow could be
achieved and when the Péclet number approaches zero, a complete back mixing occurs [10].
The following formula can be applied to measure the Péclet number in the context of species
or mass dispersion:
(4.6)
The Bodenstein (Bd) number is an inverse of the Péclet number. A perfect mixing occurs
when Bd=0 [11]. However, Dudukovic and Felder [10] proposed a different correlation
between the Péclet number and the Bodenstein number in flowing gases through fixed beds.
The correlation is shown in equation 4.7:
(4.7)
From this equation, the Bodenstein number for all vaporised oxygenates and steam flowing
through the fixed bed were estimated, as shown in Table 4.5. These values suggest that the
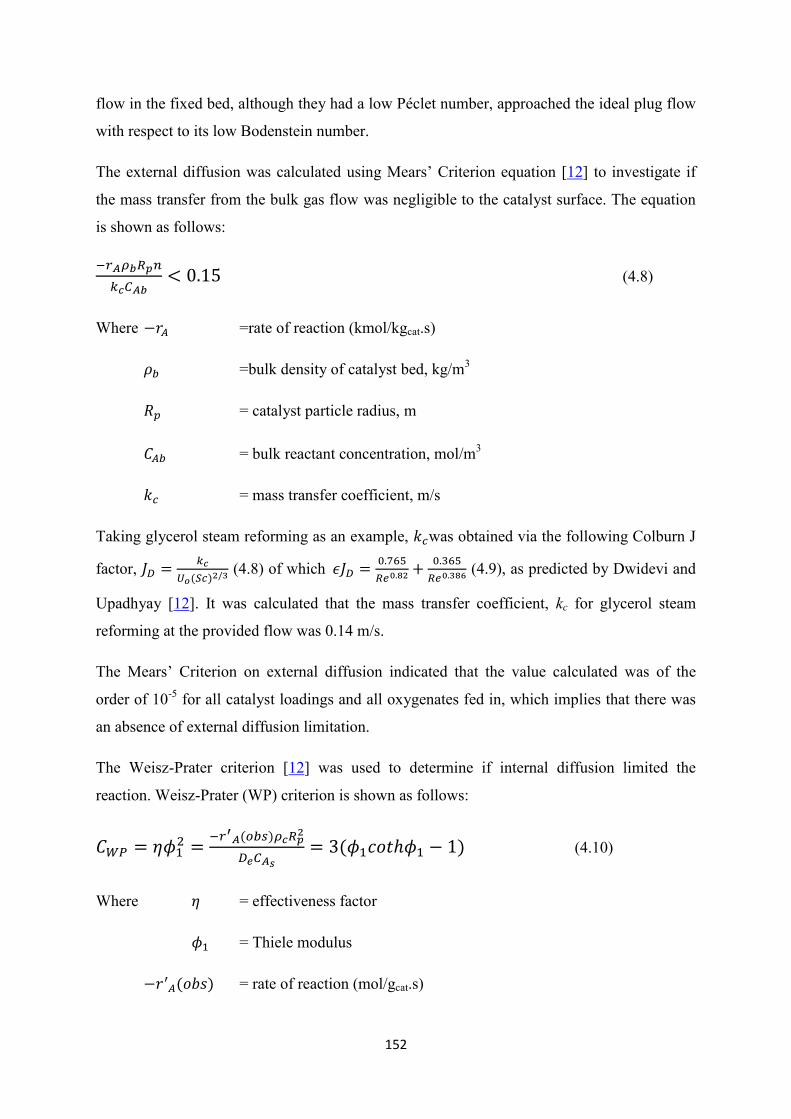
152
flow in the fixed bed, although they had a low Péclet number, approached the ideal plug flow
with respect to its low Bodenstein number.
The external diffusion was calculated using Mears’ Criterion equation [12] to investigate if
the mass transfer from the bulk gas flow was negligible to the catalyst surface. The equation
is shown as follows:
(4.8)
Where =rate of reaction (kmol/kgcat.s)
=bulk density of catalyst bed, kg/m3
= catalyst particle radius, m
= bulk reactant concentration, mol/m3
= mass transfer coefficient, m/s
Taking glycerol steam reforming as an example, was obtained via the following Colburn J
factor,
(4.8) of which
(4.9), as predicted by Dwidevi and
Upadhyay [12]. It was calculated that the mass transfer coefficient, kc for glycerol steam
reforming at the provided flow was 0.14 m/s.
The Mears’ Criterion on external diffusion indicated that the value calculated was of the
order of 10-5
for all catalyst loadings and all oxygenates fed in, which implies that there was
an absence of external diffusion limitation.
The Weisz-Prater criterion [12] was used to determine if internal diffusion limited the
reaction. Weisz-Prater (WP) criterion is shown as follows:
(4.10)
Where = effectiveness factor
= Thiele modulus
= rate of reaction (mol/gcat.s)

153
= density of the particle, g/cm3
= catalyst particle radius, cm
= reactant concentration at the catalyst surface, mol/cm3
= effective diffusivity = 0.1 x Dm
The acceptable criteria is that if CWP is << 1, there are no diffusion limitations and the other
way around if CWP>>1. However, was unknown, and, therefore, the only possibility was
by predicting the Thiele modulus based on two reaction rates observed from the two particle
sizes of 750 and 1100 microns, respectively, assuming that the was the same for both runs,
while other parameters were the same since they were tested under the same conditions.
Run Measured hydrogen rate (obs) /(mol/gcat.s) Particle radius (μm)
Run 1 4.82 x 10⁻⁵
375
Run 2 2.46 x 10⁻⁵
550
Table 4.6: Experimental data for Thiele Modulus calculations
The combination of two different runs led to the following equation:
(4.11)
Thiele modulus can be simplified as follows:
√
(4.12)
Combining both runs in equation 4.12, the following equation 4.13 is obtained:
(4.13)
Fitting in the radius for both,
(4.14)
The equation, which is presented in 4.11, was solved using the goal-seek function of
Microsoft Excel. The Thiele modulus for both runs were calculated as , and
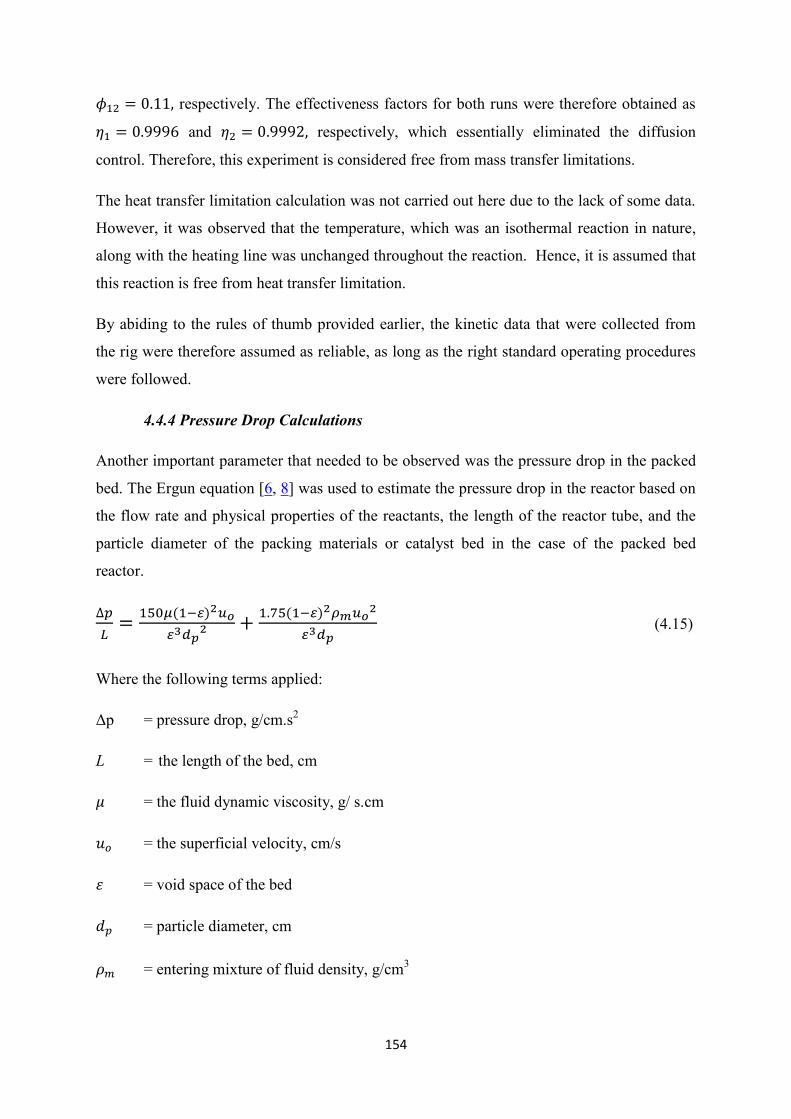
154
respectively. The effectiveness factors for both runs were therefore obtained as
and respectively, which essentially eliminated the diffusion
control. Therefore, this experiment is considered free from mass transfer limitations.
The heat transfer limitation calculation was not carried out here due to the lack of some data.
However, it was observed that the temperature, which was an isothermal reaction in nature,
along with the heating line was unchanged throughout the reaction. Hence, it is assumed that
this reaction is free from heat transfer limitation.
By abiding to the rules of thumb provided earlier, the kinetic data that were collected from
the rig were therefore assumed as reliable, as long as the right standard operating procedures
were followed.
4.4.4 Pressure Drop Calculations
Another important parameter that needed to be observed was the pressure drop in the packed
bed. The Ergun equation [6, 8] was used to estimate the pressure drop in the reactor based on
the flow rate and physical properties of the reactants, the length of the reactor tube, and the
particle diameter of the packing materials or catalyst bed in the case of the packed bed
reactor.
(4.15)
Where the following terms applied:
Δp = pressure drop, g/cm.s2
L = the length of the bed, cm
= the fluid dynamic viscosity, g/ s.cm
= the superficial velocity, cm/s
= void space of the bed
= particle diameter, cm
= entering mixture of fluid density, g/cm3

155
The calculations in this doctoral research were carried out for the most viscous and most
dense oxygenates, i.e. glycerol. Steams were also presented at the required steam to fuel ratio.
The void space of the bed followed the earlier calculation to predict the Reynolds Number,
which gave = 0.36. Various particle diameters were tested and the results from the Ergun
Equation calculations are shown in Table 4.7.
Length of the
bed, L/cm
Particle diameter,
dp/ cm Δp / g/cm.s2 Δp/ kPa
5
0.075 1472 0.15
0.050 3297 0.33
0.011 72798 7.28
10
0.075 2944 0.29
0.050 6593 0.66
0.011 145596 14.56
Table 4.7: The pressure drop calculations based on Ergun Equation
From Table 4.7, Figure 4.12 is presented to demonstrate the relationship between the particle
size, dp and the pressure drop according to the Ergun Equation in this reactor system. The
trends can be represented following the power law suggesting that as the particle size
increased and the bed length reduced, the pressure drop in the bed volume significantly
reduced. Therefore, by using silica carbide at 750 microns, the pressure drop may be reduced
far below 1 kPa.
Figure 4.12: Relationship of particle size and pressure drop in this study
y = 0.0008x-2.028 R² = 0.9999
y = 0.0015x-2.041 R² = 1
0
2
4
6
8
10
12
14
16
0 0.01 0.02 0.03 0.04 0.05 0.06 0.07 0.08
Pre
ssu
re d
rop
, kP
a
Particle size, cm
5cm
10 cm
Power (5cm)

156
4.4.5 Catalyst Reduction
The catalyst was required to undergo reduction once the reactor tube was installed in the rig.
This was carried out in-situ. Pure hydrogen (BOC, 99.99% purity), was supplied from the gas
cylinder at no more than 5 bars (set via pressure regulator at the cylinder) to the rig. The flow
was usually set at 75 ml/min. The vaporiser and other heating lines, as shown in Figure 4.10,
were always set at room temperature during the reduction process. The furnace was switched
on with the following programme:
i. The heating rate was set at 10 oC or 15
oC/min.
ii. The temperature was ramped up until 750 oC for typical Ni/Al catalyst.
iii. The time set for reduction at 750 oC was 1 hour.
iv. The temperature was ramped down at 20 – 30 oC/min after reduction to room
temperature (if the catalyst test to be conducted later) or to the intended reaction
temperature (if the catalyst test to be conducted immediately after reduction).
Once the programme was set and run, hydrogen was supplied immediately. The flow of
hydrogen remained until the catalyst test was conducted.
Once the catalyst was reduced and ready for the test, the heating line was ramped up from
200 to 400 oC, depending on the reactant used. As for ethanol, the heating line was set at 200
oC, for 1,2 propane diol (propylene glycol) and ethylene glycol it was 300
oC, and for
glycerol it was 400 oC. This was mainly to ensure that all the liquid phase reactants were fully
vaporised and for less fouling to occur throughout the heating line prior to reaching the
catalyst bed.
4.4.6 Catalyst Test
In the hydrogen flow (after the catalyst reduction), the furnace was set at an idle setting and a
new programme was set up, as follows:
i. Furnace heating was set at 10 oC/min
ii. The temperature was ramped up from 400 to 800 oC, depending on the intended
reaction temperature.
iii. The time set for the reaction at a constant temperature was from 4 to 10 hours,
depending on the variable tested.

157
iv. The temperature was ramped down from 20 to 30 oC/min to room temperature after
the catalyst test.
Once the furnace heater achieved the required reaction temperature and was still on hydrogen
flow, the syringe pump was switched on. The reactant, which was a mixture of DI water and
oxygenate at the required steam to fuel molar ratio, was supplied to the vaporiser. At that
point, hydrogen at 75 ml/min was still in the flow to avoid initial carbon deposition on the
catalytic surface.
After 10 minutes on hydrogen flow, nitrogen was supplied from the cylindrical tank at no
more than 5 bars according to the required volumetric percentage of inert required in the flow
throughout the vaporiser line. Usually, nitrogen was supplied at 30% v/v, with respect to the
total vapour flow in the system. Nitrogen acts as a carrier gas to bring the vaporised mixtures
to the reactor tube. After another 5 minutes, the hydrogen flow was switched off, and only
nitrogen was supplied throughout the reaction until the rig was completely shut off. The gas
hourly space velocity (GHSV), with respect to the catalyst bed volume, was always in the
range from 800 to 3000 cm3
gas flow/ cm3
catalyst bed.. This was calculated at atmospheric pressure
and a temperature range from 200 to 400 oC depending on the temperature of the vaporiser.
The GHSV was calculated as follows (excluding nitrogen flow):
(4.16)
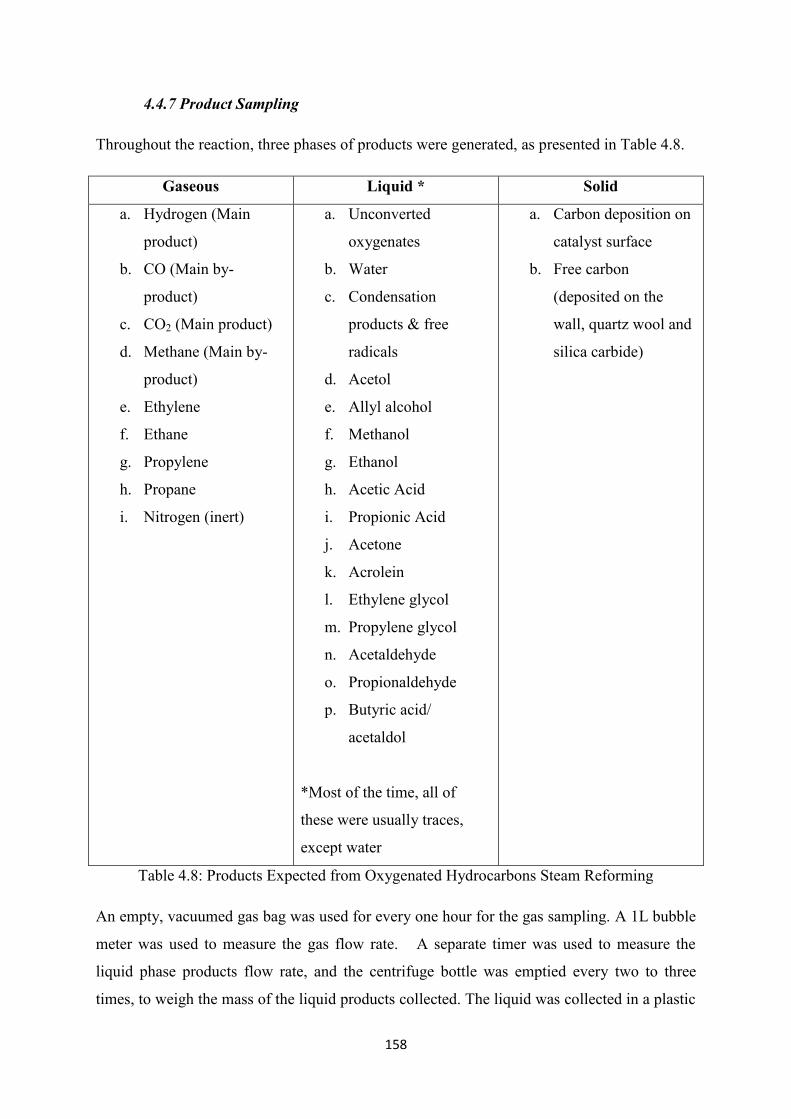
158
4.4.7 Product Sampling
Throughout the reaction, three phases of products were generated, as presented in Table 4.8.
Gaseous Liquid * Solid
a. Hydrogen (Main
product)
b. CO (Main by-
product)
c. CO2 (Main product)
d. Methane (Main by-
product)
e. Ethylene
f. Ethane
g. Propylene
h. Propane
i. Nitrogen (inert)
a. Unconverted
oxygenates
b. Water
c. Condensation
products & free
radicals
d. Acetol
e. Allyl alcohol
f. Methanol
g. Ethanol
h. Acetic Acid
i. Propionic Acid
j. Acetone
k. Acrolein
l. Ethylene glycol
m. Propylene glycol
n. Acetaldehyde
o. Propionaldehyde
p. Butyric acid/
acetaldol
*Most of the time, all of
these were usually traces,
except water
a. Carbon deposition on
catalyst surface
b. Free carbon
(deposited on the
wall, quartz wool and
silica carbide)
Table 4.8: Products Expected from Oxygenated Hydrocarbons Steam Reforming
An empty, vacuumed gas bag was used for every one hour for the gas sampling. A 1L bubble
meter was used to measure the gas flow rate. A separate timer was used to measure the
liquid phase products flow rate, and the centrifuge bottle was emptied every two to three
times, to weigh the mass of the liquid products collected. The liquid was collected in a plastic

159
centrifuge (50 ml standing centrifuge, Fisher), which was initially immersed in a beaker with
ice to ensure all the liquid products were trapped within.
4.4.8 Product Analysis
The gas and aqueous phase products analysis were carried out offline using separate gas
chromatography. The operation procedure of the GC followed the manufacturer’s manual and
guide. The gas products analysis was carried out using GC2014 (Shimadzu), which used a
carbon molecular sieve packed column and TCD detector with nitrogen as the carrier gas.
This was used to detect hydrogen, CO, CO2, and methane. A capillary column with FID
detector in helium flow was also used in the same GC in order to detect hydrocarbons, such
as methane, ethane, ethylene, propane, propylene, and other long chain hydrocarbon gases.
Analysis of the aqueous phase products was carried out using a different Shimadzu GC
(GC2014). This GC used a capillary column (FFAP) and a FID detector, and the helium acted
as the carrier gas. Approximately 1 g of the liquid sample was initially diluted in 40 g of
distilled water, together with less than 0.1 g of 1-Pentanol (Sigma-Aldrich). Approximately,
5ml of each of the diluted samples was poured into a GC vial and then injected into the GC
via an auto-injection mode.
4.4.9 Shutting Down Procedure
When the final sampling procedure was completed, the syringe pump was switched off first,
followed by the temperature controller of the vaporiser and other heating lines. The furnace
could be automatically or manually set to reduce to 100 oC at a cooling rate from
20 – 30 oC/min after a few hours’ operation, and, hence, the furnace could be safely switched
off. The nitrogen carrier supply was switched off and replaced with the nitrogen purge flow
between 30 minutes to 2 hours to completely remove any gas and reactants leftover in the
reactor. Once the tube had cooled down, the catalyst was removed from the reactor tube,
sieved from the SiC and quartz wool, and kept in a tight container for further analysis. The
reactor tube was regularly rinsed with acetone to remove any coke deposited on the tube wall
and was blown with air to clean the inner side of the tube and to remove the coke deposited
on the tube wall.

160
4.5 Conclusion
In general, it could be verified that the catalysts (both commercial and prepared catalysts) had
been prepared and characterised. The characterisations involved the identification of metal
loading (XRF spectroscopy), the interaction between the metals, the support and its
reducibility (TPR), the surface area (BET Analyser), and the morphological structure of the
catalysts (TEM and FESEM).
Some calculations were carried out to justify the rig was operated outside the heat and mass
transfer limitations conditions and that it was also operated at a tolerable pressure drop. This
would therefore, allow for a sensible data collection for future experiments. Some criteria
were followed as a rule of thumb, and all the tests showed that the rig, the chosen reactant
flow rates, and the particle sizes were sufficient for kinetic data collections.
The catalyst reduction procedures, reactor start-up, products sampling, and shut down
procedures of the rig were also highlighted with some adjustments to ensure the whole
operation was smooth, safe, and reliable.

161
4.6 References
[1] C. K. S. Choong, Z. Y. Zhong, L. Huang, Z. Wang, T. P. Ang, A. Borgna, J. Y. Lin,
L. Hong, and L. W. Chen, "Effect of calcium addition on catalytic ethanol steam
reforming of Ni/Al2O3: I. Catalytic stability, electronic properties and coking
mechanism," Applied Catalysis a-General, vol. 407, pp. 145-154, Nov 4 2011.
[2] M. V. Twigg, Catalyst Handbook: Manson Publishing, Limited, 1996.
[3] E. A. Sánchez, M. A. D'Angelo, and R. A. Comelli, "Hydrogen production from
glycerol on Ni/Al2O3 catalyst," International Journal of Hydrogen Energy, vol. 35,
pp. 5902-5907, 2010.
[4] J. Llopiz, M. M. Romero, A. Jerez, and Y. Laureiro, "Generalization of the Kissinger
Equation for Several Kinetic-Models," Thermochimica Acta, vol. 256, pp. 205-211,
Jun 1 1995.
[5] C. Perego and S. Peratello, "Experimental methods in catalytic kinetics," Catalysis
Today, vol. 52, pp. 133-145, Sep 14 1999.
[6] M. Rhodes, "Fluid Flow through a Packed Bed of Particles," in Introduction to
Particle Technology, ed: John Wiley & Sons, Ltd, 2008, pp. 153-168.
[7] C. K. Cheng, S. Y. Foo, and A. A. Adesina, "Steam reforming of glycerol over
Ni/Al2O3 catalyst," Catalysis Today, vol. 178, pp. 25-33, Dec 15 2011.
[8] G. F. Froment, K. B. Bischoff, and J. De Wilde, Chemical Reactor Analysis and
Design: Wiley, 2010.
[9] R. H. Perry and D. W. Green, Perry's Chemical Engineers' Handbook, Eighth
Edition: McGraw-Hill, 2008.
[10] M. P. D. R. M. Felder, "Mixing Effects in Chemical Reactor: III - Dispersion Model,"
in AIChE Modular Instruction Series E: Kinetics B. L. a. H. S. F. Crynes, Ed., ed
New York: AIChE, 1983, pp. 24-71.
[11] D. R. Woods, Rules of Thumb in Engineering Practice: Wiley, 2007.
[12] H. S. Fogler, Elements of Chemical Reaction Engineering: Pearson Education
Internat., 2006.

162
CHAPTER 5: STEAM REFORMING OF OXYGENATED
HYDROCARBON HOMOLOGUES OVER HI-FUEL CATALYSTS
5.1 Introduction
The thermodynamic equilibrium analysis of the homologues studied was demonstrated and
discussed previously in Chapter 3. In this chapter, it is vital to conduct several experiments
for the purpose of comparison. This is important to understand the performance of the
catalyst tested if the catalyst is active enough to achieve equilibrium at a shorter space-time
or if there is any significant inference that can be related to the activity of oxygenated
hydrocarbons reforming. The catalyst chosen for these tests is a commercial nickel catalyst,
known as Hi-FUEL R110 (Hi-FUEL). This catalyst is developed by Alfa Aesar for the
purpose of natural gas reforming. All the characterisation properties of this catalyst are
discussed in Chapter 4.
5.2 Experimental Setup and Calculations
The reduction of Hi-FUEL was carried out in-situ, as mentioned in Chapter 4. The heating
was provided for the vaporiser according to the type of reactants: 200 oC for ethanol, 300
oC
for ethylene glycol and propylene glycol, and 400 oC for glycerol to ensure complete
vaporisation of the reactants. The duration for each trial was set for 4 hours, not including the
start-up and shutdown durations.
The following expressions were used to simplify the comparisons of the results between the
experimental and the simulation studies. These calculations on the formulations used were
consistent with the simulation studies, as highlighted in Chapter 3.
(5.1)
(5.2)
∑
(5.3)
⁄
(5.4)
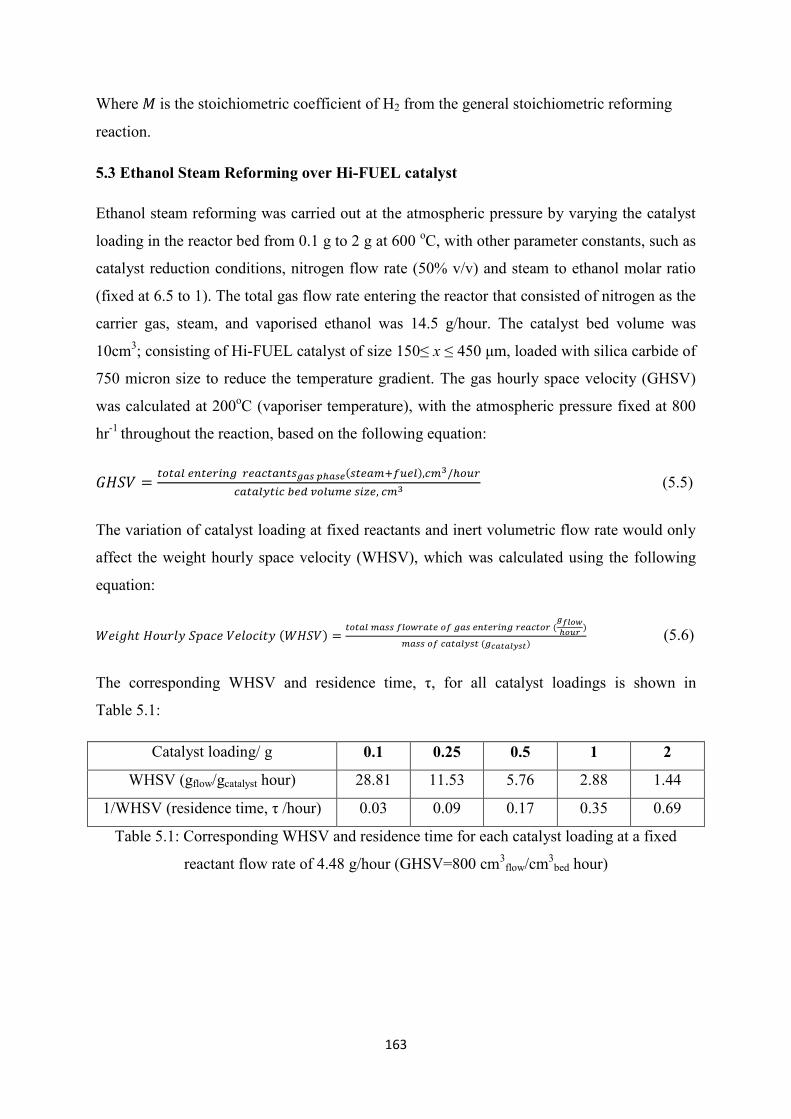
163
Where is the stoichiometric coefficient of H2 from the general stoichiometric reforming
reaction.
5.3 Ethanol Steam Reforming over Hi-FUEL catalyst
Ethanol steam reforming was carried out at the atmospheric pressure by varying the catalyst
loading in the reactor bed from 0.1 g to 2 g at 600 oC, with other parameter constants, such as
catalyst reduction conditions, nitrogen flow rate (50% v/v) and steam to ethanol molar ratio
(fixed at 6.5 to 1). The total gas flow rate entering the reactor that consisted of nitrogen as the
carrier gas, steam, and vaporised ethanol was 14.5 g/hour. The catalyst bed volume was
10cm3; consisting of Hi-FUEL catalyst of size 150≤ x ≤ 450 μm, loaded with silica carbide of
750 micron size to reduce the temperature gradient. The gas hourly space velocity (GHSV)
was calculated at 200oC (vaporiser temperature), with the atmospheric pressure fixed at 800
hr-1
throughout the reaction, based on the following equation:
(5.5)
The variation of catalyst loading at fixed reactants and inert volumetric flow rate would only
affect the weight hourly space velocity (WHSV), which was calculated using the following
equation:
(5.6)
The corresponding WHSV and residence time, τ, for all catalyst loadings is shown in
Table 5.1:
Catalyst loading/ g 0.1 0.25 0.5 1 2
WHSV (gflow/gcatalyst hour) 28.81 11.53 5.76 2.88 1.44
1/WHSV (residence time, τ /hour) 0.03 0.09 0.17 0.35 0.69
Table 5.1: Corresponding WHSV and residence time for each catalyst loading at a fixed
reactant flow rate of 4.48 g/hour (GHSV=800 cm3
flow/cm3
bed hour)
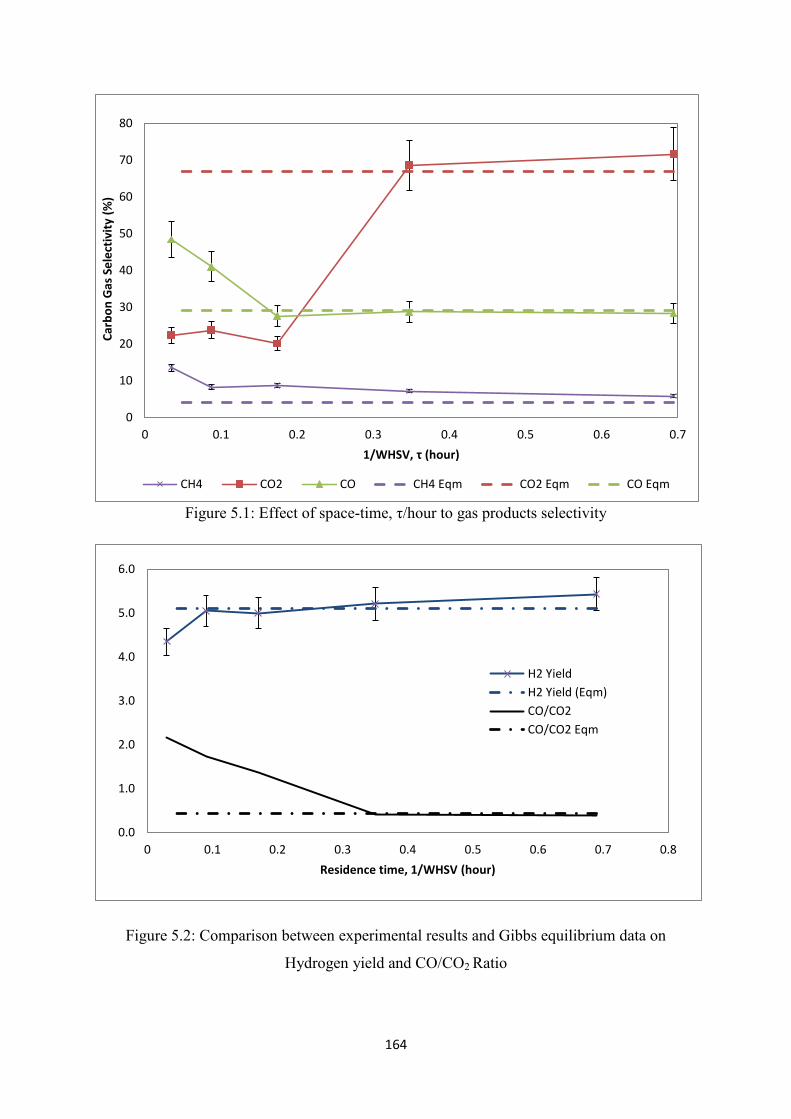
164
Figure 5.1: Effect of space-time, τ/hour to gas products selectivity
Figure 5.2: Comparison between experimental results and Gibbs equilibrium data on
Hydrogen yield and CO/CO2 Ratio
0
10
20
30
40
50
60
70
80
0 0.1 0.2 0.3 0.4 0.5 0.6 0.7
Car
bo
n G
as S
ele
ctiv
ity
(%)
1/WHSV, τ (hour)
CH4 CO2 CO CH4 Eqm CO2 Eqm CO Eqm
0.0
1.0
2.0
3.0
4.0
5.0
6.0
0 0.1 0.2 0.3 0.4 0.5 0.6 0.7 0.8
Residence time, 1/WHSV (hour)
H2 Yield
H2 Yield (Eqm)
CO/CO2
CO/CO2 Eqm
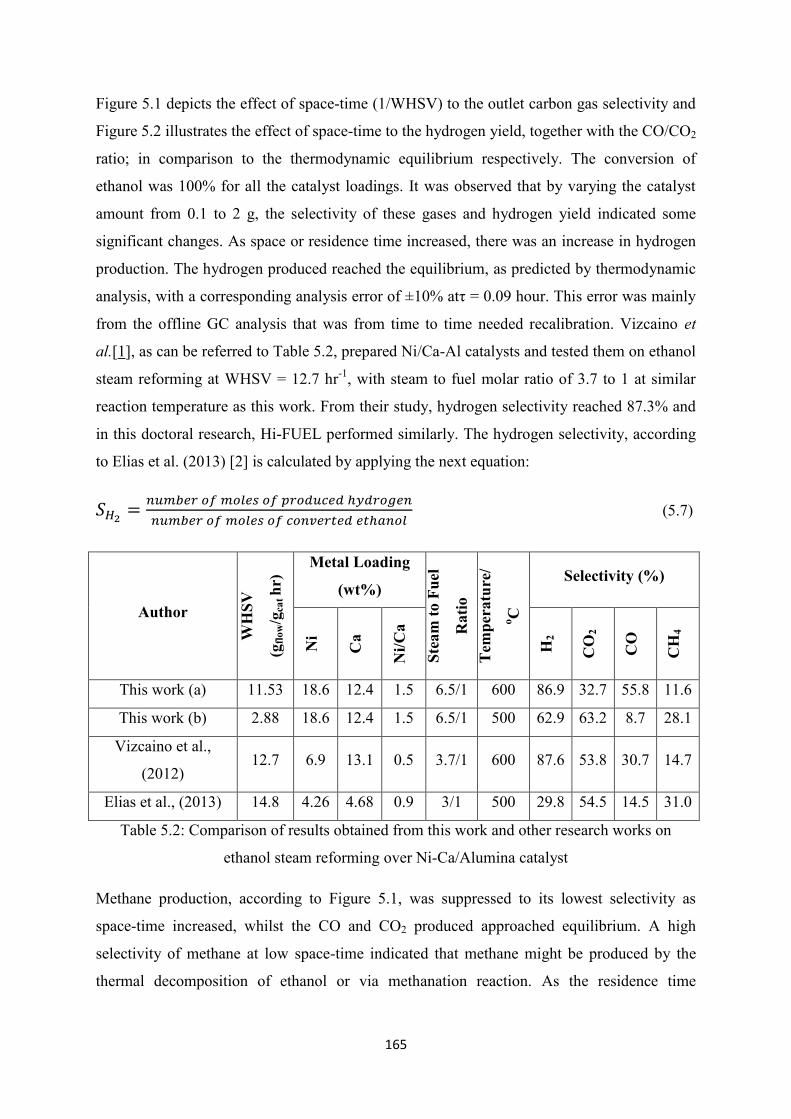
165
Figure 5.1 depicts the effect of space-time (1/WHSV) to the outlet carbon gas selectivity and
Figure 5.2 illustrates the effect of space-time to the hydrogen yield, together with the CO/CO2
ratio; in comparison to the thermodynamic equilibrium respectively. The conversion of
ethanol was 100% for all the catalyst loadings. It was observed that by varying the catalyst
amount from 0.1 to 2 g, the selectivity of these gases and hydrogen yield indicated some
significant changes. As space or residence time increased, there was an increase in hydrogen
production. The hydrogen produced reached the equilibrium, as predicted by thermodynamic
analysis, with a corresponding analysis error of ±10% atτ = 0.09 hour. This error was mainly
from the offline GC analysis that was from time to time needed recalibration. Vizcaino et
al.[1], as can be referred to Table 5.2, prepared Ni/Ca-Al catalysts and tested them on ethanol
steam reforming at WHSV = 12.7 hr-1
, with steam to fuel molar ratio of 3.7 to 1 at similar
reaction temperature as this work. From their study, hydrogen selectivity reached 87.3% and
in this doctoral research, Hi-FUEL performed similarly. The hydrogen selectivity, according
to Elias et al. (2013) [2] is calculated by applying the next equation:
(5.7)
Author
WH
SV
(gfl
ow/g
cat h
r)
Metal Loading
(wt%)
Ste
am
to F
uel
Rati
o
Tem
per
atu
re/
oC
Selectivity (%)
Ni
Ca
Ni/
Ca
H2
CO
2
CO
CH
4
This work (a) 11.53 18.6 12.4 1.5 6.5/1 600 86.9 32.7 55.8 11.6
This work (b) 2.88 18.6 12.4 1.5 6.5/1 500 62.9 63.2 8.7 28.1
Vizcaino et al.,
(2012) 12.7 6.9 13.1 0.5 3.7/1 600 87.6 53.8 30.7 14.7
Elias et al., (2013) 14.8 4.26 4.68 0.9 3/1 500 29.8 54.5 14.5 31.0
Table 5.2: Comparison of results obtained from this work and other research works on
ethanol steam reforming over Ni-Ca/Alumina catalyst
Methane production, according to Figure 5.1, was suppressed to its lowest selectivity as
space-time increased, whilst the CO and CO2 produced approached equilibrium. A high
selectivity of methane at low space-time indicated that methane might be produced by the
thermal decomposition of ethanol or via methanation reaction. As the residence time

166
increased, the methane underwent steam reforming due to the increase in catalytic activity on
the catalyst surface.
The closest comparison that could be made with this work is that of Vizcaino et al. [1], in
which they varied the ternary mixed oxides of nickel catalyst; one of the prepared catalysts is
Ni-Ca/Al2O3 with the ratio of Ni/Ca = 0.5. The results are shown in Table 5.2. Vizcaino et al.
also suggested that methane was kept to a minimum with the presence of
Ni-Ca. However, the ratio of Ni/Ca may have an effect on CO and CO2 production at 600 oC.
At a higher calcium loading ratio, as in the work of Vizcaino et al., it was more likely that
CO2 was produced but with a high nickel loading ratio, as referred to in this work, more CO
was produced; a water-gas shift. This is further proven in Figure 5.2, whereby as the contact
time increased, a higher calcium loading per catalyst bed volume was introduced, and, hence,
the CO/CO2 ratio was closer to the equilibrium.
It was found that in the aqueous phase analysis, there were traces of ethanol, methanol, and
acetaldehyde in 0.1g catalyst loading, while there were none in the 0.25 g catalyst loading
and above. This indicated that the catalyst followed the pathway, as suggested by
Wang et al. [2, 3], whereby ethanol was dehydrogenated and produced acetaldehyde.
However, due to insufficient contact of reactant with the catalyst, acetaldehyde, instead of
undergoing steam reforming, might undergo decomposition or hydrogenation that produced
methane, methanol, and carbon monoxide, as follows:
(5.7)
(5.8)
(5.9)
The above reactions (equations 5.7 to 5.9) were postulated to justify the presence of high
methane and CO selectivity at low contact time based on Figure 5.1, as supported by the
CO/CO2 ratio in Figure 5.2. In addition, by referring to Figure 5.3, the equilibrium of
methane was achieved at this reaction temperature.

167
A further comparison was made between ethanol steam reforming conducted at 500 and
600 oC, with other parameters remaining the same. Figure 5.3 demonstrates the outlet gas
selectivity at both temperatures, and Figure 5.4 depicts the H2 yield and CO/CO2 ratio; both
were compared to the thermodynamic equilibrium.
Figure 5.3: Carbon Gas Products Selectivity
of Ethanol Steam Reforming via Hi-FUEL at
500 and 600 oC
Figure 5.4: CO/CO2 Ratio and H2 Yield of
Ethanol Steam Reforming via Hi-FUEL at
500 and 600 oC
The tests were loaded with 1000mg Hi-FUELdiluted in silica carbide at WHSV of 2.88 hr-1
.
At both temperatures and similar WHSV, the Hi-FUEL reached the equilibrium based on the
earlier prediction. At 500 oC, the water-gas shift reaction was active [4]; hence, CO was
suppressed and converted to CO2 and H2. This can also be reflected from Figure 5.4 on the
CO/CO2 ratio. The work reported by Elias et al. [5] with Ni/Ca = 0.91 at a similar
temperature but shorter space-time, suggested that, at 500 oC, the ethanol conversion reached
99% for impregnated 5Ca-5Ni/Al, and 29.8% for hydrogen selectivity. They also suggested
that as calcium loading increased from 0 to 5wt%, the amount of ethylene, as a side product
due to the acidity of alumina, was reduced from 0.59 mol of ethylene produced/mol of
ethanol consumed to nil at 5wt% of calcium. Similarly, it was observed in the Hi-FUEL
catalyst, as there was no ethylene produced at all data points. It is therefore assumed that
nickel is an active metal that enables the decomposed reactants to convert into hydrogen;
hence, the higher nickel loading would lead to higher hydrogen selectivity, while calcium
prevented dehydration on the alumina acidic site.
0
10
20
30
40
50
60
70
80
90
100
500 600
Car
bo
n G
as S
ele
ctiv
ity
(%)
Temperature / oC
CH4 CH4 (eqm) CO2 CO2 (eqm) CO CO (eqm)
0
1
2
3
4
5
6
500600
0.1 0.4
0.2 0.4
3.8
5.2
3.7
5.1
Temperature/ oC
CO/CO2 CO/CO2 (eqm) H2 Yield H2 Yield (eqm)

168
0
10
20
30
40
50
60
70
80
90
100
500 600
Sele
ctiv
ity
(%)
Temperature / oC
CH4 CH4 (eqm) CO2 CO2 (eqm) CO CO (eqm)
0
1
2
3
4
5
500600
0.2 0.3
0.1 0.3
2.9
4.5
3.7
4.4
Temperature
CO/CO2 CO/CO2 (eqm) H2 Yield H2 Yield (eqm)
5.4 Ethylene Glycol and Propylene Glycol Steam Reforming over Hi-FUEL catalyst
Apart from ethanol, ethylene glycol and propylene glycol were tested at similar temperatures,
with WHSV of 5 and 4.9 hr-1
, respectively. To prepare a 10cm3
catalyst bed, 1000 mg of Hi-
FUEL was diluted in Silica Carbide and loaded into the reactor tube. This is equivalent to
GHSV of 975 hr-1
and 942 hr-1
, respectively, calculated at 300 oC and atmospheric pressure.
Figure 5.5 illustrates the outlet gas selectivity from ethylene glycol steam reforming over
Hi-FUEL at 500 and 600 oC, followed by Figure 5.6 on the H2 yield and CO/CO2 ratio from
ethylene glycol steam reforming activity. All the experimental results were compared against
the thermodynamic equilibrium.
Figure 5.5: Carbon Gas Products Selectivity
of Ethylene Glycol Steam Reforming over
Hi-FUEL at 500 and 600 oC
Figure 5.6: CO/CO2 Ratio and H2 Yield of
Ethylene Glycol Steam Reforming over
Hi-FUEL at 500 and 600 oC
Ethylene glycol was converted 100% to other components at both temperatures. It was
obvious that in ethylene glycol steam reforming, as shown in Figure 5.5, the reaction reached
equilibrium at 600 oC,
but the hydrogen yield was lower compared to the expected
equilibrium value at 500 oC. In ethylene glycol steam reforming, the trace components
present in the liquid phase were acetaldehyde, ethanol, and acetic acid. Acetaldehyde was a
major trace component in the liquid product and might be produced from the homogenous
dehydration reaction, as suggested by Dauenhauer et al. and Kechagiopolous et al. [6, 7]. The
presence of ethanol may result from the hydrogenation of ethylene glycol. Acetic acid was

169
detected, but the peak observed in GC was very small, since acetic acid was converted into
other components. The possible reaction schemes are shown as follows:
(5.10)
(EG) (Acetaldehyde)
(5.11)
(EG) (Ethanol)
(5.12)
(Acetaldehyde)
(5.13)
(EG) (Acetic Acid)
With regard to the production of methane, apart from acetaldehyde decomposition, methane
might also be produced by the methanation reaction, which is exothermic in nature
(ΔH298K = -206 kJ/mol). The methanation reaction is shown as in equation (5.14), as follows:
(5.14)
However, it was postulated that as the catalyst loading increased and steam reforming was an
endothermic reaction, it might become reversible as this catalytic activity favoured
endothermic reactions that largely governed the steam reforming reactions. This is applied to
all oxygenates that undergo steam reforming. Alternatively, methane may also undergo steam
reforming.
(5.15)
It was observed that, similar to ethanol, ethylene glycol is a short oxygenated hydrocarbon
molecule compared to propylene glycol and glycerol. Thus, both components (ethanol and
ethylene glycol) were less likely to cause other potential major reactions other than steam
reforming, dehydrogenation, thermal / homogeneous decomposition and dehydration, hence

170
the intermediate elements were predictable. Christiansen and Vlachos [8] investigated the Pt-
catalysed ethylene glycol steam reforming and modelled the micro kinetic of the process.
They found that via platinum catalyst, ethylene glycol steam reforming was kinetically
equivalent to catalytic pyrolysis of ethylene glycol without the presence of steam, with small
contributions from the water-gas shift reaction. Nevertheless, the early dehydrogenation
reaction steps controlled the reaction rate. Similar findings were reported by Kechagiopolous
et al. [6, 9] on ethylene glycol reforming over nickel/olivine catalyst. They demonstrated that
the major intermediate of the reforming reaction was acetaldehyde, whereby acetaldehyde
underwent thermal decomposition to produce methane and CO. Methane was predicted to
undergo steam reforming, while CO would undergo the water-gas shift reaction.
To date, there has been no research on propylene glycol steam reforming, and, thus, a
preliminary screening was carried out to study the feasibility of this process. Figures 5.7 and
5.8 depict similar results, as highlighted in Figures 5.5 and 5.6, but for propylene glycol
steam reforming activity over Hi-FUEL. The experimental results were compared with the
simulation results.
Figure 5.7: Carbon gas products selectivity of
propylene glycol steam reforming over Hi-
FUEL at 500 and 600 oC
Figure 5.8: CO/CO2 ratio and h2 yield of
propylene glycol steam reforming over
Hi-FUEL at 500 and 600 oC
It was observed that Hi-FUEL catalyst, as tested in propylene glycol steam reforming, was
not as active as in ethanol steam reforming in producing hydrogen. The tests at both
temperatures suggested that the hydrogen yield in experimental work was lower compared to
0
10
20
30
40
50
60
70
80
90
100
500 600
Sele
ctiv
ity
(%)
Temperature / oC
CH4 CH4 (eqm) CO2 CO2 (eqm) CO CO (eqm)
0
1
2
3
4
5
6
7
500600
0.3 0.9
0.2 0.5
3.2
5.7
5.1
6.7
Temperature/ oC
CO/CO2 CO/CO2 (eqm) H2 Yield H2 Yield (eqm)

171
Gibbs thermodynamic equilibrium predictions. It could be agreed that propylene glycol steam
reforming is to be operated at 600 oC, as, at this temperature, the Hi-FUEL promoted higher
hydrogen selectivity, as well as lower methane selectivity; evidenced by both simulation and
experimental work, as shown in Figure 5.7. The reforming activity might be inhibited by the
presence of other major side reactions, such as hydrogenation and methanation, hence
reducing the hydrogen yield.
From the liquid phase analysis, traces of methanol, ethanol, 1-propanol, 2-propanol, and
acetaldehyde were observed. 1-propanol and 2-propanol were assumed to be formed via
hydrogenation of propylene glycol, whereby that was a possible reaction, as reported by
many works on glycerol valorisation [10-14], and this is further discussed in Chapter 6. The
hydrogenation reaction schemes that were proposed are as follows:
(5.15)
(PG) (2-Propanol)
(5.16)
(PG) (1-Propanol)
The production of ethanol, methanol, and acetaldehyde may result from the decomposition of
propylene glycol, as follows:
(5.17)
(PG) (Ethanol)
(5.18)
(PG) (Methanol) (Acetaldehyde)

172
All of these intermediates were traced as the operating temperature was high and the contact
time was long enough to convert all the intermediates into the end products. In order to study
the reaction pathway, further experiments should be carried out at a lower space-time to
identify and quantify the intermediates of the reaction.
5.5 Glycerol Steam Reforming over Hi-FUEL catalyst
Glycerol steam reforming was experimented at 500 and 600 oC, with a fixed steam to
glycerol ratio of 8.1 to 1. Only a few studies and comparisons are highlighted in this section,
whereas the remaining is discussed in Chapters 6 and 7. The experimental results, as
compared to the results obtained from the Aspen-HYSYS, are shown in Figures 5.9 and 5.10,
respectively.
Figure 5.9: Carbon gas products selectivity of
glycerol steam reforming over Hi-FUEL at
500 and 600 oC
Figure 5.10: CO/CO2 ratio and h2 yield of
glycerol steam reforming over Hi-FUEL at
500 and 600 oC
Figure 5.9 depicts the outlet carbon gas selectivity. Considering the margin of selectivity
error of ±10%, hydrogen produced from glycerol steam reforming over Hi-FUEL catalyst at
500 oC was lower as what could be possibly obtained. Hydrogen selectivity at 600
oC
improved only due to the thermodynamic nature, but it was far from the equilibrium value.
However, water-gas shift reaction was efficient at 500 oC by referring to its CO/CO2 ratio.
Without including the carbon formation in the total mass balance, the total carbon balance for
both tests was within 70 – 80%, which suggested that there were possibilities of other
0
10
20
30
40
50
60
70
80
90
100
500 600
Sele
ctiv
ity
(%)
Temperature / oC
CH4 CH4 (eqm) CO2 CO2 (eqm) CO CO (eqm)
0
1
2
3
4
5
6
500600
0.0 0.6
0.11 0.35
2.9
3.9
4.1
5.8
Temperature/ oC
CO/CO2 CO/CO2 (eqm) H2 Yield H2 Yield (eqm)

173
reactions to take place that would lead to coke formation on the catalyst surface. This is
discussed in detail in Chapter 8.
Two bed volumes were compared at fixed reactant flow rates, i.e. 10cm3 and 5cm
3, with
GHSV of 1110 hr-1
and 2220 hr-1
, respectively. The volumetric ratio of silica carbide to the
catalyst was fixed at 9:1, and, therefore, the WHSV for 10cm3 bed was 5.24 (g reactant flow/ g
catalyst hour), and 10.48 (g reactant flow/ g catalyst hour) for 5cm3 bed volume, respectively. Figures
5.11 and 5.12 demonstrate the outlet gas selectivity and hydrogen yield for both catalyst bed
volumes at 500 and 600 oC, respectively.
Figure 5.11: Hydrogen yield and carbon gas
products selectivity for two different bed
volumes/ghsv of glycerol steam reforming
over Hi-FUEL at 500 oC
Figure 5.12: Hydrogen yield and carbon gas
products selectivity for two different bed
volumes/ghsv of glycerol steam reforming
over Hi-FUEL at 600 oC
Figures 5.11 and 5.12 demonstrate that there was a significant difference on product
selectivity for 5 and 10 cm3 bed volumes. Although the bed volume and the catalyst loading
was halved ,which also reduced the contact time between the reactant and the catalyst’s bed,
the effect of dilution was also important apart from avoiding the heat and mass transfer
limitation. The more diluted the catalyst bed, the greater the tendency for non-catalytic
activities to happen in the bed itself, hence lowering the selectivity of the required products.
This was also possible due to the higher pressure drop in the longer catalyst bed. By doubling
the bed volume, i.e. by doubling the pressure drop at the fixed heat inlet flow, in that respect
there was a temperature gradient, and hence, the intended reaction temperature could not be
achieved. In this experimental work, the heat supply was always fixed to achieve the required
temperature and therefore, by having a larger pressure drop, the reactor tube temperature may
not achieve the required temperature. A limitation in this experiment is that although it was
0
20
40
60
80
100
H2 CO2 CO CH4
H2
yie
ld, C
arb
on
Gas
Se
lect
ivit
y (%
)
1110 /hr
2220/hr
Equilibrium
0
20
40
60
80
100
H2 CO2 CO CH4
H2
yie
ld, c
arb
on
gas
ele
ctiv
ity
(%) 1110/hr
2220/hr
Equilibrium

174
suspected that there was a temperature gradient, the actual reactor’s temperature could not be
observed due to the absence of an internal thermocouple to measure the temperature of the
reactor bed. However, the heat requirement to maintain the desired reaction temperature was
controlled by the tube furnace (Lenton with Eurotherm display). If there was a temperature
gradient due to the pressure drop, the controller would automatically supply more heat to
sustain the temperature. It was assumed that the furnace supplied extra heat to maintain the
desired reaction temperature for the 10cm3 bed compared to the 5cm
3 bed. However, the
pressure dropped, and, hence, the temperature gradient was not an issue in this study. This
was proven earlier by the calculation from the Ergun equation in Chapter 4, whereby the
pressure drop was less than 1kPa for both bed volumes and the presence of silicon carbide
(SiC) as diluent reduced the temperature gradient and pressure drop, as supported by Perego
and Peratello [15].
In this scenario, the selectivity of all the products was therefore lower than predicted. By
comparing both bed volumes to the simulation studies, it is suggested that an efficient
catalytic study could be achieved with a small catalyst bed volume. In return, this would give
two main benefits: i) reduced amount of catalyst tested to achieve similar or better results,
and ii) reduced non-catalytic activity within the bed itself. Therefore, from the next chapter
onwards, the catalyst bed volume was fixed at 5cm3.
5.6 The Water-gas shift Reaction Test over Hi-FUEL catalyst
By calculating the CO/CO2 ratio from the previous oxygenated hydrocarbon steam reforming
activities, it would give a rough estimation on the efficiency of the water-gas shift reaction
with a specific temperature over the Hi-FUEL catalyst. From the previous sections, the values
of CO/CO2 ratio from the steam reforming activities of all oxygenates were at a minimum at
500 oC. This was assumed due to the water-gas shift reaction activity. In this section, some
tests were carried out to verify the postulation of whether the Hi-FUEL was able to promote
the water-gas shift reaction.
The reactor was supplied with 10% v/v CO in Argon flow together with steam, at a steam to
CO ratio of 2 to 1. The total flow of CO and Argon was 16000 cm3/hour and nitrogen was
also supplied as a carrier gas at the rate of 5050 cm3/hour. Steam was vaporised at 200
oC
prior to entering the reactor. Initially, the water-gas shift reaction was conducted as a blank

175
test, i.e. without any catalyst present, but only with the presence of SiC, making up the 5cm3
bed volume. The water-gas shift reaction was conducted at 400, 500, and 600 oC and the
results are shown in Table 5.3:
Temperature/ oC CO Conversion (%) H2 Yield
400 1.14 0.00
500 19.52 0.01
600 10.84 0.00
Table 5.3: CO Conversion and H2 yield in blank test of water-gas shift reaction
By referring to Table 5.3, without the presence of catalyst, the water-gas shift reaction was
considered inactive, and, therefore, the CO conversion was very poor. In addition, the CO2
yield at all temperatures tested was unable to be quantified as it was only in trace amounts.
Hi-FUEL was later introduced at the two temperatures tested, i.e. 500 and 600 oC, in which
35 mg of Hi-FUEL was loaded into the reactor tube for each test, making up the total GHSV
of
⁄
and WHSV of
⁄
, equivalent to 22 seconds of
residence time. Table 5.4 depicts the results of the respective tests.
Temperature/ oC CO Conversion (%) H2 Yield CO2 Yield
500 47.90 0.28 0.43
600 19.04 0.05 0.10
Table 5.4: CO conversion, H2 yield, and CO2 yield of the water-gas shift reaction in the
presence of Hi-FUEL catalyst
The carbon balance for both tests was more than 90%. It can be noted from Table 5.4 and
compared with Table 5.3, that the presence of Hi-FUEL catalyst promoted higher CO
conversion and improved H2 and CO2 yields even at low catalyst loading. This test agreed
with the thermodynamic finding, in which, at 500 oC, the water-gas shift reaction was active,
hence confirming the postulation made earlier concerning the steam reforming of all
oxygenates. This also confirmed the ability of Hi-FUEL in promoting the water-gas shift
reaction at respective temperatures. Nickel metal in the catalyst, as reported by Cheng et al.
[16] in their work concerning steam reforming of glycerol via Ni/Al2O3, provides dissociative
chemisorption of steam, hence allowing water-gas shift reaction to take place, which is likely
similar to the Hi-FUEL catalyst.

176
5.7 Conclusion
The homologues of ethanol to glycerol have provided some interesting feedstock to be
studied on the undergoing reforming for hydrogen or syngas production. The motivation to
use these fuels is due to the possibility of producing them sustainably. While ethanol can be
produced via cellulosic compounds, glycerol can possibly be obtained from biodiesel
production, whilst ethylene glycol and propylene glycol can be found in pyrolysis oil (bio-
oil). However, in this study, both components acted as ‘structural fill-up’ of ethanol to
glycerol homologues of poly-ols. The ability to convert these reactants into usable fuels was
therefore proven over a commercial nickel catalyst.
Ethanol steam reforming over Hi-FUEL catalyst was studied by varying the catalyst loading
at 600 oC. The catalyst was also examined at different temperatures and it was established
that the catalyst that was usually utilized for natural gas reforming; was also capable of
helping the ethanol steam reforming process achieve its highest possible hydrogen yield. The
water-gas shift reaction was also active at the expected reaction temperature in the presence
of Hi-FUEL.
Similarly, with ethylene glycol steam reforming, Hi-FUEL assisted in reaching equilibrium at
similar catalyst loading with other oxygenates and this was comparable to the one predicted
by Aspen-HYSYS. Both ethanol and ethylene glycol had acetaldehyde as their intermediates,
suggesting that acetaldehyde underwent steam reforming to produce H2 and CO2. At 500 oC,
methanation was highly possible, but a reverse effect occurred at a higher temperature. A
similar pathway was reported by other researchers.
Propylene glycol steam reforming, otherwise, had a lower catalytic activity compared to what
was predicted via the simulation study. Although the conversion was completed, the traces of
the intermediates obtained suggested that there were other competing reactions that took
place, such as hydrogenation and methanation that used up the produced hydrogen.
Glycerol steam reforming also exhibited similar trends to propylene glycol steam reforming.
Hydrogenolysis was expected to be another dominant reaction via this catalyst, hence,
reducing hydrogen selectivity, and this is further proven in the next chapter. Evidently, it can
be concluded that the bigger the value of x and z from the expression of hydrocarbon with
CxHyOz on Hi-FUEL catalyst, the selectivity of hydrogen is further lowered in comparison to
the equilibrium.

177
The effect of catalyst dilution was studied by comparing the products’ selectivity of glycerol
steam reforming using two catalyst bed volumes at two reaction temperatures, i.e. 5 and
10 cm3 at 500 and 600
oC. Silica carbide is important in diluting the catalyst to ensure no
temperature gradient throughout the reactor tube. Nevertheless, a large catalyst bed volume
will reduce the effectiveness of the catalytic activity as there is a possibility of other non-
catalytic side reactions to occur within the catalyst bed, as well as promote a larger pressure
drop, hence, causing a temperature gradient in the reactor tube. The results signified that a
smaller bed volume reduces the utilisation of silica carbide and the catalyst amount, yet still
achieves better catalytic activity.
In addition, the Hi-FUEL catalyst was confirmed to promote the water-gas shift reaction, and
was active at 500 oC. This proved the reasoning of the CO/CO2 ratio reduction at this
respective temperature for each oxygenate that underwent steam reforming.
In the next two chapters, a detailed study is focused on the steam reforming of glycerol as
glycerol is found to be the most challenging oxygenate in comparison to the other oxygenates
studied. The literature review in Chapter 2 proved that glycerol steam reforming involves
complex multi-reactions to achieve the final desired products and this is an interesting
research work to be explored.
178
5.8 References
[1] A. J. Vizcaino, M. Lindo, A. Carrero, and J. A. Calles, "Hydrogen production by
steam reforming of ethanol using Ni catalysts based on ternary mixed oxides prepared
by coprecipitation," International Journal of Hydrogen Energy, vol. 37, pp. 1985-
1992, Jan 2012.
[2] W. Wang, "Production of Hydrogen by Steam Reforming of Bio-Ethanol over Nickel-
Copper Bimetallic Catalysts," International Journal of Green Energy, vol. 6, pp. 92-
103, 2009.
[3] W. Wang and Y. Wang, "Dry reforming of ethanol for hydrogen production:
Thermodynamic investigation," International Journal of Hydrogen Energy, vol. 34,
pp. 5382-5389, 2009.
[4] D. R. Sahoo, S. Vajpai, S. Patel, and K. K. Pant, "Kinetic modeling of steam
reforming of ethanol for the production of hydrogen over Co/Al2O3 catalyst,"
Chemical Engineering Journal, vol. 125, pp. 139-147, 2007.
[5] K. F. M. Elias, A. F. Lucredio, and E. M. Assaf, "Effect of CaO addition on acid
properties of Ni-Ca/Al2O3 catalysts applied to ethanol steam reforming,"
International Journal of Hydrogen Energy, vol. 38, pp. 4407-4417, Apr 15 2013.
[6] P. N. Kechagiopoulos, S. S. Voutetakis, A. A. Lemonidou, and I. A. Vasalos,
"Sustainable hydrogen production via reforming of ethylene glycol using a novel
spouted bed reactor," Catalysis Today, vol. 127, pp. 246-255, 2007.
[7] P. J. Dauenhauer, J. R. Salge, and L. D. Schmidt, "Renewable hydrogen by
autothermal steam reforming of volatile carbohydrates," Journal of Catalysis, vol.
244, pp. 238-247, 2006.
[8] M. A. Christiansen and D. G. Vlachos, "Microkinetic modeling of Pt-catalyzed
ethylene glycol steam reforming," Applied Catalysis a-General, vol. 431, pp. 18-24,
Jul 26 2012.
[9] P. N. Kechagiopoulos, S. S. Voutetakis, A. A. Lemonidou, and I. A. Vasalos,
"Hydrogen Production via Steam Reforming of the Aqueous Phase of Bio-Oil in a
Fixed Bed Reactor," Energy & Fuels, vol. 20, pp. 2155-2163, 2006.
[10] E. Z. Costin Sorin Bildea, Grigore Bozga, Gheorghe Soare, "Conceptual design of
glycerol hydrogenolysis plant " 20th European Symposium on Computer Aided
Process Engineering – ESCAPE20 2010.
179
[11] E. P. Maris and R. J. Davis, "Hydrogenolysis of glycerol over carbon-supported Ru
and Pt catalysts," Journal of Catalysis, vol. 249, pp. 328-337, Jul 25 2007.
[12] E. P. Maris, W. C. Ketchie, M. Murayama, and R. J. Davis, "Glycerol hydrogenolysis
on carbon-supported PtRu and AuRu bimetallic catalysts," Journal of Catalysis, vol.
251, pp. 281-294, Oct 25 2007.
[13] T. Miyazawa, S. Koso, K. Kunimori, and K. Tomishige, "Glycerol hydrogenolysis to
1,2-propanediol catalyzed by a heat-resistant ion-exchange resin combined with
Ru/C," Applied Catalysis a-General, vol. 329, pp. 30-35, Oct 1 2007.
[14] T. Miyazawa, S. Koso, K. Kunimori, and K. Tomishige, "Development of a Ru/C
catalyst for glycerol hydrogenolysis in combination with an ion-exchange resin,"
Applied Catalysis a-General, vol. 318, pp. 244-251, Feb 20 2007.
[15] C. Perego and S. Peratello, "Experimental methods in catalytic kinetics," Catalysis
Today, vol. 52, pp. 133-145, Sep 14 1999.
[16] C. K. Cheng, S. Y. Foo, and A. A. Adesina, "Steam reforming of glycerol over
Ni/Al2O3 catalyst," Catalysis Today, vol. 178, pp. 25-33, Dec 15 2011.

180
CHAPTER 6: GLYCEROL STEAM REFORMING:
THERMODYNAMIC STUDIES AND REACTION PATHWAY
INVESTIGATION
6.1 Introduction
Over the past decade until now, glycerol steam reforming work has been extensively explored
by many prominent researchers in this field. Many catalysts have been tested, including
typical metals, such as Ni and Co, as well as noble metals, such as Rh, Ru, Pt, Pd and Ir, as
discussed earlier in Chapter 2. Nickel is an interesting catalyst to be studied since it is used
commercially in the petrochemical industry for reforming purposes. If glycerol steam
reforming works well with the commercial Nickel catalyst, this will be a promising research
in the near future, particularly if the research is concentrated towards pursuing a co-feed
system of natural gas (methane) and the homologues of oxygenated hydrocarbon studies. As
discussed in Chapter 5, all the oxygenated hydrocarbons studied, especially ethanol and
ethylene glycol, were able to attain relatively high hydrogen selectivity compared to the
thermodynamic limitations. Glycerol and propylene glycol steam reforming yielded lower
hydrogen amounts. However, other major side reactions from this particular process still need
to be discovered and discussed. Ethanol and ethylene glycol steam reforming reaction had
acetaldehyde (CH3CHO) as its major intermediate, as described by many researchers in
nickel catalyst studies [1-4]. However, there is no single report until now as it had been
discussed in detail on the reaction pathway of glycerol steam reforming involving its
intermediates due to the complexity of the reaction. To date, the many researches that have
been conducted on glycerol steam reforming have only highlighted the selectivity of end
products. The reaction pathway to the final products have either not been investigated or
dismissed, such as the works of Adhikari et al., Sanchez et al. and Cheng et al. [5-7].
Therefore, the main purpose of this chapter is to discuss the reaction pathway of glycerol
steam reforming on calcium doped nickel based catalyst, as well as elucidate upon the
thermodynamic aspects. Once more, the Hi-FUEL catalyst is studied in detail to represent the
Ni/Ca-Al2O3 catalyst, which is then compared to a commercial Ni/Al2O3 catalyst at the end of
this chapter.

181
6.2 Experimental Setup and Calculations
The reduction of Hi-FUEL was carried out in-situ, as mentioned in Chapter 4. The vaporiser
temperature was set at 400 oC to ensure complete vaporisation of the reactants. Prior to this,
some experiments were conducted at 300 oC; however, the heating tube lines were fouled and
blocked with carbon deposits on the tube wall. Therefore, the temperature of the vaporiser
was set at 400 oC, due to the limitation of a thermocouple to measure the exact temperature in
the system. In Chapter 4, it was indicated that there was no specific thermocouple to measure
the internal temperature of the vaporiser; hence, by providing a higher heating temperature, it
was presumed that the heat supplied at 400 oC was sufficient to avoid any tube blockage due
to the carbon deposition. The duration of each test was set for 4 hours (except for the time on
screen experiment); this did not include the duration of the start-up or shut down. All the
catalysts tested were crushed and sieved accordingly. The size of the catalyst particles, which
were loaded into the reactor, was within the range of 150≤ x ≤450 μm and diluted in silica
carbide of 750 micron size to make up the catalyst bed volume of 5cm3.
The following expressions were used to simplify the comparisons of the results between the
experimental and simulation studies. The calculations for the expressions used were
consistent with the simulation study, as discussed in Chapter 3.
(6.1)
(6.2)
∑
(6.3)
(6.4)
⁄
(6.5)
In certain sections, carbon species yield term, YCi was used to compare the carbon yield of
gaseous products, which was calculated based on the following:
(6.6)
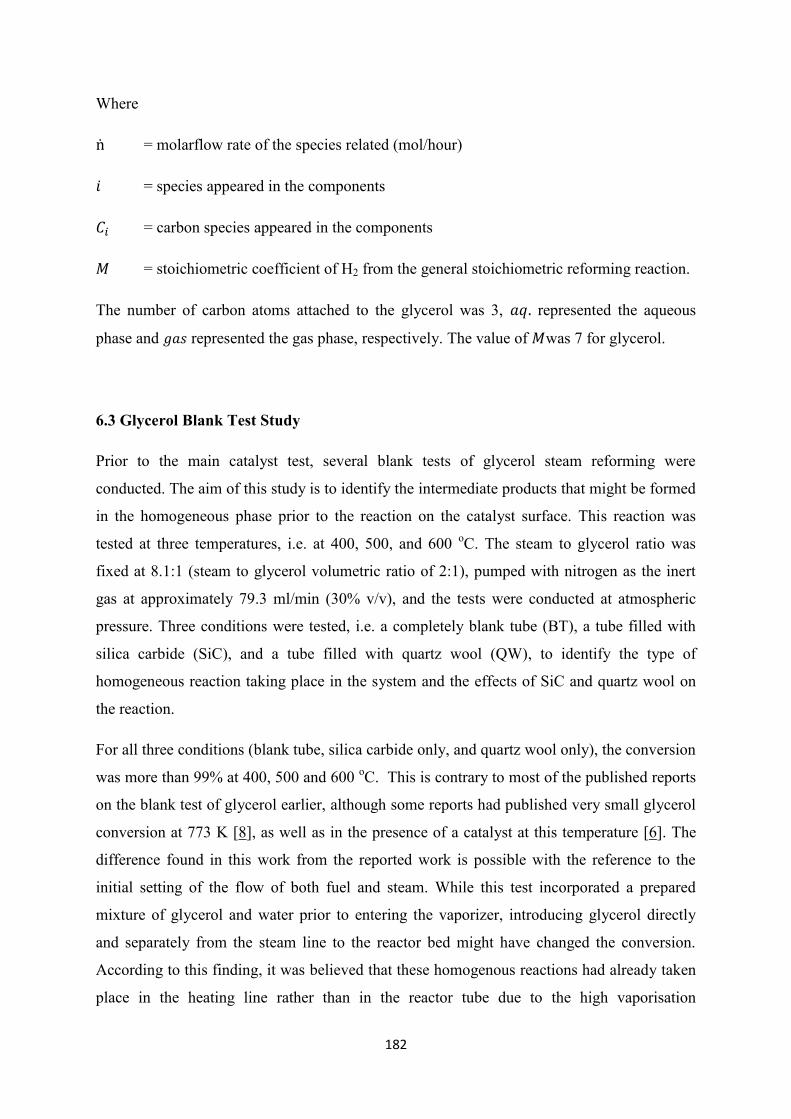
182
Where
= molarflow rate of the species related (mol/hour)
= species appeared in the components
= carbon species appeared in the components
= stoichiometric coefficient of H2 from the general stoichiometric reforming reaction.
The number of carbon atoms attached to the glycerol was 3, represented the aqueous
phase and represented the gas phase, respectively. The value of was 7 for glycerol.
6.3 Glycerol Blank Test Study
Prior to the main catalyst test, several blank tests of glycerol steam reforming were
conducted. The aim of this study is to identify the intermediate products that might be formed
in the homogeneous phase prior to the reaction on the catalyst surface. This reaction was
tested at three temperatures, i.e. at 400, 500, and 600 oC. The steam to glycerol ratio was
fixed at 8.1:1 (steam to glycerol volumetric ratio of 2:1), pumped with nitrogen as the inert
gas at approximately 79.3 ml/min (30% v/v), and the tests were conducted at atmospheric
pressure. Three conditions were tested, i.e. a completely blank tube (BT), a tube filled with
silica carbide (SiC), and a tube filled with quartz wool (QW), to identify the type of
homogeneous reaction taking place in the system and the effects of SiC and quartz wool on
the reaction.
For all three conditions (blank tube, silica carbide only, and quartz wool only), the conversion
was more than 99% at 400, 500 and 600 oC. This is contrary to most of the published reports
on the blank test of glycerol earlier, although some reports had published very small glycerol
conversion at 773 K [8], as well as in the presence of a catalyst at this temperature [6]. The
difference found in this work from the reported work is possible with the reference to the
initial setting of the flow of both fuel and steam. While this test incorporated a prepared
mixture of glycerol and water prior to entering the vaporizer, introducing glycerol directly
and separately from the steam line to the reactor bed might have changed the conversion.
According to this finding, it was believed that these homogenous reactions had already taken
place in the heating line rather than in the reactor tube due to the high vaporisation
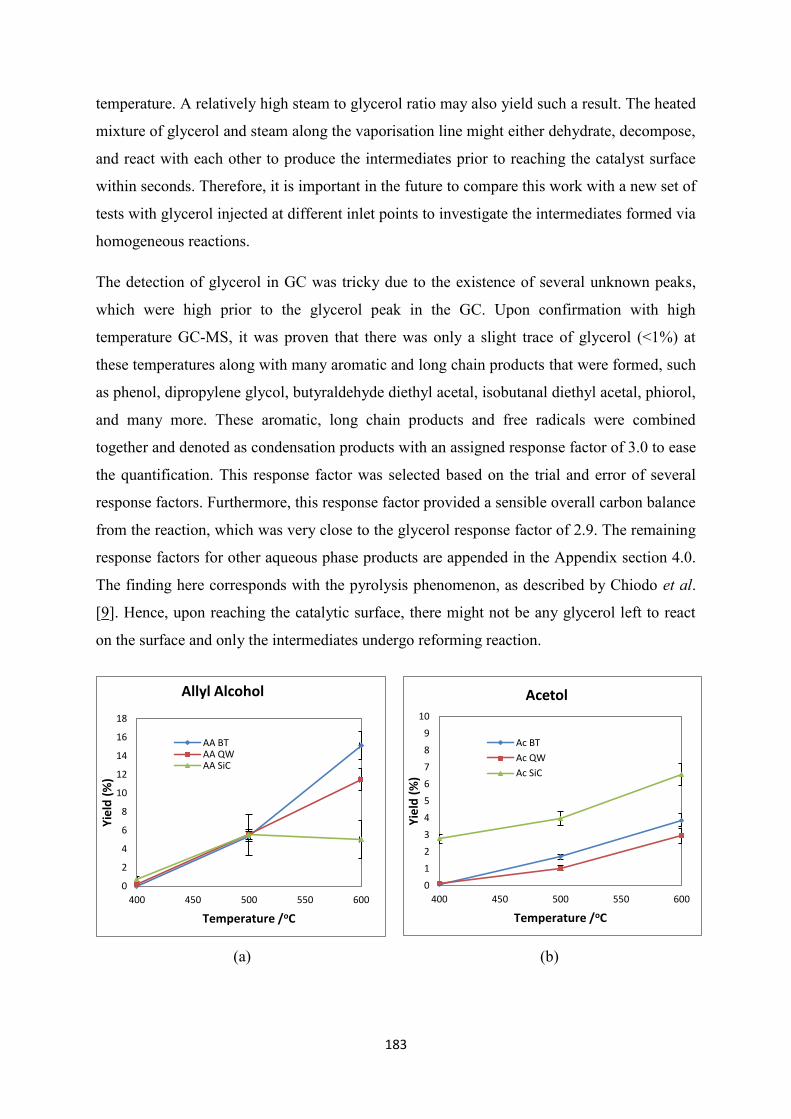
183
temperature. A relatively high steam to glycerol ratio may also yield such a result. The heated
mixture of glycerol and steam along the vaporisation line might either dehydrate, decompose,
and react with each other to produce the intermediates prior to reaching the catalyst surface
within seconds. Therefore, it is important in the future to compare this work with a new set of
tests with glycerol injected at different inlet points to investigate the intermediates formed via
homogeneous reactions.
The detection of glycerol in GC was tricky due to the existence of several unknown peaks,
which were high prior to the glycerol peak in the GC. Upon confirmation with high
temperature GC-MS, it was proven that there was only a slight trace of glycerol (<1%) at
these temperatures along with many aromatic and long chain products that were formed, such
as phenol, dipropylene glycol, butyraldehyde diethyl acetal, isobutanal diethyl acetal, phiorol,
and many more. These aromatic, long chain products and free radicals were combined
together and denoted as condensation products with an assigned response factor of 3.0 to ease
the quantification. This response factor was selected based on the trial and error of several
response factors. Furthermore, this response factor provided a sensible overall carbon balance
from the reaction, which was very close to the glycerol response factor of 2.9. The remaining
response factors for other aqueous phase products are appended in the Appendix section 4.0.
The finding here corresponds with the pyrolysis phenomenon, as described by Chiodo et al.
[9]. Hence, upon reaching the catalytic surface, there might not be any glycerol left to react
on the surface and only the intermediates undergo reforming reaction.
(a)
(b)
0
2
4
6
8
10
12
14
16
18
400 450 500 550 600
Yie
ld (
%)
Temperature /oC
Allyl Alcohol
AA BTAA QWAA SiC
0
1
2
3
4
5
6
7
8
9
10
400 450 500 550 600
Yie
ld (
%)
Temperature /oC
Acetol
Ac BT
Ac QW
Ac SiC
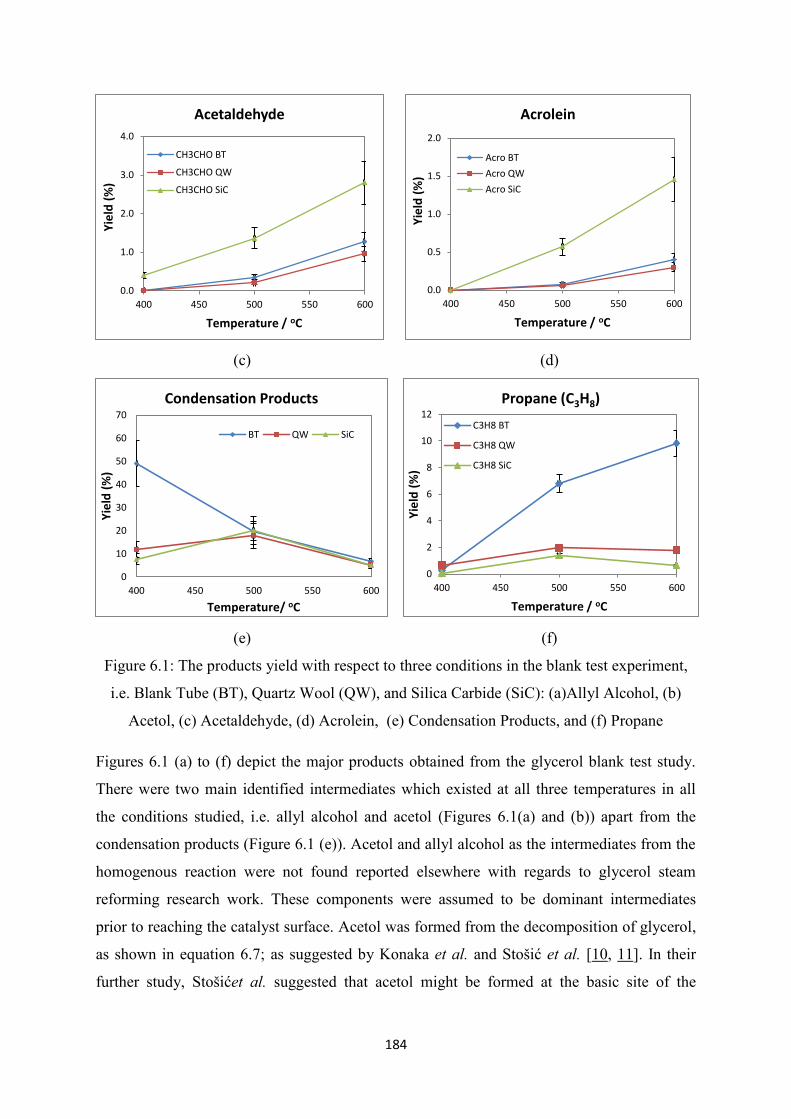
184
(c)
(d)
(e)
(f)
Figure 6.1: The products yield with respect to three conditions in the blank test experiment,
i.e. Blank Tube (BT), Quartz Wool (QW), and Silica Carbide (SiC): (a)Allyl Alcohol, (b)
Acetol, (c) Acetaldehyde, (d) Acrolein, (e) Condensation Products, and (f) Propane
Figures 6.1 (a) to (f) depict the major products obtained from the glycerol blank test study.
There were two main identified intermediates which existed at all three temperatures in all
the conditions studied, i.e. allyl alcohol and acetol (Figures 6.1(a) and (b)) apart from the
condensation products (Figure 6.1 (e)). Acetol and allyl alcohol as the intermediates from the
homogenous reaction were not found reported elsewhere with regards to glycerol steam
reforming research work. These components were assumed to be dominant intermediates
prior to reaching the catalyst surface. Acetol was formed from the decomposition of glycerol,
as shown in equation 6.7; as suggested by Konaka et al. and Stošić et al. [10, 11]. In their
further study, Stošićet al. suggested that acetol might be formed at the basic site of the
0.0
1.0
2.0
3.0
4.0
400 450 500 550 600
Yie
ld (
%)
Temperature / oC
Acetaldehyde
CH3CHO BT
CH3CHO QW
CH3CHO SiC
0.0
0.5
1.0
1.5
2.0
400 450 500 550 600
Yie
ld (
%)
Temperature / oC
Acrolein
Acro BT
Acro QW
Acro SiC
0
10
20
30
40
50
60
70
400 450 500 550 600
Yie
ld (
%)
Temperature/ oC
Condensation Products
BT QW SiC
0
2
4
6
8
10
12
400 450 500 550 600
Yie
ld (
%)
Temperature / oC
Propane (C3H8)
C3H8 BT
C3H8 QW
C3H8 SiC

185
catalyst, while acrolein may be formed at the acidic site of the catalyst, and the balance of
both the acids and basic sites of the catalyst influenced the selectivity of the product intended.
(6.7)
The finding of allyl alcohol was reported by Qadariyah et al. [12], which relates to
hydrothermal glycerol degradation at sub and supercritical water. Konaka et al., and Liu et al.
[10, 13], in their findings, suggested that allyl alcohol may be formed via hydrogen transfer to
acrolein, which is another dehydration product of glycerol apart from acetol. Equation 6.8
highlights the reaction stoichiometry.
(6.8)
Konaka et al. and Liu et al. reported that the production of allyl alcohol is very selective from
glycerol decomposition. The increase of allyl alcohol selectivity is only possible via
hydrogenation of acrolein on the basic site of the catalyst, whilst the acid site promotes
dehydration of glycerol to acrolein. The following reaction stoichiometry in equation 6.9
depicts the dehydration of glycerol to acrolein.
(6.9)
The hydrogen for the reaction with acrolein to produce allyl alcohol was proposed to be
obtained from the glycerol dehydrogenation, as suggested by Adhikari et al. and Wawrzetz et
al. [14, 15]. Wawrzetz et al. reported that glycerol dehydrogenated into glyceraldehyde
(C3H6O3) in their study of aqueous phase reforming at a relatively low reaction temperature
and higher pressure, as shown in equation 6.10. However, glyceraldehyde could not be
identified here due to the high vaporisation and reaction temperature. Glyceraldehyde can be
further dehydrogenated into acetaldehyde and CO2. Acetaldehyde was detected in this blank
test and the reaction stoichiometry is shown in equation 6.11. Adhikari et al. reported that
acetaldehyde could be formed from glycerol, together with hydrogen, via reaction, as shown
in equation 6.12, which summarises the sequence of equations 6.10 and 6.11, respectively.

186
Acetaldehyde detection, according to different conditions tested, was earlier depicted in
Figure 6.1 (c).
(6.10)
(6.11)
(6.12)
Thus, it can be highlighted here that the production of allyl alcohol in homogeneous phase
from glycerol and steam at relatively high temperature and at atmospheric pressure was an
interesting finding in this research work, as such a finding has not been reported in any
similar study to date.
A comparison was made via Aspen-HYSYS simulator using the Gibbs free energy
minimisation method. Two scenarios were studied, whereby the steam and glycerol were fed
in with or without the addition of hydrogen at 400 oC and atmospheric pressure. Without the
presence of hydrogen, glycerol, and steam dehydration on the products, such as acetol/
hydroxyacetone and acrolein, took place. However, in the presence of hydrogen, even at a
small percentage, allyl alcohol appeared together with other dehydration products. By
introducing acrolein without hydrogen into the reactor, no allyl alcohol was observed at the
outlet, but by introducing hydrogen, small amounts of allyl alcohol could be seen, as shown
by Aspen-HYSYS. This is consistent with the findings made by Konaka et al. and Liu et al.
The results are shown in section 7.0 of the appendix.
The increase in temperature reduced the production of condensation products, as well as free
radicals, as shown in Figure 6.1(e). The gas products were found to be present in small
amounts and the hydrogen yield was not more than 1%. The largest gas component present
was propane, which might have been formed from the hydrogenation of allyl alcohol; this is
shown in Figure 6.1(f). The following equation, 6.14, may apply to this assumption:

187
(6.13)
The condensation products were suppressed to the minimum at higher temperatures and in
the presence of quartz wool and SiC; this was assumed to be due to the quenching effects of
the packing. The condensate that was collected in the ice trap was yellowish and brownish in
colour. Large amounts of free carbon were produced along the tube line based on the
observation as it deposited on the SiC and quartz wool, but decreased as the temperature
increased.
The intermediates, as in Figures 6.1(a) and 6.1 (f), demonstrated a different trend in
comparison to Figures 6.1 (b), (c) and (d). It was found that SiC favoured glycerol
dehydration, but not the formation of allyl alcohol and propane, which was formed via
hydrogenation reactions. The findings obtained were assumed to be sufficient to identify the
next reaction pathway favoured via the catalytic reaction on glycerol steam reforming.
6.4 Glycerol Steam Reforming over Hi-FUEL at 400 oC
The Hi-FUEL catalyst was tested at a reaction temperature of 400 oC using different catalyst
amounts, which implied different WHSV. Table 6.1 below depicts the catalyst loading and its
relation with WHSV and resident time, τ.
Catalyst loading/ g 0.05 0.10 0.15 0.25 0.5
WHSV (gflow/gcatalyst hour) 153.0 76.5 51.0 30.6 15.30
1/WHSV (space-time, τ /hour) 0.007 0.013 0.020 0.033 0.065
Table 6.1: Corresponding WHSV and space-time for each catalyst loading at fixed gas flow
rate of 7.65 g/hr (with N2), and GHSV=2220 cm3
gas flow/cm3
bed volume hr
The glycerol conversion at this temperature is shown in Table 6.2, as follows:
1/WHSV (space-time, τ /hour) 0.007 0.013 0.020 0.033 0.065
Glycerol Conversion, X (%) 99.31 99.58 99.90 99.93 100.00
Table 6.4: Glycerol conversion, X (%) from glycerol steam reforming at 600 oC over
Hi-FUEL catalyst

188
The results were related to the aqueous phase yield (%), the main gas (H2, CO2, CO, and
CH4) yield (%), the selectivity of carbon gases in the gas phase (%), and the carbon yield of
gas species, as shown in Figures 6.2, 6.3, 6.4, and 6.5, respectively.
Figure 6.2: The aqueous phase products’ yield from glycerol steam reforming at 400 oC
over Hi-FUEL
Figure 6.3: The main products (H2, CO2, CO, and CH4) yield from glycerol steam reforming
at 400 oC over Hi-FUEL
0.00
0.05
0.10
0.15
0.20
0.25
0.30
0 0.01 0.02 0.03 0.04 0.05 0.06 0.07
Aq
ue
ou
s P
has
e Y
ield
Space time, 1/WHSV (hour)
Acetaldehyde Acrolein
Methanol Allyl Alcohol
Acetol Condensation Products
Glycerol
0.00
0.50
1.00
1.50
2.00
2.50
3.00
0 0.01 0.02 0.03 0.04 0.05 0.06 0.07
Gas
Ph
ase
Yie
ld
1/WHSV (hours)
H2 eqm H2 CO2 COCH4 CO2 eqm CO eqm CH4 eqm

189
Figure 6.4: The primary carbon gas selectivity (%) and CO/CO2 ratio of glycerol steam
reforming at 400 oC over Hi-FUEL
Figure 6.5: The carbon yield of gas phase carbon products from glycerol steam reforming at
400 oC over Hi-FUEL
0.0
0.5
1.0
1.5
2.0
2.5
3.0
3.5
4.0
4.5
0
10
20
30
40
50
60
70
80
90
0 0.01 0.02 0.03 0.04 0.05 0.06 0.07
CO
/CO
2 R
atio
Sele
ctiv
ity
(%)
1/WHSV (hours)
CO/CO2 Ratio CO2 CO
CH4 CO2 eqm CO eqm
CH4 eqm CO/CO2 Ratio Eqm
0
5
10
15
20
25
30
35
40
45
50
0 0.01 0.02 0.03 0.04 0.05 0.06 0.07
Car
bo
n Y
ield
, YC
i( %
)
1/WHSV (hour)
CO2 CO CH4 C2H4 C2H6 C3H8 C3H6

190
With reference to Figure 6.2, at a low space-time, the condensation products were largely
formed due to insufficient contact with the catalyst. However, this was suppressed as the
contact time increased due to higher catalytic activity. At a contact time of 0.013 hours, allyl
alcohol was formed at maximum selectivity and decreased as the contact time increased.
Similarly, acetol reached its maximum peak at 0.033 hours. However, both yields were
considerably smaller in comparison to the blank test study at a similar reaction temperature.
The findings also revealed that an increased amount of additional catalyst contributed to the
formation of methanol. There were other traces of products that are not shown here, such as
propionic acid, acetic acid, ethylene glycol, propylene glycol, propanol, 2-propanol, and
ethanol. Direct hydrogenolysis from glycerol to methanol, as shown in equation 6.14, was
possible due to the presence of trace amount of ethylene glycol; however, this was presumed
to be largely governed by acetol hydrogenolysis. The formation of methanol could possibly
be formed via acetol hydrogenolysis, as suggested by Bildea et al. [16], and this led to the
increased amount of methane and carbon monoxide, as shown in equation 6.15.
(6.14)
(6.15)
The hydrogen yield increased up to 35% as the space-time increased, as shown in Figure 6.3.
This is higher in comparison to the thermodynamic equilibrium, but with the exception of the
error. However, a higher amount of CO was formed in comparison to CO2, as highlighted in
Figures 6.3 and 6.4. As the contact time increased, the ratio of CO/CO2 also increased, as
indicated in Figure 6.4, which was opposite to the equilibrium prediction, whereby the
CO/CO2 ratio was very minimal (CO/CO2 ratio = 0.02). This was significantly different to
what had been expected from the thermodynamic equilibrium prediction. Apart from acetol
hydrogenolysis, large yields of CO might also result from the decomposition of glycerol,
which is shown in equation 6.16. This finding can be used to explain the significant increase
191
of hydrogen. Other possibilities may also include the coke gasification reaction, which is
further discussed in Chapter 8.
(6.16)
Figure 6.5 illustrates the carbon yield of all the carbon species gas products that exited the
reactor. There were other gases formed resulting from side reactions, such as ethane (C2H6),
ethylene (C2H4), propane (C3H8), and propylene (C3H6). The selectivity of these gases at
different contact times is shown in Table 6.3.
1/WHSV (space-time, τ /hour) 0.007 0.013 0.020 0.033 0.065
Selectivity
(%)
CH4 1.0 6.2 5.0 5.6 10.3
C2H4 0.5 3.1 5.2 3.2 2.7
C2H6 0.1 0.6 0.6 0.5 0.4
C3H6 0.1 0.9 1.5 1.5 0
C3H8 0.0 0.0 0.0 0.0 1.2
Table 6.3: The selectivity of hydrocarbons produced at 400 oC and atmospheric pressure
Figure 6.5 suggests that the yield of all carbon species gases were very low at low space-time,
which was directly related to the formation of a huge amount of condensation products, as
shown in Figure 6.2. As the contact time extended, the CO production increased significantly.
The production of ethane and ethylene were also slightly higher as the catalyst loading was
increased. This may also be related to allyl alcohol and acetol productions, which reached the
maximum peak and reduced, as in Figure 6.2. This clearly suggests that other than the
hydrogenolysis reaction, the significant increase of CO production at a higher contact time
was also possibly governed by the decomposition of acetol and allyl alcohol, as in the
following:
(6.17)
(6.18)

192
(6.19)
Although the methane was expected to be highly thermodynamic at this temperature, the
selectivity was low at low space-time due to favourable decomposition reaction (6.17 – 6.19),
which delayed the methane formation. However, methane production had a tendency to
increase as the space-time increased that resulted in methanation reaction of CO and
hydrogen. From Figure 6.5, the slight increase of C3H6 yield in the space-time test could be
associated with the hydrogen transfer to allyl alcohol, as in the following:
(6.20)
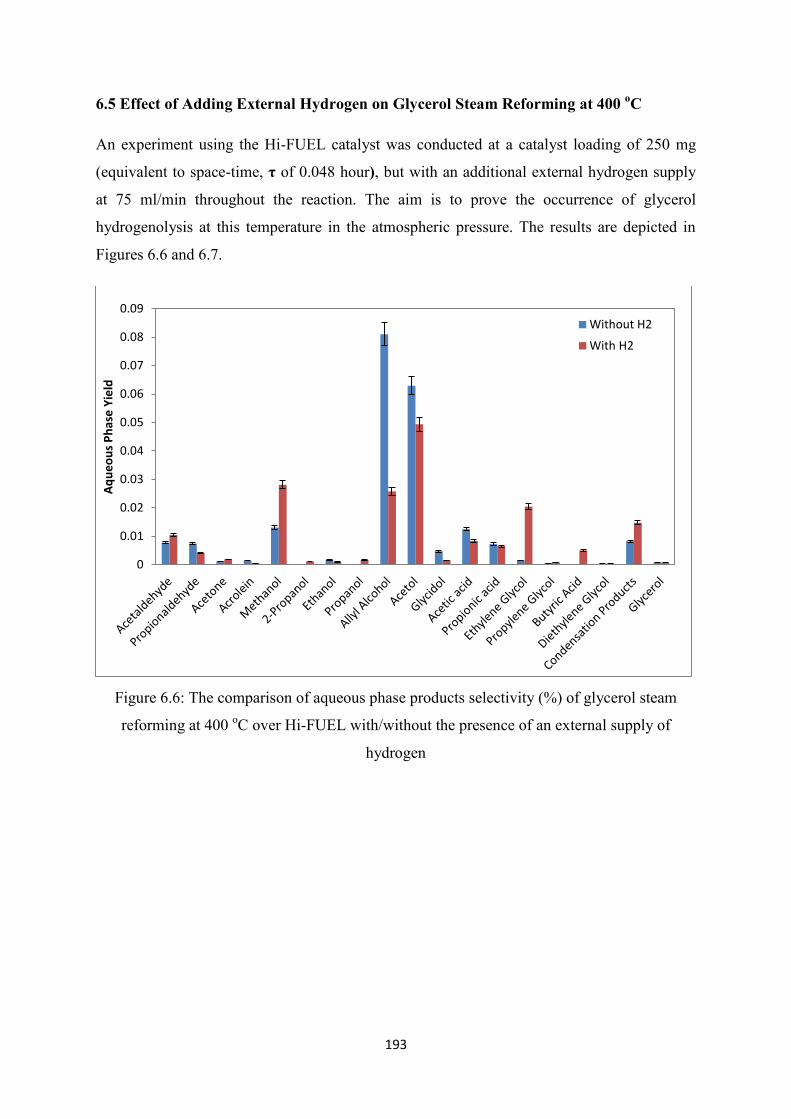
193
6.5 Effect of Adding External Hydrogen on Glycerol Steam Reforming at 400 oC
An experiment using the Hi-FUEL catalyst was conducted at a catalyst loading of 250 mg
(equivalent to space-time, τ of 0.048 hour), but with an additional external hydrogen supply
at 75 ml/min throughout the reaction. The aim is to prove the occurrence of glycerol
hydrogenolysis at this temperature in the atmospheric pressure. The results are depicted in
Figures 6.6 and 6.7.
Figure 6.6: The comparison of aqueous phase products selectivity (%) of glycerol steam
reforming at 400 oC over Hi-FUEL with/without the presence of an external supply of
hydrogen
0
0.01
0.02
0.03
0.04
0.05
0.06
0.07
0.08
0.09
Aq
ue
ou
s P
has
e Y
ield
Without H2
With H2
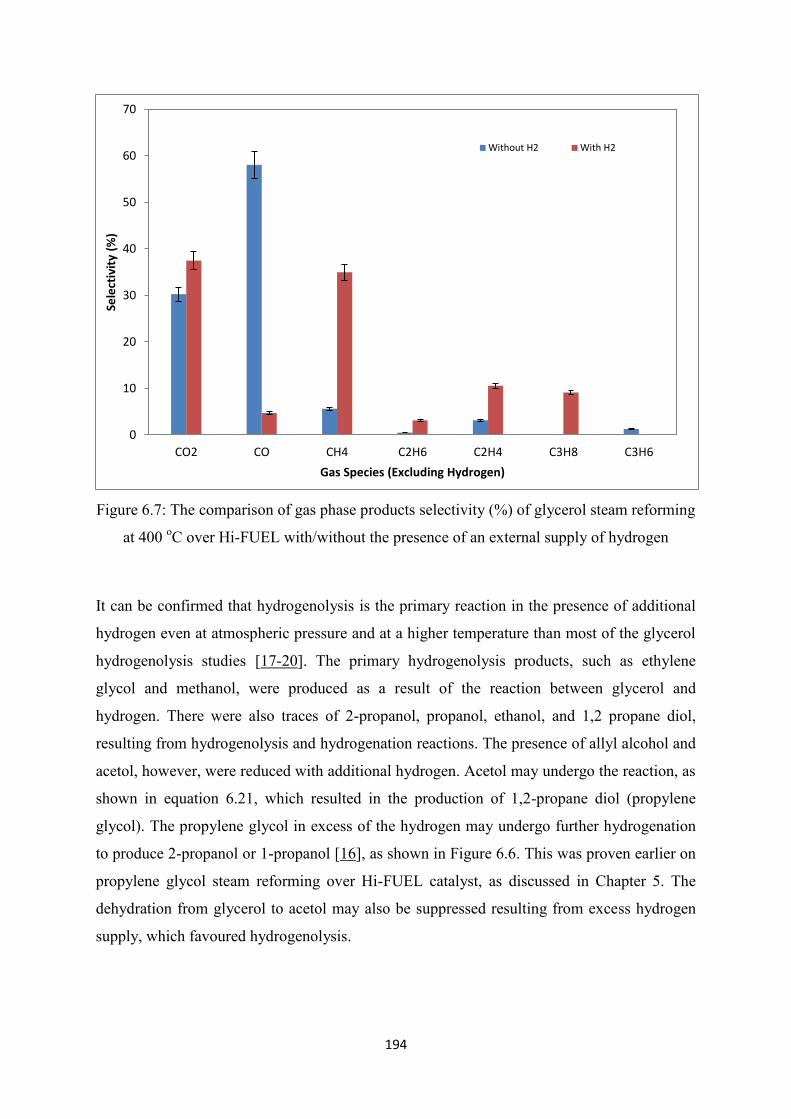
194
Figure 6.7: The comparison of gas phase products selectivity (%) of glycerol steam reforming
at 400 oC over Hi-FUEL with/without the presence of an external supply of hydrogen
It can be confirmed that hydrogenolysis is the primary reaction in the presence of additional
hydrogen even at atmospheric pressure and at a higher temperature than most of the glycerol
hydrogenolysis studies [17-20]. The primary hydrogenolysis products, such as ethylene
glycol and methanol, were produced as a result of the reaction between glycerol and
hydrogen. There were also traces of 2-propanol, propanol, ethanol, and 1,2 propane diol,
resulting from hydrogenolysis and hydrogenation reactions. The presence of allyl alcohol and
acetol, however, were reduced with additional hydrogen. Acetol may undergo the reaction, as
shown in equation 6.21, which resulted in the production of 1,2-propane diol (propylene
glycol). The propylene glycol in excess of the hydrogen may undergo further hydrogenation
to produce 2-propanol or 1-propanol [16], as shown in Figure 6.6. This was proven earlier on
propylene glycol steam reforming over Hi-FUEL catalyst, as discussed in Chapter 5. The
dehydration from glycerol to acetol may also be suppressed resulting from excess hydrogen
supply, which favoured hydrogenolysis.
0
10
20
30
40
50
60
70
CO2 CO CH4 C2H6 C2H4 C3H8 C3H6
Sele
ctiv
ity
(%)
Gas Species (Excluding Hydrogen)
Without H2 With H2

195
(6.21)
In addition, the reduction of allyl alcohol could result from the direct hydrogenation of allyl
alcohol to propane, and propane to ethane, and ultimately cracked to ethylene (equations 6.22
to 6.24). In addition, the propylene that was produced via allyl alcohol hydrogenation was
converted to propane in the presence of additional hydrogen, as shown in equation 6.25
below:
(6.22)
(6.23)
(6.24)
(6.25)
(6.26)
The increased yield of CH4 was due to the increase of methanation activity, as proposed from
equation 6.26 above. The CO was significantly reduced, whilst the CH4 increased in the
presence of additional H2 as a result of the methanation reaction. This suggests that the
hydrogen produced from glycerol steam reforming at 400 oC over Hi-FUEL (Figure 6.3) at a
contact time of 0.069 hours was still not sufficient to enhance methanation reaction. This
finding evidently suggests that, at this reaction temperature, hydrogenolysis, hydrogenation,
and thermal decomposition are dominant reactions over the Hi-FUEL catalyst.

196
6.6 Glycerol Steam Reforming over Hi-FUEL at 600 oC
Hi-FUEL was also tested at 600 oC with a similar catalyst loading. The vaporiser temperature
was fixed at 400 oC. The glycerol conversion at respective space-time is shown in Table 6.4:
1/WHSV (space-time, τ /hour) 0.007 0.013 0.020 0.033 0.065
Glycerol Conversion, X (%) 98.88 99.96 100.00 100.00 100.00
Table 6.4: Glycerol Conversion, X (%) from glycerol steam reforming at 600oC over
Hi-FUEL catalyst
The aqueous phase products’ yield, the gas products’ yield, the carbon gas selectivity (%),
and the carbon species yield in gas phase (%) are revealed in Figures 6.8, 6.9, 6.10, and 6.11,
respectively.
Figure 6.8: The yield of the aqueous phase products from glycerol steam reforming at 600 oC
over Hi-FUEL
0.00
0.05
0.10
0.15
0.20
0.25
0.30
0 0.01 0.02 0.03 0.04 0.05 0.06 0.07
Aq
ue
ou
s P
has
e P
rod
uct
s' Y
ield
Space time, 1/WHSV (hour)
Acetaldehyde Acrolein
Methanol Allyl Alcohol
Acetol Condensation Products

197
Figure 6.9: The yield of the main products (H2, CO2, CO and CH4) from glycerol steam
reforming at 600 oC over Hi-FUEL
Figure 6.10: The primary carbon gas selectivity (%) and CO/CO2 ratio of glycerol steam
reforming at 600 oC over Hi-FUEL
0.6
1.4
3.1 3.3
4.3
0
1
2
3
4
5
6
7
0.000 0.010 0.020 0.030 0.040 0.050 0.060 0.070
Yie
ld, Y
1/WHSV, t (hour)
H2 CO2 CO CH4H2 eqm CO2 eqm CO eqm CH4 eqm
0.00
0.50
1.00
1.50
2.00
2.50
0
10
20
30
40
50
60
70
80
90
0.000 0.010 0.020 0.030 0.040 0.050 0.060 0.070
CO
/CO
2 R
atio
Sele
ctiv
ity(
%)
1/WHSV, t (hour)
CO/CO2 Ratio CO2 CO
CH4 CO2 eqm CO eqm

198
Figure 6.11: The carbon yield of gas phase carbon products from glycerol steam reforming at
600 oC over Hi-FUEL
The glycerol approached complete conversion at a lower space-time, but it fully converted
into the intermediates and final products as the catalyst loading increased. From Figure 6.8, it
can be observed that all aqueous phase intermediates became traces as the space-time
increased while they were converted into gaseous products. The condensation products and
free radicals appeared at a low catalyst loading (low space-time), but relatively lower
selectivity than the reaction at 400 oC. The condensation products disappeared as the catalyst
loading increased. Acetol was the major trace component resulting from the dehydration of
glycerol as the contact time increased in contrast to the reaction at 400 oC, of which allyl
alcohol was the major intermediate. This coincides with the blank test experiment of which
the yield of acetol increased as the temperature increased in the presence of silica carbide.
However, the yield of each aqueous phase intermediates was very low and the intermediates
disappeared since the catalyst was very active and the yield of the final products was very
large, as shown in Figure 6.9.
From Figure 6.9, it can be portrayed that CO2, CO, and CH4 yields approached the
equilibrium as the contact time increased while their selectivity reached the equilibrium, as
0
10
20
30
40
50
60
70
0.00 0.01 0.02 0.03 0.04 0.05 0.06 0.07 0.08 0.09 0.10
Car
bo
n Y
ield
, YC
i (%
)
Space time, 1/WHSV (hour)
CO2 CO CH4 C2H4 C2H6 C3H8
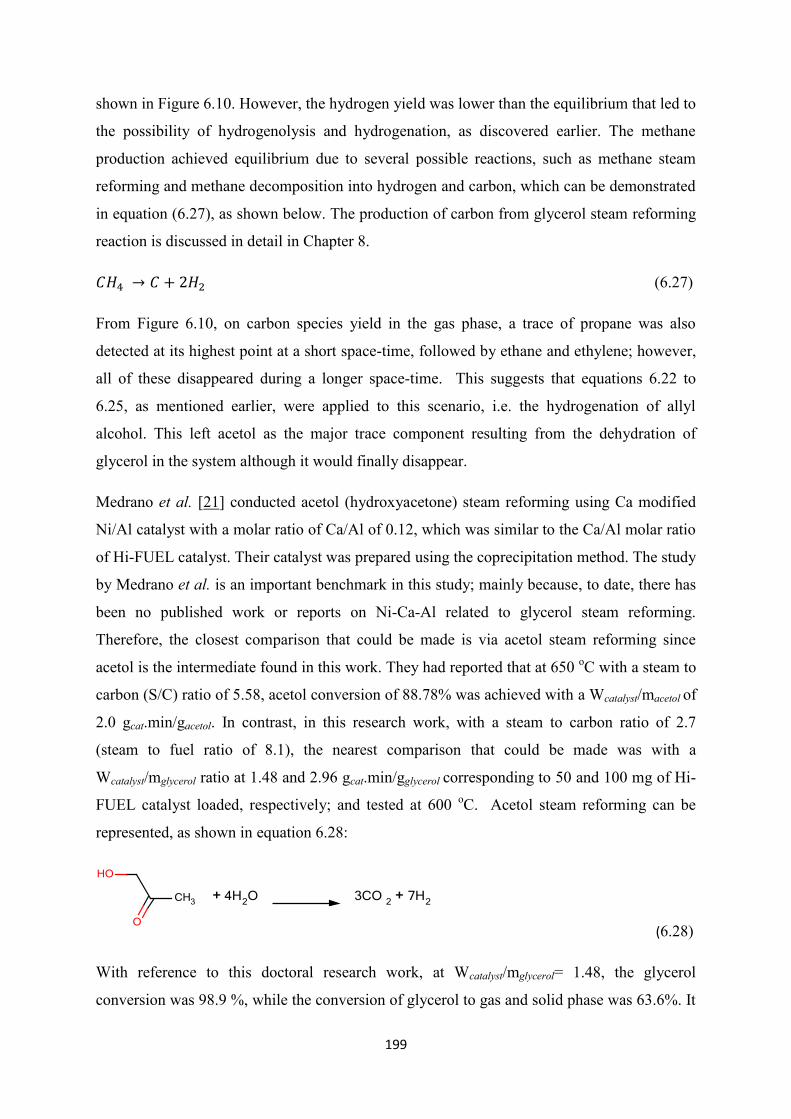
199
shown in Figure 6.10. However, the hydrogen yield was lower than the equilibrium that led to
the possibility of hydrogenolysis and hydrogenation, as discovered earlier. The methane
production achieved equilibrium due to several possible reactions, such as methane steam
reforming and methane decomposition into hydrogen and carbon, which can be demonstrated
in equation (6.27), as shown below. The production of carbon from glycerol steam reforming
reaction is discussed in detail in Chapter 8.
(6.27)
From Figure 6.10, on carbon species yield in the gas phase, a trace of propane was also
detected at its highest point at a short space-time, followed by ethane and ethylene; however,
all of these disappeared during a longer space-time. This suggests that equations 6.22 to
6.25, as mentioned earlier, were applied to this scenario, i.e. the hydrogenation of allyl
alcohol. This left acetol as the major trace component resulting from the dehydration of
glycerol in the system although it would finally disappear.
Medrano et al. [21] conducted acetol (hydroxyacetone) steam reforming using Ca modified
Ni/Al catalyst with a molar ratio of Ca/Al of 0.12, which was similar to the Ca/Al molar ratio
of Hi-FUEL catalyst. Their catalyst was prepared using the coprecipitation method. The study
by Medrano et al. is an important benchmark in this study; mainly because, to date, there has
been no published work or reports on Ni-Ca-Al related to glycerol steam reforming.
Therefore, the closest comparison that could be made is via acetol steam reforming since
acetol is the intermediate found in this work. They had reported that at 650 oC with a steam to
carbon (S/C) ratio of 5.58, acetol conversion of 88.78% was achieved with a Wcatalyst/macetol of
2.0 gcat.min/gacetol. In contrast, in this research work, with a steam to carbon ratio of 2.7
(steam to fuel ratio of 8.1), the nearest comparison that could be made was with a
Wcatalyst/mglycerol ratio at 1.48 and 2.96 gcat.min/gglycerol corresponding to 50 and 100 mg of Hi-
FUEL catalyst loaded, respectively; and tested at 600 oC. Acetol steam reforming can be
represented, as shown in equation 6.28:
(6.28)
With reference to this doctoral research work, at Wcatalyst/mglycerol= 1.48, the glycerol
conversion was 98.9 %, while the conversion of glycerol to gas and solid phase was 63.6%. It

200
was found that the acetol mole fraction was 0.17 in the aqueous phase. At Wcatalyst/mglycerol=
2.96, although the conversion of glycerol was almost 100%, and glycerol to gas and solid
phase conversion improved to 84.0%, acetol was still high, which made up the mole fraction
in the aqueous phase of 0.34. Glycerol to gas and solid phase conversions were calculated
using the equation (6.29) below:
[( ) (∑
)]
(6.29)
represents the molar flow rate of each carbon species i in the aqueous phase and N
represents the number of carbon atoms attached to each species. The number of carbon atoms
attached to glycerol was three, as indicated.
Table 6.5 Summary of the findings from this work and Medrano et al.
Medrano et al.
(2009)
This work (a) This work (b)
Reactant Acetol Glycerol Glycerol
Wcatalyst/macetol
(gcat.min/gacetol)
2.0 1.48 2.96
Ca/Al ratio 0.12 0.12 0.12
Temperature/ oC 650 600 600
Steam to Carbon
(S/C) Ratio
5.58 2.7
(Steam/Glycerol)
2.7
(Steam/Glycerol)
Conversion (%) 88.78 98.9 %
(Glycerol to gas
phase conversion is
63.6%)
99.96 %
(Glycerol to gas
phase conversion is
84.0 %)
H2 Yield 0.11 0.5 1.4
Note Mole fraction of
acetol in aqueous
phase is 0.17
Mole fraction of
acetol in aqueous
phase is 0.34
Table 6.5: Comparison of results obtained from Medrano et al. (2009) and this work
From Table 6.5, it can be clearly suggested that at low catalyst loading, acetol could not be
reformed easily, which corresponds to the findings of Medrano et al. The hydrogen yield
201
reported was 0.11 in the study of Medrano et al. In this doctoral research work, the H2 yield
was 0.5 and 1.4 for Wcatalyst/mglycerol of 1.48 and 2.96, respectively, suggesting that the H2
produced at low catalyst loading may account for other reactions, such as the catalytic
cracking of condensation products. As can be observed in Figure 6.8, the condensation
products reduced tremendously from 0.005 mol/hour over 50mg Hi-FUEL to 0.0004
mol/hour over 100mg Hi-FUEL. Medrano et al. also reported that acetol steam reforming
produced ethane and ethylene, which was similar to the findings in this study; however, the
production of propane was not reported. In addition, the work Medrano of et al. was also
benchmarked against a Ni/Al catalyst and they concurred that the doping of calcium to
Ni/Al2O3 produced more CO and CH4 from acetic acid and acetol steam reforming activities.
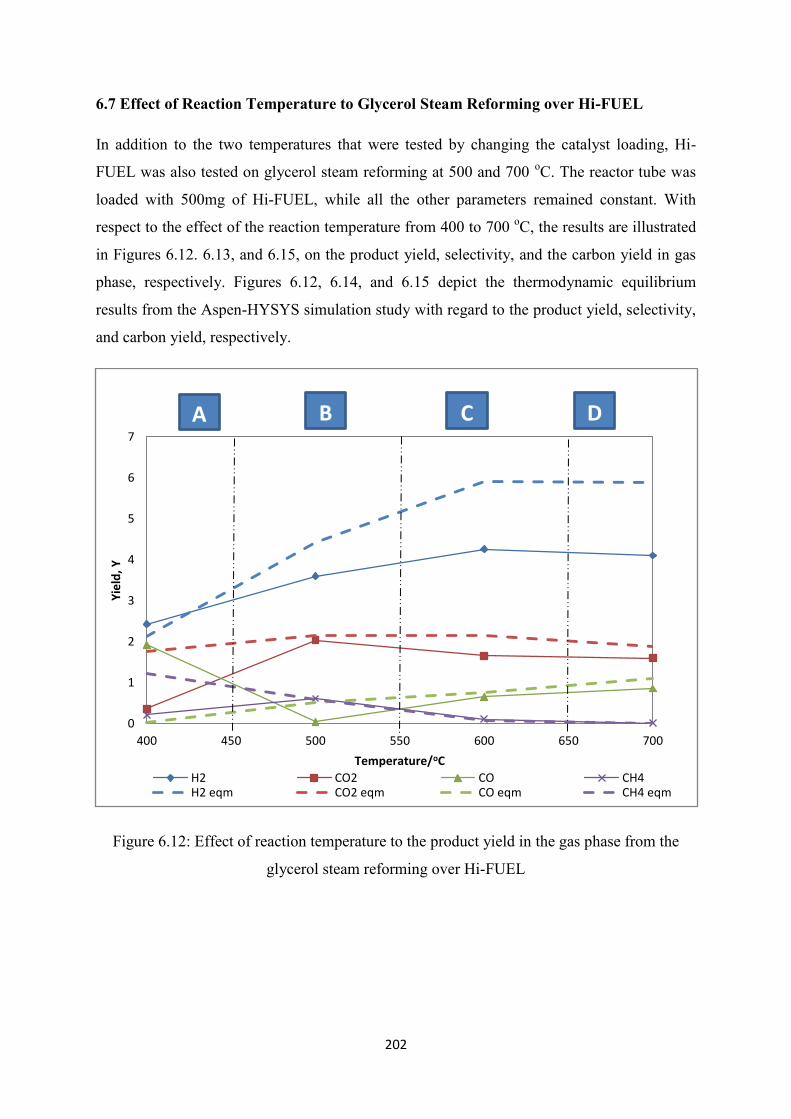
202
6.7 Effect of Reaction Temperature to Glycerol Steam Reforming over Hi-FUEL
In addition to the two temperatures that were tested by changing the catalyst loading, Hi-
FUEL was also tested on glycerol steam reforming at 500 and 700 oC. The reactor tube was
loaded with 500mg of Hi-FUEL, while all the other parameters remained constant. With
respect to the effect of the reaction temperature from 400 to 700 oC, the results are illustrated
in Figures 6.12. 6.13, and 6.15, on the product yield, selectivity, and the carbon yield in gas
phase, respectively. Figures 6.12, 6.14, and 6.15 depict the thermodynamic equilibrium
results from the Aspen-HYSYS simulation study with regard to the product yield, selectivity,
and carbon yield, respectively.
Figure 6.12: Effect of reaction temperature to the product yield in the gas phase from the
glycerol steam reforming over Hi-FUEL
0
1
2
3
4
5
6
7
400 450 500 550 600 650 700
Yie
ld, Y
Temperature/oC
H2 CO2 CO CH4H2 eqm CO2 eqm CO eqm CH4 eqm
A B
C D
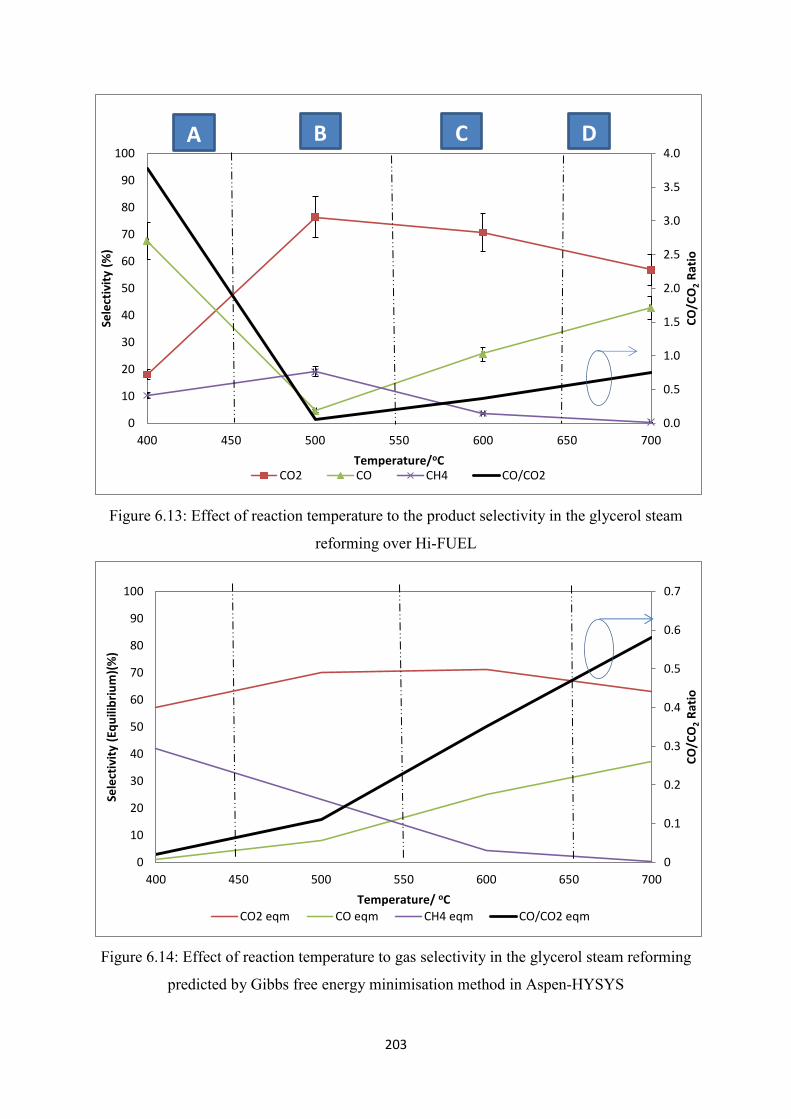
203
Figure 6.13: Effect of reaction temperature to the product selectivity in the glycerol steam
reforming over Hi-FUEL
Figure 6.14: Effect of reaction temperature to gas selectivity in the glycerol steam reforming
predicted by Gibbs free energy minimisation method in Aspen-HYSYS
0.0
0.5
1.0
1.5
2.0
2.5
3.0
3.5
4.0
0
10
20
30
40
50
60
70
80
90
100
400 450 500 550 600 650 700
CO
/CO
2 R
atio
Sele
ctiv
ity
(%)
Temperature/oC CO2 CO CH4 CO/CO2
A B C D
0
0.1
0.2
0.3
0.4
0.5
0.6
0.7
0
10
20
30
40
50
60
70
80
90
100
400 450 500 550 600 650 700
CO
/CO
2 R
atio
Sele
ctiv
ity
(Eq
uili
bri
um
)(%
)
Temperature/ oC
CO2 eqm CO eqm CH4 eqm CO/CO2 eqm
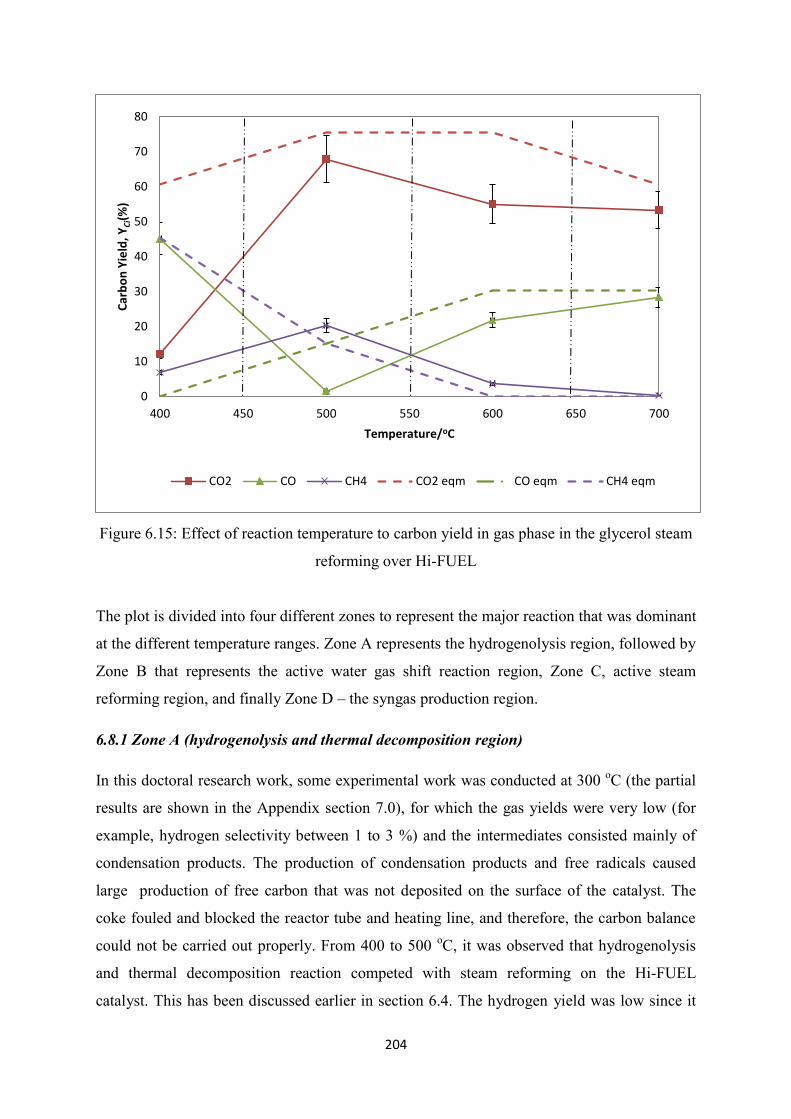
204
Figure 6.15: Effect of reaction temperature to carbon yield in gas phase in the glycerol steam
reforming over Hi-FUEL
The plot is divided into four different zones to represent the major reaction that was dominant
at the different temperature ranges. Zone A represents the hydrogenolysis region, followed by
Zone B that represents the active water gas shift reaction region, Zone C, active steam
reforming region, and finally Zone D – the syngas production region.
6.8.1 Zone A (hydrogenolysis and thermal decomposition region)
In this doctoral research work, some experimental work was conducted at 300 oC (the partial
results are shown in the Appendix section 7.0), for which the gas yields were very low (for
example, hydrogen selectivity between 1 to 3 %) and the intermediates consisted mainly of
condensation products. The production of condensation products and free radicals caused
large production of free carbon that was not deposited on the surface of the catalyst. The
coke fouled and blocked the reactor tube and heating line, and therefore, the carbon balance
could not be carried out properly. From 400 to 500 oC, it was observed that hydrogenolysis
and thermal decomposition reaction competed with steam reforming on the Hi-FUEL
catalyst. This has been discussed earlier in section 6.4. The hydrogen yield was low since it
0
10
20
30
40
50
60
70
80
400 450 500 550 600 650 700
Car
bo
n Y
ield
, YC
i(%)
Temperature/oC
CO2 CO CH4 CO2 eqm CO eqm CH4 eqm

205
was utilised at the same time in hydrogenolysis and hydrogenation, which ended up
producing a high amount of CO and a low amount of CO2. Therefore, there is a significant
difference between what was obtained experimentally and expected from the thermodynamic
analysis. The reaction over Hi-FUEL catalyst at this temperature suppressed methanation due
to other favourable reactions.
6.8.2 Zone B (Active Water Gas Shift Reaction)
An efficient water gas shift reaction was observed at 500 oC. The CO/CO2 ratio was at the
lowest point in the plot due to very low formation of CO and high production of CO2. The
water gas shift reaction (WGS) is shown in equation 6.30.
(6.30)
At this temperature, methane was produced at the expected selectivity, similarly, as predicted
by the thermodynamic equilibrium, while the hydrogen that was produced was slightly lower
than the equilibrium. This finding concurred with a study carried out by Sahoo et al. [22],
suggesting that the water gas shift reaction was active at 500 oC.
6.8.3 Zone C (Efficient Steam Reforming Reaction)
The reaction at 600 oC was discussed in detail in section 6.6. Although the selectivity of CO,
CO2, and CH4 achieved the equilibrium at space-time of 0.1 hour, as compared to Figures
6.16 and 6.17, the carbon yield for CO2 and CO, as shown in Figure 6.18, was lower than the
one predicted via Aspen-HYSYS. This suggested that the most possible loss of carbons was
via coke formation; this is discussed in detail in Chapter 8.
6.8.4 Zone D (Syngas Production Zone)
At 700 oC, the conversion of glycerol to gas phase was 100%. CO was largely produced and
this did not compromise the production of hydrogen as the occurrence of CO was at 400 oC.
Even though the hydrogen selectivity was lower than the equilibrium prediction, this reaction
zone was not governed by hydrogenolysis and CO was mainly produced via two possible
reactions, i.e. reverse water gas shift reaction (RWGS), and Boudouard reaction, as expressed
by Slinn et al. [23] in equation 6.31.

206
(6.31)
In Figure 6.18, the CO yield almost reached the equilibrium, while the CO2 yield was lower
than what was predicted. This suggests that there was also a possibility that the carbon
formation accounted for the carbon loss in the gas phase. In order to get more syngas, it is
therefore suggested to operate the reactor above 700 oC for this particular catalyst.
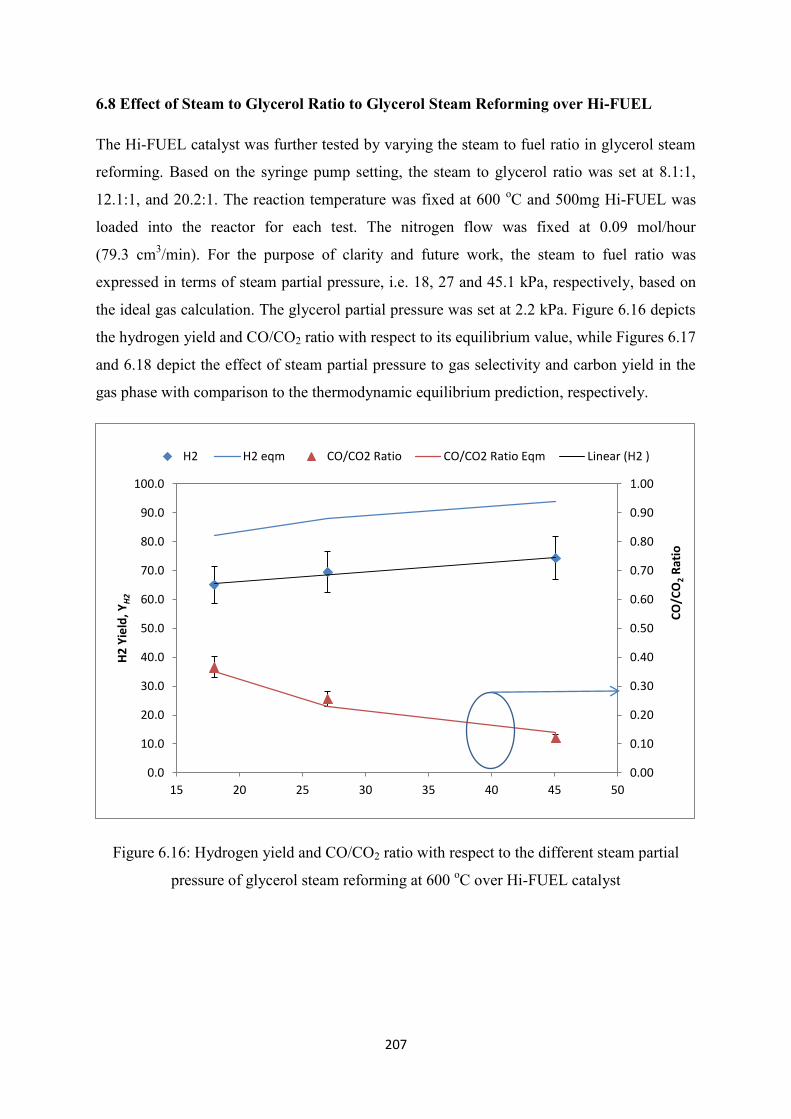
207
6.8 Effect of Steam to Glycerol Ratio to Glycerol Steam Reforming over Hi-FUEL
The Hi-FUEL catalyst was further tested by varying the steam to fuel ratio in glycerol steam
reforming. Based on the syringe pump setting, the steam to glycerol ratio was set at 8.1:1,
12.1:1, and 20.2:1. The reaction temperature was fixed at 600 oC and 500mg Hi-FUEL was
loaded into the reactor for each test. The nitrogen flow was fixed at 0.09 mol/hour
(79.3 cm3/min). For the purpose of clarity and future work, the steam to fuel ratio was
expressed in terms of steam partial pressure, i.e. 18, 27 and 45.1 kPa, respectively, based on
the ideal gas calculation. The glycerol partial pressure was set at 2.2 kPa. Figure 6.16 depicts
the hydrogen yield and CO/CO2 ratio with respect to its equilibrium value, while Figures 6.17
and 6.18 depict the effect of steam partial pressure to gas selectivity and carbon yield in the
gas phase with comparison to the thermodynamic equilibrium prediction, respectively.
Figure 6.16: Hydrogen yield and CO/CO2 ratio with respect to the different steam partial
pressure of glycerol steam reforming at 600 oC over Hi-FUEL catalyst
0.00
0.10
0.20
0.30
0.40
0.50
0.60
0.70
0.80
0.90
1.00
0.0
10.0
20.0
30.0
40.0
50.0
60.0
70.0
80.0
90.0
100.0
15 20 25 30 35 40 45 50
CO
/CO
2 R
atio
H2
Yie
ld, Y
H2
H2 H2 eqm CO/CO2 Ratio CO/CO2 Ratio Eqm Linear (H2 )

208
Figure 6.17: Gas selectivity with respect to the different steam partial pressure of glycerol
steam reforming at 600 oC over Hi-FUEL catalyst
Figure 6.18: Gas phase carbon yield with respect to the different steam partial pressure of
glycerol steam reforming at 600 oC over Hi-FUEL catalyst
R² = 0.9902
R² = 0.9947
R² = 0.9954
0
10
20
30
40
50
60
70
80
90
100
15 20 25 30 35 40 45 50
Sele
ctiv
ity
(%)
Steam Partial Pressure (kPa)
CH4 CO2 CO CH4 eqm CO2 eqm CO eqm
0
10
20
30
40
50
60
70
80
90
100
15 20 25 30 35 40 45 50
Car
bo
n Y
ield
, YC
i (%
)
Steam Partial Pressure (kPa)
CH4 CO2 CO CH4 eqm CO2 eqm CO eqm

209
Figure 6.16 implies that the hydrogen yield was lower, but it followed a linear trend as the
steam partial pressure increased. In addition, the CO/CO2 ratio met the equilibrium value. In
Figure 6.17, all the carbon based gas selectivity fitted the equilibrium prediction. There were
no other gases formed other than what was illustrated. As the steam partial pressure
increased, steam reforming assisted with the water gas shift reaction becoming more
dominant than any other side reactions. The CO and CH4 selectivity reduced, whilst the CO2
selectivity increased. All the other gases selectivity could also be fitted into a linear trend
line. Even though operating at a higher steam partial pressure was desirable, the main concern
was a huge reactor loading that would lead to extra infrastructure and operational costs [24].
Figure 6.18 depicts the carbon yield of the carbon based gases produced. The CO2 produced
was lower than the equilibrium, which suggests that some of the carbon atoms might be lost
to form coke or due to carbon balance error, but, as the steam partial pressure increased, the
gap became closer, implying that the coke formed would probably lessen.
6.9 Comparison between Hi-FUEL and commercial Ni/Al2O3 on Glycerol Steam
Reforming
A performance comparison between two commercial catalysts, Hi-FUEL and Ni/Al(C), was
carried out to investigate the effect of calcium as a promoter to the catalyst. The catalyst
characterisation analysis for Ni/Al(C) is described in Chapter 4. The reactor temperature was
again fixed at 600 oC, as that was the best temperature to observe the optimum catalytic
activity for both catalysts. Other conditions, such as the GHSV, vaporiser temperature, and
steam to fuel ratio at 8.1:1, remained constant. Two different catalyst loadings were chosen
for both catalysts, i.e. 150mg and 500 mg, to represent the space-time of 0.029 and 0.1 hour,
respectively. The results were also compared with the thermodynamic equilibrium, as
simulated by Aspen-HYSYS. The aqueous phase product yield is depicted in Figure 6.19,
while the carbon gas selectivity is shown in Figure 6.20. The hydrogen yield and carbon yield
in the gas phase are shown in Figure 6.21.
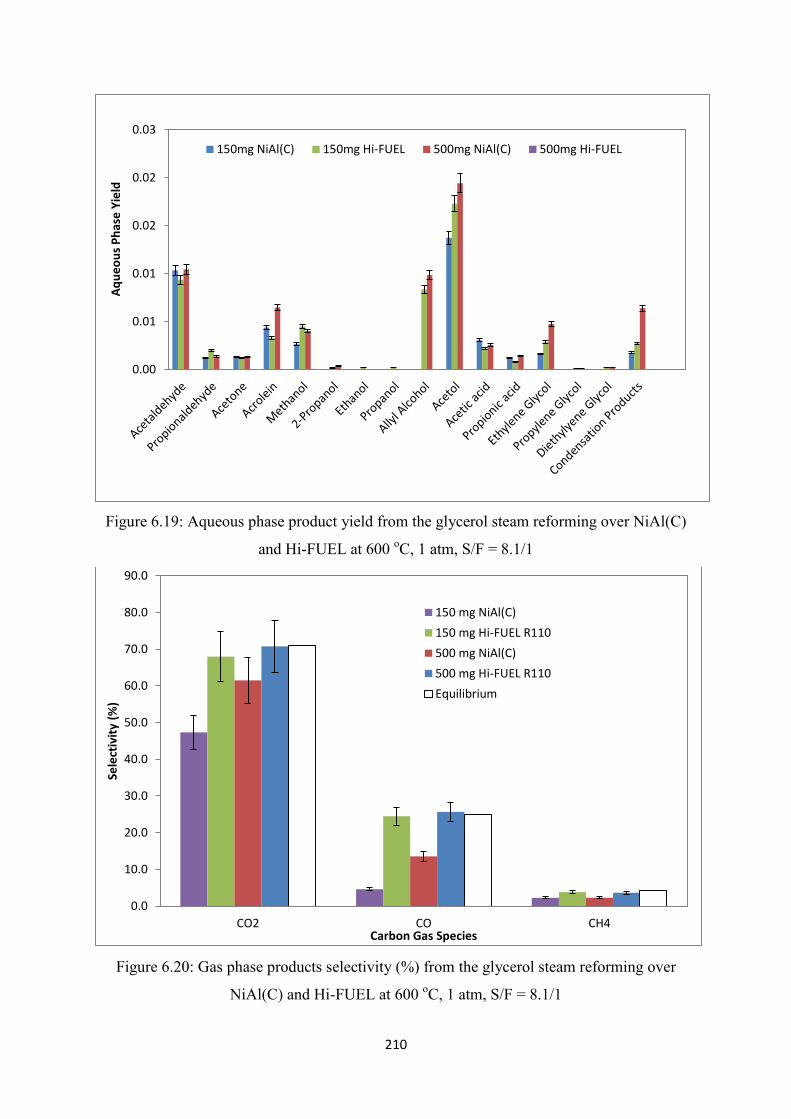
210
Figure 6.19: Aqueous phase product yield from the glycerol steam reforming over NiAl(C)
and Hi-FUEL at 600 oC, 1 atm, S/F = 8.1/1
Figure 6.20: Gas phase products selectivity (%) from the glycerol steam reforming over
NiAl(C) and Hi-FUEL at 600 oC, 1 atm, S/F = 8.1/1
0.00
0.01
0.01
0.02
0.02
0.03A
qu
eo
us
Ph
ase
Yie
ld
150mg NiAl(C) 150mg Hi-FUEL 500mg NiAl(C) 500mg Hi-FUEL
0.0
10.0
20.0
30.0
40.0
50.0
60.0
70.0
80.0
90.0
CO2 CO CH4
Sele
ctiv
ity
(%)
Carbon Gas Species
150 mg NiAl(C)
150 mg Hi-FUEL R110
500 mg NiAl(C)
500 mg Hi-FUEL R110
Equilibrium
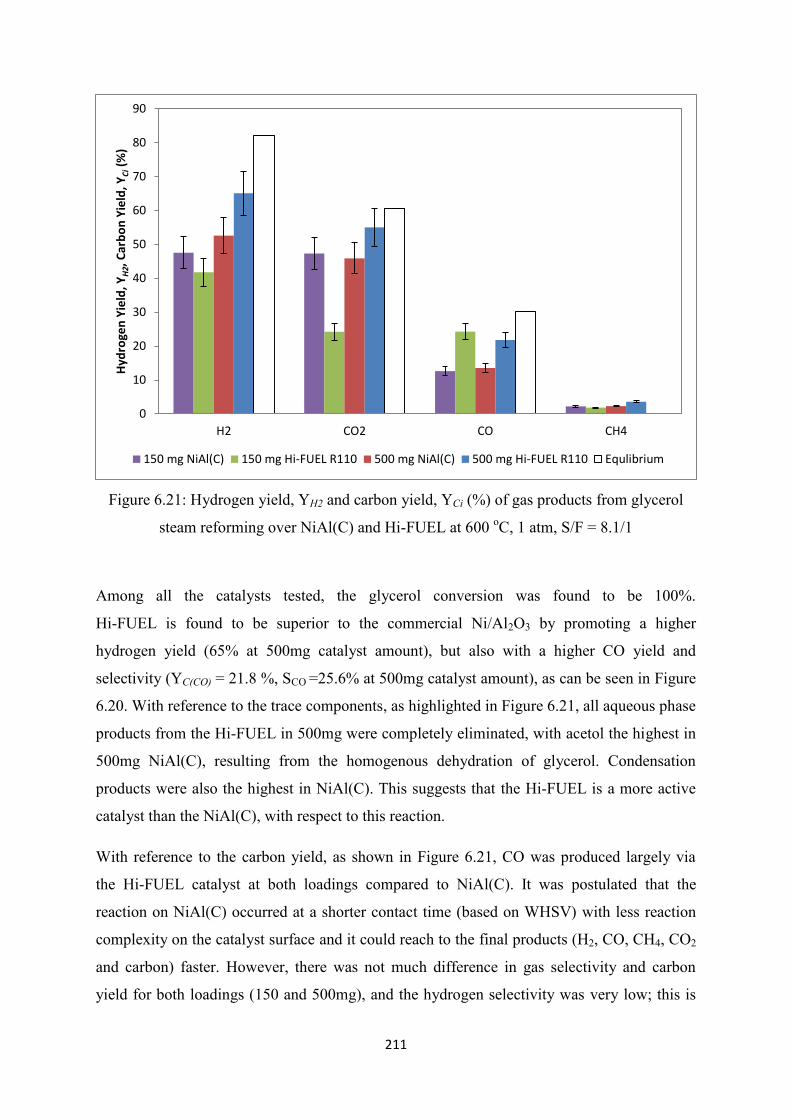
211
Figure 6.21: Hydrogen yield, YH2 and carbon yield, YCi (%) of gas products from glycerol
steam reforming over NiAl(C) and Hi-FUEL at 600 oC, 1 atm, S/F = 8.1/1
Among all the catalysts tested, the glycerol conversion was found to be 100%.
Hi-FUEL is found to be superior to the commercial Ni/Al2O3 by promoting a higher
hydrogen yield (65% at 500mg catalyst amount), but also with a higher CO yield and
selectivity (YC(CO) = 21.8 %, SCO =25.6% at 500mg catalyst amount), as can be seen in Figure
6.20. With reference to the trace components, as highlighted in Figure 6.21, all aqueous phase
products from the Hi-FUEL in 500mg were completely eliminated, with acetol the highest in
500mg NiAl(C), resulting from the homogenous dehydration of glycerol. Condensation
products were also the highest in NiAl(C). This suggests that the Hi-FUEL is a more active
catalyst than the NiAl(C), with respect to this reaction.
With reference to the carbon yield, as shown in Figure 6.21, CO was produced largely via
the Hi-FUEL catalyst at both loadings compared to NiAl(C). It was postulated that the
reaction on NiAl(C) occurred at a shorter contact time (based on WHSV) with less reaction
complexity on the catalyst surface and it could reach to the final products (H2, CO, CH4, CO2
and carbon) faster. However, there was not much difference in gas selectivity and carbon
yield for both loadings (150 and 500mg), and the hydrogen selectivity was very low; this is
0
10
20
30
40
50
60
70
80
90
H2 CO2 CO CH4
Hyd
roge
n Y
ield
, YH
2, C
arb
on
Yie
ld, Y
Ci (
%)
150 mg NiAl(C) 150 mg Hi-FUEL R110 500 mg NiAl(C) 500 mg Hi-FUEL R110 Equlibrium
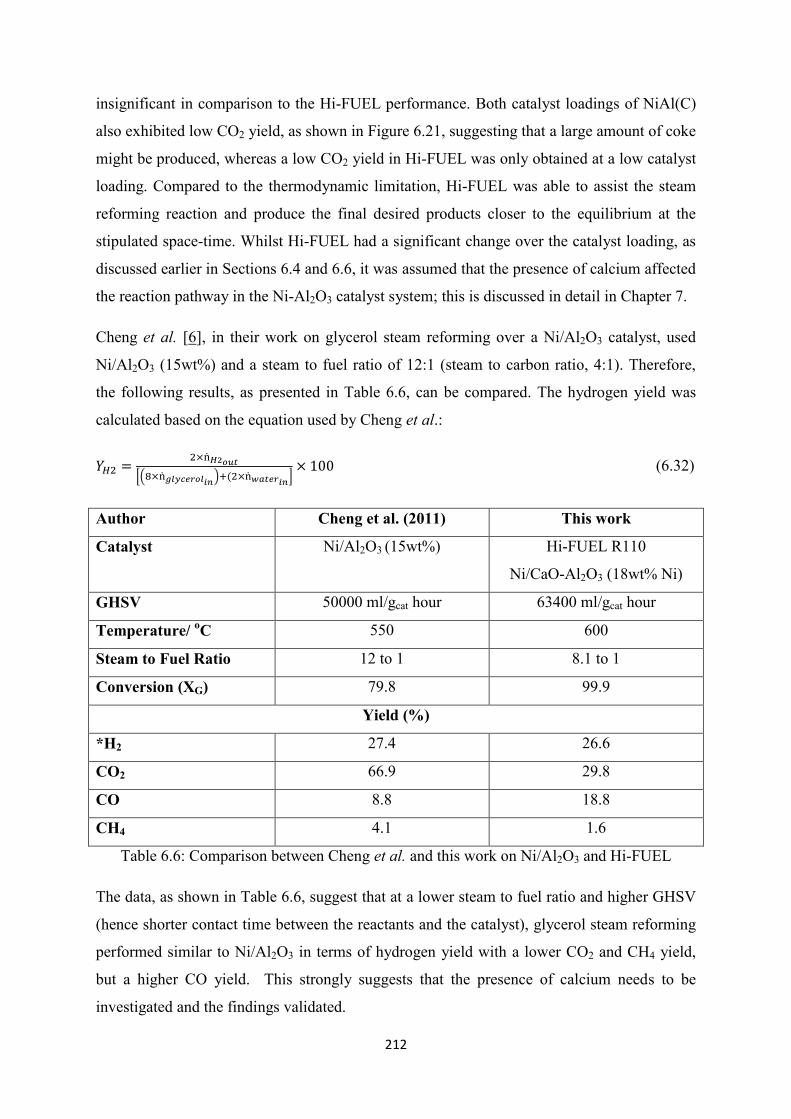
212
insignificant in comparison to the Hi-FUEL performance. Both catalyst loadings of NiAl(C)
also exhibited low CO2 yield, as shown in Figure 6.21, suggesting that a large amount of coke
might be produced, whereas a low CO2 yield in Hi-FUEL was only obtained at a low catalyst
loading. Compared to the thermodynamic limitation, Hi-FUEL was able to assist the steam
reforming reaction and produce the final desired products closer to the equilibrium at the
stipulated space-time. Whilst Hi-FUEL had a significant change over the catalyst loading, as
discussed earlier in Sections 6.4 and 6.6, it was assumed that the presence of calcium affected
the reaction pathway in the Ni-Al2O3 catalyst system; this is discussed in detail in Chapter 7.
Cheng et al. [6], in their work on glycerol steam reforming over a Ni/Al2O3 catalyst, used
Ni/Al2O3 (15wt%) and a steam to fuel ratio of 12:1 (steam to carbon ratio, 4:1). Therefore,
the following results, as presented in Table 6.6, can be compared. The hydrogen yield was
calculated based on the equation used by Cheng et al.:
[( )
] (6.32)
Author Cheng et al. (2011) This work
Catalyst Ni/Al2O3 (15wt%) Hi-FUEL R110
Ni/CaO-Al2O3 (18wt% Ni)
GHSV 50000 ml/gcat hour 63400 ml/gcat hour
Temperature/ oC 550 600
Steam to Fuel Ratio 12 to 1 8.1 to 1
Conversion (XG) 79.8 99.9
Yield (%)
*H2 27.4 26.6
CO2 66.9 29.8
CO 8.8 18.8
CH4 4.1 1.6
Table 6.6: Comparison between Cheng et al. and this work on Ni/Al2O3 and Hi-FUEL
The data, as shown in Table 6.6, suggest that at a lower steam to fuel ratio and higher GHSV
(hence shorter contact time between the reactants and the catalyst), glycerol steam reforming
performed similar to Ni/Al2O3 in terms of hydrogen yield with a lower CO2 and CH4 yield,
but a higher CO yield. This strongly suggests that the presence of calcium needs to be
investigated and the findings validated.

213
6.10 Time on Stream (TOS) Analysis on Glycerol Steam Reforming over Hi-FUEL
Figures 6.22 and 6.23 depict the carbon gas selectivity (%) and hydrogen and carbon gas
yield (%) resulting from the TOS experiment on glycerol steam reforming over
the Hi-FUEL catalyst. The reaction was conducted at a steam to fuel ratio of 8.1:1 and 600 oC
for 510 minutes. In the first 30 minutes, the hydrogen yield (Figure 6.23) was at the highest
with the reactants in contact with the fresh catalyst. As time passed, the selectivity of CO2,
CO, and CH4 was consistent throughout the 510 minutes of reaction, which could be similarly
explained by analysing the carbon yield of the gas products. The hydrogen yield decreased at
a constant rate, but the reaction over this catalyst could be prolonged without significant
deactivation. The reduction of hydrogen selectivity was possible due to coke formation,
which might block the active metal site, and, hence, reduce the reforming activity.
Nevertheless, it was calculated that the catalyst would take a longer time to fully deactivate.
The presence of calcium was assumed to be the main factor that could prolong this reaction
without significant deactivation. This is similarly reported by Bellido and Assaf [25] in their
work with NiCSZ (Nickel impregnated on ZrO2 stabilised with CaO) and Elias et al. [26] in
their work of Ni-Ca/Al2O3 with regard to ethanol steam reforming. Elias et al. proposed that
there was no significant deactivation during the 24-hour operation with rich H2 production at
57% at 650 oC. Bellido and Assaf recommended that by introducing CaO into the ZrO2
support, the hydrogen composition improved in comparison to Ni on ZrO2 alone and the
catalyst was stabilised throughout the 350 minutes of reaction. However, the presence of
calcium might form some coke, and, possibly, simultaneously promote coke gasification, as
suggested by Choong et al. [27].

214
Figure 6.22: Gas phase products selectivity from TOS of glycerol steam reforming over Hi-
FUEL catalyst at 600 oC, 1 atm and S/F = 8.1/1
Figure 6.23: Hydrogen yield and gas phase carbon yield from TOS of glycerol steam
reforming over Hi-FUEL catalyst at 600 oC, 1 atm and S/F = 8.1/1
0.0
10.0
20.0
30.0
40.0
50.0
60.0
70.0
80.0
0 100 200 300 400 500
Sele
ctiv
ity
(%)
Time (min)
CO2 CO CH4
0
10
20
30
40
50
60
70
80
90
0 100 200 300 400 500
Hyd
roge
n Y
ield
, YH
2 an
d C
arb
on
Yie
ld, Y
Ci (
%)
Time (min)
CO2 CO CH4 H2

215
6.11 Conclusion
The glycerol steam reforming study was carried out successfully over the Hi-FUEL catalyst.
Various parameters were examined, such as the effect of catalyst loading or WHSV at 400
and 600 oC, the effect of adding hydrogen to the reaction, the effect of reaction temperature,
the effect of steam to fuel ratio and TOS analysis. All the parameters were compared with the
thermodynamic equilibrium analysis via Gibbs free energy minimisation method, as
simulated by Aspen-HYSYS.
Based on the blank test using an empty tube (BT), a tube filled with quartz wool (QW), and a
tube filled with silica carbide (SiC), it was observed that glycerol was fully converted to other
aqueous phase intermediates and gases at all temperatures tested. Three major products were
formed: condensation products, allyl alcohol and acetol, which resulted from thermal
decomposition and polymerization, dehydration, and hydrogenation, respectively.
When Hi-FUEL was introduced to the reaction, it was found that at 400 and 600 oC,
the reaction carried out over the Hi-FUEL catalyst behaved differently. At 400 oC, the Hi-
FUEL promoted hydrogenolysis and hydrogenation, and, hence, reduced the amount of CO2
produced, but increased the amount of CO as the space-time increased. The methanation
however, was suppressed due to the favourable production of CO and other hydrocarbons
related to hydrogenolysis reactions. There was, however, a tendency to promote methanation
at a higher catalyst loading as methane started to increase at a longer contact time. At 600 oC,
steam reforming of glycerol was active, which was largely dominated by the decomposition
of glycerol to CO and H2, followed by the water gas shift reaction to convert CO into CO2.
The selectivity of the carbon based gases almost approached the equilibrium as the catalyst
loading increased, but the hydrogen yield was lower than the equilibrium value due to the
presence of the other side of the reaction, such as hydrogenation. The methanation reaction
did not occur as methane underwent steam reforming, and, hence, the formation of methane
was low. A further benchmark study was made against a study on acetol steam reforming.
The finding clearly suggests that acetol steam reforming occurred at a higher catalyst loading,
i.e. at a longer space-time, and hydrogen production at a lower catalyst loading was produced
by other reactions, namely, catalytic cracking of condensation products or dehydrogenation.
The production of ethane and ethylene was from the acetol cracking activity, but not for
propane production, which, as suggested earlier, was produced from the allyl alcohol

216
hydrogenation reaction. In addition, the higher CO yield in the Ca modified Ni/Al2O3 catalyst
was confirmed from the benchmark study.
Furthermore, in order to confirm that the Hi-FUEL catalyst promoted hydrogenolysis,
hydrogen was added into the reaction at 400 oC, and it was found that the hydrogen was used
up to produce primary hydrogenolysis products, such as ethylene glycol and methanol, and
other products, such as 1-propanol, 2-propanol, and propylene glycol. The hydrogen was also
consumed to produce gases, such as ethylene, ethane, and propane.
In a further test, the Hi-FUEL catalyst was also experimented at different reaction
temperatures ranging from 400 to 700 oC. Prior to these temperatures, condensation reactions
dominated and produced large amounts of condensation products, as well as fouling the
reactor tube and heating lines. The reaction temperatures tested were divided into four main
zones or regions depending on the dominance of the reaction, i.e. Zone A at 400 oC, which
was largely dominated by hydrogenolysis and thermal decomposition; and Zone B at 500 oC,
where the water gas shift reaction was active. In Zone C at 600 oC, the steam reforming was
active, and in Zone D, i.e. above 700 oC was a syn gas production controlled region.
By varying the steam to fuel ratio and representing it as an effect of the steam partial pressure
to the reaction system, it was discovered that by adding more steam, the CO2 and H2 yield
would increase linearly. Similarly, the CO and CH4 yield and selectivity decreased linearly.
The hydrogen selectivity was closer to the equilibrium as more steam was added. This was
possible since the added steam reduced the other reactions that may occur at low steam
partial pressure, promoting a steam reforming reaction, as well as water gas shift reaction.
It was also believed that the promotion of calcium affected the reaction pathway of glycerol
steam reforming. Therefore, the Hi-FUEL was compared at 600 oC with a commercial
nickel/alumina catalyst denoted as NiAl(C) using two catalyst loadings. The results proposed
that a higher hydrogen yield could be obtained from the Hi-FUEL catalyst, but it also
produced higher CO production at a lower catalyst loading. As for NiAl(C), increasing the
catalyst loading did not significantly change the gas selectivity, although, at a low catalyst
loading, it promoted a higher hydrogen yield in comparison to the Hi-FUEL. This was
postulated to result from the absence of calcium, which reduced the reaction complexity that
occurred over the catalyst surfaces.

217
The TOS analysis results suggested that the glycerol steam reforming reaction could be
prolonged over the Hi-FUEL catalyst since the catalyst was very active and the carbon yield
of the carbon based gases remained constant throughout the 510 minutes of the reaction. The
hydrogen yield was lower as time passed, which was assumed to be caused by the production
of coke that blocked the active metal site.
Hi-FUEL catalyst was found to be active in glycerol steam reforming, as well as for syn gas
production. The presence of calcium is therefore significant and needs to be explored further.
Therefore, a detailed analysis, such as testing the breakdown of the Hi-FUEL components of
glycerol steam reforming is discussed in the next chapter to identify the reaction pathway of
glycerol steam reforming over a Ni-Ca/Al2O3 catalyst.

218
6.12 References
[1] P. N. Kechagiopoulos, S. S. Voutetakis, A. A. Lemonidou, and I. A. Vasalos,
"Sustainable hydrogen production via reforming of ethylene glycol using a novel
spouted bed reactor," Catalysis Today, vol. 127, pp. 246-255, 2007.
[2] R. Buitrago-Sierra, J. Ruiz-Martínez, J. C. Serrano-Ruiz, F. Rodríguez-Reinoso, and
A. Sepúlveda-Escribano, "Ethanol steam reforming on Ni/Al2O3 catalysts: Effect of
the addition of Zn and Pt," Journal of Colloid and Interface Science, vol. 383, pp.
148-154, 2012.
[3] A. J. Vizcaino, A. Carriero, and J. A. Calles, "Hydrogen production by ethanol steam
reforming over Cu-Ni supported catalysts," International Journal of Hydrogen
Energy, vol. 32, pp. 1450-1461, Jul-Aug 2007.
[4] M. Benito, R. Padilla, A. Serrano-Lotina, L. Rodriguez, J. J. Brey, and L. Daza, "The
role of surface reactions on the active and selective catalyst design for bioethanol
steam reforming," Journal of Power Sources, vol. 192, pp. 158-164, Jul 1 2009.
[5] S. Adhikari, S. D. Fernando, and A. Haryanto, "Hydrogen production from glycerin
by steam reforming over nickel catalysts," Renewable Energy, vol. 33, pp. 1097-1100,
2008.
[6] C. K. Cheng, S. Y. Foo, and A. A. Adesina, "Steam reforming of glycerol over
Ni/Al2O3 catalyst," Catalysis Today, vol. 178, pp. 25-33, Dec 15 2011.
[7] E. A. Sánchez, M. A. D'Angelo, and R. A. Comelli, "Hydrogen production from
glycerol on Ni/Al2O3 catalyst," International Journal of Hydrogen Energy, vol. 35,
pp. 5902-5907, 2010.
[8] A. Iriondo, V. L. Barrio, J. F. Cambra, P. L. Arias, M. B. Guemez, M. C. Sanchez-
Sanchez, R. M. Navarro, and J. L. G. Fierro, "Glycerol steam reforming over Ni
catalysts supported on ceria and ceria-promoted alumina," International Journal of
Hydrogen Energy, vol. 35, pp. 11622-11633, 2010.
[9] V. Chiodo, S. Freni, A. Galvagno, N. Mondello, and F. Frusteri, "Catalytic features of
Rh and Ni supported catalysts in the steam reforming of glycerol to produce
hydrogen," Applied Catalysis A: General, vol. 381, pp. 1-7, 2010.
[10] A. Konaka, T. Tago, T. Yoshikawa, A. Nakamura, and T. Masuda, "Conversion of
glycerol into allyl alcohol over potassium-supported zirconia–iron oxide catalyst,"
Applied Catalysis B: Environmental.

219
[11] D. Stošić, S. Bennici, J.-L. Couturier, J.-L. Dubois, and A. Auroux, "Influence of
surface acid–base properties of zirconia and titania based catalysts on the product
selectivity in gas phase dehydration of glycerol," Catalysis Communications, vol. 17,
pp. 23-28, 2012.
[12] L. Qadariyah, Mahfud, Sumarno, S. Machmudah, Wahyudiono, M. Sasaki, and M.
Goto, "Degradation of glycerol using hydrothermal process," Bioresource
Technology, vol. 102, pp. 9267-9271, 2011.
[13] Y. Liu, H. Tuysuz, C.-J. Jia, M. Schwickardi, R. Rinaldi, A.-H. Lu, W. Schmidt, and
F. Schuth, "From glycerol to allyl alcohol: iron oxide catalyzed dehydration and
consecutive hydrogen transfer," Chemical Communications, vol. 46, pp. 1238-1240,
2010.
[14] S. Adhikari, S. D. Fernando, S. D. F. To, R. M. Bricka, P. H. Steele, and A. Haryanto,
"Conversion of glycerol to hydrogen via a steam reforming process over nickel
catalysts," Energy & Fuels, vol. 22, pp. 1220-1226, Mar-Apr 2008.
[15] A. Wawrzetz, B. Peng, A. Hrabar, A. Jentys, A. A. Lemonidou, and J. A. Lercher,
"Towards understanding the bifunctional hydrodeoxygenation and aqueous phase
reforming of glycerol," Journal of Catalysis, vol. 269, pp. 411-420, 2010.
[16] E. Z. Costin Sorin Bildea, Grigore Bozga, Gheorghe Soare, "Conceptual design of
glycerol hydrogenolysis plant " 20th European Symposium on Computer Aided
Process Engineering – ESCAPE20 2010.
[17] M. A. Dasari, P. P. Kiatsimkul, W. R. Sutterlin, and G. J. Suppes, "Low-pressure
hydrogenolysis of glycerol to propylene glycol," Applied Catalysis a-General, vol.
281, pp. 225-231, Mar 18 2005.
[18] E. P. Maris and R. J. Davis, "Hydrogenolysis of glycerol over carbon-supported Ru
and Pt catalysts," Journal of Catalysis, vol. 249, pp. 328-337, Jul 25 2007.
[19] T. Miyazawa, S. Koso, K. Kunimori, and K. Tomishige, "Development of a Ru/C
catalyst for glycerol hydrogenolysis in combination with an ion-exchange resin,"
Applied Catalysis a-General, vol. 318, pp. 244-251, Feb 20 2007.
[20] J. A. Posada, L. E. Rincon, and C. A. Cardona, "Design and analysis of biorefineries
based on raw glycerol: Addressing the glycerol problem," Bioresource Technology,
vol. 111, pp. 282-293, May 2012.
[21] J. A. Medrano, M. Oliva, J. Ruiz, L. Garcia, and J. Afauzo, "Catalytic steam
reforming of model compounds of biomass pyrolysis liquids in fluidized bed reactor

220
with modified Ni/Al catalysts," Journal of Analytical and Applied Pyrolysis, vol. 85,
pp. 214-225, May 2009.
[22] D. R. Sahoo, S. Vajpai, S. Patel, and K. K. Pant, "Kinetic modeling of steam
reforming of ethanol for the production of hydrogen over Co/Al2O3 catalyst,"
Chemical Engineering Journal, vol. 125, pp. 139-147, 2007.
[23] M. Slinn, K. Kendall, C. Mallon, and J. Andrews, "Steam reforming of biodiesel by-
product to make renewable hydrogen," Bioresource Technology, vol. 99, pp. 5851-
5858, 2008.
[24] A. M. Karim, Y. Su, J. Sun, C. Yang, J. J. Strohm, D. L. King, and Y. Wang, "A
comparative study between Co and Rh for steam reforming of ethanol," Applied
Catalysis B: Environmental, vol. 96, pp. 441-448, 2010.
[25] J. D. A. Bellido and E. M. Assaf, "Nickel catalysts supported on ZrO2, Y2O3-
stabilized ZrO2 and CaO-stabilized ZrO2 for the steam reforming of ethanol: Effect
of the support and nickel load," Journal of Power Sources, vol. 177, pp. 24-32, 2008.
[26] K. F. M. Elias, A. F. Lucredio, and E. M. Assaf, "Effect of CaO addition on acid
properties of Ni-Ca/Al2O3 catalysts applied to ethanol steam reforming,"
International Journal of Hydrogen Energy, vol. 38, pp. 4407-4417, Apr 15 2013.
[27] C. K. S. Choong, Z. Y. Zhong, L. Huang, Z. Wang, T. P. Ang, A. Borgna, J. Y. Lin,
L. Hong, and L. W. Chen, "Effect of calcium addition on catalytic ethanol steam
reforming of Ni/Al2O3: I. Catalytic stability, electronic properties and coking
mechanism," Applied Catalysis a-General, vol. 407, pp. 145-154, Nov 4 2011.

221
CHAPTER 7: EFFECT OF DOPING CALCIUM TO NICKEL/ALUMINA
CATALYST IN GLYCEROL STEAM REFORMING
7.1 Introduction
The findings, as discussed in Chapter 6, revealed that the Hi-FUEL catalyst behaved
differently in comparison to a typical nickel supported alumina catalyst. The Hi-FUEL was
able to promote higher hydrogen selectivity in comparison to Ni/Al2O3. However, it was also
discovered that the Hi-FUEL increased the amount of CO production, especially at 400 oC.
This contrasts to an earlier assumption made during the thermodynamic equilibrium analysis,
which presumed that higher levels of CO2 and lower amounts of CO would be produced from
the reaction at this temperature. Further experiments of the reaction at 600 oC also indicated
that higher CO was produced at a low catalyst loading, but achieved high CO2 selectivity at
an extended contact time.
The main objective of this chapter is to investigate the effects of calcium promotion on the
nickel/alumina catalyst by studying the variation of calcium loading and the reaction involved
on the surface of the catalyst itself. The findings from the Hi-FUEL and the prepared
catalysts on glycerol steam reforming are also compared against other findings. These include
the findings from several other established researchers on group II alkaline metal doped
nickel based catalysts.
7.2 Comparison between synthesised Ni/Al2O3 and commercial Ni/Al2O3
A similar catalyst (15 wt.% Ni on γ-alumina) to commercial Ni/Al2O3 (NiAl(C)) was
prepared via the impregnation method, as discussed in Chapter 4, which is denoted as
NiAl(S). This was to compare the performance of both catalysts and as a benchmark if the
preparation of all the catalysts was within acceptable procedures. Both catalysts were tested
at 600 oC, with a catalyst loading of 500mg (WHSV of 10.5 gflow/gcatalyst hour-
1). The other
parameters were maintained at constant (steam to fuel ratio 8.1:1, GHSV = 2220/hr).
Figures 7.1 and 7.2 depict the selectivity and the carbon yield of the outlet gaseous products
for the two catalysts tested compared to thermodynamic equilibrium. The glycerol conversion
for NiAl(S) was 100% and the aqueous phase products were mere traces.

222
Figure 7.1: The selectivity of gas phase products for NiAl(C) and NiAl(S) on glycerol steam
reforming at 600 oC, steam to fuel ratio 8.1:1, WHSV = 15.3 gflow/gcatalyst hour
Figure 7.2: Hydrogen yield, YH2 and carbon yield, YCi of carbon based gases produced from
glycerol steam reforming over NiAl(C) and NiAl(S)
61.5
13.5
2.3
65.4
14.9
1.6
71
25
4.2
CO2 CO CH4
Sele
ctiv
ity
(%)
NiAl(C) 500mg NiAl(S) 500mg Equilibrium
52.6
45.9
13.5
2.3
58.0
49.0
13.8
1.6
82
60.48
30.24
0.00
H2 CO2 CO CH4
Hyd
roge
n Y
ield
, YH
2,C
arb
on
Yie
ld, Y
Ci (
%)
NiAl(C)
NiAl(S)
Equilibrium at 600C

223
With reference to Figure 7.1, it was discovered that there were no significant differences in
the performance of both catalysts, suggesting that NiAl(S) can be further used as a
comparison with other prepared catalysts. The findings obtained from both catalysts support
the findings presented by Cheng et al. [1], in which Ni/Al2O3 raised the CO2 selectivity and
lowered the CO selectivity. In Figure 7.1, the carbon gas selectivity reached the targeted
equilibrium; however, the hydrogen produced was approximately 30% lower in its selectivity
when compared with the thermodynamic analysis prediction. The reduction of hydrogen
suggested that hydrogen might be used to promote hydrogenation of other unknown
components. Contrary to the selectivity, the carbon yield CH4 of CO, CO2 did not reach the
targeted equilibrium, as depicted in Figure 7.2. This indicated that the formation of coke
might have blocked the active metal site.
7.3 Effects of Calcium Loading to Alumina
Numerous researches that were carried out earlier mostly focused on identifying other
potential uses of glycerol produced from biodiesel plants. This research work concentrated on
glycerol hydrogenolysis, at high pressure and low temperature region. Bildea et al. [2]
combined and summarised the chemical reactions that occurred during glycerol
hydrogenolysis in the presence of metallic catalysts. The proposed reaction pathways of
glycerol hydrogenolysis were suggested by Miyazawa et al., Dasari et al. and Maris and
Davis [3-5]. The following diagrams in Figures 7.3 (a) and (b) depict the reaction package of
Miyazawa et al. and further improved by Bildea et al., respectively.
(a)
Glycerol
Acetol 1,2-propanediol
3-Hydroxypropionaldehyde 1,3-propanediol
1-propanol
2-propanol
Ethanol
Methane Ethylene Glycol
Methanol
Ethanol
-H2O
-H2O
+H2
+H2
+H2
-H2O
+H2
+H2

224
(b)
Figure 7.3: Chemical reactions (re-sketched) occurring during glycerol hydrogenolysis as
summarised by (a) Miyazawa et al. (b) Bildea et al.
The addition of calcium as a promoter in the Hi-FUEL was believed to boost the
hydrogenolysis and hydrogenation of some intermediates in glycerol steam reforming.
Although hydrogen was used up for these particular reactions, the production of hydrogen
was higher than the typical nickel/alumina catalyst. In order to validate this assumption,
calcium was doped on γ-alumina with different weight percentages and tested in glycerol
steam reforming. To identify the route of the reaction that took place over the calcium surface
of the Hi-FUEL catalyst, 500mg of 3, 7, and 9 wt% Ca was impregnated on γ-alumina and
calcined alumina alone (γ-alumina), denoted as 3Ca, 7Ca, 9Ca, and Al2O3, and were tested on
glycerol steam reforming at 600 oC. This reaction temperature was chosen to reduce the
homogenous reactions and large formations of condensation products and free radicals that
might have taken place due to the reduced catalytic activity on calcium and alumina at low
temperature.
Glycerol
Acetol 1,2-propanediol
3-Hydroxypropionaldehyde 1,3-propanediol
1-propanol
Ethanol
+ Methanol Ethylene Glycol + Methanol
-H2O
-H2O
+H2
+H2
+H2
+H2
+H2
2-propanol +H
2
Gly A GA + FA Ethylene Glycol + Methanol
DEG
-H2

225
Figure 7.4: Aqueous phase products’ yield (%) of glycerol steam reforming over Al2O3, 3Ca, 7Ca, and 9Ca at 600 oC, 1 atm
0.00
0.02
0.04
0.06
0.08
0.10
0.12
Yie
ld (
%)
Al2O3 3Ca 7Ca 9Ca

226
Figure 7.5: Carbon gas products selectivity of glycerol steam reforming over the prepared
xCa/Al2O3 catalysts at 600 oC and 1 atm.
Figure 7.6: Carbon yield of gas phase products from glycerol steam reforming over the
prepared xCa/Al2O3 catalysts at 600 oC and 1 atm.
0.0
10.0
20.0
30.0
40.0
50.0
60.0
70.0
CO2 CO CH4 C2H6 C2H4 C3H8
Sele
ctiv
ity
(%)
Species
Al2O3
3Ca
7Ca
9Ca
0
5
10
15
20
25
30
CO2 CO CH4 C2H6 C2H4 C3H8
Car
bo
n Y
ield
(%
)
Al2O3 3Ca 7Ca 9Ca

227
Figure 7.7: Hydrogen yield and CO/CO2 ratio of the glycerol steam reforming at 600 oC and
1 atm over xCa/Al2O3 (x=0, 3, 7 and 9 wt% of Ca)
Figure 7.4 depicts the aqueous phase product yield or intermediates produced from the steam
reforming of glycerol over xCa/Al2O3, of which x=0, 3, 7, and 9 wt% of Ca, respectively.
Figures 7.5 and 7.6 demonstrate the carbon gas product selectivity and the carbon yield of the
gas products over the prepared catalysts, respectively. In Figure 7.7, the H2 yield and CO/CO2
ratio are demonstrated.
By referring to Figure 7.4, a consistent trend was identified of which the allyl alcohol and
acetol productions were produced at a very low yield, which suggested that the allyl alcohol
and the acetol were likely converted into different products. Meanwhile, glycerol
hydrogenolysis, hydrogenation, and dehydration dominated the overall reactions. The
hydrogenolysis reaction can be identified in Figure 7.4 by the presence of large amounts of
methanol. The presence of methanol was discussed earlier in Chapter 6. The hydrogenolysis
postulation was validated by the presence of considerably larger amounts of other
intermediates over xCa/Al2O3 catalysts, which were traces (less than 1% selectivity) when the
Hi-FUEL was used in the reaction. Some of these examples were ethanol, propionic acid,
butyric acid, diethylene glycol, and 1,2-propane diol (propylene glycol). With reference to
Figure 7.3 and comparing this with Figure 7.4, it can be deduced that in the presence of
calcium and without the presence of nickel, glycerol favoured hydrogenolysis that produced
large amounts of methanol (and ethylene glycol). Methanol production increased with the
increase of calcium loading. However, ethylene glycol did not materialize in large yields in
R² = 0.9971
0.0
0.5
1.0
1.5
2.0
2.5
3.0
3.5
4.0
0.0
2.0
4.0
6.0
8.0
10.0
12.0
14.0
16.0
0 2 4 6 8 10
CO
/CO
2 R
atio
H2
Yie
ld, Y
H2
xCa/Al2O3
H2 Yield
CO/CO2 Ratio
Linear (H2 Yield)

228
this experiment since ethylene glycol was postulated to form diethylene glycol (DEG). Figure
7.3 (b) describes how the mentioned reaction was made possible. Based on Figure 7.4, the
yield of diethylene glycol (DEG) could be multiplied by 4 (4 is the number of carbon atoms
in the DEG molecule) to reflect the carbon yield of DEG, which was consistent with the
carbon yield of methanol.
The glycerol dehydration resulted in not only the formation of acrolein, followed by
hydrogenation to acetone, but also caused the decomposition to acetaldehyde and carbon.
This finding corresponds with the proposal made by Chiodo et al. [6]. The reactions were
suggestively postulated as in the following:
(7.1)
(7.2)
(7.3)
The acrolein, acetone, and acetaldehyde productions, as shown in Figure 7.4, reflect a
consistent trend of which the increased yield of acetone and acetaldehyde would eventually
reduce the formation of acrolein. Although hydrogen was not supplied in the feed line, the
only possible immediate source of hydrogen for further hydrogenolysis was via the
decomposition of glycerol to acetaldehyde, as shown in equation 7.4, or the dissociative
chemisorption of steam on the calcium surface, as reported by Choong et al. [7]:
(7.4)
It was also interesting to note the presence of butyric acid, which is a component belonging to
the acetaldol group. This is an oily colourless liquid that was produced from two molecules of
condensed acetaldehydes, as well as a product of hydrogenolysis of glycerol. The image of

229
acetaldol mixture produced is shown in Figure 7.8. Acetaldol was largely produced in Al2O3
and 3Ca, but decreased as the calcium loading increased.
Figure 7.8: The image of aqueous phase product, which was
suspected to contain acetaldol over xCa/Al2O3 catalysts
With reference to Figures 7.3 (a) and (b), the proposed reaction pathway lacked some
important information, such as the formation of allyl alcohol as an intermediate in glycerol
reforming. As discussed in Chapter 6, allyl alcohol could be obtained in the presence of
acrolein, which reacts with hydrogen [8]. However, although in the presence of xCa/Al2O3,
the allyl alcohol had a low yield, in Chapter 6 it was shown that the allyl alcohol appeared at
low Hi-FUEL loading, as well as in the blank test study. The possible reaction to this was the
hydrogenation of allyl alcohol to propane (C3H8), as observed in Figures 7.5 and 7.6,
respectively. The acetol yield was also low on xCa/Al2O3 and Al2O3 due to the conversion of
acetol into some other products, most likely, propylene glycol. Propylene glycol might
further hydrogenate to produce 2-propanol. This reaction mechanism is represented in Figure
7.3 (b). The production of these components was proven, as demonstrated in Figure 7.4. It
can be postulated that acetol steam reforming is only active on nickel surfaces.
The proposed summary in Figure 7.3 also overlooked the glycerol hydrogenolysis or
hydrogenation that led to the formation of propane (C3H8), as shown in Figures 7.6 and 7.7.
Murata et al. [9] reported on propane formation using the aqueous phase reforming of
glycerol over Pt/H-ZSM5 catalysts. This was conducted at a higher pressure (2 MPa) and at a
relatively low temperature (270 oC) in the presence of hydrogen. Up to 35.4% carbon
selectivity of propane was produced. Ethane was also produced at high carbon selectivity
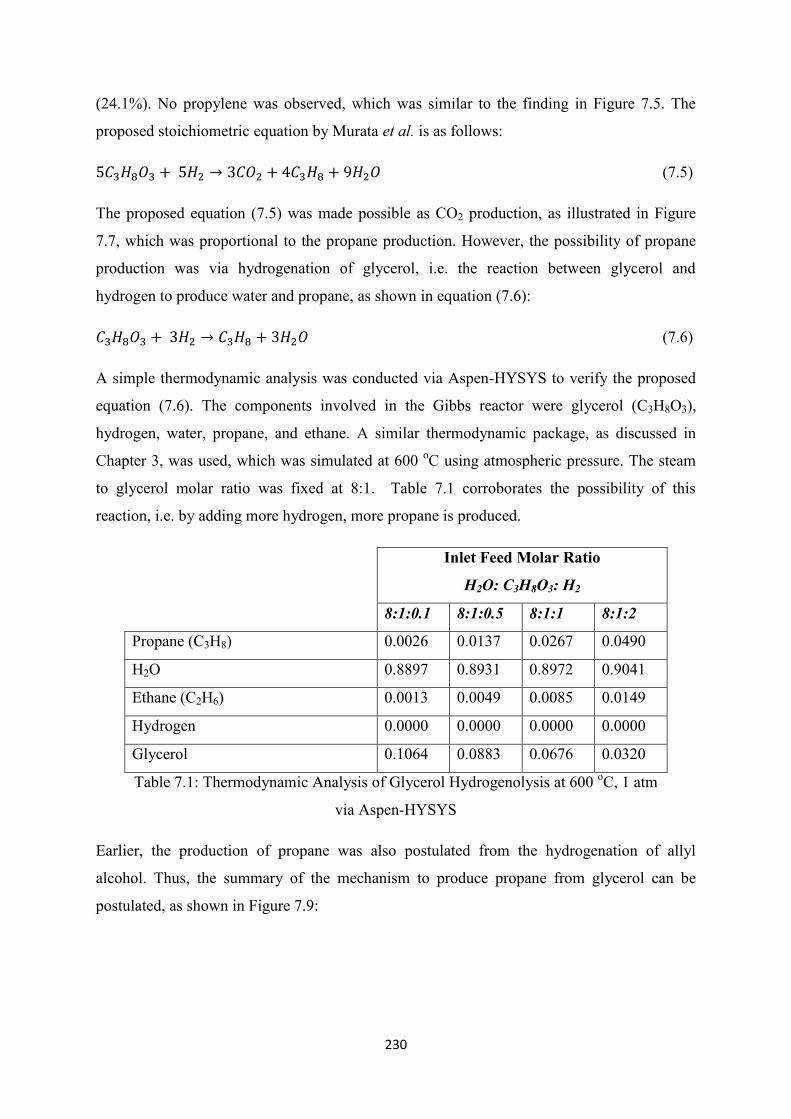
230
(24.1%). No propylene was observed, which was similar to the finding in Figure 7.5. The
proposed stoichiometric equation by Murata et al. is as follows:
(7.5)
The proposed equation (7.5) was made possible as CO2 production, as illustrated in Figure
7.7, which was proportional to the propane production. However, the possibility of propane
production was via hydrogenation of glycerol, i.e. the reaction between glycerol and
hydrogen to produce water and propane, as shown in equation (7.6):
(7.6)
A simple thermodynamic analysis was conducted via Aspen-HYSYS to verify the proposed
equation (7.6). The components involved in the Gibbs reactor were glycerol (C3H8O3),
hydrogen, water, propane, and ethane. A similar thermodynamic package, as discussed in
Chapter 3, was used, which was simulated at 600 oC using atmospheric pressure. The steam
to glycerol molar ratio was fixed at 8:1. Table 7.1 corroborates the possibility of this
reaction, i.e. by adding more hydrogen, more propane is produced.
Inlet Feed Molar Ratio
H2O: C3H8O3: H2
8:1:0.1 8:1:0.5 8:1:1 8:1:2
Propane (C3H8) 0.0026 0.0137 0.0267 0.0490
H2O 0.8897 0.8931 0.8972 0.9041
Ethane (C2H6) 0.0013 0.0049 0.0085 0.0149
Hydrogen 0.0000 0.0000 0.0000 0.0000
Glycerol 0.1064 0.0883 0.0676 0.0320
Table 7.1: Thermodynamic Analysis of Glycerol Hydrogenolysis at 600 oC, 1 atm
via Aspen-HYSYS
Earlier, the production of propane was also postulated from the hydrogenation of allyl
alcohol. Thus, the summary of the mechanism to produce propane from glycerol can be
postulated, as shown in Figure 7.9:

231
Figure 7.9: Reaction mechanism of glycerol hydrogenation for propane production
Based on the findings so far, it can be concluded that glycerol hydrogenolysis and
hydrogenation were favourable in the calcium based catalyst. The following hydrogenolysis
route, as portrayed in equations 7.7 and 7.8, were postulated by Cheng et al. [10] with regards
to the glycerol steam reforming reaction. However, these reactions may not be influential
enough over a nickel/alumina catalyst.
(7.7)
(7.8)
Equations 7.7 and 7.8 can be used to support the finding of relatively higher yields of CO and
CH4 from glycerol steam reforming over Hi-FUEL in comparison to NiAl(C) and NiAl(S).
With the variations of calcium loading, it can be concluded that an optimum calcium loading
needs to be introduced to enhance the reaction. In this calcium impregnated alumina
catalysts, 7 to 9 wt% calcium were considered as the optimum loading. At low calcium
loading, dehydration occurred, hence producing components, such as acrolein and
acetaldehyde. This was dominated by the presence of alumina, which is acidic in nature.

232
Ca/Al2O3 is not really a good catalyst, but the study of calcium impregnated on alumina and
Al2O3 alone contributed to a sufficient understanding of the reaction pathways in the calcium
promoted catalyst for reforming purposes, in general, and, specifically, the Hi-FUEL catalyst.
In accession, according to Figure 7.7, with regards to the hydrogen yield, there was a linear
trend of increasing hydrogen yield with increasing calcium loading. This, likewise, indicates
that calcium, apart from acting as a promoter, also works as a catalyst favouring certain types
of reaction.
7.4 Effect of Calcium Loading to Nickel/Alumina Catalyst
Two Nickel/Alumina catalysts were promoted with two different calcium loadings, namely,
15Ni3Ca and 15Ni7Ca. Both catalysts were tested at 600 oC with similar conditions as other
catalyst tests. Figures 7.10 and 7.11 depict the comparisons of NiAl(S), Hi-FUEL, 15Ni3Ca,
and 15Ni7Ca in terms of gas selectivity and carbon yield in the gas phase, respectively.
Figure 7.10: Gas products selectivity of glycerol steam reforming over prepared 15NixCa
and Hi-FUEL catalysts at 600 oC and 1 atm.
0
10
20
30
40
50
60
70
80
90
100
CO2 CO CH4
Sele
ctiv
ity
(%)
NiAl(S) 15Ni3Ca 15Ni7Ca Hi-FUEL Equilibrium

233
Figure 7.11: Carbon yield of gas phase products from glycerol steam reforming via
prepared 15NixCa and Hi-FUEL catalysts at 600 oC and 1 atm.
The comparison for all catalysts is illustrated further by representing each catalyst to the ratio
of calcium to nickel loading and the yield of hydrogen gas is plotted, as shown in Figure 7.12.
In addition, Table 7.2 highlights the corresponding Ca/Ni ratio to each catalyst tested.
Figure 7.11: Hydrogen yield, YH2and CO/CO2 ratio of glycerol steam reforming at 600 oC and
1 atm over 15Ni-xCa/Al2O3 catalysts with varied Ca/Ni ratio
0
10
20
30
40
50
60
70
CO2 CO CH4
Car
bo
n Y
ield
(%
) NiAl(S) 15Ni3Ca 15Ni7Ca Hi-FUEL
0.0
0.1
0.2
0.3
0.4
0.5
0.6
0.7
0.8
0.9
1.0
0.0
10.0
20.0
30.0
40.0
50.0
60.0
70.0
80.0
0 0.2 0.4 0.6
CO
/CO
2 R
atio
H2
Yie
ld H2 Yield
CO/CO2 Ratio
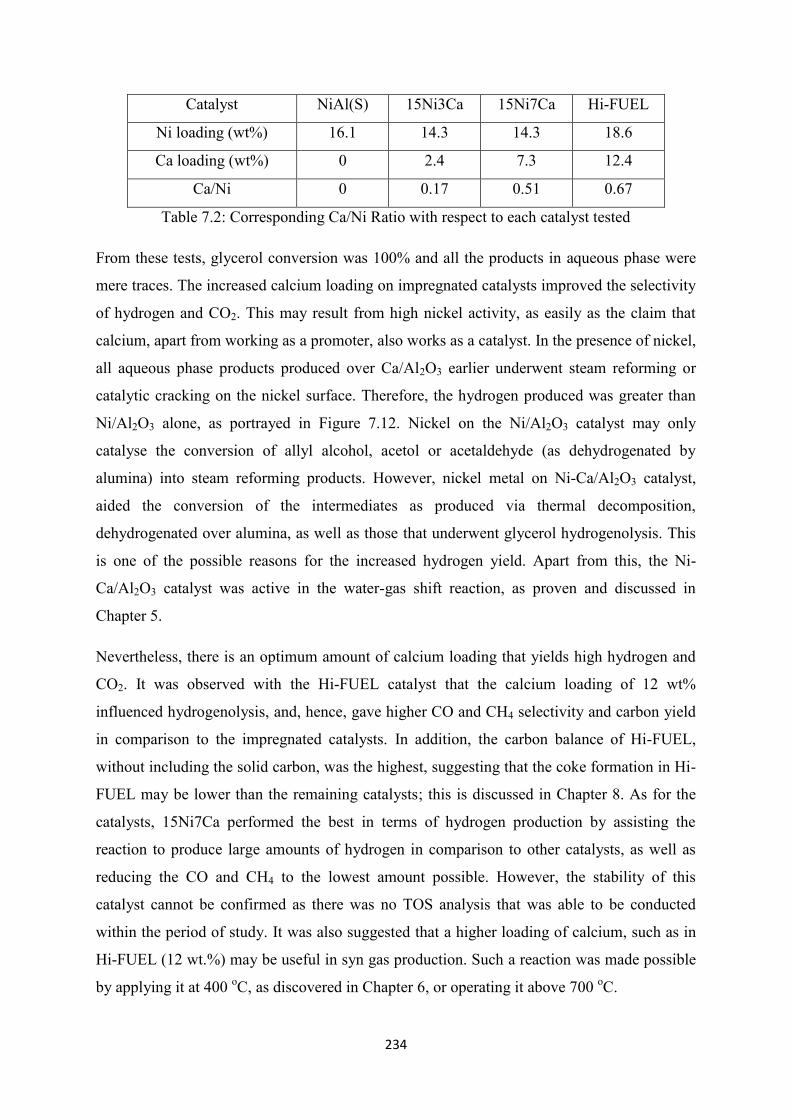
234
Catalyst NiAl(S) 15Ni3Ca 15Ni7Ca Hi-FUEL
Ni loading (wt%) 16.1 14.3 14.3 18.6
Ca loading (wt%) 0 2.4 7.3 12.4
Ca/Ni 0 0.17 0.51 0.67
Table 7.2: Corresponding Ca/Ni Ratio with respect to each catalyst tested
From these tests, glycerol conversion was 100% and all the products in aqueous phase were
mere traces. The increased calcium loading on impregnated catalysts improved the selectivity
of hydrogen and CO2. This may result from high nickel activity, as easily as the claim that
calcium, apart from working as a promoter, also works as a catalyst. In the presence of nickel,
all aqueous phase products produced over Ca/Al2O3 earlier underwent steam reforming or
catalytic cracking on the nickel surface. Therefore, the hydrogen produced was greater than
Ni/Al2O3 alone, as portrayed in Figure 7.12. Nickel on the Ni/Al2O3 catalyst may only
catalyse the conversion of allyl alcohol, acetol or acetaldehyde (as dehydrogenated by
alumina) into steam reforming products. However, nickel metal on Ni-Ca/Al2O3 catalyst,
aided the conversion of the intermediates as produced via thermal decomposition,
dehydrogenated over alumina, as well as those that underwent glycerol hydrogenolysis. This
is one of the possible reasons for the increased hydrogen yield. Apart from this, the Ni-
Ca/Al2O3 catalyst was active in the water-gas shift reaction, as proven and discussed in
Chapter 5.
Nevertheless, there is an optimum amount of calcium loading that yields high hydrogen and
CO2. It was observed with the Hi-FUEL catalyst that the calcium loading of 12 wt%
influenced hydrogenolysis, and, hence, gave higher CO and CH4 selectivity and carbon yield
in comparison to the impregnated catalysts. In addition, the carbon balance of Hi-FUEL,
without including the solid carbon, was the highest, suggesting that the coke formation in Hi-
FUEL may be lower than the remaining catalysts; this is discussed in Chapter 8. As for the
catalysts, 15Ni7Ca performed the best in terms of hydrogen production by assisting the
reaction to produce large amounts of hydrogen in comparison to other catalysts, as well as
reducing the CO and CH4 to the lowest amount possible. However, the stability of this
catalyst cannot be confirmed as there was no TOS analysis that was able to be conducted
within the period of study. It was also suggested that a higher loading of calcium, such as in
Hi-FUEL (12 wt.%) may be useful in syn gas production. Such a reaction was made possible
by applying it at 400 oC, as discovered in Chapter 6, or operating it above 700
oC.
235
The yields of the desired products, as illustrated in Figure 7.12, could be used to decide on
the optimum Ca/Ni ratio of hydrogen production. Increasing the Ca/Ni ratio led to the
formation of higher CO2, but also higher CO and CH4, as claimed earlier by Medrano et al.
[15]. This was possibly due to the coke gasification activity at a higher calcium loading, and
is discussed in chapter 8. The reduction of hydrogen yield at a high Ca/Ni ratio may also
account for the utilisation of hydrogen for the hydrogenolysis reaction as the calcium loading
increased. In order to improve the overall hydrogen yield, the catalyst amounts may need to
be added or a small weight percentage of noble metal, such as Rh or Ru maybe required at
the optimum Ca/Ni ratio to enhance the reforming activity.
7.5 Comparison with Other Group II Metals as Promoter on Ni/Al2O3, Ni-based or
Alumina Supported Catalysts
In addition to varying the calcium loading on Ni/Al2O3 catalysts, a comparison was made
with other catalysts tested by other established researchers on Group II elements. The only
work that is almost similar to this work was reported by Wang et al. [16] on the utilisation of
Ni-Mg-Al based catalysts for steam reforming of glycerol. To date, the research work of
glycerol reforming over barium and strontium doped on nickel-alumina had not been reported
elsewhere.
Table 7.3 portrays some comparative results between this doctoral research and the work of
Wang et al., later denoted as Wang-Mg. Only the best results from the data provided were
selected for this comparative study. In relation to the Hi-FUEL catalyst, the oxides weight
percentage (obtained from XRF), which is not reported in Chapter 4 to avoid further
confusion, is highlighted here for the sake of comparison. The obvious similarity for both
catalysts spotted here is that the NiO weight percentage was almost equivalent, as well as the
weight percentage of alumina. The type of alumina was, however, different. Wang-Mg used
γ-alumina, but Hi-FUEL was supported by α-alumina. MgO had a similar ratio to NiO, but
CaO was doped at lower amounts when compared to MgO.
The GHSV from Wang-Mg was almost halved, which suggested that the contact time in
Wang-Mg was longer than in this doctoral research, allowing better contact time between the
reactants and catalyst surface. In addition, the steam to fuel ratio used by them was less than
what was applied to test the Hi-FUEL catalyst. Only a few data could be compared here since
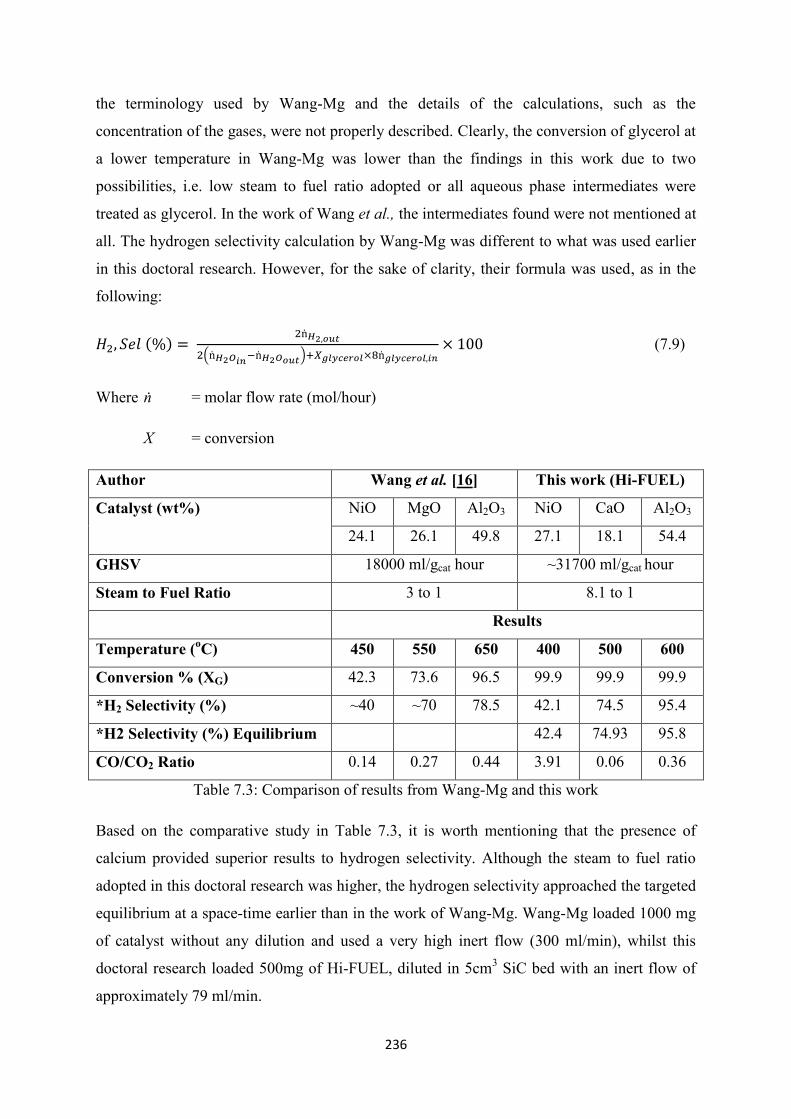
236
the terminology used by Wang-Mg and the details of the calculations, such as the
concentration of the gases, were not properly described. Clearly, the conversion of glycerol at
a lower temperature in Wang-Mg was lower than the findings in this work due to two
possibilities, i.e. low steam to fuel ratio adopted or all aqueous phase intermediates were
treated as glycerol. In the work of Wang et al., the intermediates found were not mentioned at
all. The hydrogen selectivity calculation by Wang-Mg was different to what was used earlier
in this doctoral research. However, for the sake of clarity, their formula was used, as in the
following:
( )
(7.9)
Where ṅ = molar flow rate (mol/hour)
X = conversion
Author Wang et al. [16] This work (Hi-FUEL)
Catalyst (wt%) NiO MgO Al2O3 NiO CaO Al2O3
24.1 26.1 49.8 27.1 18.1 54.4
GHSV 18000 ml/gcat hour ~31700 ml/gcat hour
Steam to Fuel Ratio 3 to 1 8.1 to 1
Results
Temperature (oC) 450 550 650 400 500 600
Conversion % (XG) 42.3 73.6 96.5 99.9 99.9 99.9
*H2 Selectivity (%) ~40 ~70 78.5 42.1 74.5 95.4
*H2 Selectivity (%) Equilibrium 42.4 74.93 95.8
CO/CO2 Ratio 0.14 0.27 0.44 3.91 0.06 0.36
Table 7.3: Comparison of results from Wang-Mg and this work
Based on the comparative study in Table 7.3, it is worth mentioning that the presence of
calcium provided superior results to hydrogen selectivity. Although the steam to fuel ratio
adopted in this doctoral research was higher, the hydrogen selectivity approached the targeted
equilibrium at a space-time earlier than in the work of Wang-Mg. Wang-Mg loaded 1000 mg
of catalyst without any dilution and used a very high inert flow (300 ml/min), whilst this
doctoral research loaded 500mg of Hi-FUEL, diluted in 5cm3 SiC bed with an inert flow of
approximately 79 ml/min.

237
Interestingly, Wang-Mg reported that the CO/CO2 ratios obtained at 450, 550 and 650 oC
were 0.14, 0.27, and 0.44, respectively, while for this doctoral research, the CO/CO2 ratios
that was calculated at 400, 500 and 600 oC were 3.91, 0.06 and 0.36, respectively. This
suggests that the phenomenon of hydrogenolysis at low temperature (400 – 500 oC) might not
occur in the presence of Mg, but occurred otherwise on the Ca doped catalyst. The reasons
behind these findings will be an interesting future work worthy of investigation.
7.6 Proposed Reaction Pathway of Glycerol Steam Reforming via Ni-Ca/Al2O3
(Hi-FUEL)
Thus, it can be concluded that on the nickel-calcium-alumina catalyst system, several
competitive reactions took place that occurred on different types of catalyst surface. This is
shown in Figure 7.13. In this doctoral study, it can be modelled that once the mixture of
glycerol and water were pumped into the rig and vaporised, it underwent homogeneous
reactions, such as dehydration to produce acetol and acrolein, and dehydrogenation to
produce acetaldehyde (initially glyceraldehyde). Alumina also promoted dehydration and
produced acrolein. The acrolein was converted into a more stable component, i.e. allyl
alcohol, by reacting with some of the hydrogen released from the dehydrogenation. Over the
calcium surface, hydrogenolysis and hydrogenation took place, of which glycerol and any
thermally decomposed or dehydrated intermediates would react with the hydrogen to produce
other intermediates, such as methanol, ethanol, ethylene glycol, propylene glycol, and
acetone. These intermediates and the remaining intermediates were formed from thermal
decomposition or dehydration that would undergo further reaction on the nickel surfaces. The
steam supplied reactivated the nickel surface to assist in the reforming process and the water-
gas shift reaction, as suggested by Cheng et al. [1]. Cheng et al. proposed that steam
underwent dissociative chemisorption. Alumina, otherwise, would also act to dehydrate or
dehydrogenate the glycerol to form the intermediates, which were readily available to be
reformed.

238
In terms of the reaction network, the model in Figure 7.12 could be redrawn:
Figure 7.14: Proposed reaction pathway to the production of primary products in glycerol
steam reforming over Hi-FUEL catalyst
Based on Figure 7.14, it was postulated that when glycerol and steam reacted over a calcium
doped nickel/alumina catalyst, several other reactions were dominant to form the
Figure 7.13: Illustration of calcium doped nickel-alumina surface activity from glycerol
steam reforming reaction
CO, CH4,
hydrogenolysis&
hydrogenated
products
CaAl2O4
Ni Ni
C3H
8O
3
Acetol, Acrolein, Allyl Alcohol
H2
CO2
H2
CO2
H2O
239
intermediates on the catalyst surface and within the catalyst bed, apart from glycerol
dehydrogenation to acetaldehyde. All of these intermediates were favoured to form at
different reaction temperatures, even though using similar catalysts. At 400 oC, glycerol
hydrogenolysis might become dominant, hence reactions on calcium surfaces were favoured.
However, at a higher temperature, e.g. at 600 oC, steam reforming, water-gas shift reaction,
and catalytic cracking were favoured over nickel surfaces, and reactions on alumina, although
presented in our test, at all times it appeared to be less favourable in the presence of calcium,
due to the possibility of Hi-FUEL using α-alumina as the support, instead of γ-alumina. The
reaction on the acidic alumina surface might also be hindered due to the basicity of calcium,
as claimed by Choong et al. and Elias et al. [7, 17].
7.7 Conclusion

240
In this chapter, a thorough investigation was carried out to study the effects of calcium
promoted to nickel/alumina catalyst in glycerol steam reforming. Initially, a similar Ni/Al2O3
catalyst was synthesised, denoted NiAl(S), and were tested using similar conditions with the
previously tested NiAl(C). It was found that there were no significant differences in both the
catalysts tested. Therefore, it is strongly proposed that the catalyst is valid for comparison.
Nickel was left out in the next study, but calcium was impregnated on alumina, with different
weight loading percentages. Similar conditions were used in the tests, as described earlier,
and the study showed that alumina promoted dehydrogenation of glycerol to acetaldehyde
production, while calcium promoted glycerol hydrogenolysis, and hydrogenation to acetone,
methanol, ethylene glycol, propylene glycol, diethylene glycol, and some other components.
While acetol and allyl alcohol were the dominant intermediates in homogeneous reaction and
over the Hi-FUEL catalyst, it was found that acetol and allyl alcohol hydrogenated produced
other intermediates. Glycerol also hydrogenated to propane, which was followed by cracking
into ethane and ethylene.
When different calcium loadings were impregnated into the Ni/Al2O3 catalyst and compared
to NiAl(S) and Hi-FUEL, it can be observed that the nickel metal site enhanced the steam
reforming process and catalytic cracking, which assisted all the intermediates to be converted
into final products. A higher hydrogen yield was observed in comparison to NiAl(S), but
additional calcium loading (higher than 7wt%) might produce a larger amount of CO, which
was a result from the enhanced glycerol hydrogenolysis. An appropriate Ca/Ni weight
loading ratio would need to be carefully selected in the future to optimise the hydrogen yield,
as high Ca/Ni ratio would also reduce the hydrogen yield. The analysis of the finding also
suggests that the Ni-Ca/Al2O3 catalyst is useful to be used as syn gas production catalyst. A
reaction network on this type of catalyst is highly recommended for future investigation.
7.8 References

241
[1] C. K. Cheng, S. Y. Foo, and A. A. Adesina, "Steam reforming of glycerol over
Ni/Al2O3 catalyst," Catalysis Today, vol. 178, pp. 25-33, Dec 15 2011.
[2] E. Z. Costin Sorin Bildea, Grigore Bozga, Gheorghe Soare, "Conceptual design of
glycerol hydrogenolysis plant " 20th European Symposium on Computer Aided
Process Engineering – ESCAPE20 2010.
[3] T. Miyazawa, S. Koso, K. Kunimori, and K. Tomishige, "Development of a Ru/C
catalyst for glycerol hydrogenolysis in combination with an ion-exchange resin,"
Applied Catalysis a-General, vol. 318, pp. 244-251, Feb 20 2007.
[4] M. A. Dasari, P. P. Kiatsimkul, W. R. Sutterlin, and G. J. Suppes, "Low-pressure
hydrogenolysis of glycerol to propylene glycol," Applied Catalysis a-General, vol.
281, pp. 225-231, Mar 18 2005.
[5] E. P. Maris and R. J. Davis, "Hydrogenolysis of glycerol over carbon-supported Ru
and Pt catalysts," Journal of Catalysis, vol. 249, pp. 328-337, Jul 25 2007.
[6] V. Chiodo, S. Freni, A. Galvagno, N. Mondello, and F. Frusteri, "Catalytic features of
Rh and Ni supported catalysts in the steam reforming of glycerol to produce
hydrogen," Applied Catalysis A: General, vol. 381, pp. 1-7, 2010.
[7] C. K. S. Choong, L. Huang, Z. Y. Zhong, J. Y. Lin, L. Hong, and L. W. Chen, "Effect
of calcium addition on catalytic ethanol steam reforming of Ni/Al2O3: II.
Acidity/basicity, water adsorption and catalytic activity," Applied Catalysis a-
General, vol. 407, pp. 155-162, Nov 4 2011.
[8] A. Konaka, T. Tago, T. Yoshikawa, A. Nakamura, and T. Masuda, "Conversion of
glycerol into allyl alcohol over potassium-supported zirconia–iron oxide catalyst,"
Applied Catalysis B: Environmental.
[9] K. Murata, I. Takahara, and M. Inaba, "Propane formation by aqueous-phase
reforming of glycerol over Pt/H-ZSM5 catalysts," Reaction Kinetics and Catalysis
Letters, vol. 93, pp. 59-66, 2008.
[10] C. K. Cheng, S. Y. Foo, and A. A. Adesina, "Glycerol Steam Reforming over
Bimetallic Co-Ni/Al2O3," Industrial & Engineering Chemistry Research, vol. 49, pp.
10804-10817, Nov 3 2010.
[11] J. Comas, M. Laborde, and N. Amadeo, "Thermodynamic analysis of hydrogen
production from ethanol using CaO as a CO2 sorbent," Journal of Power Sources,
vol. 138, pp. 61-67, 2004.

242
[12] Y. H. Li, W. J. Wang, B. H. Chen, and Y. Y. Cao, "Thermodynamic analysis of
hydrogen production via glycerol steam reforming with CO(2) adsorption,"
International Journal of Hydrogen Energy, vol. 35, pp. 7768-7777, Aug 2010.
[13] B. Dou, V. Dupont, G. Rickett, N. Blakeman, P. T. Williams, H. Chen, Y. Ding, and
M. Ghadiri, "Hydrogen production by sorption-enhanced steam reforming of
glycerol," Bioresource Technology, vol. 100, pp. 3540-3547, 2009.
[14] B. Dou, G. L. Rickett, V. Dupont, P. T. Williams, H. Chen, Y. Ding, and M. Ghadiri,
"Steam reforming of crude glycerol with in situ CO2 sorption," Bioresource
Technology, vol. 101, pp. 2436-2442, 2010.
[15] J. A. Medrano, M. Oliva, J. Ruiz, L. Garcia, and J. Afauzo, "Catalytic steam
reforming of model compounds of biomass pyrolysis liquids in fluidized bed reactor
with modified Ni/Al catalysts," Journal of Analytical and Applied Pyrolysis, vol. 85,
pp. 214-225, May 2009.
[16] C. Wang, B. Dou, H. Chen, Y. Song, Y. Xu, X. Du, T. Luo, and C. Tan, "Hydrogen
production from steam reforming of glycerol by Ni–Mg–Al based catalysts in a fixed-
bed reactor," Chemical Engineering Journal, vol. 220, pp. 133-142, 2013.
[17] K. F. M. Elias, A. F. Lucredio, and E. M. Assaf, "Effect of CaO addition on acid
properties of Ni-Ca/Al2O3 catalysts applied to ethanol steam reforming,"
International Journal of Hydrogen Energy, vol. 38, pp. 4407-4417, Apr 15 2013.

243
CHAPTER 8: COKE FORMATION STUDY AND ANALYSIS
8.1 Introduction
This chapter further examines the carbon produced from oxygenated hydrocarbon steam
reforming by quantifying and analysing the types of carbon formed. The effect of varying
relevant parameters from his particular reaction was also explored and a comparison was
made. In addition, great interest has been shown in studying the effects of calcium doped on
nickel/alumina catalyst and how it influences the formation of carbon within the reaction. The
main carbon precursors for each condition was tested and the type of carbon produced were
subsequently identified. The concluding part of this chapter reviews the quantity and the type
of carbon produced and deposited over the Hi-FUEL and the prepared calcium doped on
nickel/alumina catalysts in comparison to a typical nickel/alumina catalyst. The reaction
mechanism for coke production is also introduced and discussed.
8.2 The Study of Carbon Deposition on Hi-FUEL Catalyst from Steam Reforming of
Oxygenated Hydrocarbons
In Chapter 5, the experimental results of ethanol to glycerol homologues steam reforming,
consisting of mono-ol (ethanol), di-ol (ethylene glycol and propylene glycol) and tri-ol
(glycerol) were highlighted and discussed. The selectivity of hydrogen, methane, CO and
CO2 and CO/CO2 ratio from the steam reforming of these homologues were extensively
reported and presented in the previous chapters, but not concerning the coke formation, hence
this shall be thoroughly discussed in this chapter. Figures 8.1 (a) and (b) illustrate the carbon
deposition over the Hi-FUEL catalyst and free carbon produced on ethanol to glycerol
homologues steam reforming at 600oC over a 4-hour basis of operation. In addition, Figures
8.2 (a) to (d) represent the FESEM images of the spent catalysts tested with these
homologues at the respective conditions. A CHNS Analyser was used to quantify the carbon
deposited on the Hi-FUEL catalyst.

244
Figure 8.1: (a) Carbon deposited and (b) free carbon on different oxygenate steam reforming
at 600 oC over 1g Hi-FUEL
EthanolPropylene
GlycolEthylene
GlycolGlycerol
Carbon Deposited 0.0223 0.0149 0.0682 0.0355
0.00
0.01
0.02
0.03
0.04
0.05
0.06
0.07
0.08
0.09
0.10
carb
on
de
po
site
d (
g)
(a)
EthanolPropylene
GlycolEthylene
GlycolGlycerol
Free Carbon 0.0878 0.5463 0.8235 0.5530
0.000
0.200
0.400
0.600
0.800
1.000
1.200
carb
on
de
po
site
d (
g)
(b)

245
A small amount of the spent catalyst (in mg) was combusted in the CHNS chamber at high
temperature and the amount of carbon, hydrogen, nitrogen, and sulphur were identified via its
detector. The CHNS Analyser can provide the weight percentage of carbon deposited on the
catalyst surface. Nonetheless, free carbon is difficult to be quantified since in this set of
reactions, the free carbons produced turned up as loose species, and might deposit on the
quartz wool, silica carbide (the diluent) or the wall of the reactor. The free carbon was
therefore estimated by quantifying the total carbon produced within the reaction. The total
carbon was estimated with the assumption that the total carbon balance was 100%, and the
leftover was assumed to be carbon. The number of carbon atoms in carbon is always 1, the
carbon molecular weight is 12, and the duration of the operation hours was 4 hours.
Therefore, the total carbon produced, TC, from homologue i undergoing steam reforming is
as follows:
(a) (b)
(c)
(d)
Figure 8.2: FESEM images of the spent Hi-FUEL catalyst for all oxygenated hydrocarbon
steam reforming activities at 600 oC, 1 atm and 1 gram catalyst loading – (a) Ethanol, (b)
Ethylene Glycol, (c) Propylene Glycol and (d) Glycerol

246
[
] (8.1)
Therefore, free carbon (FC) can be determined by subtracting the TC with the amount of
carbon deposited on the catalyst surface as pre-determined earlier using the CHNS Analyser.
(8.2)
As discussed earlier in Chapter 5, and with reference to Figure 8.1(a), it can be suggested that
the steam reforming reaction of ethylene glycol over the Hi-FUEL catalyst yielded the
highest amount of coke deposited on the catalyst surface, followed by glycerol, while the
least were propylene glycol and ethanol. Since these reactants belong to the same series of
homologues, it was expected that the reaction path of carbon formation would be similar to
each other depending on the catalyst loading (hence the space-time). However, based on the
observation from Figures 8.2 (a) to (d), the structure of carbon deposited, as illustrated by the
images obtained from FESEM, suggested that the coke deposited on ethylene glycol
reforming at 600 oC had an amorphous structure, whilst for the other reactants, the coke
deposited had a tendency to be more crystalline in nature. Hu and Lu [1], in their study,
discovered that ethylene glycol could easily be decomposed to ethylene and CO. In addition,
ethylene is a significant carbon precursor due to its tendency to polymerize. The
polymerisation of ethylene would lead to the formation of a whisker and encapsulating
carbon that will block the active metal, and, thus, damage the catalyst structure [2]. Since
amorphous carbon was formed, ethylene may not be a strong precursor in coke formation in
ethylene glycol reforming. This is left to CO as CH4 at 600 oC only appeared as traces; this
can be referred to in section 5.3.2. It is also interesting to note that even though propylene
glycol steam reforming had the least carbon deposited on its catalyst surface, it produced
large amounts of free carbon of which the carbon precursor was not identified and the
reaction pathway needed to be investigated further.
Table 8.1 depicts the total carbon balance in gas and liquid phases for each oxygenate. The
total carbon based on the estimation, carbon deposited, and free carbon for each species at
600 oC reaction temperature and 1 atm pressure was subject to ± 10 % error. It can be
observed that other than the spent Hi-FUEL catalyst obtained from the ethanol steam
reforming activity, the percentage of carbon deposited with respect to the total carbon

247
produced (
) was very low. This suggests that many of the carbons produced ended up being
deposited elsewhere in the system, hence making it difficult to be analysed and quantified.
Homologue
CO
Selectivity
(%)
Carbon
balance
(%)
(liquid &
gas phase)
Total
carbon
produced
(g)
Carbon
deposited
on
surface
(g)
Free
carbon
produced
(g)
a b (a-b)
Ethanol 28.7 94.9 0.13 0.045 0.09 33.7
Propylene
Glycol 40.4 81.3 0.58 0.030 0.55 5.2
Ethylene Glycol 22.2 65.0 0.96 0.137 0.82 14.2
Glycerol 35.3 80.4 0.62 0.071 0.55 11.4
Table 8.1: The relationship between the total carbon produced, carbon deposited and free
carbon on all oxygenates, produced by steam reforming over Hi-FUEL
The excess amounts of CO produced during the reaction caused a disproportion, which also
led to the production of carbon. Such a reaction is an example of the Bouduard reaction and
Le Chatelier’s Principle, of which the excess concentration on one side will favour the
production of the other side of the stoichiometric equation with the least concentration. By
referring to Table 8.1, all oxygenates produced large amounts of CO at 600 oC over the Hi-
FUEL catalyst. An equivalent finding with Ca doped NiAl tested on acetol steam reforming
was conducted by Medrano et al. [3]. Numerous reports like Cheng et al. and Sanchez et al.
[4, 5] confirmed that in applying the exact same temperature and similar conditions, but with
the use of other types of catalyst, the CO produced was much lower than that discovered in
this particular doctoral research. The Bouduard reaction can be expressed as follows:
(8.3)
There are also two other reactions that may lead to coke formation at this temperature, i.e. via
CO and CO2 hydrogenation; however, this is not the case in this particular study since the
steam was supplied in excess, hence a reversible reaction occurred.
CO hydrogenation: (8.4)
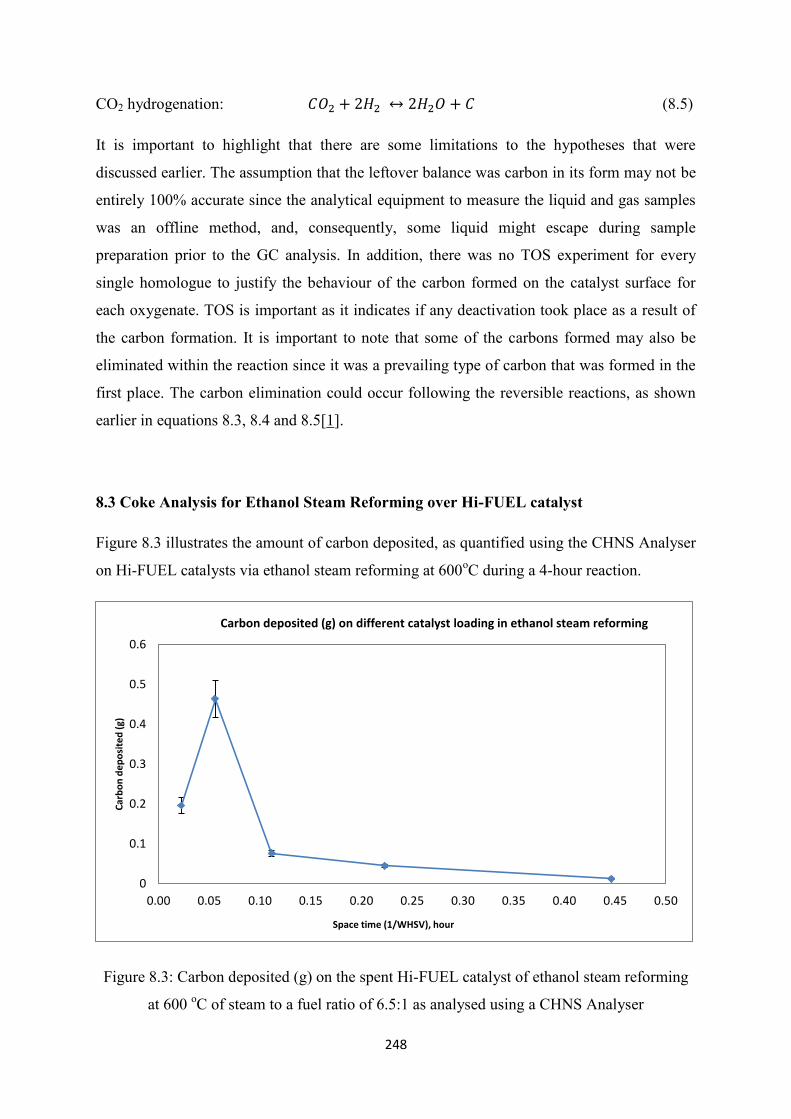
248
CO2 hydrogenation: (8.5)
It is important to highlight that there are some limitations to the hypotheses that were
discussed earlier. The assumption that the leftover balance was carbon in its form may not be
entirely 100% accurate since the analytical equipment to measure the liquid and gas samples
was an offline method, and, consequently, some liquid might escape during sample
preparation prior to the GC analysis. In addition, there was no TOS experiment for every
single homologue to justify the behaviour of the carbon formed on the catalyst surface for
each oxygenate. TOS is important as it indicates if any deactivation took place as a result of
the carbon formation. It is important to note that some of the carbons formed may also be
eliminated within the reaction since it was a prevailing type of carbon that was formed in the
first place. The carbon elimination could occur following the reversible reactions, as shown
earlier in equations 8.3, 8.4 and 8.5[1].
8.3 Coke Analysis for Ethanol Steam Reforming over Hi-FUEL catalyst
Figure 8.3 illustrates the amount of carbon deposited, as quantified using the CHNS Analyser
on Hi-FUEL catalysts via ethanol steam reforming at 600oC during a 4-hour reaction.
Figure 8.3: Carbon deposited (g) on the spent Hi-FUEL catalyst of ethanol steam reforming
at 600 oC of steam to a fuel ratio of 6.5:1 as analysed using a CHNS Analyser
0
0.1
0.2
0.3
0.4
0.5
0.6
0.00 0.05 0.10 0.15 0.20 0.25 0.30 0.35 0.40 0.45 0.50
Car
bo
n d
ep
osi
ted
(g)
Space time (1/WHSV), hour
Carbon deposited (g) on different catalyst loading in ethanol steam reforming
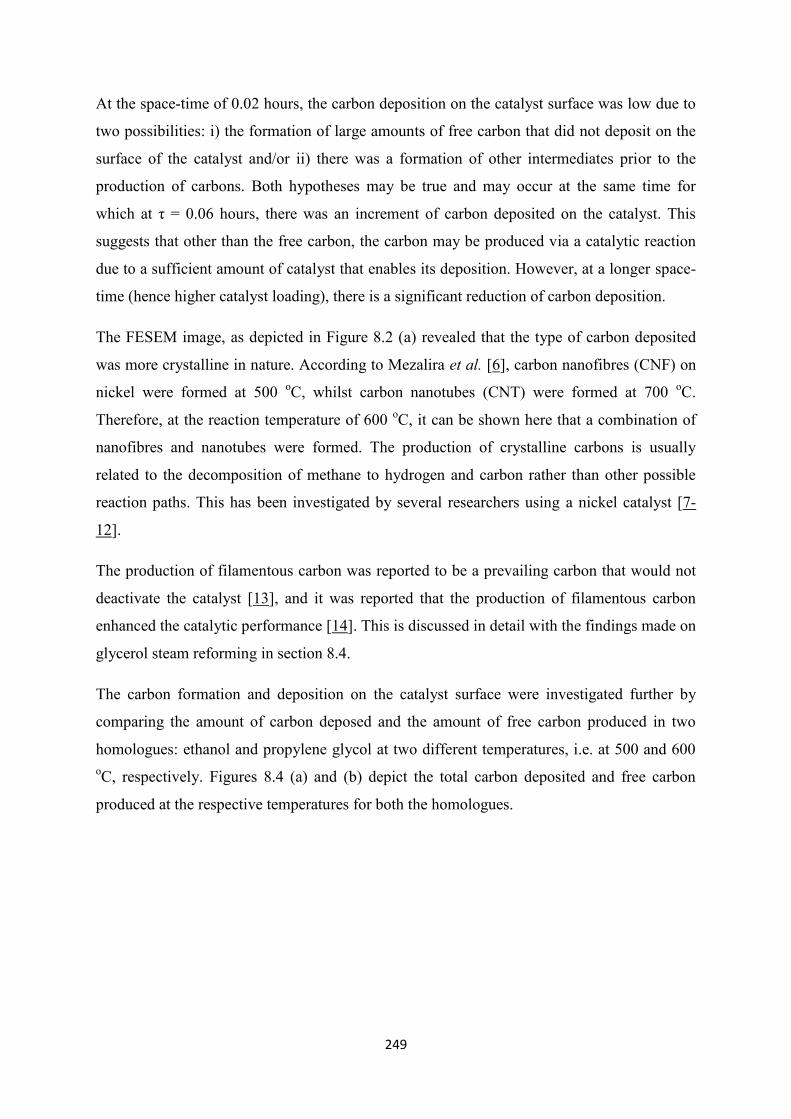
249
At the space-time of 0.02 hours, the carbon deposition on the catalyst surface was low due to
two possibilities: i) the formation of large amounts of free carbon that did not deposit on the
surface of the catalyst and/or ii) there was a formation of other intermediates prior to the
production of carbons. Both hypotheses may be true and may occur at the same time for
which at τ = 0.06 hours, there was an increment of carbon deposited on the catalyst. This
suggests that other than the free carbon, the carbon may be produced via a catalytic reaction
due to a sufficient amount of catalyst that enables its deposition. However, at a longer space-
time (hence higher catalyst loading), there is a significant reduction of carbon deposition.
The FESEM image, as depicted in Figure 8.2 (a) revealed that the type of carbon deposited
was more crystalline in nature. According to Mezalira et al. [6], carbon nanofibres (CNF) on
nickel were formed at 500 oC, whilst carbon nanotubes (CNT) were formed at 700
oC.
Therefore, at the reaction temperature of 600 oC, it can be shown here that a combination of
nanofibres and nanotubes were formed. The production of crystalline carbons is usually
related to the decomposition of methane to hydrogen and carbon rather than other possible
reaction paths. This has been investigated by several researchers using a nickel catalyst [7-
12].
The production of filamentous carbon was reported to be a prevailing carbon that would not
deactivate the catalyst [13], and it was reported that the production of filamentous carbon
enhanced the catalytic performance [14]. This is discussed in detail with the findings made on
glycerol steam reforming in section 8.4.
The carbon formation and deposition on the catalyst surface were investigated further by
comparing the amount of carbon deposed and the amount of free carbon produced in two
homologues: ethanol and propylene glycol at two different temperatures, i.e. at 500 and 600
oC, respectively. Figures 8.4 (a) and (b) depict the total carbon deposited and free carbon
produced at the respective temperatures for both the homologues.

250
Figure 8.4: (a) The carbon deposition on the Hi-FUEL spent catalyst and (b) free carbon
produced from ethanol and propylene glycol steam reforming at 500 and 600 oC with
1g catalyst loading
With reference to Figures 8.4 (a) and (b), it can be agreed that for both homologues, the
production of carbon at 500 oC was higher than the carbon formation at 600
oC. This is
mainly due to the thermodynamic properties of the reactions at 500 oC, where it had a
tendency to eliminate the CO via the water gas shift reaction, which was very active at this
temperature. Thus, the CO may also be eliminated via carbon production, as described earlier
in equation 8.3, via the Bouduard reaction. The presence of methane at 500 oC was also high
in both oxygenates. Consequently, methane may significantly decompose into carbon and
hydrogen under the catalytic reaction, following equation 8.6, and this may become the main
coke precursor at this temperature. Equation 8.6 is shown as follows:
0
0.05
0.1
0.15
0.2
0.25
Ethanol Propylene Glycol
Car
bo
n d
epo
site
d (
g)
(a)
500 600
0
0.1
0.2
0.3
0.4
0.5
0.6
0.7
0.8
0.9
Ethanol Propylene Glycol
Free
Car
bo
n (
g)
(b)
500 600

251
(8.6)
This finding corresponds with Mezalira et al. [6] in which the high nickel loading favoured
methane decomposition to carbon at 500 oC, and produced nanofibres. Ethanol steam
reforming over the Hi-FUEL was more catalytically active than propylene glycol steam in the
reforming of a similar catalyst. Hence, as shown in Figure 8.5 (a), more carbon was deposited
on the spent Hi-FUEL catalyst from the ethanol steam reforming than from the propylene
glycol steam reforming activity.
8.4 Glycerol Steam Reforming over the Hi-FUEL catalyst at 400 and 600 oC
One of the main objectives in this chapter is to analyse and discuss the carbon formation on
the Hi-FUEL catalyst with reference to the steam reforming of glycerol. At two differing
temperatures and five data points at different space-times, the trend of carbon formation and
deposition on Hi-FUEL catalysts were varied, as illustrated in Figures 8.5 (a) and (b).
0
0.02
0.04
0.06
0.08
0.1
0.12
0 0.01 0.02 0.03 0.04 0.05 0.06 0.07
Car
bo
n D
ep
osi
tio
n (
g)
Space Time/ hour
(a) 400 C
600 C

252
Figure 8.5: (a) Carbon deposition (g) on the Hi-FUEL spent catalyst and (b) Free carbon
formed from glycerol steam reforming activity at 400 and 600 oC
At 400 oC, the carbon deposition on the catalyst surface increased with time. The longer the
space-time (hence higher catalyst loading), the more the catalyst was deposited on the
surface. However, by observing the free carbon formation at this temperature, the amount of
free carbon that was produced had reduced significantly. At 600 oC, a different pattern was
observed on the carbon deposition on the catalyst surface of which at low space-time, the
amount deposited was low. This was followed by an increase to the maximum at τ = 0.048
hours and a decrease in amount as the space-time extended. The amounts of the free carbon
also displayed similar trend. It was observed that at a very low space-time, the amounts of the
free carbon and deposited carbon were low at both temperatures, suggesting that there were
some carbon precursors produced prior to the carbon formation, and, therefore, coke
formation may largely be governed by catalytic reactions.
As space-time approached τ = 0.1 hours, the carbon deposited on the Hi-FUEL at 400 and
600 oC indicated a significant gap in which, at 400
oC, the carbon deposited on the surface
was at the highest, whereas at 600 oC, the carbon deposited was significantly less.
Nonetheless, the free carbon produced at both temperatures revealed a decreasing trend.
Therefore, a thermogravimetric analyser (TGA) test with airflow at 40 ml/min was also
conducted at both temperatures to verify the possibility of different types of carbon being
deposited on the catalyst surface, which may result from the different coke precursors or
routes. Approximately 5 to 8 milligrams of spent catalysts were mounted in the TGA
chamber. The TGA (Perkin Elmer, Pyris 1) was initially set at an isothermal condition of 50
0.00
0.50
1.00
1.50
2.00
2.50
0 0.01 0.02 0.03 0.04 0.05 0.06 0.07
Fre
e C
arb
on
(g)
Space time/ hour
(b)
400 C
600 C

253
oC for 15 minutes, and, later, the samples were heated from 50 to 900
oC at the heating rate of
10 oC/min. Once the chamber’s temperature reached 900
oC, the samples were maintained at
this temperature for approximately 30 minutes prior to cooling down.
Figure 8.6: The TGA derivative plot (dw/dT) of the spent Hi-FUEL catalysts at different
glycerol steam reforming reaction temperatures
Figure 8.6 depicts the TGA derivative weight loss plot (dw/dT) of the spent Hi-FUEL
catalysts at different glycerol steam reforming reaction temperatures, i.e. at 400 oC and 600
oC, respectively. For the sample at 400
oC, the carbon deposited on the Hi-FUEL began to
decompose at a temperature above 400 oC in the TGA, while for the sample at 600
oC, the
spent catalyst only began to reduce its weight above 500 oC. This implies that different types
of carbon may be deposited on the catalyst at different reaction temperatures. As reported by
Choong et al. [15], the coke that was decomposed in the TGA below 500 oC belonged to an
amorphous carbon, whilst above this temperature, it represented a crystalline carbon. This is
further supported by Cheng and Dupont [16] who demonstrated that the carbonaceous
materials on Ni/Al2O3 catalyst can be deposited on the active metal in the form of
polyaromatic compounds or on the support in the form of pseudo-graphitic structure. The
former can be easily burnt at a lower temperature.
-0.0012
-0.001
-0.0008
-0.0006
-0.0004
-0.0002
0
0.0002
0.0004
0 100 200 300 400 500 600 700 800 900
dW
/dT
Temperature/ oC
500mg 400C 500mg 600C

254
This hypothesis is further proven by analysing the spent catalyst via TEM and FESEM. For
the sake of clarity and better comparison, the samples chosen for both temperatures were at
the highest space-time tested, i.e. with the catalyst loading of 500mg each. The TEM images
are shown in Figures 8.7 (a) and (b) for the samples representing a reaction temperature at
400 and 600 oC, respectively. The FESEM images are shown in Figures 8.8 (a) and (b) using
similar representation.
(a)
(b)
(c)
(d)
Figure 8.7: TEM images of the spent Hi-FUEL catalyst of 500mg tested on glycerol steam
reforming at (a) 1: 20nm (b) 1:100nm for 400 oC; (c) 1:200nm (d) 1:100nm for 600
oC at
different scale
(a) (b)
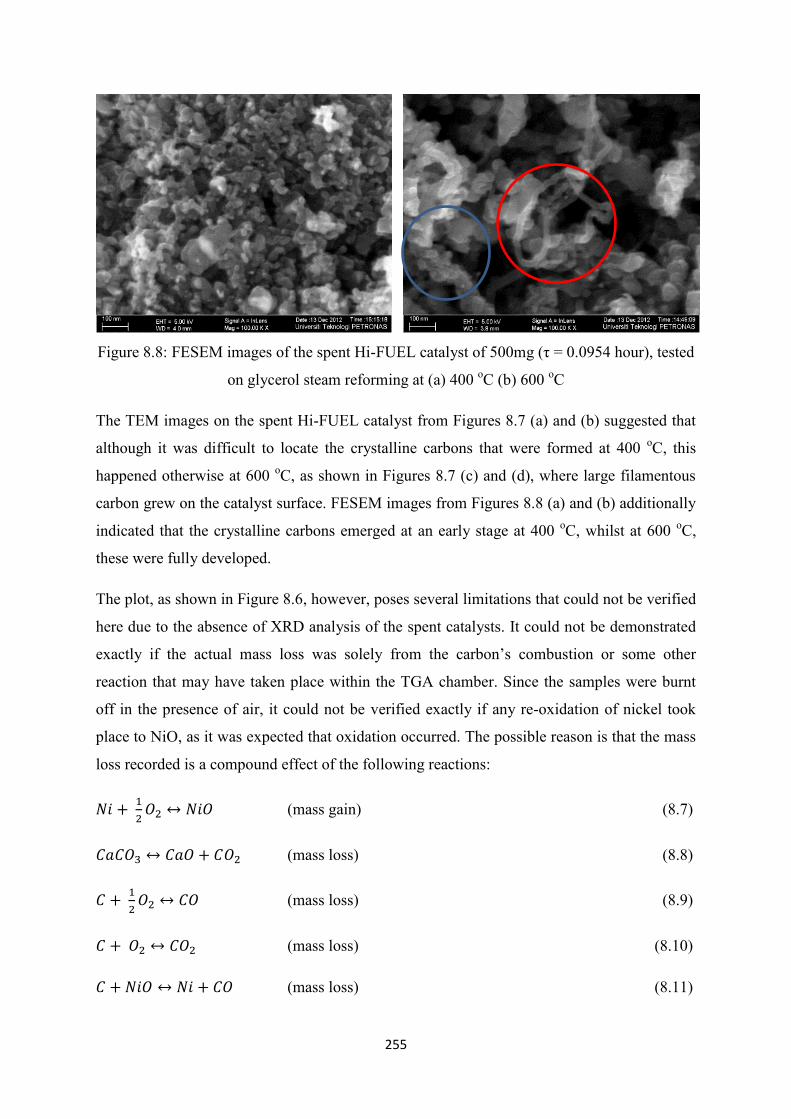
255
Figure 8.8: FESEM images of the spent Hi-FUEL catalyst of 500mg (τ = 0.0954 hour), tested
on glycerol steam reforming at (a) 400 oC (b) 600
oC
The TEM images on the spent Hi-FUEL catalyst from Figures 8.7 (a) and (b) suggested that
although it was difficult to locate the crystalline carbons that were formed at 400 oC, this
happened otherwise at 600 oC, as shown in Figures 8.7 (c) and (d), where large filamentous
carbon grew on the catalyst surface. FESEM images from Figures 8.8 (a) and (b) additionally
indicated that the crystalline carbons emerged at an early stage at 400 oC, whilst at 600
oC,
these were fully developed.
The plot, as shown in Figure 8.6, however, poses several limitations that could not be verified
here due to the absence of XRD analysis of the spent catalysts. It could not be demonstrated
exactly if the actual mass loss was solely from the carbon’s combustion or some other
reaction that may have taken place within the TGA chamber. Since the samples were burnt
off in the presence of air, it could not be verified exactly if any re-oxidation of nickel took
place to NiO, as it was expected that oxidation occurred. The possible reason is that the mass
loss recorded is a compound effect of the following reactions:
(mass gain) (8.7)
(mass loss) (8.8)
(mass loss) (8.9)
(mass loss) (8.10)
(mass loss) (8.11)
256
(mass loss) (8.12)
The TGA weight loss final percentage obtained at 900 oC, i.e. upon completion of the
combustion, as shown in Figure 8.9 (a), was further compared with the weight percentage of
carbon obtained from the CHNS Analyser, as depicted in Figure 8.9 (b). It can be verified
that the final weight loss obtained from the TGA was similar to the percentage of carbon
burnt from CHNS, especially for the sample tested at 400oC. Nonetheless, the reaction, as
shown in equation 8.7, is not to be ignored as it might still occur; however, it is not possible
to due to the lack of XRD information.
Figure 8.9: The final weight loss from the TGA plot and the carbon content via CHNS
Analyser of the spent Hi-FUEL catalyst, tested at 400 and 600 oC.
It is important to understand how a different reaction temperature led to different types of
carbon production, and, hence, the reaction can be postulated. The carbon precursors, such as
CO, CH4, C2H4, and C2H6, from both reaction sets were analysed to postulate which carbon
precursor was dominant at a certain reaction temperature; these are plotted as Figures 8.10 (a)
for CO and 8.10 (b) for CH4, C2H4, and C2H6.
0
2
4
6
8
10
12
500mg 400 C 500mg 600 C
We
igh
t Lo
ss (
%)
(a)
0
2
4
6
8
10
12
14
500 mg 400 C 500 mg 600 C
Car
bo
n w
eig
ht
(%)
(b)

257
(a)
(b)
Figure 8.10: Carbon yield from Steam Reforming of Glycerol over the Hi-FUEL catalyst at
400 and 600 oC, (a) CO and (b) CH4, C2H4 and C2H6
By analysing the carbon yield of the outlet gas, the production of CO at 400 oC had a similar
trend with the carbon deposited using the exact reaction set. Due to the disproportion of CO,
which was in excess at this temperature, CO may react with hydrogen to produce carbon and
water and/or some CO may undergo the Bouduard reaction, which was then converted into
carbon and CO2. This corresponds with earlier findings, as discussed in Chapter 6, for which
at 400 oC, hydrogenolysis reaction was dominant. As discussed in Chapter 6, most of the
secondary and tertiary products synthesised resulted from hydrogenolysis and hydrogenation.
The increased amounts of methane and the reduction of free carbon at a higher space-time for
both temperatures might also result from the reversible reaction of methane decomposition.
This suggests that at a low catalyst loading (low space-time), the free carbon may be
produced from methane decomposition, which did not occur on the catalytic surface;
however, as the catalyst loading increased, there was a sufficient surface area for the reverse
reaction of methane decomposition, and, hence, the coke reacted with hydrogen to produce
methane.
0.0
10.0
20.0
30.0
40.0
50.0
60.0
70.0
0.00 0.05 0.10
Car
bo
n Y
ield
(%
)
Space time/hour
CO 400
CO 600
0.0
2.0
4.0
6.0
8.0
10.0
12.0
0.00 0.05 0.10
Car
bo
n Y
ield
(%
)
Space time/hour
CH4 400 CH4 600
C2H4 400 C2H4 600
C2H6 400 C2H6 600

258
Section 6.5 of Chapter 6 on the effects of adding external hydrogen on glycerol steam
reforming at 400 oC over Hi-FUEL catalyst is further discussed in this section. The coke
deposited on the catalyst was also analysed using the CHNS Analyser. It was found that the
carbon deposited on the Hi-FUEL catalyst in the presence of external hydrogen increased
from 0.023 g to 0.034 g, and it was found earlier that CO was significantly reduced with the
increased CH4. This proves that the main precursor in coke formation at 400 oC was CO,
which promoted amorphous carbon.
Ethylene and ethane productions indicated an increasing trend at 400 oC, as a result of
hydrogenation, as discussed earlier in the two previous chapters; conversely this forms an
opposite scenario at 600 oC. Although these precursors may lead to coke formation, this may
be offset, predominantly by carbon gasification, however, the total carbon produced
decreased at a longer space-time. At 600 oC, ethylene and CO were postulated to become the
precursor of carbon production, and, therefore, the reduction of ethylene and CO due to
catalytic reaction, reduced the production of free carbon and deposited carbon as the space-
time significantly increased.
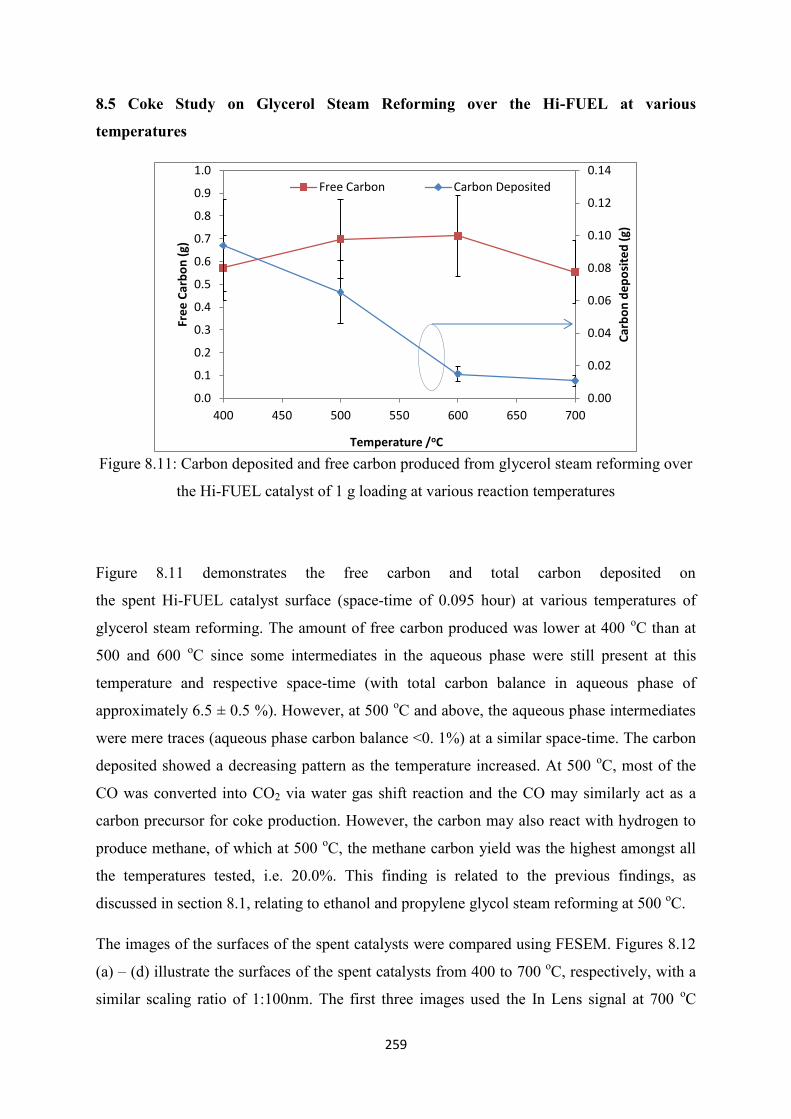
259
8.5 Coke Study on Glycerol Steam Reforming over the Hi-FUEL at various
temperatures
Figure 8.11: Carbon deposited and free carbon produced from glycerol steam reforming over
the Hi-FUEL catalyst of 1 g loading at various reaction temperatures
Figure 8.11 demonstrates the free carbon and total carbon deposited on
the spent Hi-FUEL catalyst surface (space-time of 0.095 hour) at various temperatures of
glycerol steam reforming. The amount of free carbon produced was lower at 400 oC than at
500 and 600 oC since some intermediates in the aqueous phase were still present at this
temperature and respective space-time (with total carbon balance in aqueous phase of
approximately 6.5 ± 0.5 %). However, at 500 oC and above, the aqueous phase intermediates
were mere traces (aqueous phase carbon balance <0. 1%) at a similar space-time. The carbon
deposited showed a decreasing pattern as the temperature increased. At 500 oC, most of the
CO was converted into CO2 via water gas shift reaction and the CO may similarly act as a
carbon precursor for coke production. However, the carbon may also react with hydrogen to
produce methane, of which at 500 oC, the methane carbon yield was the highest amongst all
the temperatures tested, i.e. 20.0%. This finding is related to the previous findings, as
discussed in section 8.1, relating to ethanol and propylene glycol steam reforming at 500 oC.
The images of the surfaces of the spent catalysts were compared using FESEM. Figures 8.12
(a) – (d) illustrate the surfaces of the spent catalysts from 400 to 700 oC, respectively, with a
similar scaling ratio of 1:100nm. The first three images used the In Lens signal at 700 oC
0.00
0.02
0.04
0.06
0.08
0.10
0.12
0.14
0.0
0.1
0.2
0.3
0.4
0.5
0.6
0.7
0.8
0.9
1.0
400 450 500 550 600 650 700
Car
bo
n d
ep
osi
ted
(g)
Fre
e C
arb
on
(g)
Temperature /oC
Free Carbon Carbon Deposited
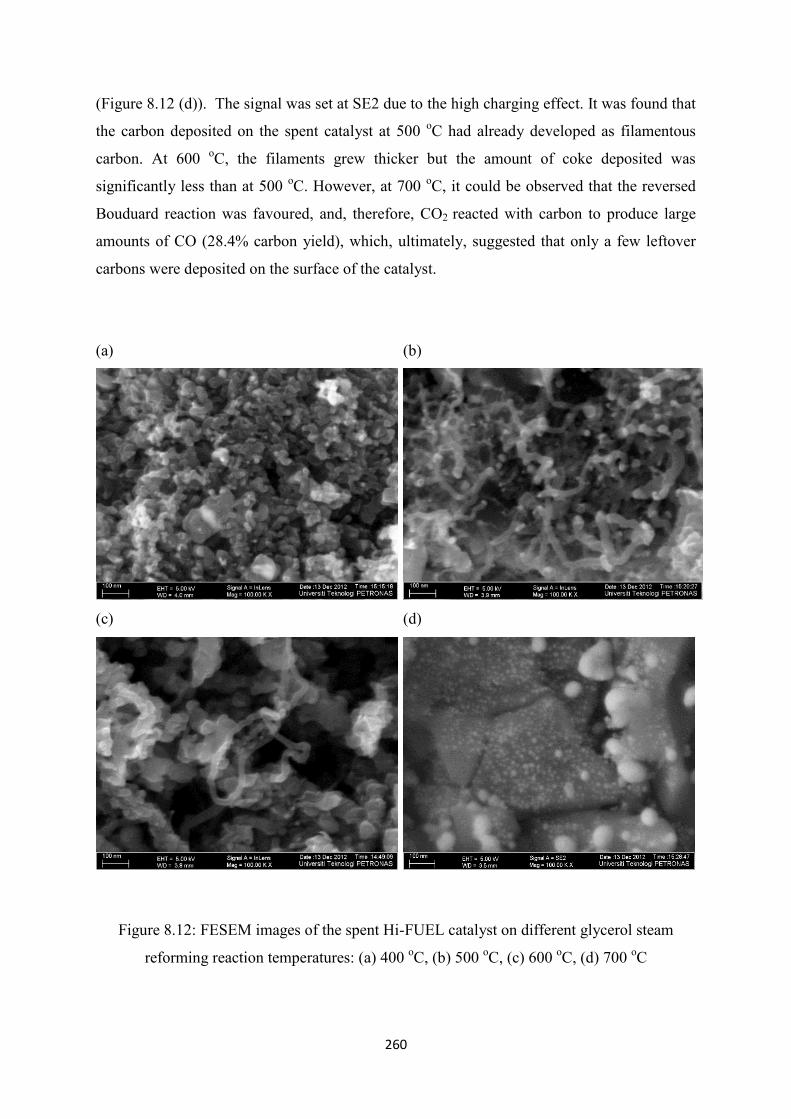
260
(Figure 8.12 (d)). The signal was set at SE2 due to the high charging effect. It was found that
the carbon deposited on the spent catalyst at 500 oC had already developed as filamentous
carbon. At 600 oC, the filaments grew thicker but the amount of coke deposited was
significantly less than at 500 oC. However, at 700
oC, it could be observed that the reversed
Bouduard reaction was favoured, and, therefore, CO2 reacted with carbon to produce large
amounts of CO (28.4% carbon yield), which, ultimately, suggested that only a few leftover
carbons were deposited on the surface of the catalyst.
(a)
(b)
(c)
(d)
Figure 8.12: FESEM images of the spent Hi-FUEL catalyst on different glycerol steam
reforming reaction temperatures: (a) 400 oC, (b) 500
oC, (c) 600
oC, (d) 700
oC

261
8.6 Carbon Formation at Elevated Steam Partial Pressure
As elaborated upon in Chapter 6, steam reforming of glycerol was conducted at three
different steam to fuel (S/F) ratios, and glycerol was fixed at 0.022 mol/hour, equivalent to a
partial pressure of 2.2 kPa. The steam supplied varied accordingly (S/F of 8.1, 12.1 and 20.2)
and was represented in terms of partial pressure.
Figure 8.13: Effect of steam partial pressure/kPa of glycerol steam reforming over the Hi-
FUEL catalyst at 600 oC to the total, free and deposited carbon on the spent catalyst
Figure 8.13 depicts the total carbon produced, free carbon, and deposited carbon on the spent
Hi-FUEL by varying the steam partial pressure. The CHNS Analyser was used to quantify
the percentage of carbon deposited on the surface of the catalyst, while free carbon was
estimated using a similar method, as discussed in section 8.2. It is interesting to note that, to a
certain extent, the addition of steam increased the amount of carbon deposited on the catalyst
surface, and, at the same time, reduced the production of free carbon. Carbon deposition may
result from the Bouduard reaction as the CO yield significantly reduced with the increasing
yield of carbon deposited and CO2. Accordingly, it was proposed that the production of the
coke was due to the increased catalytic activity. During higher steam partial pressure
experiment, the reduction of free carbon and carbon deposited was proposed to result from
coke gasification activity, which yielded greater amounts of CO2 with an increasing steam
partial pressure:
(8.13)
0.00
0.05
0.10
0.15
0.20
0.25
0.30
0.35
0.40
0.0
0.1
0.2
0.3
0.4
0.5
0.6
0.7
0.8
0.9
1.0
15 20 25 30 35 40 45
Car
bo
n d
ep
osi
ted
(g)
Car
bo
n p
rod
uce
d (
g)
Steam partial pressure, kPa
Free Carbon
Total Carbon Produced
Deposited Carbon

262
8.7 Comparison on coke deposition between Ni/Al2O3 and Ni-Ca/Al2O3 catalysts
Figure 8.14 depicts the carbon weight (%) obtained from the CHNS Analyser using two
different commercial catalysts (Hi-FUEL and NiAl(C)) with two catalyst loadings at 600 oC.
In addition, Figure 8.15 depicts the free carbon produced for both catalysts at respective
loadings.
Figure 8.14: The amount of carbon deposited (weight %) as analysed using the CHNS
Analyser
Figure 8.15: Free carbon produced (mol/hour) for Hi-FUEL and NiAl(C) at
two catalyst loadings
0.0
0.5
1.0
1.5
2.0
2.5
Hi-FUEL NiAl(C)
Car
bo
n p
rod
uce
d (
g)
150 mg
500 mg

263
Figure 8.16: The TGA derivative plot (dW/dT) of the spent Hi-FUEL catalyst and the
NiAl(C) tested to glycerol steam reforming at 600 oC and 1 atm.
The findings from CHNS revealed that at low catalyst loading (150 mg), the carbon
deposition on Hi-FUEL catalyst was greater than NiAl(C). This can be related to a higher
production of CO over the Hi-FUEL at low catalyst loading in comparison to NiAl(C), as
discussed in chapter 6. Therefore, CO was regarded as the main precursor for the carbon
deposition at a low catalyst loading at this temperature for both catalysts. At a higher catalyst
loading, however, less carbon was deposited on Hi-FUEL in comparison to NiAl(C). The
production of free carbon for both catalysts was also compared, as presented in Figure 8.15.
Free carbon, which was formed, followed a similar trend as carbon deposition and this
strongly favoured CO as the main precursor for carbon production at 600 oC.
Figure 8.16 depicts the TGA derivative plot (dW/dT) of the spent Hi-FUEL and NiAl(C),
respectively. The findings demonstrated that there was a significant difference in the type of
carbon deposited on the Hi-FUEL and NiAl(C) catalyst in which the carbon deposited on the
Hi-FUEL catalyst was less than a typical commercially available nickel/alumina catalyst. In
addition, it can be easily gasified for re-generation, as supported by Choong et al. [7].
-0.002
-0.0015
-0.001
-0.0005
0
0.0005
0 100 200 300 400 500 600 700 800 900
dW
/dT
Temperature / oC
500mg NiAl(C)
500mg Hi-FUEL

264
8.8 Comparison on carbon production for synthesised Ni/Al2O3 (NiAl(S)) and
commercial Ni/Al2O3 (NiAl(C))
Catalysts Carbon Deposited (g) Free Carbon (g) Total Carbon Produced (g)
NiAl(C) 0.076 0.83 0.90
NiAl(S) 0.057 1.06 1.12
Table 8.2: Comparison of carbon production between NiAl(C) and NiAl(S)
Table 8.2 illustrates the comparison between two Ni/Al2O3 catalysts and it can be agreed that
both catalysts are comparable with almost similar results. However, the greater amount of
free carbon produced via NiAl(S) may result from the poorly impregnated nickel on the
alumina, as can be observed from the TPR results in Chapter 4.
8.9 The Effects of Calcium Variation on Carbon Production
As highlighted in Chapter 7, by varying the calcium loading (3Ca, 7Ca and 9Ca), a plot
consisting of total carbon was produced. The free carbon and carbon deposited on the surface
of the catalyst can be demonstrated, as shown in Figure 8.17. The first observation was made
on the total carbon and free carbon produced based on the carbon balance estimation. The
finding from the observation depicted a decreasing trend of carbon production with an
increasing weigh percentage of calcium. This was compared against pure γ-alumina, which is
denoted as 0 wt% of Ca. The impregnation of calcium on alumina was able to reduce the total
carbon production and carbon deposition on the catalyst surface due to its basicity that may
assist in neutralising the acidity of alumina. Nevertheless, Ca also promoted hydrogenolysis
of the intermediates, as discussed in Chapter 7. While ethylene had been reported as the main
precursor for carbon production in the presence of alumina, which turned into encapsulating
carbon [17], it was postulated that in the presence of calcium, the carbon may be eliminated
via coke gasification in the presence of excess steam into CO and H2. By increasing the
calcium loading, carbon production was reduced and the CO flow increased.
Analysis of the TEM images, as in Figures 8.18 (a) to (d), revealed no significant difference
between the fresh catalyst of 3Ca (a) and 9Ca (b) and the respective spent catalysts (c) and
(d). This is due to the possibility that large amounts of the carbon produced were of free
carbon, and this particular type of carbon is easily gasified and eliminated.

265
Figure 8.17: Total carbon produced, free carbon and carbon deposited on xCa/Al2O3 from
glycerol steam reforming at 600 oC
(a) Fresh 3Ca (b) Spent 3Ca
0.00
0.05
0.10
0.15
0.20
0.25
0.00
0.50
1.00
1.50
2.00
2.50
0 2 4 6 8
Car
bo
n d
ep
osi
ted
/ g
carb
on
pro
du
ced
(g)
Calcium wt%
Free Carbon Total Carbon Carbon deposited

266
(c) Fresh9Ca
(d) Spent 9Ca
Figure 8.18: TEM images of fresh and the spent catalysts
(a) Fresh 3Ca, (b) Spent 3Ca, (c) Fresh 9Ca, (d) Spent 9Ca
8.9 Carbon Formation on Calcium Doped Nickel/Alumina
Figure 8.19 below depicts the total carbon production from glycerol steam reforming over
NiAl(S), 15Ni3Ca and 15Ni7Ca. Figure 8.20 portrays the derivative of the TGA (dW/dT)
profile for different types of catalyst that underwent glycerol steam reforming at 600 oC.
Finally, Figures 8.21(a) and (b) illustrate the TEM images for the spent 15Ni3Ca.
It is interesting to note that the total carbon formed (free carbon and deposited carbon) was
reduced significantly with increasing calcium loading, as demonstrated in Figure 8.19. This is
based on the assumption that the leftover balance of liquid and gas phases were converted
into carbon. In comparison to NiAl(S), carbon was deposited at an almost similar percentage
(6-8 wt.%) to the 15Ni3Ca, as given by the CHNS Analyser.

267
Figure 8.19: Total carbon produced at different Ca doped to Ni/Al2O3 catalysts from glycerol
steam reforming at 600 oC
Figure 8.20: Derivative of TGA (dW/dT) profiles for different catalysts underwent glycerol
steam reforming at 600 oC
0.0
0.2
0.4
0.6
0.8
1.0
1.2
1.4
0 1 2 3 4 5 6 7
Tota
l car
bo
n p
rod
uce
d (
g)
15NixCa/Al2O3
-0.005
-0.004
-0.003
-0.002
-0.001
0
0.001
0 100 200 300 400 500 600 700 800 900
dW
/dT
Temperature / oC
15Ni3Ca
Hi-FUEL
Al2O3
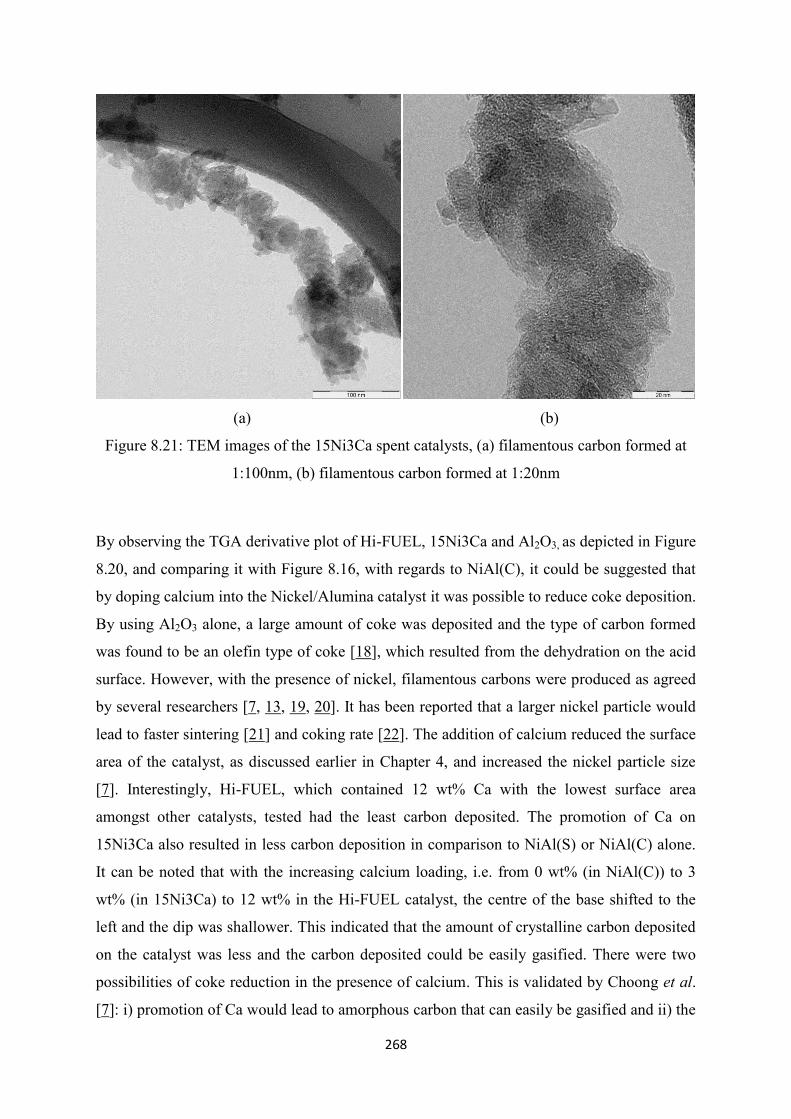
268
(a)
(b)
Figure 8.21: TEM images of the 15Ni3Ca spent catalysts, (a) filamentous carbon formed at
1:100nm, (b) filamentous carbon formed at 1:20nm
By observing the TGA derivative plot of Hi-FUEL, 15Ni3Ca and Al2O3, as depicted in Figure
8.20, and comparing it with Figure 8.16, with regards to NiAl(C), it could be suggested that
by doping calcium into the Nickel/Alumina catalyst it was possible to reduce coke deposition.
By using Al2O3 alone, a large amount of coke was deposited and the type of carbon formed
was found to be an olefin type of coke [18], which resulted from the dehydration on the acid
surface. However, with the presence of nickel, filamentous carbons were produced as agreed
by several researchers [7, 13, 19, 20]. It has been reported that a larger nickel particle would
lead to faster sintering [21] and coking rate [22]. The addition of calcium reduced the surface
area of the catalyst, as discussed earlier in Chapter 4, and increased the nickel particle size
[7]. Interestingly, Hi-FUEL, which contained 12 wt% Ca with the lowest surface area
amongst other catalysts, tested had the least carbon deposited. The promotion of Ca on
15Ni3Ca also resulted in less carbon deposition in comparison to NiAl(S) or NiAl(C) alone.
It can be noted that with the increasing calcium loading, i.e. from 0 wt% (in NiAl(C)) to 3
wt% (in 15Ni3Ca) to 12 wt% in the Hi-FUEL catalyst, the centre of the base shifted to the
left and the dip was shallower. This indicated that the amount of crystalline carbon deposited
on the catalyst was less and the carbon deposited could be easily gasified. There were two
possibilities of coke reduction in the presence of calcium. This is validated by Choong et al.
[7]: i) promotion of Ca would lead to amorphous carbon that can easily be gasified and ii) the

269
presence of alkaline metal promoted a large water adsorption site, and assisted in coke steam
gasification. A similar result was expected for 15Ni7Ca. However, it must be mentioned that
this analysis could not be conducted since this catalyst and some others (freshly calcined and
spent) were ruined and unable to be salvaged due to an incident in the office.
Figure 8.21 (a) and (b) illustrate the TEM images of the spent 15Ni3Ca. Analysis of the
images revealed filamentous carbons being formed and there was a partially encapsulated Ni
spotted on the surface. A TOS study is highly recommended for future studies on catalyst
deactivation.

270
8.10 Conclusion
Carbon production analysis was studied in detail for all the oxygenates that underwent steam
reforming in all the perimeters tested. The following can be verified:
i) Ethanol steam reforming over the Hi-FUEL yielded the least amount of carbon
deposited among other oxygenates, whilst the largest amount of coke was
produced from propylene glycol steam reforming. Ethylene glycol steam
reforming mostly yielded an amorphous type of carbon in comparison to others,
which favoured filamentous types of carbon.
ii) The reaction temperature of steam reforming influenced the type of carbon
formed, i.e. at 400 oC, more amorphous carbon was formed and at higher reaction
temperatures, more filamentous carbons were produced. The main coke precursor
in glycerol steam reforming at low temperature was CO, whilst at higher
temperatures, CO and CH4 were the precursors. However, CH4 was not the main
precursor for carbon formation on glycerol steam reforming over the Hi-FUEL,
but the carbon production was governed by the CO disproportion, which led to the
Bouduard reaction. CH4 decomposition to carbon and hydrogen was favourable at
500 oC, and formed filamentous carbon on the catalyst surface, which can be
observed from the glycerol steam reforming activities.
iii) The carbon produced over the Hi-FUEL catalyst and other Ca doped Ni/Al2O3
catalyst was of a defective type of carbon, which can be easily gasified. This is
produced mainly from the catalytic activities rather than dehydration on the
alumina surface, which corroborated other findings in that promoting Ca would
reduce the coke formation, especially encapsulating carbon/olefin type of carbon.
The presence of large amounts of water assisted in the gasification of the carbon
formed.

271
8.11 References
[1] X. Hu and G. Lu, "Investigation of the steam reforming of a series of model
compounds derived from bio-oil for hydrogen production," Applied Catalysis B:
Environmental, vol. 88, pp. 376-385, 2009.
[2] S. Helveg, J. Sehested, and J. R. Rostrup-Nielsen, "Whisker carbon in perspective,"
Catalysis Today, vol. 178, pp. 42-46, Dec 15 2011.
[3] J. A. Medrano, M. Oliva, J. Ruiz, L. Garcia, and J. Afauzo, "Catalytic steam
reforming of model compounds of biomass pyrolysis liquids in fluidized bed reactor
with modified Ni/Al catalysts," Journal of Analytical and Applied Pyrolysis, vol. 85,
pp. 214-225, May 2009.
[4] C. K. Cheng, S. Y. Foo, and A. A. Adesina, "Steam reforming of glycerol over
Ni/Al2O3 catalyst," Catalysis Today, vol. 178, pp. 25-33, Dec 15 2011.
[5] E. A. Sánchez, M. A. D'Angelo, and R. A. Comelli, "Hydrogen production from
glycerol on Ni/Al2O3 catalyst," International Journal of Hydrogen Energy, vol. 35,
pp. 5902-5907, 2010.
[6] D. Z. Mezalira, L. D. Probst, S. Pronier, Y. Batonneau, and C. Batiot-Dupeyrat,
"Decomposition of ethanol over Ni/Al2O3 catalysts to produce hydrogen and carbon
nanostructured materials," Journal of Molecular Catalysis a-Chemical, vol. 340, pp.
15-23, Apr 23 2011.
[7] C. K. S. Choong, Z. Y. Zhong, L. Huang, Z. Wang, T. P. Ang, A. Borgna, J. Y. Lin,
L. Hong, and L. W. Chen, "Effect of calcium addition on catalytic ethanol steam
reforming of Ni/Al2O3: I. Catalytic stability, electronic properties and coking
mechanism," Applied Catalysis a-General, vol. 407, pp. 145-154, Nov 4 2011.
[8] A. F. Cunha, J. J. M. Órfão, and J. L. Figueiredo, "Methane decomposition on Ni-Cu
alloyed Raney-type catalysts," International Journal of Hydrogen Energy, vol. 34, pp.
4763-4772, 2009.
[9] R. M. de Almeida, H. V. Fajardo, D. Z. Mezalira, G. B. Nuernberg, L. K. Noda, L. F.
D. Probst, and N. L. V. Carreno, "Preparation and evaluation of porous nickel-
alumina spheres as catalyst in the production of hydrogen from decomposition of
methane," Journal of Molecular Catalysis a-Chemical, vol. 259, pp. 328-335, Nov 15
2006.

272
[10] Y. Li, D. Li, and G. Wang, "Methane decomposition to COx-free hydrogen and nano-
carbon material on group 8–10 base metal catalysts: A review," Catalysis Today, vol.
162, pp. 1-48, 2011.
[11] Y. Li, B. Zhang, X. Xie, J. Liu, Y. Xu, and W. Shen, "Novel Ni catalysts for methane
decomposition to hydrogen and carbon nanofibers," Journal of Catalysis, vol. 238,
pp. 412-424, 2006.
[12] W. Wang, H. Wang, Y. Yang, and S. Jiang, "Ni–SiO2 and Ni–Fe–SiO2 catalysts for
methane decomposition to prepare hydrogen and carbon filaments," International
Journal of Hydrogen Energy, vol. 37, pp. 9058-9066, 2012.
[13] A. Carrero, J. A. Calles, and A. J. Vizcaino, "Effect of Mg and Ca addition on coke
deposition over Cu-Ni/SiO2 catalysts for ethanol steam reforming," Chemical
Engineering Journal, vol. 163, pp. 395-402, Oct 1 2010.
[14] A. L. Alberton, M. M. V. M. Souza, and M. Schmal, "Carbon formation and its
influence on ethanol steam reforming over Ni/Al2O3 catalysts," Catalysis Today, vol.
123, pp. 257-264, 2007.
[15] C. K. S. Choong, L. Huang, Z. Y. Zhong, J. Y. Lin, L. Hong, and L. W. Chen, "Effect
of calcium addition on catalytic ethanol steam reforming of Ni/Al2O3: II.
Acidity/basicity, water adsorption and catalytic activity," Applied Catalysis a-
General, vol. 407, pp. 155-162, Nov 4 2011.
[16] F. Cheng and V. Dupont, "Nickel catalyst auto-reduction during steam reforming of
bio-oil model compound acetic acid," International Journal of Hydrogen Energy, vol.
38, pp. 15160-15172, 2013.
[17] A. J. Vizcaino, P. Arena, G. Baronetti, A. Carrero, J. A. Calles, M. A. Laborde, and
N. Amadeo, "Ethanol steam reforming on Ni/Al(2)O(3) catalysts: Effect of Mg
addition," International Journal of Hydrogen Energy, vol. 33, pp. 3489-3492, Jul
2008.
[18] V. Chiodo, S. Freni, A. Galvagno, N. Mondello, and F. Frusteri, "Catalytic features of
Rh and Ni supported catalysts in the steam reforming of glycerol to produce
hydrogen," Applied Catalysis A: General, vol. 381, pp. 1-7, 2010.
[19] J. K. Xu, Z. J. Li, J. H. Wang, W. Zhou, and J. X. Ma, "Characterization and Analysis
of Carbon Deposited on the Surface of Ni/Al2O3 Catalyst for Methane Dry
Reforming," Acta Physico-Chimica Sinica, vol. 25, pp. 253-260, Feb 2009.

273
[20] T. Davidian, N. Guilhaume, E. Iojoiu, H. Provendier, and C. Mirodatos, "Hydrogen
production from crude pyrolysis oil by a sequential catalytic process," Applied
Catalysis B-Environmental, vol. 73, pp. 116-127, Apr 24 2007.
[21] J. Sehested, "Sintering of nickel steam-reforming catalysts," Journal of Catalysis, vol.
217, pp. 417-426, Jul 25 2003.
[22] D. Chen, K. O. Christensen, E. Ochoa-Fernandez, Z. X. Yu, B. Totdal, N. Latorre, A.
Monzon, and A. Holmen, "Synthesis of carbon nanofibers: effects of Ni crystal size
during methane decomposition," Journal of Catalysis, vol. 229, pp. 82-96, Jan 1 2005.
274
CHAPTER 9: CONCLUSION, LIMITATIONS OF STUDIES AND
RECOMMENDATIONS FOR FUTURE WORK
9.1 General Conclusion
Overall, what can be concluded and revealed from this doctoral research is that the steam
reforming of the oxygenated hydrocarbons of the homologues investigated was found to be
promising in producing a high yield of hydrogen over a commercial catalyst that is developed
for natural gas steam reforming. Interestingly, analysis of the findings proposed an alternative
and sustainable substitute to the current supply in the petrochemical industry for hydrogen
production. Most importantly, the findings disclosed that there was no need to change the
catalysts utilized for the steam reforming process. Therefore, this discovery provides a
potential savings plan in the field of catalyst development. It is highly recommended that in
the near future, these oxygenates may be co-fed with natural gas to yield either hydrogen rich
gas or syn gas (CO and H2). This is mainly because such a method offers the following
benefits: i) extending the shelf-life of natural gas and ii) providing internal energy from the
oxygen atoms contained within the oxygenates molecule, hence enhancing the steam
reforming reaction, which is energy intensive.
It can also be proven that the steam reforming of glycerol over calcium doped nickel/alumina
catalyst produced a high yield of hydrogen. The hydrogen produced was far greater than
other similar reactions that used a nickel/alumina catalyst. However, it is vital to highlight
here that the reforming and catalytic cracking reaction compete with hydrogenolysis and
hydrogenation reactions. Although the hydrogenolysis reaction in glycerol reforming led to a
higher CO yield, the catalyst reduced the overall amounts of carbon produced and carbon
deposited on the catalyst, hence allowing a stable reaction without a significant sign of
deactivation during long operation hours. In addition, using calcium doped nickel/alumina
allowed the production of syn gas (CO and H2) at lower temperatures due to the domination
of hydrogenolysis and hydrogenation at a low reaction temperature. The carbon produced on
this catalyst surface was found to be a type of defective filamentous carbon at high
temperature, and amorphous at a lower reaction temperature. Both types of carbons were
easily gasified and re-generated and the formation of the encapsulating carbon resulting from
the ethylene dehydration was successfully inhibited.
275
Moreover, the discovery of the complex glycerol intermediates prior to the production of
final products is a breakthrough in glycerol reforming research, which has not been reported
in any glycerol steam reforming studies to date. This finding leads to the concept of the
integrated bio-refinery plant. Several models were proposed earlier by some prominent
researchers who have viewed catalytic valorisation of glycerol from a different research
perspective [1-6]. Further analysis of the findings revealed the presence of some value added
chemicals, such as acetol, allyl alcohol, acrolein, ethylene glycol, propylene glycol, and
methanol. Interestingly, these chemicals formed as intermediates of the glycerol reforming
reaction with or without the presence of the catalyst in a varied distribution. This finding
triggers the possibility to selectively produce the desired intermediates and add value to the
overall process. For example, a biodiesel plant, which produces glycerol as its by-products
can be further integrated with a glycerol reforming plant and the production of these valued
added chemicals. The findings derived from glycerol steam reforming over calcium doped
nickel/alumina catalyst also widened the opportunity to investigate the ability of this catalyst
on sugar-based hydrocarbons undergoing reforming, such as sorbitol and glucose. It is
important to highlight here that the sugar-based and biomass derivative products undergo a
thermal treatment, such as reforming, is the research trend nowadays [7-14].
Several conclusions can be drawn from the previous chapters concerning the steam reforming
of oxygenated hydrocarbons. In addition, some recommendations and limitations are also
mentioned in order to improve the scientific methods in obtaining the experimental results.
Finally, recommendations for the future directions of this doctoral research are discussed and
presented.
9.1.1 Thermodynamic equilibrium study
A thermodynamic equilibrium study using the Gibbs energy minimisation method was
carried out using an Aspen-HYSYS simulator on four types of oxygenate (ethanol, ethylene
glycol, propylene glycol, and glycerol), which are interrelated as a series of homologues. It
was observed that for the oxygenate with CxHyOz chemical formula relating to monohydric or
polyhydric alcohols, the ratio of oxygen to carbon (z/x) within the hydrocarbon molecule
itself influenced the ability of the reaction to maintain its temperature at thermo neutral
condition, as well as the CO/CO2 ratio and H2 selectivity. As for the steam reforming
reaction, which was set in a similar steam to fuel ratio and reaction temperature, the

276
following hydrogen yield from the oxygenates involved can be ranked accordingly. This
signifies the importance of the z/x ratio in that the lower the x value, the higher the hydrogen
yield achieved:
If the steam reforming was conducted at atmospheric pressure with a range of temperature
from 500 to 700oC, the thermodynamic equilibrium study suggested that the higher the steam
to fuel ratio, the higher the hydrogen yield that could be achieved, which was as expected
from Le Chatelier’s principle. The comparison between auto thermal and steam reforming
revealed that although the addition of air reduced the external heating requirement to
maintain a similar reaction temperature, it lowered the hydrogen yield since the reaction
could possibly be governed by partial oxidation.
9.1.2 Oxygenated hydrocarbons suitability
The testing of all four oxygenates using a similar catalyst loading and within a relatively high
space-time, indicated that the thermodynamic equilibrium was attainable. However, only
ethanol and ethylene glycol steam reforming final products were comparable to the
equilibrium value. Conversely, propylene glycol and glycerol steam reforming, even though
they were tested at a slightly higher steam to fuel ratio due to the limitations of the syringe
pump; the results did not give any value closer to the equilibrium. This was due to the
presence of other reactions, such as hydrogenolysis and hydrogenation that utilised the
hydrogen to produce other components. The propylene glycol and glycerol steam reforming,
reaction therefore, may require a higher catalyst loading to achieve the equilibrium. It is
highly recommended that more focus on ethylene glycol steam reforming be considered in
the future since ethylene glycol yielded promising results with hydrogen yield, as high as
89.4% at 600 oC. In addition, although not fully studied, the carbon deposited on the Hi-
FUEL spent catalyst from ethylene glycol steam reforming activity was of an amorphous
type; hence, the re-generation of the catalyst would be easier. As for other oxygenates, the
carbon formation was more crystalline (nano structured and filamentous carbons), which
required a higher re-generation temperature.

277
9.1.3 Glycerol steam reforming over Hi-FUEL catalyst
Glycerol steam reforming over the Hi-FUEL catalyst consists of complex multi-reactions,
which involved thermal decomposition, dehydration, dehydrogenation, hydrogenolysis, and
other gas phase reactions. During the blank tube experiment, the presence of inert material,
such as quartz wool and silica carbide, influenced the reaction. Acetol, allyl alcohol, and
condensation products were the main intermediates prior to reaching the catalyst surface and
their formation varied according to the reaction temperature. At a higher temperature, more
acetol and allyl alcohol were produced, while condensation products were reduced. Allyl
alcohol production was suppressed in the presence of silica carbide (SiC) and SiC increased
in dehydration activity. When different catalyst loadings were tested in two differing
temperatures, the finding at 400 oC differed significantly with thermodynamic equilibrium
value. At 600 oC, there was an increasing pattern of hydrogen yield towards the equilibrium,
but the value was still ±15-20% lower than the equilibrium. It was found that the
hydrogenolysis and hydrogenation consumed the hydrogen produced within the reaction. The
addition of external hydrogen to the reactor at 400 oC indicated a domination of glycerol
hydrogenolysis and hydrogenation on the catalyst surface.
An optimum reaction temperature of glycerol steam reforming over Hi-FUEL was at 600 oC.
At 400 oC, thermal decomposition and hydrogenolysis were dominant, whilst at 500
oC, the
water-gas shift reaction was active, but did not produce high amounts of hydrogen, as
compared to the reaction at 600 oC. Although at 700
oC, high amounts of hydrogen could
still be produced, CO production was dominant, due to the reverse Bouduard reaction,
suggesting that above 700 oC, syngas production was desirable. The carbon deposited on the
catalyst surface also reduced as the temperature increased. The addition of steam to the
reaction improves CO2 selectivity due to water-gas shift reaction, but at the same time, this
increased the amount of carbon deposited, due to the increased catalytic activity.
278
9.1.4 Hi-FUEL versus NiAl(C)
Although both catalysts were nickel based and supported with alumina, there are significant
differences in both the catalysts resulting from the presence of calcium as the promoter in the
Hi-FUEL catalyst. Less catalytic reactions took place on the surface of NiAl(C); hence, at a
low catalyst loading, a higher hydrogen yield could be achieved in comparison to Hi-FUEL.
However, as space-time increased, the Hi-FUEL enhanced a higher H2 yield, which
approached the desired equilibrium and there was not much change in hydrogen yield to
NiAl(C). Calcium has been reported as a good CO2 sorption material, and thus provided an
avenue for the active water-gas shift reaction for the reactants involved. It was also found that
the coke deposition on the Hi-FUEL catalyst was lower than NiAl(C), suggesting that the
presence of calcium inhibits the catalyst deactivation. The TOS study indicated that the
catalyst was active and the products’ selectivity was not affected during long hours of
operation.
9.1.5 The influence of calcium doped on Ni/Al2O3 catalyst
By varying the calcium loading with alumina, it can be confirmed that the promotion of
calcium increased the tendency of hydrogenolysis reaction. The higher the calcium loading,
the higher the production of CO. This explains the phenomenon that occurred over the Hi-
FUEL catalyst. Nickel allows the conversion of all intermediates produced from
homogeneous reactions and the one produced on the calcium and the alumina surface
matches that of the desired final products. Based on the coke analysis, it can be suggested that
as the calcium loading increased, less coke was produced and deposited on the surface. This
may result from the coke gasification reaction. The findings also indicate that it is only at an
extended space-time that CO will eventually convert into CO2 at the respective reforming
temperature via water-gas shift reaction, hence producing hydrogen that approaches the ideal
equilibrium value. The ratio of Ca/Ni weight percentage also played an important role for
further catalyst optimisation as a higher Ca/Ni ratio (> 0.5) may lead to higher formations of
CO and the hydrogen produced may be utilised for hydrogenolysis. However, the carbon
deposited would be lower as the Ca/Ni increased.
279
9.1.6 The coke deposition studies
While coke deposition may result in catalyst deactivation, the carbon deposited on the Hi-
FUEL catalyst in this oxygenated hydrocarbons reforming did not affect the reaction and is
considered as part of the catalytic activity. The basic site of the catalyst (calcium) reduced the
formation of ethylene on the acidic site; hence hindering the encapsulating carbon formation.
The formation of filamentous carbon, as well as amorphous carbon, in most of the tests can
generally be re-generated easier than other types of carbons formed. The net carbon deposited
on the Hi-FUEL surface was the lowest in comparison to all catalysts tested. It is claimed that
calcium provides a large adsorption site for steam, hence allowing coke gasification to take
place in-situ.

280
9.2 Limitations and Future Improvements
9.2.1 Thermodynamic equilibrium study with coke formation analysis
As discussed in Chapter 3, the thermodynamic equilibrium study conducted using Aspen-
HYSYS was not able to predict the carbon formation in the reaction. Therefore, the
equilibrium data was not available for the comparative study on the experimental results on
the coke formation. Therefore, it is highly recommended that the incorporation of carbon
formation involving thermodynamic equilibrium be further studied for future research.
9.2.2 Experimental Setup
As discussed earlier in Chapter 4, the rig was not fully equipped with a sufficient amount of
thermocouples. A few thermocouples were faulty after several tests and were not replaced
immediately. Therefore, the gradient of the temperature of the bulk flow to the reactor bed
could not be verified. Three thermocouples were required to measure the internal temperature
of the bed, i.e. to measure at the top of the reactor, the centre of the reactor’s bed and the
bottom part of the reactor. Several other thermocouples were required to measure the internal
temperature of the heating tube lines. However, this did not affect the overall findings as
from the unrecorded observation, the isothermality of the system was achieved throughout
the rig during the experiments.
9.2.3 Kinetic analysis regime
Based on the experiments, five data points with a different weight hourly space velocity
(WHSV)(hence different space-time) of Hi-FUEL catalyst were studied for ethanol steam
reforming at 600 oC, and glycerol steam reforming at 400 and 600
oC, respectively. However,
some of the tests were conducted at a longer space-time, hence almost approaching
equilibrium. As a result, some of the intermediates were no longer there. These affected the
kinetic analysis, as it could not be conducted properly with the formation of many
assumptions. In addition, at least two more data sets were required for a complete analysis of
glycerol steam reforming over the Hi-FUEL catalyst, i.e. five data points at 500 and 700 oC.
It is also essential to conduct a study on the effects of varying glycerol partial pressure to a
constant steam partial pressure, as this would fulfil the requirement of differential reactor
methods in order to conduct the kinetic model study.
281
The intermediates discovered in glycerol steam reforming should also be tested on its own or
with steam in the presence of the catalyst so that the series of the reactions could be defined
and confirmed. As an example, acetol or ally alcohol should be tested with steam to evaluate
if they would react to form hydrogen and CO2 straight away or if there were other
intermediates formed prior to the formation of hydrogen. Identifying this would give an
overall view of the whole reaction network in glycerol steam reforming over the Hi-FUEL
catalyst. This will also enable the discovery of a sensible reaction rate coefficient and
activation energy. The results can therefore be compared with the findings for the tests on the
prepared catalysts.
In order to verify some of the postulated reactions, such as hydrogenolysis, perturbation is,
therefore, required. However, in the study, as highlighted in Chapter 6, the amount of
external hydrogen supplied was quite high, and, therefore, an adjustment of the flow is
required for a better analysis in the future. Furthermore, CO and CH4 may also be used to
perturb the reaction to observe if other reactions take place in the presence of excess amounts
of any of these gases.
9.2.4 Limited tests of other catalysts
Hi-FUEL was tested and compared against NiAl(C), 15Ni3Ca, and 15Ni7Ca. The tests were
only conducted at 600 oC and the catalyst loading was quite high and close to the equilibrium.
A lower catalyst loading would allow a better comparison of these catalysts. It was planned to
compare these catalysts at a lower catalyst loading and at a lower reaction temperature, as
well as test other prepared catalysts, such as 15Ni12Ca (12wt% of Calcium); however, due to
some mishaps, these tests could not be carried out.
TOS for other catalysts such as NiAl(C) and 15Ni7Ca is an important test to compare the
stability of the catalysts. However, these were not carried out during the stipulated period.
The coke analysis could not be properly carried out for the prepared calcium doped
nickel/alumina catalyst since only the 15Ni3Ca underwent microanalysis using the CHNS
Analyser and TGA. The 15Ni7Ca was not able to be tested because it was destroyed in an
incident after the catalyst test.
It is of great importance to note that the Hi-FUEL catalyst is either supported by α–alumina
or calcium aluminate, CaAl2O4, while the compared catalysts were supported with γ–alumina.
This can be observed from the total BET surface area, as discussed in chapter 4, of which
282
α–alumina or CaAl2O4 had a very low surface area, while the γ–alumina supported catalyst
has a very high surface area [15]. As mentioned earlier γ–alumina may cause dehydration
due to its acidity, but α–alumina or CaAl2O4 is yet to be discovered since the preparation of
α–alumina or CaAl2O4 requires a much higher heating temperature, which may or may not
have any effect on the reactants. The comparisons made in previous chapters only considered
the presence and the absence of calcium, while it is actually important to consider the effects
it may have on these two types of alumina in the reforming reaction. Similarly, the
preparation method for the Hi-FUEL is probably different with the lab-synthesised catalysts,
and, hence, is a limitation of the comparison.
9.2.5 TGA and XRD limitation
Due to the mishap that ruined several catalysts (fresh and spent), the amount of catalyst
required for XRD analysis was not sufficient, hence it was not possible to obtain a good
crystalline peak for the active metals on the fresh and the spent catalyst. Therefore, the TGA
of the spent catalyst could not be explained as no evidence could be provided concerning
whether there was any oxidation of Ni to NiO or any formation of CaCO3 over the catalyst.

283
9.3 Future work
9.3.1 Extended study on kinetic analysis of glycerol steam reforming over Hi-FUEL
This doctoral research work successfully provided a discovery of the intermediates present in
the glycerol steam reforming reaction. This is an important finding, not yet reported to date in
a specialised area concerning any type of catalyst nor homogeneous reaction. Glycerol
vapour was susceptible to changes, such as changing reaction temperatures, the presence of
inert (SiC, quartz wool), as well as the distance of tube length from the vaporiser to the
catalyst bed. The production of acetol and allyl alcohol as intermediates at high temperature
is yet to be explored. In addition, the sequence of the reactions needs to be validated since
this particular study could only provide postulations, and the findings are mostly on glycerol
valorisation studies conducted by other researchers.
It is therefore strongly recommended that future research should incorporate more data points
at different temperatures on glycerol steam reforming, testing the catalyst with the
intermediates (e.g. acetaldehyde steam reforming, acetol steam reforming, and allyl alcohol
steam reforming) and to disrupt the flow in the reactor with additional small amounts of
gases, such as hydrogen, CO, CO2, CH4, C3H8, and C2H6 to identify which major reactions
may occur within the catalyst bed.
Analysis of the results indicates that it is important to calculate the rate coefficient and
activation energy of the catalyst, conduct statistical tests and suggest an appropriate kinetic
model of the catalytic activity on the Hi-FUEL surface.
9.3.2 Extended study on comparison of Hi-FUEL with NiAl(C) and other prepared
catalysts (15Ni3Ca, 15Ni7Ca)
As discussed in Chapter 6, the CO gas selectivity from the glycerol reforming activity over
Hi-FUEL at 400 oC was significantly different in comparison to the prediction made via the
thermodynamic equilibrium study. It is believed that the outcome of the study was largely
influenced by the doped calcium, which promoted hydrogenolysis. However, this could be
strongly rectified by testing NiAl(C), 15Ni3Ca, and 15Ni7Ca at 400 oC, which was not
possible to conduct earlier due to the time constraints. The pattern of CO production may be
observed to confirm if increased calcium loading may also increase CO production at 400 oC.
284
The lack of TOS analysis of other catalysts constitutes another limitation of this doctoral
research. It is highly suggested that two or more catalysts need to be tested, i.e. NiAl(C) and
15Ni7Ca or 15Ni3Ca, in order to compare the stability of the catalyst in the absence of
calcium, at a small calcium loading, and when the calcium is in excess. Hypothetically, the
presence of calcium will make the catalyst more stable in comparison to NiAl(C). However,
15Ni7Ca or 15Ni3Ca might show earlier signs of deactivation since they were poorly
impregnated in comparison to the commercial catalyst.
9.3.3 Exploration of Group II doped to Nickel/Alumina catalyst on glycerol steam
reforming
Several previous researchers had conducted studies on reforming using group II metals, either
as a promoter or a support due to its strong basicity. As discovered earlier, the presence of
calcium in Hi-FUEL or the lab prepared Ni-Ca/Alumina catalyst reduced the coking
tendency, as well as reduced the formation of ethylene that may be formed via dehydration on
alumina site. It would be interesting to see if a similar or better finding could be made by
promoting magnesium, strontium or barium to nickel/alumina on glycerol steam reforming,
with the aim of discovering if the hydrogenolysis phenomenon would exist in other group II
doped catalysts. Although a comparison has been made with Wang et al. [16], their work
focused on equilibrium regime, and, thus, made it difficult to detect the intermediate species.
In addition, it is believed that Wang et al. assumed that all intermediates were in an aqueous
phase as glycerol, making the comparative study very limited. Since Group II elements are
alkaline earth metals, the basicity of these metals is assumed to offset the acidity of alumina,
and, hence, intrinsically control the formation of coke on the surface. The promotion of these
metals may also possibly avoid the carbon encapsulation caused by ethylene polymerisation,
which, similarly, could be performed by Hi-FUEL.
It has also been proven that some previous researchers had conducted ethanol steam
reforming [17, 18] with a Ni/Ca weight percentage ratio of equal or less than 1 (which means
Ca/Ni ≥ 1). A similar study could be conducted using the initial hypothesis that glycerol and
its intermediates may undergo hydrogenolysis, and, thus, requires an extended space-time
(higher catalyst loading) to yield a higher hydrogen amount.
285
9.3.4 Comparisons of calcium doped on Ni/Al2O3 and noble metals
Nowadays, many catalysts were developed from noble metals since noble metals provide
higher products’ selectivity, greater yield and stability, but are more costly due to its rarity.
Several prominent researchers conducted oxygenated hydrocarbons reforming over the noble
metal catalysts and reported that greater yield and selectivity of hydrogen could be achieved,
as well as a stable operation without deactivation during long operation hours [19-22].
Therefore, incorporation and optimisation of noble metals, such as Rh or Ru, to the present
calcium doped nickel/alumina catalyst would create an interesting research work that is
deemed worthy when it is compared to the current developed catalyst. It is hoped that without
the presence of noble metals or only on a small percentage of this noble metal, the catalyst
will be a superior catalyst in steam reforming and other reforming technologies.
9.3.5 Comparison of Hi-FUEL with Ni/Al2O3 and the prepared catalysts on other
oxygenates steam reforming
Although there was an initial plan to compare the synthesised catalysts with Hi-FUEL in
other oxygenates (ethylene glycol, ethanol and propylene glycol), it could not be done due to
time constraints. This comparative study is important, as it is able to provide a different
perspective, if calcium would behave similarly in other oxygenates like the glycerol steam
reforming in terms of promoting hydrogenolysis and be an excellent CO2 sorption material.
In the near future, this series of homologues should be tested with at least NiAl(C) and
15Ni3Ca at low (<100mg) and high catalyst loadings (>250mg) for better comparison.
9.3.6 Ethylene glycol steam reforming detailed study and analysis
Ethylene glycol steam reforming, as tested over the Hi-FUEL catalyst, provided interesting
raw data for further analyses and research. Apart from its requirement for a low catalyst
loading to achieve high hydrogen yield, the carbon formation at 600 oC of reforming reaction
is different in comparison to the other oxygenates tested, and, therefore, requires further
insight. Ethylene glycol was studied earlier as a model compound for bio-oil reforming by
several researchers, but the effects of calcium doped on nickel/alumina catalyst for this fuel is
yet to be investigated.
286
9.3.7 Autothermal steam reforming of oxygenated hydrocarbons over calcium doped
nickel/alumina catalyst
A Thermodynamic equilibrium study was carried out in autothermal steam reforming of the
homologues chosen, as discussed in Chapter 3. This study demonstrated that autothermal
reforming with small injections of air may reduce the endothermicity of the reaction; hence,
reducing the dependency of the overall reforming reaction to external heating. However, this
would provide a lower hydrogen yield at equilibrium in comparison to the steam reforming
reaction. The challenges of autothermal reforming would be a way to control the oxygen or
air supplied to avoid complete combustion of the fuel.
9.3.8 Aqueous phase reforming or supercritical water reforming of glycerol and glycerol
hydrogenolysis for the production of value added chemicals over calcium doped
Ni/Alumina catalyst
While exploring the reaction pathway of glycerol steam reforming, many of the intermediates
produced were of valuable chemicals. One of the routes to produce these chemicals at higher
concentration is via aqueous phase reforming. Aqueous phase reforming is operated at
relatively low temperature (150 – 400 oC) and higher pressure with the presence of water in
excess. The review of aqueous phase reforming has been described in Chapter 2.
Hi-FUEL and calcium doped Ni/Al2O3 may be used due to its basicity and therefore, could
enhance the hydrogen production altogether with other aqueous phase oxygenated
hydrocarbons. It was reported earlier that if the catalyst is acidic in nature, more alkanes,
however, will be produced [23]. Another way of obtaining value added chemicals with this
catalyst is via glycerol hydrogenolysis at a relatively higher operating pressure. It was shown
earlier in Chapter 6 that the Hi-FUEL catalyst is able to promote hydrogenolysis, yet the
selectivity towards the intended chemicals should be studied extensively, especially in areas
concerning optimum calcium and nickel loading and the reaction temperature and pressure.

287
9.4 References
[1] C. Varrone, R. Liberatore, T. Crescenzi, G. Izzo, and A. Wang, "The valorization of
glycerol: Economic assessment of an innovative process for the bioconversion of
crude glycerol into ethanol and hydrogen," Applied Energy, vol. 105, pp. 349-357,
May 2013.
[2] S. J. Sarma, S. K. Brar, Y. Le Bihan, and G. Buelna, "Bio-hydrogen production by
biodiesel-derived crude glycerol bioconversion: a techno-economic evaluation,"
Bioprocess and Biosystems Engineering, vol. 36, pp. 1-10, Jan 2013.
[3] J. A. Posada, L. E. Rincon, and C. A. Cardona, "Design and analysis of biorefineries
based on raw glycerol: Addressing the glycerol problem," Bioresource Technology,
vol. 111, pp. 282-293, May 2012.
[4] A. Vlysidis, M. Binns, C. Webb, and C. Theodoropoulos, "A techno-economic
analysis of biodiesel biorefineries: Assessment of integrated designs for the co-
production of fuels and chemicals," Energy, vol. 36, pp. 4671-4683, 2011.
[5] N. Sammons, M. Eden, H. Cullinan, L. Perine, and E. Connor, "A Flexible
Framework for Optimal Biorefinery Product Allocation," 16th European Symposium
on Computer Aided Process Engineering and 9th International Symposium on
Process Systems Engineering, vol. 21, pp. 2057-2062, 2006.
[6] F. Urbani, S. Freni, A. Galvagno, and V. Chiodo, "MCFC integrated system in a
biodiesel production process," Journal of Power Sources, vol. 196, pp. 2691-2698,
Mar 1 2011.
[7] S. M. Guo, L. J. Guo, J. R. Yin, and H. Jin, "Supercritical water gasification of
glycerol: Intermediates and kinetics," Journal of Supercritical Fluids, vol. 78, pp. 95-
102, Jun 2013.
[8] L. He and D. Chen, "Hydrogen Production from Glucose and Sorbitol by Sorption-
Enhanced Steam Reforming: Challenges and Promises," Chemsuschem, vol. 5, pp.
587-595, 2012.
[9] J. C. Li, H. Yu, G. X. Yang, F. Peng, D. L. Xie, H. J. Wang, and J. Yang, "Steam
Reforming of Oxygenate Fuels for Hydrogen Production: A Thermodynamic Study,"
Energy & Fuels, vol. 25, pp. 2643-2650, Jun 2011.
[10] X. Hu and G. X. Lv, "Steam Reforming of Bio-Oil or Its Model Compounds for
Hydrogen Production," Progress in Chemistry, vol. 22, pp. 1687-1700, Sep 2010.

288
[11] G. D. Wen, Y. P. Xu, Z. S. Xu, and Z. J. Tian, "Characterization and Catalytic
Properties of the Ni/Al2O3 Catalysts for Aqueous-phase Reforming of Glucose,"
Catalysis Letters, vol. 129, pp. 250-257, Apr 2009.
[12] X. Hu and G. X. Lu, "Investigation of the steam reforming of a series of model
compounds derived from bio-oil for hydrogen production," Applied Catalysis B-
Environmental, vol. 88, pp. 376-385, May 20 2009.
[13] F. A. P. Voll, C. C. R. S. Rossi, C. Silva, R. Guirardello, R. O. M. A. Souza, V. F.
Cabral, and L. Cardozo, "Thermodynamic analysis of supercritical water gasification
of methanol, ethanol, glycerol, glucose and cellulose," International Journal of
Hydrogen Energy, vol. 34, pp. 9737-9744, Dec 2009.
[14] A. K. Goodwin and G. L. Rorrer, "Conversion of glucose to hydrogen-rich gas by
supercritical water in a microchannel reactor," Industrial & Engineering Chemistry
Research, vol. 47, pp. 4106-4114, Jun 18 2008.
[15] M. V. Twigg, Catalyst Handbook: Manson Publishing, Limited, 1996.
[16] C. Wang, B. Dou, H. Chen, Y. Song, Y. Xu, X. Du, T. Luo, and C. Tan, "Hydrogen
production from steam reforming of glycerol by Ni–Mg–Al based catalysts in a fixed-
bed reactor," Chemical Engineering Journal, vol. 220, pp. 133-142, 2013.
[17] A. J. Vizcaino, M. Lindo, A. Carrero, and J. A. Calles, "Hydrogen production by
steam reforming of ethanol using Ni catalysts based on ternary mixed oxides prepared
by coprecipitation," International Journal of Hydrogen Energy, vol. 37, pp. 1985-
1992, Jan 2012.
[18] K. F. M. Elias, A. F. Lucredio, and E. M. Assaf, "Effect of CaO addition on acid
properties of Ni-Ca/Al2O3 catalysts applied to ethanol steam reforming,"
International Journal of Hydrogen Energy, vol. 38, pp. 4407-4417, Apr 15 2013.
[19] V. Chiodo, S. Freni, A. Galvagno, N. Mondello, and F. Frusteri, "Catalytic features of
Rh and Ni supported catalysts in the steam reforming of glycerol to produce
hydrogen," Applied Catalysis A: General, vol. 381, pp. 1-7, 2010.
[20] W. Cai, F. Wang, A. C. Van Veen, H. Provendier, C. Mirodatos, and W. Shen,
"Autothermal reforming of ethanol for hydrogen production over an Rh/CeO2
catalyst," Catalysis Today, vol. 138, pp. 152-156, 2008.
[21] W. Cai, B. Zhang, Y. Li, Y. Xu, and W. Shen, "Hydrogen production by oxidative
steam reforming of ethanol over an Ir/CeO2 catalyst," Catalysis Communications, vol.
8, pp. 1588-1594, 2007.

289
[22] H. Chen, H. Yu, Y. Tang, M. Pan, G. Yang, F. Peng, H. Wang, and J. Yang,
"Hydrogen production via autothermal reforming of ethanol over noble metal
catalysts supported on oxides," Journal of Natural Gas Chemistry, vol. 18, pp. 191-
198, 2009.
[23] G. Wen, Y. Xu, H. Ma, Z. Xu, and Z. Tian, "Production of hydrogen by aqueous-
phase reforming of glycerol," International Journal of Hydrogen Energy, vol. 33, pp.
6657-6666, 2008.
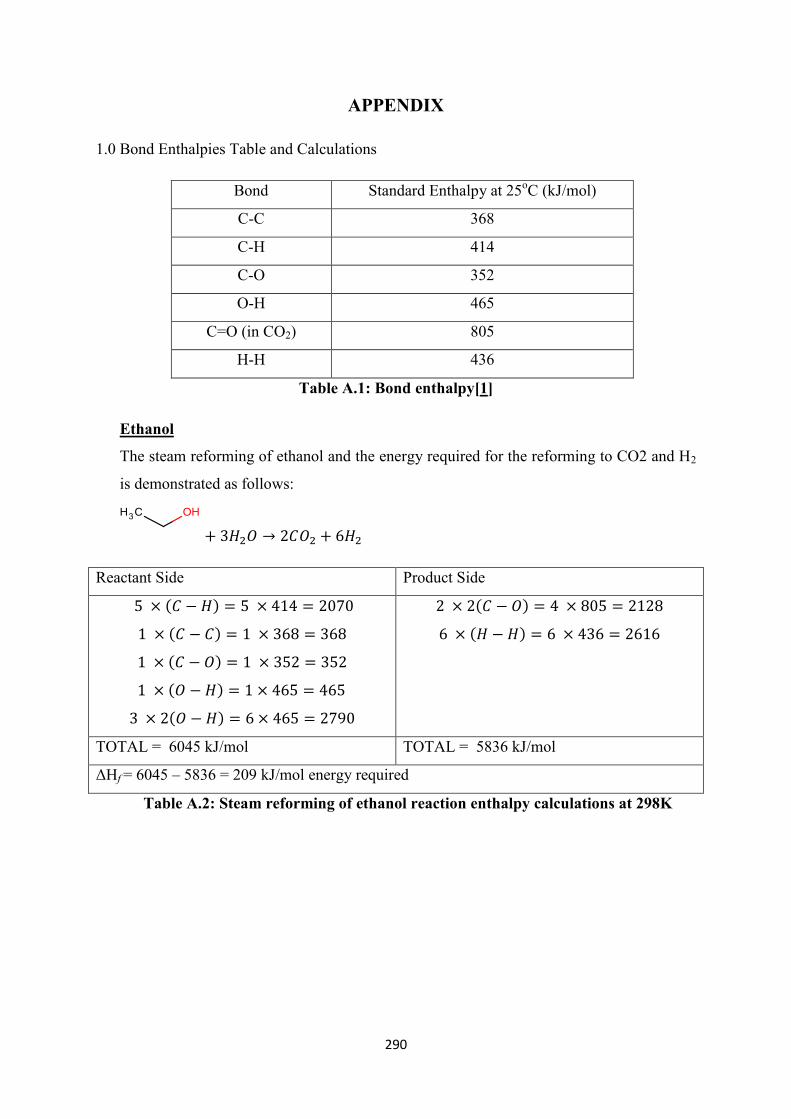
290
APPENDIX
1.0 Bond Enthalpies Table and Calculations
Bond Standard Enthalpy at 25oC (kJ/mol)
C-C 368
C-H 414
C-O 352
O-H 465
C=O (in CO2) 805
H-H 436
Table A.1: Bond enthalpy[1]
Ethanol
The steam reforming of ethanol and the energy required for the reforming to CO2 and H2
is demonstrated as follows:
Reactant Side Product Side
TOTAL = 6045 kJ/mol TOTAL = 5836 kJ/mol
ΔHf = 6045 – 5836 = 209 kJ/mol energy required
Table A.2: Steam reforming of ethanol reaction enthalpy calculations at 298K

291
Ethylene Glycol
Reactant Side Product Side
TOTAL = 5518 kJ/mol TOTAL = 5400 kJ/mol
ΔHf = 5518 – 5400 = 118 kJ/mol energy required
Table A.3: Steam reforming of ethylene glycol reaction enthalpy calculations at
298K
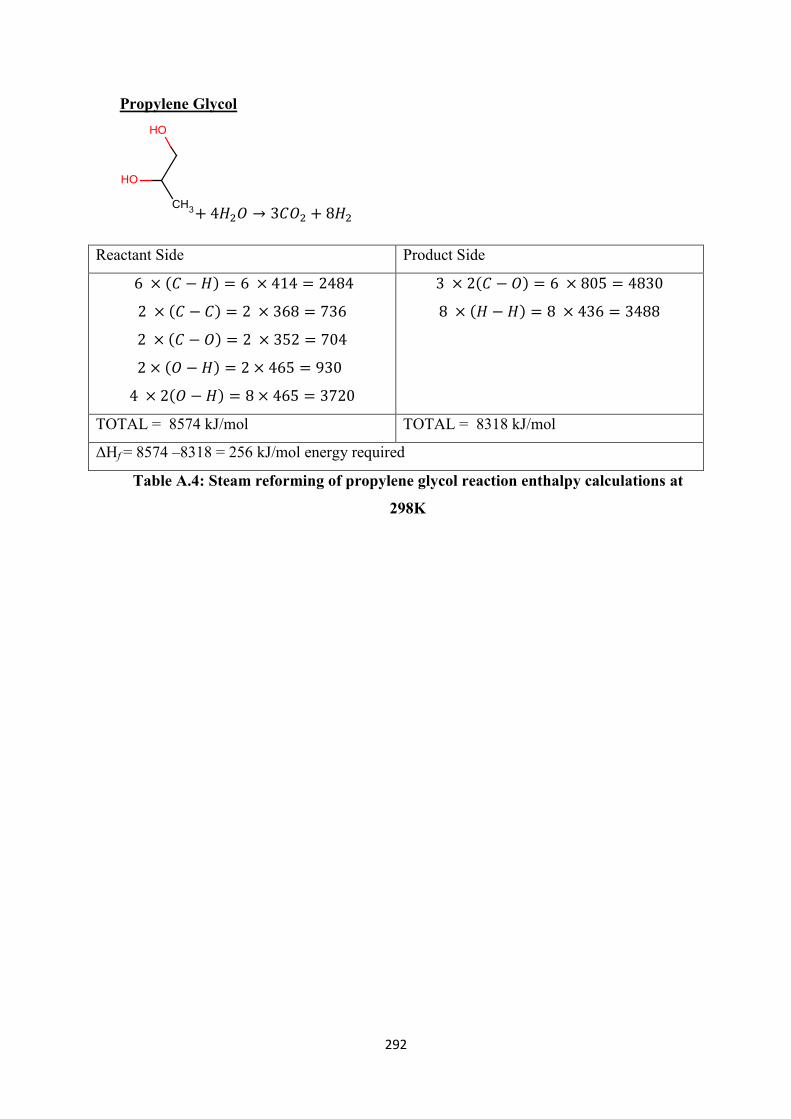
292
Propylene Glycol
Reactant Side Product Side
TOTAL = 8574 kJ/mol TOTAL = 8318 kJ/mol
ΔHf = 8574 –8318 = 256 kJ/mol energy required
Table A.4: Steam reforming of propylene glycol reaction enthalpy calculations at
298K
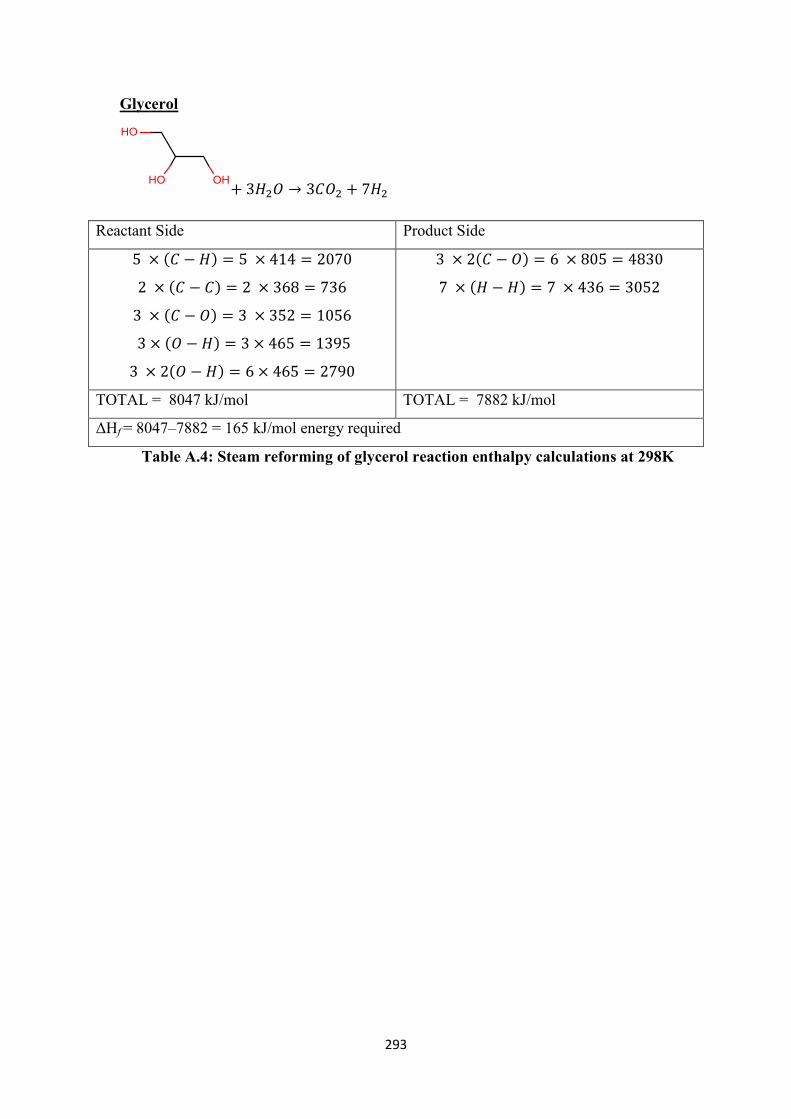
293
Glycerol
Reactant Side Product Side
TOTAL = 8047 kJ/mol TOTAL = 7882 kJ/mol
ΔHf = 8047–7882 = 165 kJ/mol energy required
Table A.4: Steam reforming of glycerol reaction enthalpy calculations at 298K
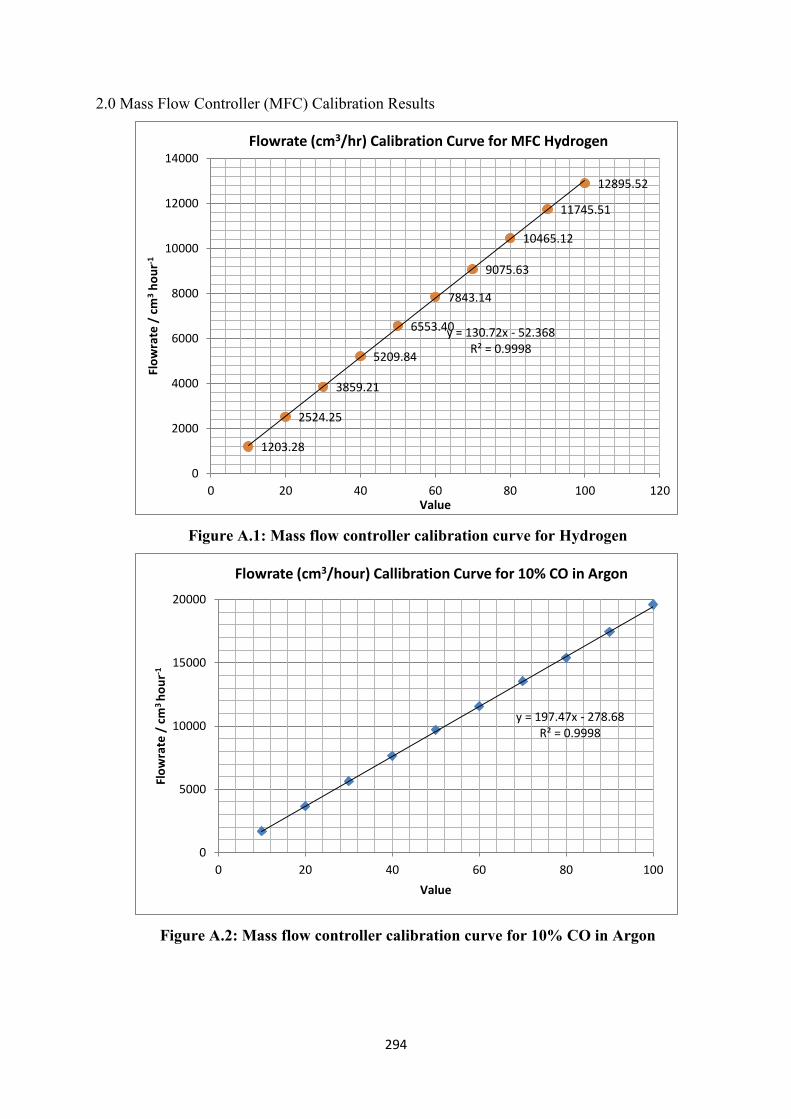
294
2.0 Mass Flow Controller (MFC) Calibration Results
Figure A.1: Mass flow controller calibration curve for Hydrogen
Figure A.2: Mass flow controller calibration curve for 10% CO in Argon
1203.28
2524.25
3859.21
5209.84
6553.40
7843.14
9075.63
10465.12
11745.51
12895.52
y = 130.72x - 52.368 R² = 0.9998
0
2000
4000
6000
8000
10000
12000
14000
0 20 40 60 80 100 120
Flo
wra
te /
cm
3 h
ou
r-1
Value
Flowrate (cm3/hr) Calibration Curve for MFC Hydrogen
y = 197.47x - 278.68 R² = 0.9998
0
5000
10000
15000
20000
0 20 40 60 80 100
Flo
wra
te /
cm
3 h
ou
r-1
Value
Flowrate (cm3/hour) Callibration Curve for 10% CO in Argon

295
Figure A.3: Mass flow controller calibration curve for Nitrogen as carrier gas
Figure A.4: Mass flow controller calibration curve for Nitrogen as purge gas
1419.84
2736.95
4020.10
5357.14
6617.65
7920.79
9379.07
10557.18
12121.21
13019.89
y = 131x + 110.16 R² = 0.9993
0
2000
4000
6000
8000
10000
12000
14000
0 20 40 60 80 100 120
Flo
wra
te /
cm
3 h
ou
r-1
Value
Flowrate (cm3/hr) Calibration Curve for MFC N2/Vaporiser
6790.32
13349.81
20130.48
27033.79
33802.82
39889.20
47524.75
55813.95
65355.52
76595.74
y = 750.46x - 2646.9 R² = 0.9919
0
10000
20000
30000
40000
50000
60000
70000
80000
90000
0 20 40 60 80 100 120
Flo
wra
te/
cm3
ho
ur-1
Value
Flowrate (cm3/hr) Calibration Curve for MFC N2 /Purge

296
3.0 Syringe Pump Calibration
Figure A.5: Syringe pump calibration curve for BD Plastipak 50-60 cm3 size
y = 1.4478x - 0.0025
05
10
15
20
25
30
35
1 2 3 4 5 6 7 8 9 10 11 12 13 14 15 16 17 18 19 20
Flo
wra
te (
cm3 /
hr)
Syringe Size
Actual Flowrate & Syringe Flowrate Setting for BD Plastipak 50-60 cm3 (adjustment factor =0.9)
Flowrate setting (cc/hr)
Actual flowrate
Linear (Flowrate setting (cc/hr))
Syringe calibration verified
here

297
4.0 Oxygenated Hydrocarbons Steam Reforming Parameters
4.1 Ethanol /Steam/Nitrogen Flow Setting
Mola
r ra
tio
(H2O
:EtO
H)
Liq
uid
Vol.
Rati
o
Calc
ula
ted
H2O
liq
uid
Flo
w r
ate
Syri
nge
flow
rate
sett
ing
Calc
ula
ted
H2O
Syri
nge
scale
Act
ual
H2O
Syri
nge
Sca
le (
Rou
nd
-up
)
% E
rror
in F
low
rate
Act
ual
Liq
uid
Vol
Rati
o
Act
ual
Mola
r R
ati
o
Act
ual
V F
low
rate
Act
ual
Mass
flo
w r
ate
of
H2O
(g/h
r)
nH2O H2Ov573K N2 Flow Setting
g/hr
V
OL
%
cm3/hr
MF
C
mol/
hr cm
3/hr
4 1.23 1.99 1.79 1.2 1.0
-
19.0 1.00 3.2 1.61 1.61 0.09 3471.79 5.68 50 75.72 34.3
5 1.54 2.49 2.24 1.5 2.0 29.2 1.99 6.5 3.21 3.21 0.18 6919.63 10.00 50 133.18 60.3
9 2.78 4.47 4.03 2.8 3.0 7.8 2.99 9.7 4.82 4.82 0.27 10391.41 14.34 50 191.04 86.5
vaporized ethanol volumetric flow rate
1071.1 cm3/hr mass flow rate
1.27 g/hr
molar flow rate
0.0276 mol/hr (setting of syringe pump @1)
1.61 cm
3/hr
Table A.6: Ethanol/steam/nitrogen flow setting

298
4.2 Ethylene Glycol/Steam/Nitrogen Flow Setting
Mola
r ra
tio
(H2O
:EG
)
Liq
uid
Vol.
Rati
o
Calc
ula
ted
H2O
liq
uid
Flo
w
rate
Syri
nge
flow
rate
sett
ing
Calc
ula
ted
H2O
Syri
nge
scale
Act
ual
H2O
Syri
nge
Sca
le (
Rou
nd
-up
)
% E
rror
in F
low
rate
Act
ual
Liq
uid
Vol
Rati
o
Act
ual
Mola
r R
ati
o
Act
ual
V F
low
rate
Act
ual
Mass
flo
w r
ate
of
H2O
(g/h
r)
nH2O H2Ov573K N2 Flow Setting
cm3/hr cm
3/hr mol/hr cm
3/hr g/hr VOL% cm
3/hr MFC
3 0.97 1.56 1.40 1.0 1.0 3.2 1.00 3.1 1.6 1.61 0.09 4205.78 6.96 50.00 92.73 42.0
5 1.62 2.60 2.34 1.6 2.0 23.5 1.99 6.2 3.2 3.21 0.18 8382.55 12.19 50.00 162.34 73.5
8 2.58 4.16 3.75 2.6 3.0 15.9 2.99 9.3 4.8 4.82 0.27 12588.33 17.45 50.00 232.44 105.2
vaporized EG volumetric flow rate
1357.91 cm3/hr mass flow rate
1.79 g/hr
molar flow rate
0.0289 mol/hr (setting of syringe pump @1)
1.61 cm3/hr
Table A.7: Ethylene glycol/steam/nitrogen flow setting

299
4.3 Propylene Glycol/Steam/Nitrogen Flow Setting
Mola
r ra
tio (
H2O
:PG
)
Liq
uid
Vol.
Rati
o
Calc
ula
ted
H2O
liq
uid
Flo
w r
ate
Syri
nge
flow
rate
sett
ing
Calc
ula
ted
H2O
Syri
nge
scale
Act
ual
H2O
Syri
nge
Sca
le
(Rou
nd
-up
)
% E
rror
in F
low
rate
Act
ual
Liq
uid
Vol
Rati
o
Act
ual
Mola
r R
ati
o
Act
ual
V F
low
rate
Act
ual
Mass
flo
w r
ate
of
H2O
(g/h
r)
nH2O H2Ov573K N2 Flow Setting
cm3/hr cm
3/hr mol/hr cm
3/hr g/hr VOL%
cm3/
min MFC
4 0.98 1.58 1.42 1.0 1.0 1.9 1.00 4.1 1.6 1.61 0.09 4205.78 6.55 50.00 87.28 39.5
7 1.72 2.77 2.49 1.7 2.0 16.1 1.99 8.1 3.2 3.21 0.18 8382.55 11.78 50.00 156.89 71.0
11 2.70 4.35 3.91 2.7 3.0 10.9 2.99 12.2 4.8 4.82 0.27 12588.33 17.04 50.00 226.99 102.7
vaporized PG volumetric flow rate
1030.89 cm3/hr
mass flow rate
1.67 g/hr molar flow rate
0.0219 mol/hr
(setting of syringe pump @ 3)
1.61 cm3/hr
Table A.8: Propylene glycol/steam/nitrogen flow setting
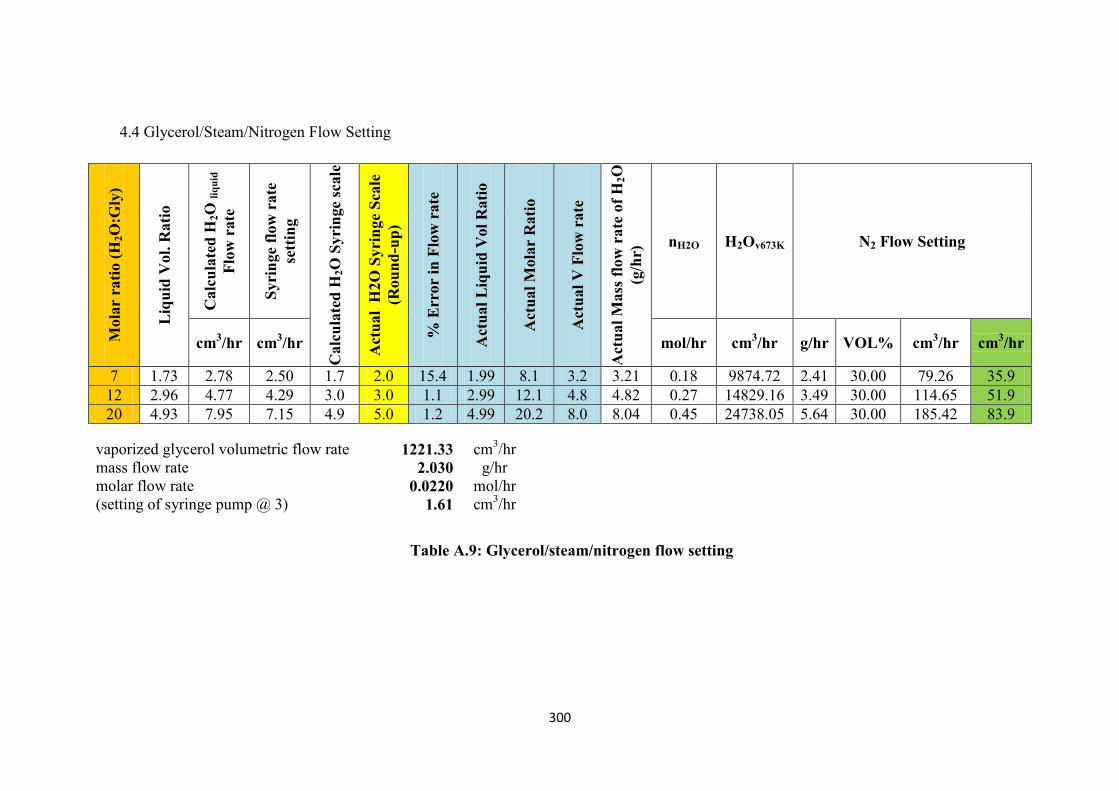
300
4.4 Glycerol/Steam/Nitrogen Flow Setting M
ola
r ra
tio (
H2O
:Gly
)
Liq
uid
Vol.
Rati
o
Calc
ula
ted
H2O
liq
uid
Flo
w r
ate
Syri
nge
flow
rate
sett
ing
Calc
ula
ted
H2O
Syri
nge
scale
Act
ual
H2O
Syri
nge
Sca
le
(Rou
nd
-up
)
% E
rror
in F
low
rate
Act
ual
Liq
uid
Vol
Rati
o
Act
ual
Mola
r R
ati
o
Act
ual
V F
low
rate
Act
ual
Mass
flo
w r
ate
of
H2O
(g/h
r) nH2O H2Ov673K N2 Flow Setting
cm3/hr cm
3/hr mol/hr cm
3/hr g/hr VOL% cm
3/hr cm
3/hr
7 1.73 2.78 2.50 1.7 2.0 15.4 1.99 8.1 3.2 3.21 0.18 9874.72 2.41 30.00 79.26 35.9
12 2.96 4.77 4.29 3.0 3.0 1.1 2.99 12.1 4.8 4.82 0.27 14829.16 3.49 30.00 114.65 51.9
20 4.93 7.95 7.15 4.9 5.0 1.2 4.99 20.2 8.0 8.04 0.45 24738.05 5.64 30.00 185.42 83.9
vaporized glycerol volumetric flow rate 1221.33 cm3/hr
mass flow rate 2.030 g/hr
molar flow rate 0.0220 mol/hr
(setting of syringe pump @ 3) 1.61 cm3/hr
Table A.9: Glycerol/steam/nitrogen flow setting

301
5.0 Aqueous Phase Gas Chromatography (GC): Response Factor and Sample of Aqueous Phase Quantification Table
Pentanol (internal std) 0.1395 g
Retention Time
(min)
GC
area
Area Ratio
(area X/
area
pentanol)
Response Factor
(gradient)
Wt.
Ratio
Weight
(g)
Liq. Product
Selectivity MW
Molar
Flow
rate, ṅi
mol/hou
r
Total
Carbo
n
Atoms
out
(mol/
hour)
Mass flow rate,
ṁi
mass/hour
Acetaldehyde 1.37 19322.7 0.00500 1.96 0.0098 0.00136 0.007 44.05 0.0001 0.000 0.004
Propionaldehyde 1.64 0 0.00000 2.96 0.0000 0.00000 0.000 58.08 0.0000 0.0000 0.000
Acetone 1.7 4996.6 0.00129 1.46 0.0019 0.00026 0.001 58.08 0.0000 0.000 0.001
Acrolein 1.9 17504.3 0.00453 1.87 0.0085 0.00118 0.006 58.08 0.0001 0.000 0.003
Methanol 2.2 14170.8 0.00366 1.94 0.0071 0.00099 0.005 32.04 0.0001 0.000 0.003
2-Propanol 2.4 0 0.00000 1.37 0.0000 0.00000 0.000 60.1 0.0000 0.0000 0.000
Ethanol 3.1 6073.5 0.00157 1.44 0.0023 0.00032 0.002 46.07 0.0000 0.000 0.001
Propanol 4.0 0 0.00000 1.20 0.0000 0.00000 0.000 60.1 0.0000 0.000 0.000
Allyl Alcohol 5.3-5.4 450223.
6 0.11639 1.00 0.1164 0.01624 0.081 58.08 0.0010 0.003 0.048
Butanol 5.8 0 0.00000 1.10 0.0000 0.00000 0.000 74.12 0.0000 0.000 0.000
Pentanol 7.7 386827
5 1.00000 1.00 1.0000
0.000
0.0000
0.000
Acetol 8.6 232633.
8 0.06014 2.16 0.1299 0.01812 0.090 74.08 0.0007 0.0022 0.054
Acetic acid 10.8 22655.4 0.00586 2.68 0.0157 0.00219 0.011 60.05 0.0001 0.0002 0.006
Propionic acid 12.1 17780.2 0.00460 2.22 0.0102 0.00142 0.007 74.08 0.0001 0.000 0.004
Propylene Glycol 13.4 8308.8 0.00215 1.57 0.0034 0.00047 0.002 76 0.0000 0.000 0.001
Ethylene Glycol 13.9 31575.7 0.00816 3.22 0.0263 0.00367 0.018 62 0.0002 0.000 0.011
Butyric Acid 14.5 44696.8 0.01155 2.04 0.0236 0.00329 0.016 88.11 0.0001 0.001 0.010
Diethylene Glycol 18.6-18.9 4556.7 0.00118 1.85 0.0022 0.00030 0.002 106.1
2 0.0000 0.0000 0.001
Condensation Products & Free
Radicals (Mix)
136593
2 0.35311 3.00 1.0593 0.14778 0.736 92.09 0.0047 0.024 0.436
Glycerol 23.5 57258.5 0.01480 2.30 0.0340 0.00475 0.000 92.09 0.0002 0.000 0.014
Total 0.99
0.0075 0.032 0.603
Table A.10: Example of aqueous phase detection of glycerol steam reforming over Hi-FUEL (50mg Hi-FUEL),
WHSV = 104.8 gflow/gcatalyst hour
6.0 Gas Phase GC Detection: Retention Time and Quantification Table
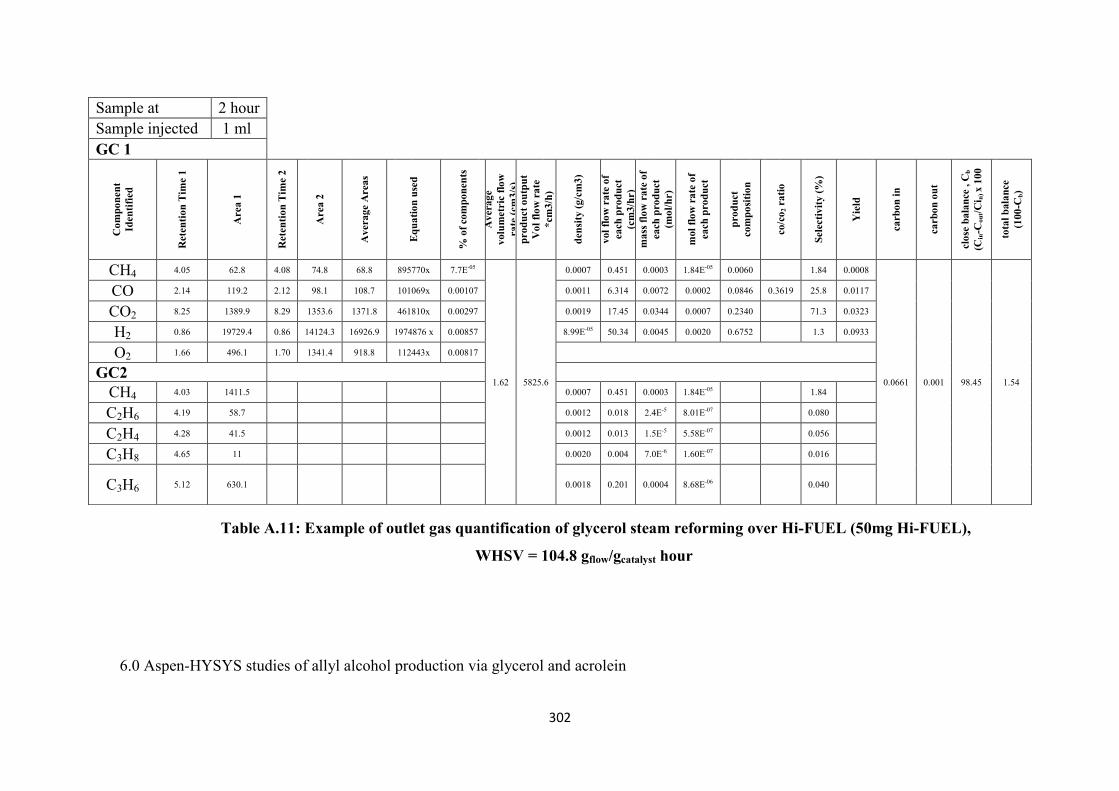
302
Table A.11: Example of outlet gas quantification of glycerol steam reforming over Hi-FUEL (50mg Hi-FUEL),
WHSV = 104.8 gflow/gcatalyst hour
6.0 Aspen-HYSYS studies of allyl alcohol production via glycerol and acrolein
Sample at 2 hour
Sample injected 1 ml
GC 1
Co
mp
on
en
t
Iden
tifi
ed
Rete
nti
on
Tim
e 1
Area 1
Rete
nti
on
Tim
e 2
Area 2
Av
era
ge A
rea
s
Eq
ua
tio
n u
sed
% o
f co
mp
on
en
ts
Av
era
ge
volu
metr
ic f
low
ra
te (
cm
3/s
) p
ro
du
ct
ou
tpu
t
Vo
l fl
ow
ra
te
*cm
3/h
)
den
sity
(g/c
m3
)
vol
flo
w r
ate
of
ea
ch
pro
du
ct
(cm
3/h
r)
ma
ss f
low
ra
te o
f
ea
ch
pro
du
ct
(mo
l/h
r)
mol
flo
w r
ate
of
ea
ch
pro
du
ct
pro
du
ct
com
po
siti
on
co/c
o2 r
ati
o
Sele
cti
vit
y (
%)
Yie
ld
ca
rb
on
in
ca
rb
on
ou
t
clo
se b
ala
nce
, C
b
(Cin
-Cou
t/C
i n) x
100
tota
l b
ala
nce
(100
-Cb)
CH4 4.05 62.8 4.08 74.8 68.8 895770x 7.7E-05
1.62 5825.6
0.0007 0.451 0.0003 1.84E-05 0.0060
1.84 0.0008
0.0661 0.001 98.45 1.54
CO 2.14 119.2 2.12 98.1 108.7 101069x 0.00107 0.0011 6.314 0.0072 0.0002 0.0846 0.3619 25.8 0.0117
CO2 8.25 1389.9 8.29 1353.6 1371.8 461810x 0.00297 0.0019 17.45 0.0344 0.0007 0.2340
71.3 0.0323
H2 0.86 19729.4 0.86 14124.3 16926.9 1974876 x 0.00857 8.99E-05 50.34 0.0045 0.0020 0.6752
1.3 0.0933
O2 1.66 496.1 1.70 1341.4 918.8 112443x 0.00817
GC2
CH4 4.03 1411.5
0.0007 0.451 0.0003 1.84E-05
1.84
C2H6 4.19 58.7
0.0012 0.018 2.4E-5 8.01E-07
0.080
C2H4 4.28 41.5
0.0012 0.013 1.5E-5 5.58E-07
0.056
C3H8 4.65 11
0.0020 0.004 7.0E-6 1.60E-07
0.016
C3H6 5.12 630.1
0.0018 0.201 0.0004 8.68E-06
0.040

303
Figure A.6: Aspen-HYSYS simulation layout using Gibbs reactor
Inlet Feed Ratio H2O: Glycerol: H2 (8:1:0.1) H2O:Glycerol:H2 (8:1:0) Acrolein:H2O (8:1) Acrolein:H2 (1:0.1) Acetol:H2O (8:1)
Stream In Out In Out In Out In Out In Out
Vapour Fraction 1 1 1 1 1 1 1 1 1 1
T (C) 400 400.0003 400 400 400 400 400 400 400 400
P (kPa) 101.325 101.325 101.325 101.325 101.325 101.325 101.325 101.325 101.325 101.325
Molar flow (kgmole/hr) 1.00 1.22 1.00 1.22 1.00 1.00 1.00 0.97 1 1.11
Mass flow (kg/hr) 25.98 25.98 26.25 26.25 22.24 22.24 51.2 51.2 24.24 24.24
Molar entalphy (kJ/kgmole) -258666 -209600 -261660 -211486 -207339 -207668 -32765.8 -35952.6 -238886 -209768
Molar entropy (kJ/kgmole C) 220.6878 205.9811 221.0032 206.0747 206.5036 206.7431 211.3844 212.9469 222.3613 206.3804
Heat Flow (kJ/hr) -258666 -255291 -261660 -258214 -207339 -207408 -32765.8 -34820.7 -238886 -232811
Mol Fraction
In Out In Out In Out In Out In Out
Allyl Alcohol 0.0000 0.0004 0.0000 0.0000 0.0000 0.0000 0.0000 0.0325 0.0000 0.0000
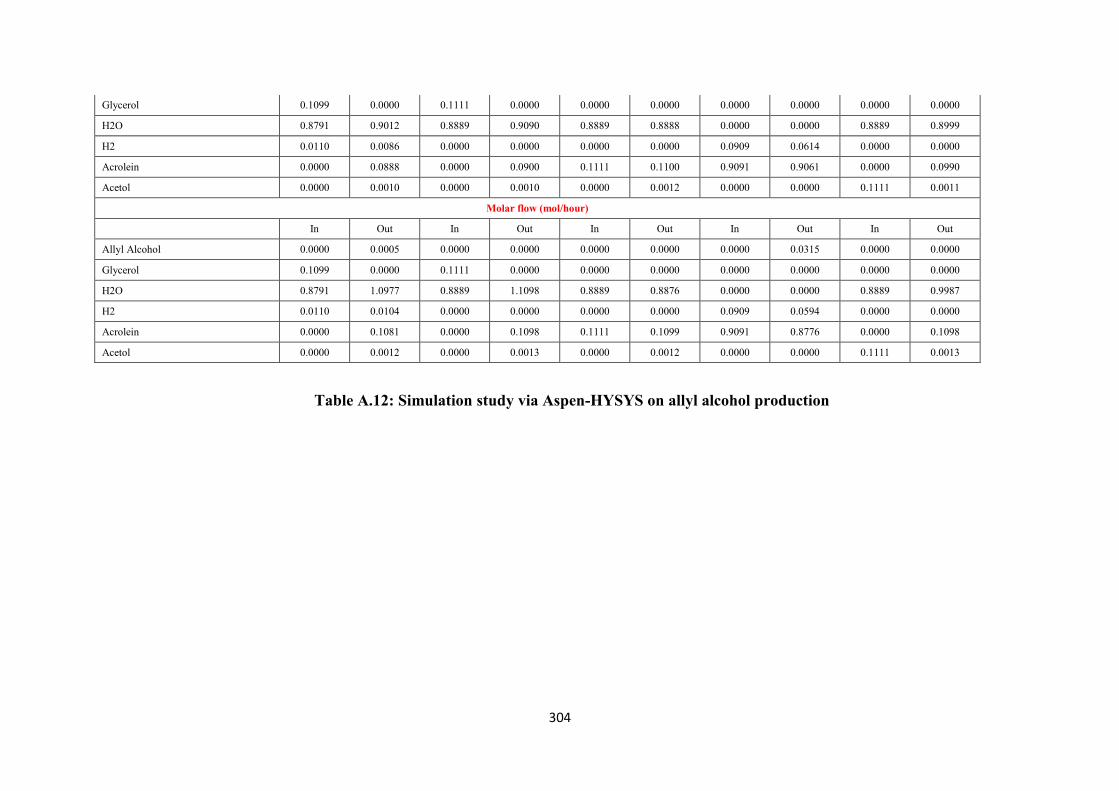
304
Glycerol 0.1099 0.0000 0.1111 0.0000 0.0000 0.0000 0.0000 0.0000 0.0000 0.0000
H2O 0.8791 0.9012 0.8889 0.9090 0.8889 0.8888 0.0000 0.0000 0.8889 0.8999
H2 0.0110 0.0086 0.0000 0.0000 0.0000 0.0000 0.0909 0.0614 0.0000 0.0000
Acrolein 0.0000 0.0888 0.0000 0.0900 0.1111 0.1100 0.9091 0.9061 0.0000 0.0990
Acetol 0.0000 0.0010 0.0000 0.0010 0.0000 0.0012 0.0000 0.0000 0.1111 0.0011
Molar flow (mol/hour)
In Out In Out In Out In Out In Out
Allyl Alcohol 0.0000 0.0005 0.0000 0.0000 0.0000 0.0000 0.0000 0.0315 0.0000 0.0000
Glycerol 0.1099 0.0000 0.1111 0.0000 0.0000 0.0000 0.0000 0.0000 0.0000 0.0000
H2O 0.8791 1.0977 0.8889 1.1098 0.8889 0.8876 0.0000 0.0000 0.8889 0.9987
H2 0.0110 0.0104 0.0000 0.0000 0.0000 0.0000 0.0909 0.0594 0.0000 0.0000
Acrolein 0.0000 0.1081 0.0000 0.1098 0.1111 0.1099 0.9091 0.8776 0.0000 0.1098
Acetol 0.0000 0.0012 0.0000 0.0013 0.0000 0.0012 0.0000 0.0000 0.1111 0.0013
Table A.12: Simulation study via Aspen-HYSYS on allyl alcohol production
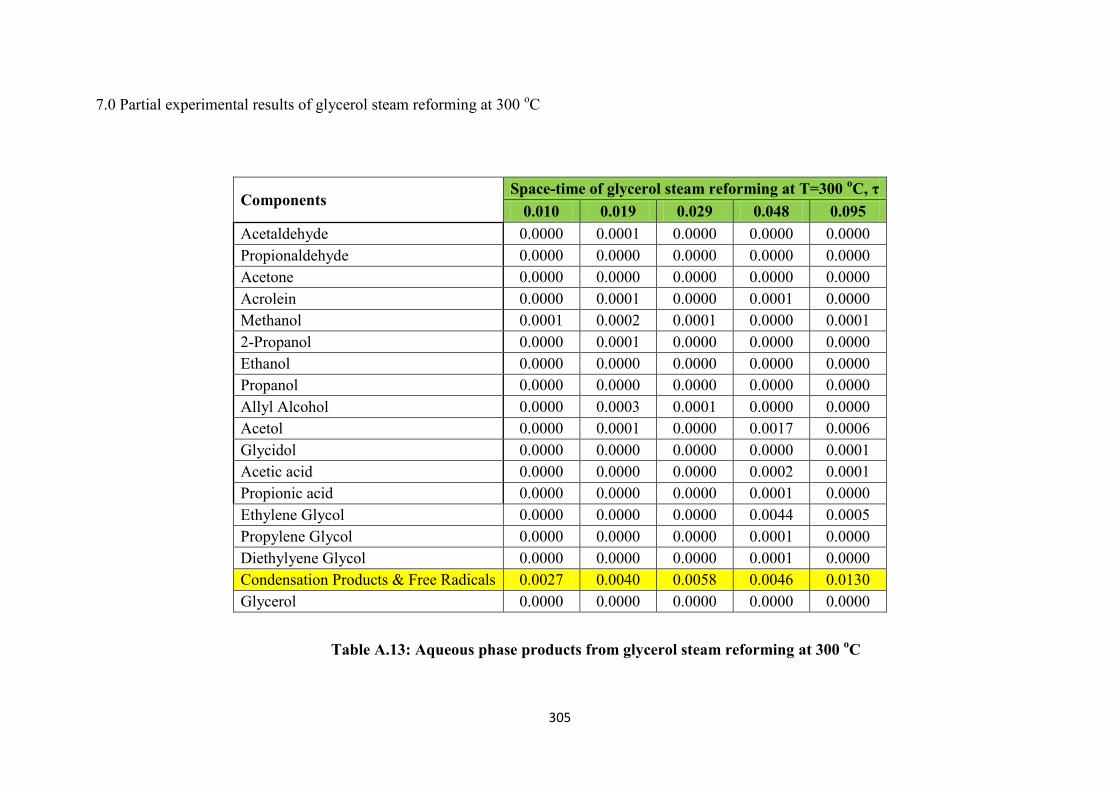
305
7.0 Partial experimental results of glycerol steam reforming at 300 oC
Components Space-time of glycerol steam reforming at T=300
oC, τ
0.010 0.019 0.029 0.048 0.095
Acetaldehyde 0.0000 0.0001 0.0000 0.0000 0.0000
Propionaldehyde 0.0000 0.0000 0.0000 0.0000 0.0000
Acetone 0.0000 0.0000 0.0000 0.0000 0.0000
Acrolein 0.0000 0.0001 0.0000 0.0001 0.0000
Methanol 0.0001 0.0002 0.0001 0.0000 0.0001
2-Propanol 0.0000 0.0001 0.0000 0.0000 0.0000
Ethanol 0.0000 0.0000 0.0000 0.0000 0.0000
Propanol 0.0000 0.0000 0.0000 0.0000 0.0000
Allyl Alcohol 0.0000 0.0003 0.0001 0.0000 0.0000
Acetol 0.0000 0.0001 0.0000 0.0017 0.0006
Glycidol 0.0000 0.0000 0.0000 0.0000 0.0001
Acetic acid 0.0000 0.0000 0.0000 0.0002 0.0001
Propionic acid 0.0000 0.0000 0.0000 0.0001 0.0000
Ethylene Glycol 0.0000 0.0000 0.0000 0.0044 0.0005
Propylene Glycol 0.0000 0.0000 0.0000 0.0001 0.0000
Diethylyene Glycol 0.0000 0.0000 0.0000 0.0001 0.0000
Condensation Products & Free Radicals 0.0027 0.0040 0.0058 0.0046 0.0130
Glycerol 0.0000 0.0000 0.0000 0.0000 0.0000
Table A.13: Aqueous phase products from glycerol steam reforming at 300 oC

306
Description cat/g T/ oC
Date
of
Exp
erim
ents
WHSV
Selectivity (%)
CO
/ C
O2 r
ati
o
H2 Y
ield
% C
in
Gas
& L
iqu
id
1/WHSV H2 CO2 CO CH4 C2H6 C2H4 C3H8 C3H6
50 mg Glycerol 300 C 0.05
300
08-Feb-12 104.8 0.010 1.20 0.00 0.07 0.01 0.00 0.00 0.00 0.00 - 0.08 25.3
100 mg Glycerol 300 C 0.1 13-Feb-12 52.4 0.019 1.33 0.11 0.01 0.01 0.00 0.00 0.00 0.00 0.09 0.09 33.5
150 mg Glycerol 300 C 0.15 20-Feb-12 34.9 0.029 1.01 0.08 0.00 0.00 0.00 0.00 0.00 0.00 0.00 0.07 44.7
250 mg Glycerol 300 C 0.25 23-Feb-12 21.0 0.048 1.65 0.30 0.96 0.05 0.01 0.00 0.00 0.05 3.66 0.12 59.7
500 mg Glycerol 300 C 0.5 15-Mar-12 10.5 0.095 2.33 1.00 0.31 0.06 0.00 0.02 0.00 0.03 0.33 0.16 71.9
Table A.14: Gas phase products selectivity from glycerol steam reforming at 300 oC

307
APPENDIX REFERENCES
[1] J. Clark, Calculations in AS/A Level Chemistry: Longman, 2000.