steady state and dynamic operation of four-product ... · pdf filesteady state and dynamic...
TRANSCRIPT

Steady State and Dynamic Operation of Four-Product Dividing-Wall(Kaibel) Columns: Experimental VerificationDeeptanshu Dwivedi,† Jens P. Strandberg,†,¶ Ivar J. Halvorsen,‡ and Sigurd Skogestad*,†
†Department of Chemical Engineering, Norwegian University of Science and Technology, Trondheim, Norway‡Applied Cybernetics, SINTEF, Trondheim, Norway
ABSTRACT: Control and operation of energy-efficient dividing-wall columns can be challenging. This paper demonstratesexperimentally the start-up and steady state operation of a four-product Kaibel column separating methanol, ethanol, propanol,and n-butanol. We use a control structure with four temperature controllers and show that it can handle feed rate disturbances aswell as set point changes. The experiments compare well with an equilibrium stage model.
■ INTRODUCTION
Distillation is a separation technique that uses heat energy toprovide the separation work of “un-mixing” the feed mixture. Inthis paper we study the integrated Kaibel distillation scheme forseparation of four components as shown in Figure 1.2 The mainmotivation for this scheme is a combination of capital savings andenergy savings compared to conventional distillation sequencesfor multicomponent separation. This scheme is not the best interms of minimum separation work (exergy), mainly because itperforms a difficult B/C split in the prefractionator and not theeasiest (A/D) split.An “ideal reversible” system with minimum exergy requires a
more complex arrangement, infinite number of stages andheating and cooling on all stages.3−5 For four-product separation,Figure 2a shows the reversible scheme proposed by Petlyuk andPlatonov.6 The column sections are directly coupled and theeasiest split is done first. Any mixing losses near the feed stageand at the ends can thus be avoided. Some of the features ofreversible distillation are retained in an adiabatic “four-productextended Petlyuk column”, which has only one heater (reboiler)and one cooler (condenser) (see Figure 2b). In fact, the adiabaticscheme shown in Figure 2b is better than the reversible scheme inFigure 2a in terms of energy although it is inferior in terms ofexergy. Compared to conventional two-product columnsequences, the potential energy savings in an adiabatic “four-product extended Petlyuk arrangement” (Figure 2b) can be up to50%.7 The disadvantage of using the arrangements shown inFigure 2 is that, a large number of sections are required for amulticomponent separation. Petlyuk et al.1 also proposedschemes for multicomponent separation with a minimumnumber of column sections. For a four-product separation, oneof the schemes given by Petlyuk is the same as the “Kaibel”scheme in Figure 1a.8
The four-product Kaibel column in Figure 1, although lessefficient than the Petlyuk arrangements in Figure 2, can still offerup to 30% energy saving compared to conventional sequencesdue to the directly coupled prefractionator.9 Our experimentalsetup is similar to the scheme in Figure 1a, which does not have avertical dividing-wall but the results are extendable to dividing-wall columns.
Numerous successful industrial implementations of three-product dividing-wall columns have been reported by theGerman company BASF.10,11 In the open literature, a thoroughexperimental study for operation of a three-product high puritydistillation column was reported by Niggermann et al.12 Earlier,start-up for a three-product column based on rigoroussimulations was reported by Niggermann et al.13 Mutalib andSmith14 reported a simulation study on a three-product dividing-wall column and concluded that a conventional proportional-integral (PI) control scheme can give good regulation. They alsoreported experimental studies done on a pilot plant column.15
Luyben16 performed a simulation study and proposed a four-point control structure for a three-product dividing-wall column.van Diggelen et al.17 compared conventional PID controller withcontrollers obtained by H∞ controller synthesis and μ-synthesis.Ling et al.18 proposed control structures considering remixinglosses for an energy optimal operation. Several works have alsobeen reported for the use of model predictive control fordividing-wall columns.19−21
There is one reported use of a four-product Kaibel column inBASF and several patents from BASF as summarized byDejanovic et al.11 Some simulation work has also been carriedout on control and operation of four-product Kaibel columns.Strandberg and Skogestad22 found in a simulation study that afour-point temperature control scheme with inventory controlcan stabilize the column and prevent “drift” of the compositionprofiles during operation. Ghadrdan et al.23 reported anothersimulation study on optimal steady state operating solutions foreconomic criterions like minimizing energy for fixed purityspecifications. Kverland et al.24 studied a multivariable modelpredictive controller on top of a regulatory layer with a four-pointtemperature control.In the open literature, there are no experimental studies
reported on operation and control of four-product directlycoupled columns. In this paper we present experimental resultsfor a four-product Kaibel column separating methanol, ethanol,
Received: May 31, 2012Revised: October 21, 2012Accepted: November 7, 2012Published: November 7, 2012
Article
pubs.acs.org/IECR
© 2012 American Chemical Society 15696 dx.doi.org/10.1021/ie301432z | Ind. Eng. Chem. Res. 2012, 51, 15696−15709

1-propanol, and 1-butanol (with normal boiling points of 64.7°C, 78.4 °C, 97.2 °C, and 117.7 °C, respectively).
■ EXPERIMENTAL SETUPFigure 3a shows a picture of our experimental column.25
Although this is not a dividing-wall column, it is thermodynami-cally equivalent as illustrated in Figure 1. The height of thecolumn is about 8 m. The system is operated at atmosphericpressure and the column sections are packed with 6-mm glassRaschig rings. The column sections are numbered from 1 to 7 asshown in Figure 3a. Sections 1 and 2 constitute theprefractionator, while sections 3−7 form the main column.The internal diameter of vacuum jacket glass column-sections 1,2, 4, 5, and 6 is 50 mmwhile that of column-sections 3 and 7 is 70mm (column sections are numbered in Figure 3c). The height ofpacking in sections 1 and 2 is 1.1 and 1.6 m, respectively, while insections 3, 4, and 5 it is 0.65 m. The height of packing in sections6 and 7 is about 0.75 m and 0.9 m, respectively.The reboiler is kettle type and the power to the reboiler is
adjusted by varying the voltage to the heater elements through athyristor. The condenser is mounted on top of the column and iswater-cooled. The condensed vapor flows back to the columndue to gravity; a part is taken out as top product and the restforms the liquid reflux.The liquid reflux split valve, top product valve, and side
product valve are swinging funnels (on/off) and are controlledby externally placed solenoids. The flow through the swinging
funnel depends on the internal liquid flows in the respectivecolumn section. To implement the continuous output of theproportional-integrator (PI) controllers, the common techniqueof pulse width modulation (PWM) is used where the width(length of the pulse is the adjustable continuous variable) and theperiod (cycle time) is normally fixed. The cycle time of the on/offvalves should be much shorter than the plant time constant andhence emulate continuous-pump like flow conditions. In ourcase, the valve switching function has a total cycle time about 10 sand a resolution time for switching of 0.2 s. For example, if thecontroller output is 0.22, a valve position on one side of thefunnel is 2.2 and 7.8 s on the other. This gives an implementedaccuracy of 4% when the valve position is 0.5, but much worseresolution when close to the fully open (0)/ close (1) position.To improve the resolution, we used an algorithm that allows alsothe total cycle time to change between 5 and 15 s. Thisimplementation reduces the rounding off errors and improvesthe resolution of the valve.In our setup, it is also possible to adjust the vapor split ratio
(RV) between the prefractionator and the main column using avalve, but in the reported experiments it has been kept constantas is common in industrial implementations. The vapor splitbetween the prefractionator and the main column is thendetermined by the normal pressure drop offered by the packingin the column sections.The liquid-level measurement in the reboiler was faulty and a
level controller could not be installed. Therefore, the bottom
Figure 1. Thermodynamically equivalent implementations of four-product Kaibel column (studied in this paper).
Industrial & Engineering Chemistry Research Article
dx.doi.org/10.1021/ie301432z | Ind. Eng. Chem. Res. 2012, 51, 15696−1570915697

product was allowed to accumulate during the experimental runs.With a large reboiler, the composition of the bottoms will thentake a long time to reach steady state, but otherwise this shouldhave little effect on the experimental results.The control setup is implemented in Lab View on a standard
PC. Figure 4 is a screen-shot from the computer interface (LabView) during the experimental run 12, with a snapshot oftemperatures as read by the probes in various sections. Thedialogue labeled “Temperature graphs” shows the fourcontrolled temperatures for 100 s. Note that some of thetemperature measurements have large measurement biases (forexample, TP4 and T16) and their values are calibrated for lateranalysis and one probe (T15) is faulty.
■ CONTROL STRUCTURE
As reported in the simulation study earlier by Strandberg andSkogestad,22 a 4-point temperature control structure can avoid“drift” of the composition profile in the various sections of a 4-product column. Temperature is a good indicator of compositionand is easy to measure. Temperature control is fast and can keepthe compositions (and split) in the column close to nominalvalue and hence preventing “drift” in the event of disturbances.In Figure 3c, we show the control structure used in the
experiments. In Table 1, we show in more detail the looppairings. The four temperature control loops are named loop 1, 2,3, and 4. In the footnote to Table 1, we also define the four
corresponding liquid flow ratios RL1, RL2, RL3, and RL4 which areset by the swinging funnels.In control loop 1, the liquid split ratio (RL1) is used to control a
sensitive temperature in the prefractionator (T2 = TP5). In loop2, the distillate split ratio (RL2) controls a temperature in section3 (T3 = TM3). In the loop 3, the upper side product split ratio(RL3) controls a sensitive temperature in section 5 (T5 = TM8).Finally, in control loop 4, the lower side product split ratio (RL4)is used to control a sensitive temperature in the bottom section(T7 = TM14).The controllers are conventional proportional-integrator (PI)
controllers. As the system is interactive, we used sequentialtuning, and loop 1 in the prefractionator was closed first. Nextloops 2, 3, and 4 in the main column were closed. The tuning ofthe loops was done using the SIMC rules26 with the tuningparameter, τC, chosen to be 1 min for loops 1 and 2 and 2 min forloops 3 and 4. The temperature set points for the loops wereadjusted during start-up as explained below.The remaining two degrees of freedom, the boilup (V) and the
vapor split ratio (RV), are not used for control in experiments, butmay be in general available for some optimizing objective, likeminimizing energy for a given specification.
■ EXPERIMENTS
Various experiments were conducted for studying the start-upoperation, to test the 4-point control structure for set pointchanges, disturbance handling and to study steady state
Figure 2. “Reversible” and adiabatic arrangements of Four-product “extended” Petlyuk column (not studied in this paper).
Industrial & Engineering Chemistry Research Article
dx.doi.org/10.1021/ie301432z | Ind. Eng. Chem. Res. 2012, 51, 15696−1570915698

operation. Table 2 shows a list of the 13 experiments reported inthis paper.Start-up. Figure 5a shows the results from a typical cold start-
up of the pilot plant (experimental run 1). The following start-uppolicy was used:After turning on the reboiler (at time =0), the column is heated
up in total reflux mode (D = 0, S1 = 0, S2 = 0, F = 0). Initially, theoutput of control loop 1 (RL1) is fixed at a reasonable value(manual mode). In our case, it was fixed at RL1 = 0.3 whichimplies that 30% of the reflux is directed to the prefractionatorand 70% to the main column. The output of RL2, RL3, and RL4 ofcontrol loops 2, 3, and 4 were initially fixed at 1 (no productwithdrawal). At about 30 min, the feed to the column is turned
on. Shortly after, the controllers (loops 1, 2, 3, and 4) are turnedon (AUTO mode). With control loops 2, 3, and 4 turned on, webegin to draw the three products D, S1, and S2. The initialtemperature set points are the values from the total reflux mode,and the set points are then adjusted in closed-loop mode to getgood separation in the column. The temperature set point for theprefractionator (T2s) is adjusted to get a large temperaturechange across the prefractionator column. This corresponds to asharp split between the intermediate components (ethanol andpropanol). The set points for the remaining loops (T3s, T5s, andT7s) are for the main column which performs binary splits, andthese are adjusted in an attempt to get the temperatures of thefour product close to the normal boiling point of their
Figure 3. (a) Picture of the experimental column.25 (b) Schematic showing location of temperature sensors.25 (c) 4-Point regulatory control structureused for operation T2 = TP5, T3 = TM2, T5 = TM8 and T7 = TM14.
Industrial & Engineering Chemistry Research Article
dx.doi.org/10.1021/ie301432z | Ind. Eng. Chem. Res. 2012, 51, 15696−1570915699

corresponding main components. Off-line analysis of theproducts (reported later) shows that this start-up procedureresulted in good quality products, in spite of the fact that we usedonly temperature loops. Of course, if online compositionmeasurements are available, these should be used to adjust thetemperature set points.Figure 5b shows a zoomed-in plot of Figure 5a for the time
period from 35 to 140 min. In the experiments, the feed flow ratewas held constant at 3 L/hour and the reboiler duty was setconstant at 2 kW. We conclude from the experiment (Figure5a,b) that the start-up procedure works well and leads to stableoperation.Closed-Loop Operation. In the following experiments
(runs 2−7), the four temperatures set points are changed in
closed-loop, to drive the system to various new steady states. Thecomposition of the feed mixtures is also varied.In Figure 6 (run 2), we show results for a temperature set point
change of −2 °C to control loop 1. This set point change can behandled well and the steady state is reached in about 25 min.There is an initial delay of about 1 min as the location of thetemperature is far from the valve. As a consequence, it takes awhile for the change in the liquid reflux to affect the controlledtemperature. This loop has interactions with loops 3 and 4, as T5
(measured) and T7 (measured) show some deviation from theirset points due to action of RL1.Figure 7 (run 3) shows a set point change of ±1 °C change in
the loop 2. Again, this set point change is handled well. However,there is significant interaction with all the other loops. This is
Figure 4. Screen-shot of operator interface during experimental run 12.
Table 1. Four-Point Temperature Regulatory Control Structurea,b
control loop manipulated variablea controlled variableb
loop 1 liquid split valve (RL1) temperature in section 2 (T2)loop 2 distillate split valve (RL2) temperature in section 3 (T3)loop 3 upper side product split valve (RL3) temperature in section 5 (T5)loop 4 lower side product split valve (RL4) temperature in section 7 (T7)
aManipulated variables (controller outputs) are the swinging funnel ratios RL1, RL2, RL3, and RL4: RL1 = L1/L3, RL2 = L3/(L3 + D), RL3 = L5/(L5 + S1),RL4 = L6/(L6 + S2). Here, L1, L3, L5, and L6 are liquid flows in sections 1, 3, 5, and 6, respectively (see Figure 3). S1 and S2 are side product flowrates. bControlled variables are temperature sensors as shown in Figure 3b,c. T2 = TP5, T3 = TM3, T5 = TM8, and T7 = TM14
Industrial & Engineering Chemistry Research Article
dx.doi.org/10.1021/ie301432z | Ind. Eng. Chem. Res. 2012, 51, 15696−1570915700

because a change in distillate flow affects directly the molardifference between the boilup (V) and liquid reflux (L) in theentire column.Figures 8 and 9 (runs 4 and 5) plot show similar set point
changes in loops 3 and 4, respectively, and these changes arehandled well without interactions with other loops. Figure 10(run 6) shows simultaneous changes in the set point for all thefour loops, which are also handled reasonably well.Finally, Figure 11 (run 7) shows the response for an increase in
feed rate from 3 L/h to 3.6 L/h (+20%). This disturbance canalso be handled well, and the controlled-temperatures arebrought back to their set points in about 30 min.
Steady State Experiments and Comparison withSimulations. To study the steady-state behavior, experimentalruns 8−12 were carried out with constant temperature set points.For runs 9−12, samples of the feed and products were collectedand analyzed using high-performance liquid chromatography(HPLC). Figure 12 (run 8) shows a typical response when thecolumn is “steady” for a period of 2 h, with all the fourtemperature loops closed. All the four temperatures can bemaintained at their respective set points. The steady-state resultsfor run 9−12 are summarized in Table 3 (compositions) andTable 4 (controller outputs ≡ plant inputs).We now want to compare the steady-state experimental results
with a standard equilibrium stage distillation model. The vapor−liquid equilibria is modeled using theWilson model for the liquidphase, and the vapor is assumed to be ideal. We use the constantmolar overflow assumption, which is reasonable for our mixture(see Appendix for details of the dynamic model, but note that, wehave compared only the steady state experiments with themodel).To match the experimental steady state data, we can adjust the
following degrees of freedom in the model:
1. theoretical number of stages (we use a fixed value for allexperiments)
2. boilup (V/F)3. feed composition4. liquid split ratio (RL1)5. vapor split ratio (RV)6. distillate product split ratio (RL2)7. upper side product split ratio (RL3)8. lower side product split ratio (RL4)
The degrees of freedom are adjusted for each experiment,except for the theoretical number of stages in the sections. Thenumber of theoretical stages was based on experimentalestimation of height equivalent of a theoretical plate (HETP).For the estimation of HETP, a total reflux experiment (run 13)was performed with only two components, namely methanol andethanol. The liquid split ratio (RL1) was used to controltemperature difference (ΔT = T2 − T5) between theprefractionator (section 2) and the main column (section 5).The temperatures (T2 ≡ TP5, T5 ≡ TM8) chosen wereapproximately at the same height (and of packing) from thereboiler. The set point of this controller was then set to zero sothat the compositions should be the same on both sides. Thesystem was allowed to stabilize and samples were taken at thelocation of side products (S1 and S2) for analysis. Figure 13shows the stable run during this experiment with the controlled-variable (ΔT) and controller output. The molar composition ofmethanol was about 75% and 21% in samples S1 and S2,respectively. The graphical McCabe Thiele method and Fenskeequation both give the number of theoretical stages to be about 4.
Table 2. List of Experimentsa
experiment description
run 1 cold start-uprun 2 −2 °C set point change in T2 (prefractionator loop)run 3 ±1 °C set point changes in T3 (distillate product loop)run 4 ±1 °C set point changes in T5 (upper side product loop)run 5 ±1 °C set point changes in T7 (lower side product loop)run 6 simultaneous ±1 °C set points changes in all temperaturesrun 7 +20% disturbance in feed raterun 8 steady state run with constant set points: T2 = 80.6 °C, T3 =69 °C,
T5 = 82 °C, T7 = 110.2 °Crun 9 steady state run with constant set points: T2 = 88 °C, T3 = 69 °C,
T5 = 88 °C, T7 = 113 °Crun 10 steady state run with constant set points: T2 = 91 °C, T3 = 69.5 °C,
T5 = 92 °C, T7 = 113 °Crun 11 steady state run with constant set points: T2 = 91.5 °C, T3 = 72 °C,
T5 = 92 °C, T7 = 112 °Crun 12 steady state run with constant set points: T2 = 95 °C, T3 = 71 °C,
T5 = 86 °C, T7 = 112 °Crun 13 total reflux experiment for calculating number of theoretical stages
aFeed rate for all runs (except run 7) = 3 LPH. Reboiler duty for allruns = 2 kW.
Figure 5. Experimental run 1: Cold start-up.
Industrial & Engineering Chemistry Research Article
dx.doi.org/10.1021/ie301432z | Ind. Eng. Chem. Res. 2012, 51, 15696−1570915701

The height of packing between the sample points is 0.65 m and,the HETP for our packing was thus estimated to be about 16 cm.The value of HETP = 16 cm was used to find the number ofstages in each section which gives 17 (7 + 10) theoretical stagesfor the prefractionator and 22 (4 + 4 + 4 + 4 + 5 + reboiler) forthe main column.Based on the power input of 2 kW to the reboiler, we can
obtain the boilup (V/F) for use in the model. The feedcomposition is available from HPLC measurements. Finally, the
liquid split ratio (RL1) was obtained directly from theexperiments.With the first four degrees of freedom determined (i.e.,
theoretical number of stages, boilup, feed composition, andliquid split ratio), we are left with four more degrees of freedom(vapor split ratio RV, distillate product split ratio RL2, upper sideproduct split ratio RL3 and lower side product split ratio RL4),which are adjusted to match the following experimental valuesfrom the steady state runs:
Figure 6. Experimental run 2: −2 °C set point change in prefractionator temperature, T2 (control loop 1).
Figure 7. Experimental run 3: ±1 °C set point change in top section temperature, T3 (control loop 2).
Industrial & Engineering Chemistry Research Article
dx.doi.org/10.1021/ie301432z | Ind. Eng. Chem. Res. 2012, 51, 15696−1570915702

1. mole fraction of methanol in the top product (D)2. mole fraction of ethanol in the upper side product (S1)3. mole fraction of propanol in lower side product (S2)4. a temperature in section 2 (TP5) of the prefractionator
This procedure for data fitting is used for experimental runs 9−12. Table 3 compares the product composition from experimentsand simulations and Table 4 gives the corresponding values ofthe four degrees of freedom. Since the mole fractions of the maincomponents in the top product (D), upper side product (S1),
and lower side product (S2) are matched directly, there is anexact match of these compositions. But additionally, the keyimpurities in the side products (S1 and S2), which were notmatched individually, show a very good fit. For example, inexperimental run 9, the mole fraction of methanol in S1 from theexperiment is 31.8%, while from the simulation it is 34.2%. Thekey impurities (propanol and n-butanol) of the lower sideproduct (S2) also show a good fit. From Table 4, we see that thesimulated values of the four degrees of freedom (RL1, RL2, RL3,
Figure 8. Experimental run 4: ±1 °C set point change in middle section temperature, T5 (control loop 3).
Figure 9. Experimental run 5: ±1 °C set point change in bottom section temperature T7 (control loop 4).
Industrial & Engineering Chemistry Research Article
dx.doi.org/10.1021/ie301432z | Ind. Eng. Chem. Res. 2012, 51, 15696−1570915703

and RL4) which were obtained by matching the compositions,agree well with the experimental values.Figure 14 compares the temperatures from the model (lines)
and the experiments (points). The y-axis in Figure 14 shows thetheoretical stages in the model, numbered from top (1) tobottom (22). The x-axis shows the corresponding temperatures.The locations of temperature probes in the experimental setupwith respect to the theoretical stages in the model are not precise
and were not adjusted, but nevertheless we find that the match isgood.In summary, we have a very good agreement between the
experimental steady-state data and the equilibrium stage model.
■ DISCUSSION
Practical Issues Related to Operation. The operation ofthe experimental column had some problems. Early on, the
Figure 10. Experimental run 6: Simultaneous change in all four temperature set points.
Figure 11. Experimental run 7: +20% feed rate disturbance (at t = 5 min).
Industrial & Engineering Chemistry Research Article
dx.doi.org/10.1021/ie301432z | Ind. Eng. Chem. Res. 2012, 51, 15696−1570915704

column was very difficult to operate and stabilize with littlematerial reaching the top of the column.25 On the intuition thatsuggested that this was due to insufficient boilup, the reason
turned out to be vapor leaking from the product valves on theside streams. To resolve this issue, we installed an additionalsmall manual valve and a solenoid valve (in series) downstream
Figure 12. Experimental run 8: steady state operation (T2S = 80.6 °C, T3S = 69 °C, T5S = 82 °C and T7S = 110.2 °C).
Table 3. Steady State Experimental and Simulated Compositions in Runs 9−12
feed D S1 S2 B
component expt and sim expt sim expt sim expt sim expt sim
Experiment Run 9methanol (mol %) 21.4 96.6 96.6 31.8 34.2 0 1.3 0 0ethanol (mol %) 15.4 3.4 3.4 55.4 55.4 16.8 15.4 0 0propanol (mol %) 21.4 0 0 12.7 10.3 75.0 75.0 7.4 1.8n-butanol (mol %) 41.7 0 0 0 0 8.2 8.3 92.6 98.2
Experiment Run 10methanol (mol %) 20.4 94.9 94.9 29.9 27.4 0 0.6 0 0ethanol (mol %) 27.4 5.1 5.1 51.2 51.2 5.9 6.6 0 0propanol (mol %) 28.5 0 0 18.9 21.3 87.5 87.5 4.6 2.43n-butanol (mol %) 23.7 0 0 0 0 6.6 5.3 95.4 97.6
Experiment Run 11methanol (mol %) 20.4 92.7 92.7 17.3 14.8 0 0.2 0 0ethanol (mol %) 17.6 7.3 7.3 51.5 51.5 5.4 4.6 0 0propanol (mol %) 26.7 0 0 31.2 33.5 89.6 89.6 6.7 3.1n-butanol (mol %) 35.3 0 0 0 0.1 4.9 5.6 93.3 96.9
Experiment Run 12methanol (mol %) 16.3 94.4 94.4 26.3 22.3 0 0.5 0 0ethanol (mol %) 19.0 5.6 5.6 56.3 56.3 10.1 7.3 0 0propanol (mol %) 28.3 0 0 17.3 21.3 86.3 86.3 6.4 2.7n-butanol (mol %) 36.4 0 0 0 0 3.5 5.8 93.6 97.2
Table 4. Degree of Freedom in the Four Experiments 9−12
run 9 run 10 run 11 run 12
degree of freedom expt sim expt sim expt sim expt sim
RL1 0.31 0.31 0.15 0.15 0.25 0.25 0.22 0.22RL2 0.93 0.95 0.98 0.98 0.93 0.95 0.96 0.97RL3 0.94 0.90 0.72 0.81 0.81 0.86 0.83 0.88RL4 0.75 0.87 0.83 0.91 0.90 0.91 0.86 0.88RV 0.39 0.30 0.35 0.32
Industrial & Engineering Chemistry Research Article
dx.doi.org/10.1021/ie301432z | Ind. Eng. Chem. Res. 2012, 51, 15696−1570915705

of the swinging funnels, just outside the column. The opening of
the manual valve was adjusted to ensure that there was always a
liquid hold up in the glass downcomer under the swinging funnel.
The additional solenoid valves and the swinging funnel open and
close simultaneously during the cycle. Alternatively, an externally
placed liquid seal in the product withdrawal line would have
stopped any vapor from “leaking” by providing a hydraulic head
to counter the small positive pressure in the column.
Plant-Model Mismatch. As mentioned, the equilibriumstage model fits well with the experiments. The mole fraction ofbutanol in the bottoms product was, however, smaller than thatin the model in all the runs. One reason for this may be that wehave no bottom product (B), meaning that the bottom productaccumulates in the reboiler, and therefore it will take a very longtime to reach the steady compositions in the reboiler.The experimental data also had some uncertainties. The
experimental results for example in Figure 12, show some noise
Figure 13. Experimental run 13: total reflux conditions for determining the HETP.
Figure 14. Steady state experimental and simulated temperature profiles in experiments 9−12.
Industrial & Engineering Chemistry Research Article
dx.doi.org/10.1021/ie301432z | Ind. Eng. Chem. Res. 2012, 51, 15696−1570915706
in the temperatures. This can be just instrument noise or processnoise due to the use of swinging funnels and not continuousvalves with pumps. The composition measurements with HPLCalso have some measurement error. There were some biases intemperature probes. These were calibrated using their measure-ments in cold column conditions. Some probes showed up to 3°C of error from the room temperature and their measurementswere accordingly corrected.Another source of error can be the column pressure drop,
which was neglected in the model. The total pressure drop under
normal operation of the column was about 16 cm of water orabout 0.016 bar (measured using a U-tube manometer).
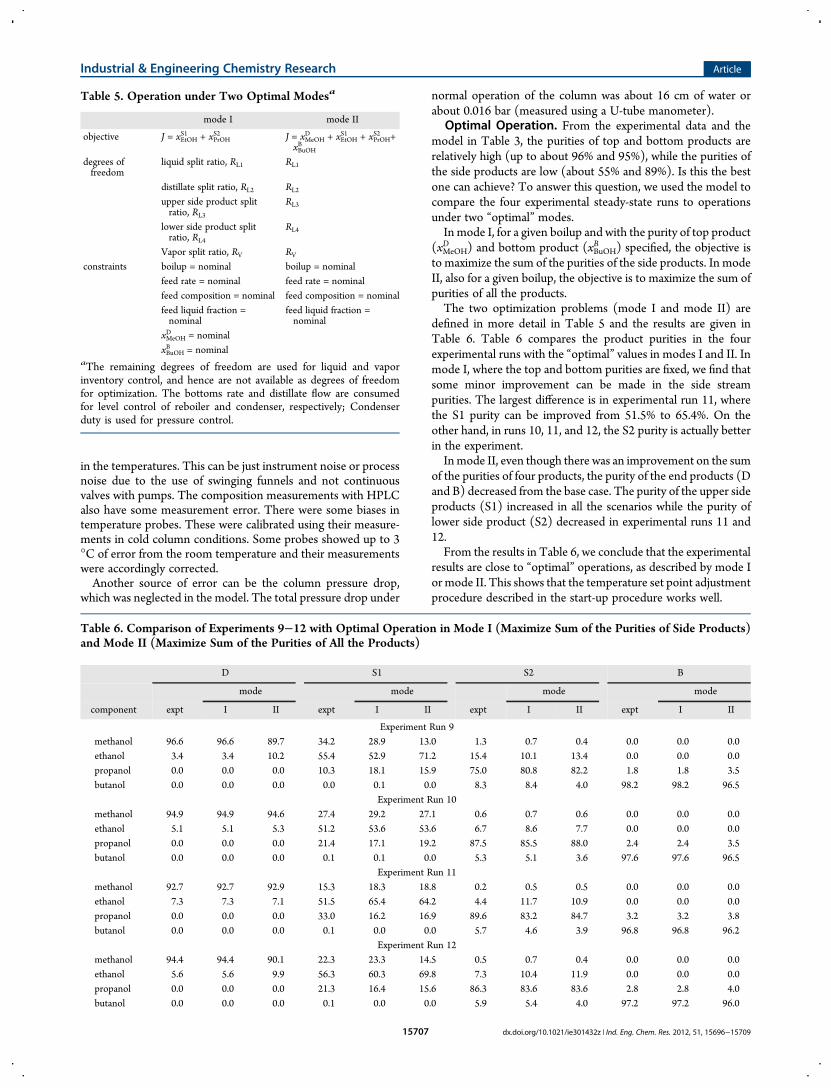
Optimal Operation. From the experimental data and themodel in Table 3, the purities of top and bottom products arerelatively high (up to about 96% and 95%), while the purities ofthe side products are low (about 55% and 89%). Is this the bestone can achieve? To answer this question, we used the model tocompare the four experimental steady-state runs to operationsunder two “optimal” modes.In mode I, for a given boilup and with the purity of top product
(xMeOHD ) and bottom product (xBuOH
B ) specified, the objective isto maximize the sum of the purities of the side products. In modeII, also for a given boilup, the objective is to maximize the sum ofpurities of all the products.The two optimization problems (mode I and mode II) are
defined in more detail in Table 5 and the results are given inTable 6. Table 6 compares the product purities in the fourexperimental runs with the “optimal” values in modes I and II. Inmode I, where the top and bottom purities are fixed, we find thatsome minor improvement can be made in the side streampurities. The largest difference is in experimental run 11, wherethe S1 purity can be improved from 51.5% to 65.4%. On theother hand, in runs 10, 11, and 12, the S2 purity is actually betterin the experiment.Inmode II, even though there was an improvement on the sum
of the purities of four products, the purity of the end products (Dand B) decreased from the base case. The purity of the upper sideproducts (S1) increased in all the scenarios while the purity oflower side product (S2) decreased in experimental runs 11 and12.From the results in Table 6, we conclude that the experimental
results are close to “optimal” operations, as described by mode Ior mode II. This shows that the temperature set point adjustmentprocedure described in the start-up procedure works well.
Table 5. Operation under Two Optimal Modesa
mode I mode II
objective J = xEtOHS1 + xPrOH
S2 J = xMeOHD + xEtOH
S1 + xPrOHS2 +
xBuOHB
degrees offreedom
liquid split ratio, RL1 RL1
distillate split ratio, RL2 RL2
upper side product splitratio, RL3
RL3
lower side product splitratio, RL4
RL4
Vapor split ratio, RV RV
constraints boilup = nominal boilup = nominalfeed rate = nominal feed rate = nominalfeed composition = nominal feed composition = nominalfeed liquid fraction =nominal
feed liquid fraction =nominal
xMeOHD = nominalxBuOHB = nominal
aThe remaining degrees of freedom are used for liquid and vaporinventory control, and hence are not available as degrees of freedomfor optimization. The bottoms rate and distillate flow are consumedfor level control of reboiler and condenser, respectively; Condenserduty is used for pressure control.
Table 6. Comparison of Experiments 9−12 with Optimal Operation in Mode I (Maximize Sum of the Purities of Side Products)and Mode II (Maximize Sum of the Purities of All the Products)
D S1 S2 B
mode mode mode mode
component expt I II expt I II expt I II expt I II
Experiment Run 9methanol 96.6 96.6 89.7 34.2 28.9 13.0 1.3 0.7 0.4 0.0 0.0 0.0ethanol 3.4 3.4 10.2 55.4 52.9 71.2 15.4 10.1 13.4 0.0 0.0 0.0propanol 0.0 0.0 0.0 10.3 18.1 15.9 75.0 80.8 82.2 1.8 1.8 3.5butanol 0.0 0.0 0.0 0.0 0.1 0.0 8.3 8.4 4.0 98.2 98.2 96.5
Experiment Run 10methanol 94.9 94.9 94.6 27.4 29.2 27.1 0.6 0.7 0.6 0.0 0.0 0.0ethanol 5.1 5.1 5.3 51.2 53.6 53.6 6.7 8.6 7.7 0.0 0.0 0.0propanol 0.0 0.0 0.0 21.4 17.1 19.2 87.5 85.5 88.0 2.4 2.4 3.5butanol 0.0 0.0 0.0 0.1 0.1 0.0 5.3 5.1 3.6 97.6 97.6 96.5
Experiment Run 11methanol 92.7 92.7 92.9 15.3 18.3 18.8 0.2 0.5 0.5 0.0 0.0 0.0ethanol 7.3 7.3 7.1 51.5 65.4 64.2 4.4 11.7 10.9 0.0 0.0 0.0propanol 0.0 0.0 0.0 33.0 16.2 16.9 89.6 83.2 84.7 3.2 3.2 3.8butanol 0.0 0.0 0.0 0.1 0.0 0.0 5.7 4.6 3.9 96.8 96.8 96.2
Experiment Run 12methanol 94.4 94.4 90.1 22.3 23.3 14.5 0.5 0.7 0.4 0.0 0.0 0.0ethanol 5.6 5.6 9.9 56.3 60.3 69.8 7.3 10.4 11.9 0.0 0.0 0.0propanol 0.0 0.0 0.0 21.3 16.4 15.6 86.3 83.6 83.6 2.8 2.8 4.0butanol 0.0 0.0 0.0 0.1 0.0 0.0 5.9 5.4 4.0 97.2 97.2 96.0
Industrial & Engineering Chemistry Research Article
dx.doi.org/10.1021/ie301432z | Ind. Eng. Chem. Res. 2012, 51, 15696−1570915707
■ CONCLUSIONSThe experimental studies verify that stable operation of the fourproduct Kaibel column can be achieved with the 4-pointtemperature control scheme shown in Figure 3c. The controlstructure gave good servo performance for set point changes aswell as good regulation for a +20% feed disturbance. The samecontrol structure was adopted during the cold start-up of thecolumn and with the proposed procedure for adjusting thetemperature set points, it was possible to use only temperaturemeasurements to approach the desired steady-state composition,that is, without needing online composition measurements.An equilibrium stage model was fitted to the experiments. The
fitted model gave good match with the experiments. Thissuggests that equilibrium staged models can be used to study theoperation and design of such columns.
■ APPENDIX
Model DetailsThe Kaibel column under study is modelled in Matlab usingseven column sections.25 Themodel is available at the home pageof the corresponding author, S. Skogestad. We assume constantpressure, equilibrium on all stages, a total condenser, constantmolar flows and linearized liquid dynamics. Themodel equationsfor a column sections are
1. Total material balance on stage “i”:
= − + −+ −tM L L V V
dd i i i i i1 1
where Mi is molar holdup on stage “i”; tray numbering is frombottom to top. Li is liquid molar flow and Vi is total molar vaporflow from a stage “i”.
2. Component balance on stage “i” for a component “j”:
= + − −+ + − −tx M L x V y L x Vy
dd
( )j i i i j i i j i i j i i j i, 1 , 1 1 , 1 , ,
where, xj,i is mole fraction of component “j” in liquid phase onstage “i”:
3. Vapor−Liquid Equilibria. The VLE is described as
γ=Py x Pj j j jS
where P is the total pressure and saturation vapor pressures (PS)is given by Antoine equation:
= −+
P AB
T Clog j j
j
i j
S
where A, B, and C are Antoine constants and Ti is absolutetemperature of a stage “i”. The ideal vapor phase is assumed, andthe Wilson model is used for the liquid phase activity coefficients(γi).
4. Constant molar flow in a section:
= =− +V V Vi i i1 1
This assumption holds well since the four components havesimilar heats of vaporization (35.3, 38.5, 41.8, and 43.1 kJ/kmol)at their normal boiling points.
Linearized flow dynamics:
τ= + − + −− −L L M M V V( )/i i i i i i0, 0, 1 0, 1
L0, V0, and M0 are nominal values for molar liquid flows, molarliquid flows, and molar hold up, respectively at time, t = 0; τ =0.063 min.
■ AUTHOR INFORMATIONCorresponding Author*E-mail: [email protected] Address¶Senior Process Engineer, Aker Solutions, Norway.NotesThe authors declare no competing financial interest.
■ ACKNOWLEDGMENTSMs. Kathinka Qvenild Lystad, Engineer, SINTEF Materials andChemistry, assisted with the analysis of samples using HPLC.
■ REFERENCES(1) Petlyuk, F.; Platonov, V.; Avetlyan, V. Optimum Arrangements inthe Fractionating Distillation ofMulticomponentMixtures.Khim. Prom-st. 1966, 42, 865−868.(2) Kaibel, G. Distillation Columns with Vertical Partitions. Chem. Eng.Technol. 1987, 10, 92−98.(3) Fonyo, Z. Thermodynamic Analysis of Rectification. I. ReversibleModel of Rectification. Int. Chem. Eng. 1974, 14, 18−26.(4) Fonyo, Z. Thermodynamic Analysis of Rectification. II. FiniteCascade Models. Int. Chem. Eng. 1974, 14, 203−210.(5) Petlyuk, F.; Platonov, V.; Slavinskii, D. ThermodynamicallyOptimal Method for Separating Multicomponent Mixtures. Int. Chem.Eng. 1965, 5, 555−561.(6) Petlyuk, F.; Platonov, V. Thermodynamically Reversible Multi-component Distillation. Khim, Prom-st. 1964, 723−726 (in Russian).(7) Dejanovic, I.; MatijaZevic, L.; Halvorsen, I.; Skogestad, S.; Jansen,H.; Kaibel, B.; Olujic. Designing Four-Product Dividing Wall Columnsfor Separation of a Multicomponent Aromatics Mixture. Chem. Eng. Res.Des. 2011, 89, 1155−1167.(8) Kaibel, G. 1984; A distillation column for fractionating multi-component feed (German Title: Destillationskolonne zur destillativenZerlegung eines aus mehreren Fraktionen bestehenden Zulaufpro-duktes), European Patent EP 0 122 367 A2, 1984 (1984); Priority dataDE 3302525 (1983).(9) Halvorsen, I. J.; Skogestad, S. Minimum Energy Consumption inMulticomponent Distillation. 3. More Than Three Products andGeneralized Petlyuk Arrangements. Ind. Eng. Chem. Res. 2003, 42, 616−629.(10) Olujic, Z.; Jodecke, M.; Shilkin, A.; Schuch, G.; Kaibel, B.Equipment Improvement Trends in Distillation. Chem. Eng. Process.: PI2009, 48, 1089−1104.(11) Dejanovic, I.; Matijasevic, L.; Olujic, Z. Dividing Wall Column, ABreakthrough Towards Sustainable Distilling. Chem. Eng. Process.: PI2010, 49, 559−580.(12) Niggemann, G.; Hiller, C.; Fieg, G. Experimental and TheoreticalStudies of a Dividing-Wall Column Used for the Recovery of High-Purity Products. Ind. Eng. Chem. Res. 2010, 49, 6566−6577.(13) Niggemann, G.; Gruetzmann, S.; Fieg, G. Distillation Startup ofFully Thermally Coupled Distillation Columns: Theoritical Examina-tion. Proc. 8th Distill. Absorp., IChemE Symp. Ser. 2006, 152, 800−808.(14) Mutalib, M. I. A.; Smith, R. Operation and Control of DividingWall Distillation Columns: Part 1: Degrees of Freedom and DynamicSimulation. Chem. Eng. Res. Des. 1998, 76, 308−318.(15)Mutalib, M. I. A.; Zeglam, A. O.; Smith, R. Operation and Controlof Dividing Wall Distillation Columns: Part 2: Simulation and PilotPlant Studies Using Temperature Control. Chem. Eng. Res. Des. 1998,76, 319−334.
Industrial & Engineering Chemistry Research Article
dx.doi.org/10.1021/ie301432z | Ind. Eng. Chem. Res. 2012, 51, 15696−1570915708

(16) Ling, H.; Luyben, W. L. New Control Structure for Divided-WallColumns. Ind. Eng. Chem. Res. 2009, 48, 6034−6049.(17) van Diggelen, R. C.; Kiss, A. A.; Heemink, A. W. Comparison ofControl Strategies for Dividing-Wall Columns. Ind. Eng. Chem. Res.2010, 49, 288−307.(18) Ling, H.; Cai, Z.; Wu, H.; Wang, J.; Shen, B. Remixing Control forDivided-Wall Columns. Ind. Eng. Chem. Res. 2011, 50, 12694−12705.(19) Adrian, T.; Schoenmakers, H.; Boll, M. Model predictive controlof integrated unit operations: Control of a divided wall column. Chem.Eng. Process. 2004, 43, 347−355.(20) Rewagad, R. R.; Kiss, A. A. Dynamic optimization of a dividing-wall column using model predictive control. Chem. Eng. Sc. 2012, 68,132−142.(21) Buck, C.; Hiller, C.; Fieg, G. Applying Model Predictive Controlto Dividing Wall Columns. Chem. Eng. Technol. 2011, 34, 663−672.(22) Strandberg, J.; Skogestad, S. Stabilizing Control of an Integrated4-Product Kaibel Column. Proc. IFAC Int. Symp. Advan. Control Chem.Proc. (ADCHEM 2006), 2006, 2, 623−628.(23) Ghadrdan, M.; Halvorsen, I. J.; Skogestad, S. Optimal Operationof Kaibel Distillation Columns. Chem. Eng. Res. Des. 2011, 89, 1382−1391.(24) Kvernland, M.; Halvorsen, I. J.; Skogestad, S. Model PredictiveControl of a Kaibel Distillation Column. Proc. 9th Int. Symp. DYCOPS2010 2010, 539−544.(25) Strandberg, J. Optimal operation of dividing wall columns. Ph.D.Thesis, Norwegian University of Science and Technology, Departmentof Chemical Engineering, Trondheim, Norway, 2011.(26) Skogestad, S. Simple Analytic Rules forModel Reduction and PIDController Tuning. J. Process Contr. 2003, 13, 291−309.
Industrial & Engineering Chemistry Research Article
dx.doi.org/10.1021/ie301432z | Ind. Eng. Chem. Res. 2012, 51, 15696−1570915709