status of the walleye fishery at crawling valley reservoir
TRANSCRIPT

Status of the Walleye Fishery at Crawling Valley Reservoir, Alberta, 2004
CONSERVATIONCONSERVATION
REPORT REPORT
SERIESSERIES
CONSERVATIONCONSERVATION
REPORT REPORT
SERIESSERIES 25% Post Consumer Fibre
When separated, both the binding and paper in this document are recyclable
The Alberta Conservation Association is a Delegated Administrative Organization under Alberta’s Wildlife Act.

Status of the Walleye Fishery at Crawling Valley Reservoir, Alberta, 2004
Jason K. Blackburn and Jason A. Cooper Alberta Conservation Association
2nd floor, YPM Place, 530 – 8th Street South Lethbridge, Alberta, Canada
T1J 2J8

Report Series Co‐editors PETER AKU KELLEY KISSNER Alberta Conservation Association 59 Tuscany Meadows Cres NW #101, 9 Chippewa Rd Calgary, AB T3L 2T9 Sherwood Park AB T8A 6J7 Conservation Report Series Type Data ISBN printed: 978‐0‐7785‐7080‐6 ISBN online: ISBN No. 978‐0‐7785‐7081‐3 Publication No.: Pub No. 187 Disclaimer: This document is an independent report prepared by the Alberta Conservation Association. The authors are solely responsible for the interpretations of data and statements made within this report. Reproduction and Availability: This report and its contents may be reproduced in whole, or in part, provided that this title page is included with such reproduction and/or appropriate acknowledgements are provided to the authors and sponsors of this project. Suggested citation: Blackburn, J.K., and J.A. Cooper. 2005. Status of the walleye fishery at Crawling Valley
Reservoir, Alberta, 2004. Data report, D‐2005‐035, produced by Alberta Conservation Association, Lethbridge, Alberta, Canada. 24 pp.
Cover photo credit: David Fairless Digital copies of conservation reports can be obtained from: Alberta Conservation Association #101, 9 Chippewa Rd Sherwood Park AB T8A 6J7 Toll Free: 1‐877‐969‐9091 Tel: (780) 410‐1998 Fax: (780) 464‐0990 Email: info@ab‐conservation.com Website: www.ab‐conservation.com
i

EXECUTIVE SUMMARY In response to increasing public demand for enhanced angling opportunities, Alberta
Sustainable Resource Development (ASRD) initiated walleye stocking programs in the
late 1980’s and early 1990’s on many irrigation reservoirs in southern Alberta, including
the Crawling Valley Reservoir. Crawling Valley Reservoir was stocked each year from
1990 to 1992 and currently supports one of the most popular walleye fisheries in
southern Alberta. However, little data exist on the population structure of walleye or
angling pressure for this reservoir. To generate such data, the Alberta Conservation
Association (ACA) and ASRD conducted a joint Fall Walleye Index Netting (FWIN)
survey from 20 – 22 September 2004 to assess the status of the walleye fishery on the
reservoir. Data on catch rate and population structure were obtained from gill net
catches and growth rates were estimated using the von Bertalanffy growth model.
Population status and stability were determined using an ASRD‐derived regression
model and the ASRD Walleye Management and Recovery Plan classification system.
A total of 221 walleye were captured during the survey, resulting in a catch rate of 27
fish/net/24 h or 25 fish/100 m2/24 h. Of the 144 walleye > 345 mm fork length (the size
walleye reach first maturity in the reservoir), 96 were mature. The average catch rate of
mature‐sized fish was 15.8 fish/100 m2/24 h. Although nearly twice as many females as
males were represented in the overall catch (sex ratio = 1.9 females:1.0 males), the sexes
were equally represented among the 96 mature fish (sex ratio = 1.04 females:1.0 males).
Overall, the size of walleye captured in 2004 ranged from 104 to 708 mm FL with an
average fork length of 351 + 10.2 mm. The population exhibited a multimodal
distribution with dominant modes at 110 ‐ 140 mm, 200 ‐ 230 mm and 380 ‐ 510 mm.
Thirteen age‐classes were represented in the catch ranging from age‐0 to 14 with a
mean age of 5.2 + 0.3 y. Mean length‐at‐age ranged from 114.7 + 1.0 mm for age‐0 fish
to 559.1 + 14.0 mm for age‐13 males and 634.7 + 32.9 mm for age‐14 females. Dominant
year‐classes were 1997 (age‐7), 1998 (age‐6), and 2004 (age‐0) with respective catch rates
of 5.0, 5.0, and 5.1 fish/net/24 h. These classes comprised 58% of the total catch. In
general, growth rates were higher for females than for males, although unpaired t‐test
results showed no significant difference in growth rate between the sexes except for
age‐13 individuals. Male and female fish reached first‐maturity by ages‐5 and 6,
respectively. Estimates of growth rate derived using the von Bertalanffy growth model
ii

from data collected from 1998 to 2004 and mean length‐at‐age data from 1996 to 2004
indicated that annual growth of walleye has generally decreased over the years,
suggesting an increase in fish density. One‐way ANOVA tests among age‐classes
between sampling years also suggest a decrease in growth rates with significant
decreases in mean length‐at‐age in five age‐classes when compared to previous years.
Walleye density including all size‐classes was predicted at 15.03 fish/ha and 9.6 fish/ha
for adult‐sized fish. According to the ASRD Walleye Management and Recovery Plan
classification system, the walleye population in Crawling Valley Reservoir is
considered vulnerable. Accurate determination of whether a harvestable walleye
surplus exists in Crawling Valley Reservoir depends upon a better understanding of
the effects of incidental angling mortality, illegal harvest, and water availability on
walleye population stability.
iii

ACKNOWLEDGEMENTS This study was a collaborative effort between the Alberta Conservation Association
(ACA) and Alberta Sustainable Resource Development (ASRD), Fish and Wildlife
Division, Southeast Region. We thank Gary Shmorong (ASRD, F&W Officer,
Strathmore) and Cam Wallman (ASRD, Fisheries Management, Brooks), for their
expertise and assistance in helping conduct the FWIN survey. We also thank the
Strathmore Fish and Wildlife Officers who graciously allowed the use of their boat for
this survey. The Crawling Valley Recreation Society provided us a seasonal campsite
and storage at the reservoir despite the long waiting list. This report benefited from
constructive comments offered by Trevor Council, Glen Clements, Cam Wallman and
Peter Aku.
iv

v
TABLE OF CONTENTS
EXECUTIVE SUMMARY........................................................................................................... ii
ACKNOWLEDGEMENTS........................................................................................................ iv
TABLE OF CONTENTS ............................................................................................................. v
LIST OF FIGURES......................................................................................................................vi
LIST OF TABLES.......................................................................................................................vii
LIST OF APPENDICES ...........................................................................................................viii
1.0 INTRODUCTION .......................................................................................................... 1
2.0 STUDY AREA................................................................................................................. 2 2.1 Reservoir characteristics ........................................................................................... 2 2.2 Fish community ......................................................................................................... 4
3.0 METHODS ...................................................................................................................... 4 3.1 Study design............................................................................................................... 4 3.2 Biological data............................................................................................................ 6 3.3 Data analyses.............................................................................................................. 7
4.0 RESULTS ......................................................................................................................... 9 4.1 Catch results ............................................................................................................... 9 4.2 Walleye CUE .............................................................................................................. 9 4.3 Age‐class distribution ............................................................................................. 11 4.4 Size distribution ....................................................................................................... 11 4.5 Age‐at‐maturity ....................................................................................................... 13 4.6 Growth rate and length‐at‐age............................................................................... 13 4.7 Walleye catch rate comparison .............................................................................. 19 4.8 Walleye population density and stability ............................................................ 20 4.9 Summary................................................................................................................... 21
5.0 LITERATURE CITED .................................................................................................. 22
6.0 APPENDICES............................................................................................................... 25

LIST OF FIGURES
Figure 1. Map of Crawling Valley Reservoir. ..................................................................... 3
Figure 2. Depth and area stratification of Crawling Valley Reservoir with sample site locations for the 2004 FWIN survey..................................................................... 5
Figure 3. Catch frequency distribution of all captured walleye from Crawling Valley Reservoir, 2004. ..................................................................................................... 10
Figure 4. Catch frequency distribution of walleye > 345 mm FL from Crawling Valley Reservoir, 2004. ..................................................................................................... 10
Figure 5. Age‐class distribution of walleye captured in Crawling Valley Reservoir, 2004. ........................................................................................................................ 11
Figure 6. Fork length and age frequency distribution of walleye captured in Crawling Valley Reservoir, 2004.......................................................................................... 12
Figure 7. Age‐at‐maturity among male and female walleye in Crawling Valley Reservoir, 2004. ..................................................................................................... 13
Figure 8. Length‐at‐age of walleye in Crawling Valley Reservoir, 2004. ...................... 15
Figure 9. Comparison of mean length‐at‐age of walleye in Crawling Valley Reservoir in 1996, 1997, 1998, 2003 and 2004...................................................................... 18
Figure 10. Comparison of mean length‐at‐age of walleye from Crawling Valley Reservoir in 2004 with populations in 2003 from Newell Reservoir (highest growth rate) and McGregor Reservoir (lowest growth rate) ......................... 18
Figure 11. Comparison of mean FWIN catch rate at Crawling Valley Reservoir to other Alberta waterbody FWIN surveys. .................................................................... 19
vi

LIST OF TABLES
Table 1. Summary of mean length‐at‐age of walleye in Crawling Valley Reservoir, 2004. ........................................................................................................................ 14
Table 2. Comparison of mean length‐at‐age of female and male walleye. ................. 14
Table 3. Summary of von Bertalanffy growth indices (L∞, K, and t0) for walleye collected from Crawling Valley Reservoir in 1998 and in 2002 ‐ 2004. ......... 16
Table 4. Analysis of variance results for the difference in mean fork length per age class among sample years on Crawling Valley Reservoir. ............................. 17
vii

LIST OF APPENDICES
Appendix 1. Catch distribution of walleye by gill net and depth stratum at Crawling Valley Reservoir, 2004.......................................................................................... 25
Appendix 2. Description of population classification criteria from the Alberta Walleye Management and Recovery Plan........................................................................ 26
Appendix 3. Catch by mesh size for various fish species from FWIN survey, Crawling Valley Reservoir, 2004.......................................................................................... 28
Appendix 4. von Bertalanffy growth curves and residual plots for walleye from Crawling Valley Reservoir in 1998 and in 2002 ‐ 2004. ................................... 31
viii

1.0 INTRODUCTION
Prior to the late 1990’s, the walleye (Sander vitreus) fishery was minimal in southern
Alberta as populations were limited to a small number of rivers and irrigation
reservoirs (Council and Clayton 1997, 1998). In response to increasing demands for
angling opportunities, Alberta Sustainable Resource Development (ASRD) initiated
walleye stocking programs in the late 1980’s and early 1990’s on many irrigation
reservoirs in southern Alberta, including the Crawling Valley Reservoir (Alberta
Forestry, Lands and Wildlife 1986 ‐ 1989). Crawling Valley Reservoir was stocked each
year from 1990 to 1992 and currently supports one of the best walleye fisheries in
southern Alberta that is fast becoming popular among recreational anglers. To allow
stocked walleye sufficient time to establish and reproduce, Crawling Valley Reservoir
was managed as a catch‐and‐release fishery with an annual angling season from 8 May
to 15 March, and an angling closure from 16 March to 7 May during spring spawning
(ASRD 2004a).
With the increasing popularity of the walleye fishery on the reservoir, anglers are
expected to pressure ASRD to change walleye fishing regulations from catch‐and‐
release to an allowable harvest. Although several sportfish inventory studies have been
conducted on the reservoir (Council and Clayton 1997, 1998, 1999; Council 2000, 2001,
2002; Council and Cooper 2003; Cooper 2004), little quantitative data exist on angling
pressure or walleye population size. In 2004, the Alberta Conservation Association
(ACA) and ASRD initiated a five‐part field study which included a Fall Walleye Index
Netting (FWIN) survey to assess the status of the walleye fishery in the reservoir. The
quantitative data collected from this survey is intended to help formulate future
management guidelines pertaining to walleye harvest in the reservoir. In the current
report, data are presented on population structure, growth, density and stability, as
part of the larger study.
1

2
2.0 STUDY AREA
Crawling Valley Reservoir (Townships 22 and 23, Ranges 17 and 18, west of the Fourth
Meridian) is located approximately 140 km east of Calgary, near Bassano, Alberta.
Construction was completed in October 1984 with the filling of the reservoir, and it was
officially opened on 10 June 1985. Water levels first reached full supply level (FSL) in
1987 (English 1988). The reservoir is owned and operated by the Eastern Irrigation
District (EID). Primary access to the reservoir is located at the southwest corner of the
Crawling Valley Reservoir campground near the south dam and inlet canal (Figure 1).
Access can also be gained via oil and gas roads at various points along the shoreline,
but these access points limit anglers to hand‐launched boats or fishing from shore.
2.1 Reservoir characteristics
Crawling Valley Reservoir at FSL has a surface area of 2,315 ha, a maximum length of
15.5 km, and a maximum width of 4.9 km. The reservoir has a mean depth of 5.7 m and
a maximum depth of 16.8 m (ASRD 2004b). When Crawling Valley Reservoir was
constructed and filled, it flooded a valley and integrated two natural water bodies,
Barkenhouse Lake and South Reservoir, as well as numerous side coulees. As a result,
the reservoir has approximately 150 km of shoreline, and a shoreline development
factor of 7.9 (Mitchell and Prepas 1990). The canal (North Branch) supplying water to
Crawling Valley Reservoir originates at Bassano Reservoir on the Bow River and has
four water control structures located along its length. The inlet canal enters the
reservoir in the southwest corner and the outlet canal is situated at the southeast corner.
The close proximity of the inlet and outlet canals limits the exchange of water to the
south end, leaving the remainder of the reservoir with little mixing action and a longer
residence time. The mean annual drawdown is 0.6 m, and residence time of the water
averages 1.4 y (Mitchell and Prepas 1990).

Alberta
Edmonton
Calgary
CrawlingValleyReservoir
Lethbridge
1 0 1 32
SCALE IN KILOMETRES
N
S
W E
MAIN DAM
INLET CANAL
OUTLET CANALCampground &
Boatlaunch
DAM
Figure 1. Map of Crawling Valley Reservoir. Inset is a map of Alberta indicating the
location of the reservoir within the province.
3

2.2 Fish community
Crawling Valley Reservoir currently supports a diverse fish assemblage. Immediately
after construction, northern pike (Esox lucius) and rainbow trout (Oncorhynchus mykiss)
migrated from the Bow River to the reservoir via the North Branch Canal. The
reservoir was also stocked with brook trout (Salvelinus fontinalis), brown trout (Salmo
trutta), and rainbow trout during its first year of operation in 1985, and later with
walleye over a three year period from 1990 to 1992. Additional species in the reservoir
include cisco (Coregonus artedi) which were accidentally introduced during the 1992
walleye stocking program, and lake whitefish (Coregonus clupeaformis) which migrated
from connecting reservoir canals. Several other species in the reservoir were residents
of the two waterbodies incorporated into Crawling Valley Reservoir. These species
include: white sucker (Catostomus commersoni), longnose sucker (Catostomus catostomus),
shorthead redhorse (Moxostoma macrolepidotum), burbot (Lota lota), fathead minnow
(Pimephales promelas), spottail shiner (Notropis hudsonius), trout‐perch (Percopsis
omiscomaycus), and brook stickleback (Culaea inconstans) (Mitchell and Prepas 1990).
3.0 METHODS
3.1 Study design
The surface area of the reservoir was divided into 1‐km2 sample units (based on a
Universal Transverse Mercator (UTM) grid). Each sample unit was further divided into
four 0.25‐km2 quadrats. Sampling sites were randomly selected from the pool of
quadrats (phone book method) as described in Morgan (2000). Once a quadrat was
selected, it could not be selected again (sampling without replacement).
The reservoir was divided into two depth strata. The shallow stratum ranged from 2 to
5 m in depth and the deep stratum ranged from 5 to 15 m in depth. Sampling effort
was allocated among the two depth strata in proportion to the area within each stratum
(Morgan 2000). The ratio of surface area within the 2 to 5 m stratum (684 ha) to that of
the deep stratum (1,024 ha) was 1:1.15. Based on this ratio, three nets were set in the
shallow stratum and five in the deep stratum (Figure 2).
4
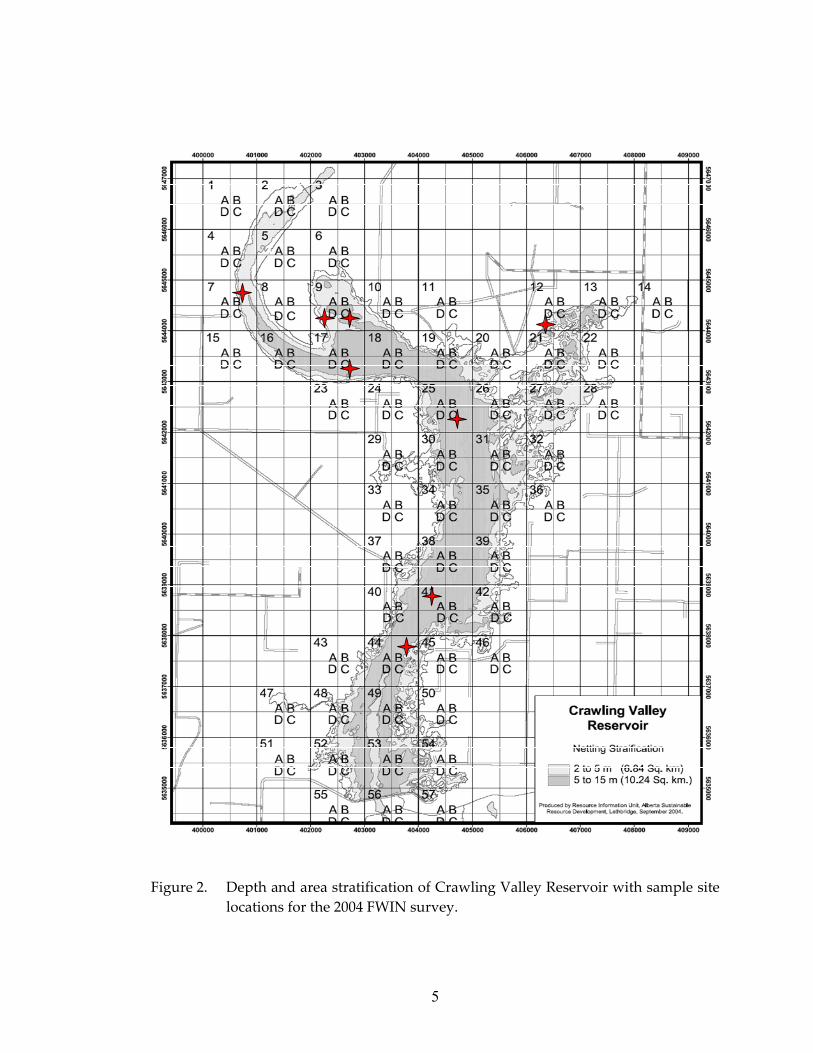
Figure 2. Depth and area stratification of Crawling Valley Reservoir with sample site
locations for the 2004 FWIN survey.
5
We sampled fish using the fall walleye index gill netting (FWIN) protocol (Morgan
2000). Each FWIN gill net was 61 m long and consisted of eight 7.6 x 1.8 m
monofilament panels of different mesh sizes (25, 38, 51, 64, 76, 102, 127, and 152 mm,
stretched mesh) sewn together in ascending order. Nets were set perpendicular to
reservoir contours from shallow to deep water for a duration of 24 h (± 3 h). Nets were
set for an average duration of 22.8 h, ranging from 20.5 to 28.5 h. When adjacent
quadrats from different grids were scheduled to be sampled on the same day, nets were
set no less than 500 m apart to ensure sites were independent of one another. Areas
with steep gradients or abundant aquatic vegetation were avoided.
Surface water temperatures (0.5 m below water surface) were measured at each site to
ensure sampling was conducted within the FWIN guideline range of 10 to 15°C
(Appendix 1); when the water column is equally mixed and fish are randomly
distributed (Morgan 2000).
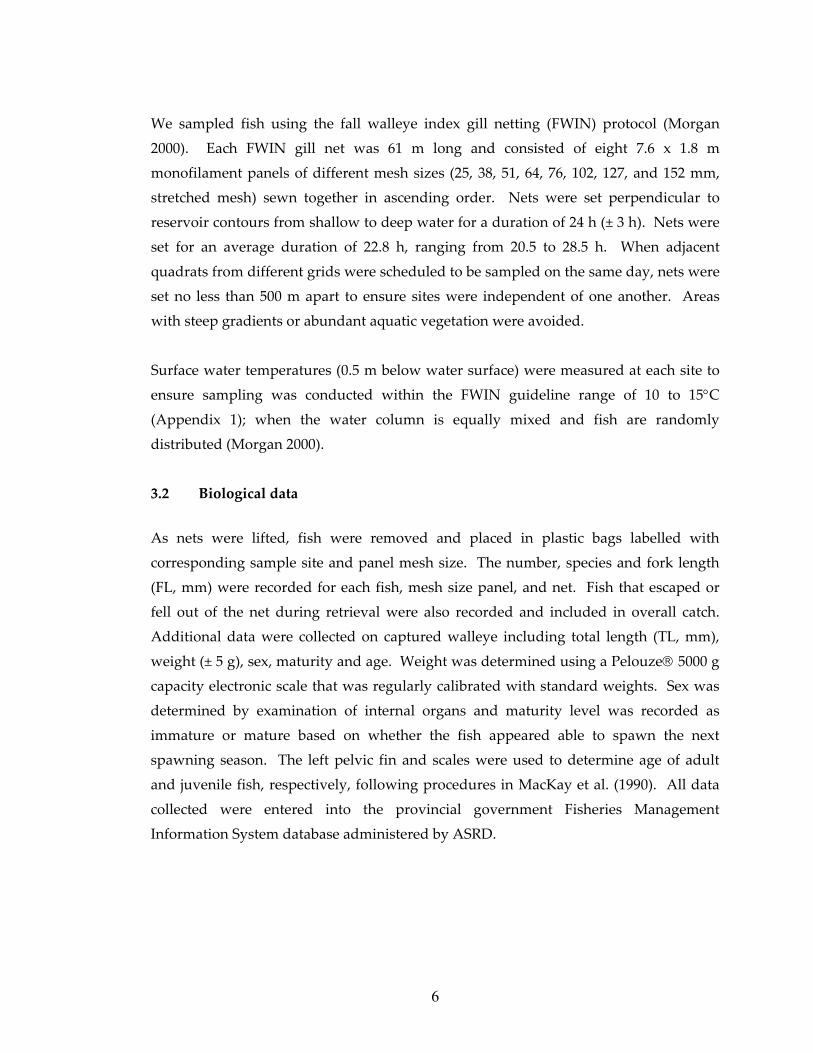
3.2 Biological data
As nets were lifted, fish were removed and placed in plastic bags labelled with
corresponding sample site and panel mesh size. The number, species and fork length
(FL, mm) were recorded for each fish, mesh size panel, and net. Fish that escaped or
fell out of the net during retrieval were also recorded and included in overall catch.
Additional data were collected on captured walleye including total length (TL, mm),
weight (± 5 g), sex, maturity and age. Weight was determined using a Pelouze® 5000 g
capacity electronic scale that was regularly calibrated with standard weights. Sex was
determined by examination of internal organs and maturity level was recorded as
immature or mature based on whether the fish appeared able to spawn the next
spawning season. The left pelvic fin and scales were used to determine age of adult
and juvenile fish, respectively, following procedures in MacKay et al. (1990). All data
collected were entered into the provincial government Fisheries Management
Information System database administered by ASRD.
6

3.3 Data analyses
Data analyses and production of graphs were done using Microsoft Excel.
Bootstrapping methods described by Haddon (2001) were used to calculate confidence
intervals (95%, based on 2,000 replicates with replacement) for FWIN walleye catch
(walleye per net). One‐way ANOVA analyses were performed using JMP‐IN version
4.0 statistical software and unpaired students t‐tests were performed using Microsoft
Excel.
3.3.1 Catch‐per‐unit‐effort
Catch‐per‐unit‐effort (CUE) was calculated based on the catch per FWIN net, per 24‐h
period (fish/net/24 h).
Walleye CUE estimates from Crawling Valley Reservoir were compared to those from
other southern region reservoirs and those from lakes in the northern region of the
province to assess the relative walleye abundance. Catch‐per‐unit‐effort was calculated
as fish/net to compare with these existing data.
3.3.2 Length‐at‐age and growth
We used mean length‐at‐age to estimate fish growth using the von Bertalanffy (1938)
growth model:
Lt = L∞ (1 ‐ e –K (t ‐ t0))
where,
Lt = length at age t,
L∞ = the asymptote or final maximum size,
K = the rate at which the growth curve approaches the asymptote, and
t0 = a time scaler, the hypothetical time when the fish was size zero.
Parameter estimates of the growth model were made using Fisheries Analysis and
Simulation Tools (FAST 2.0) software (Slipke and Maceina 2001). The 2004 growth
7
models were compared to data collected from previous surveys (1998, 2002, and 2003).
One‐way ANOVAs were performed on walleye length‐at‐age data from previous
sample years to determine whether growth rates changed over time. Unpaired
students t‐tests were performed on walleye length‐at‐age data to determine whether
growth rate differed between the sexes and ANOVA was used to determine whether
length‐at‐age varied between sexes.
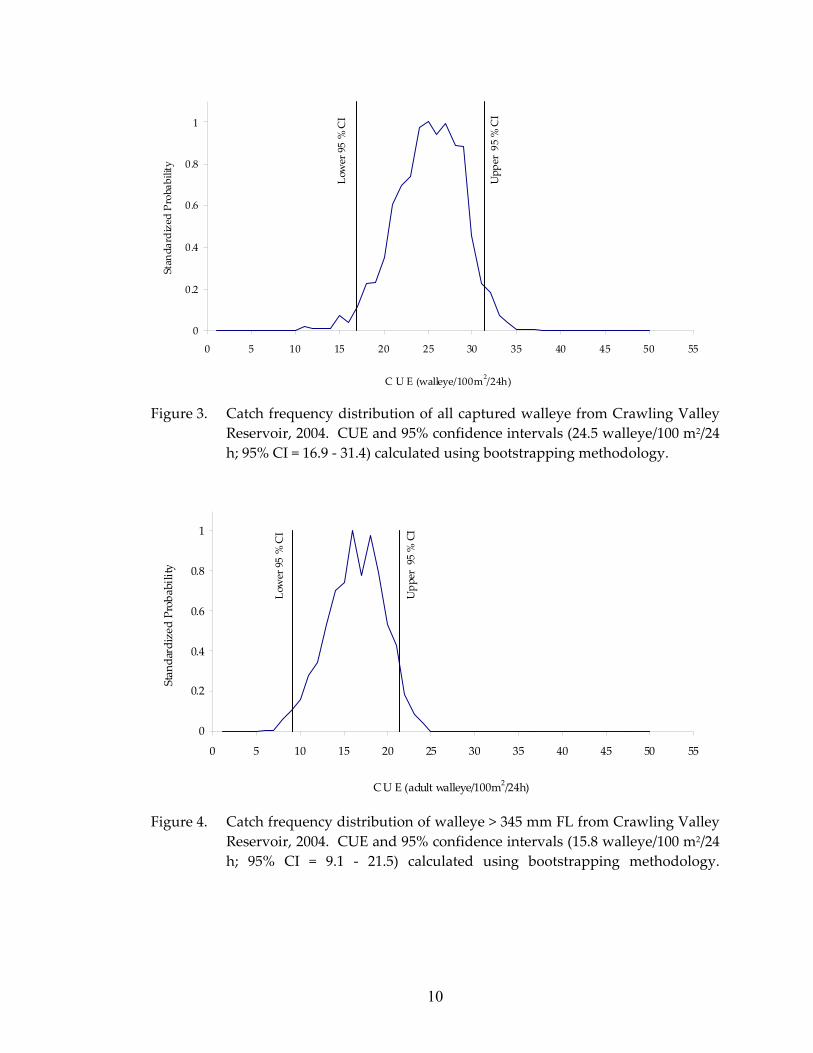
3.3.3 Density and stability
Walleye population density (y) was predicted using a regression equation (y = 0.5381x +
0.3918, where x = mean CUE) developed by M. Sullivan based on population estimates
and angler creel data from 17 Alberta lakes (M. Sullivan, ASRD – Fish and Wildlife
Division, pers. comm.). Population stability was based on current total allowable catch
(TOC) risk analysis (Sullivan 2003; M. Sullivan, pers. comm. 2005) and on criteria used
to classify stability from the ASRD Walleye Management and Recovery Plan (Appendix
2). A standardized probability of CUE was calculated as fish/100 m2/24 h using
bootstrapping in order to determine the status category in which the walleye
population at Crawling Valley Reservoir in 2004 should be classified based on the
ASRD Walleye Management and Recovery Plan. Two separate catch rates were used to
determine population status and density. One included the mean CUE of all walleye
captured in the FWIN, whereas the other included the mean CUE of walleye > 345 mm
FL (adult sized walleye; Cooper and Blackburn 2005; unpubl. data). The latter catch
rate correction was made because development of the linear regression equation for
calculating density was based on angling and trapping data of primarily adult
(spawning) walleye.
8
4.0 RESULTS
Subsurface water temperatures averaged 13.1°C (range 12.5 to 14.0°C) and were all
within the FWIN temperature range guidelines of 10 to 15°C.
4.1 Catch results
A total of 312 fish comprising seven species were captured during the survey. The
mean catch per set was 39.0 fish/net/24 h. More fish were captured per net in deep
water (42.2 fish/net/24 h) than in shallow water (33.7 fish/net/24 h). Of the 312
individuals captured, 221 were walleye, with the remaining catch (91 fish) comprised of
cisco, white sucker, northern pike, lake whitefish, spottail shiner, and longnose sucker
(Appendix 3).
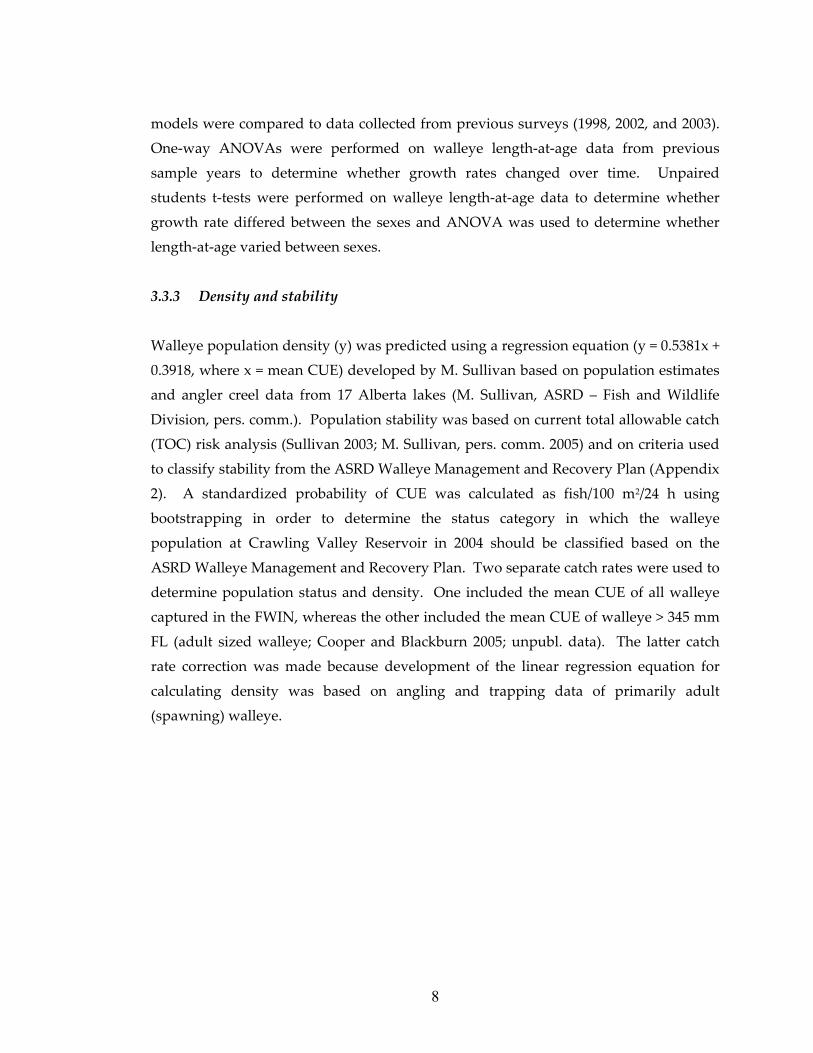
4.2 Walleye CUE
Walleye were captured in all mesh sizes with an average catch of 27.2 fish/net/24 h (95%
CI = 18.6 ‐ 34.6 fish/net/24 h) or 24.5 fish/100 m2/24 h (95% CI = 16.9 ‐ 31.4 fish/100 m2/24
h) (Figure 3). More walleye were captured in deep water (32.6 fish/net/24 h) than in
shallow water (18.4 fish/net/24 h). The 76‐mm mesh gill net panel was most efficient at
catching walleye (n = 52, 24%) and the 152‐mm panel the least efficient (n = 1, < 1%,
Appendix 3).
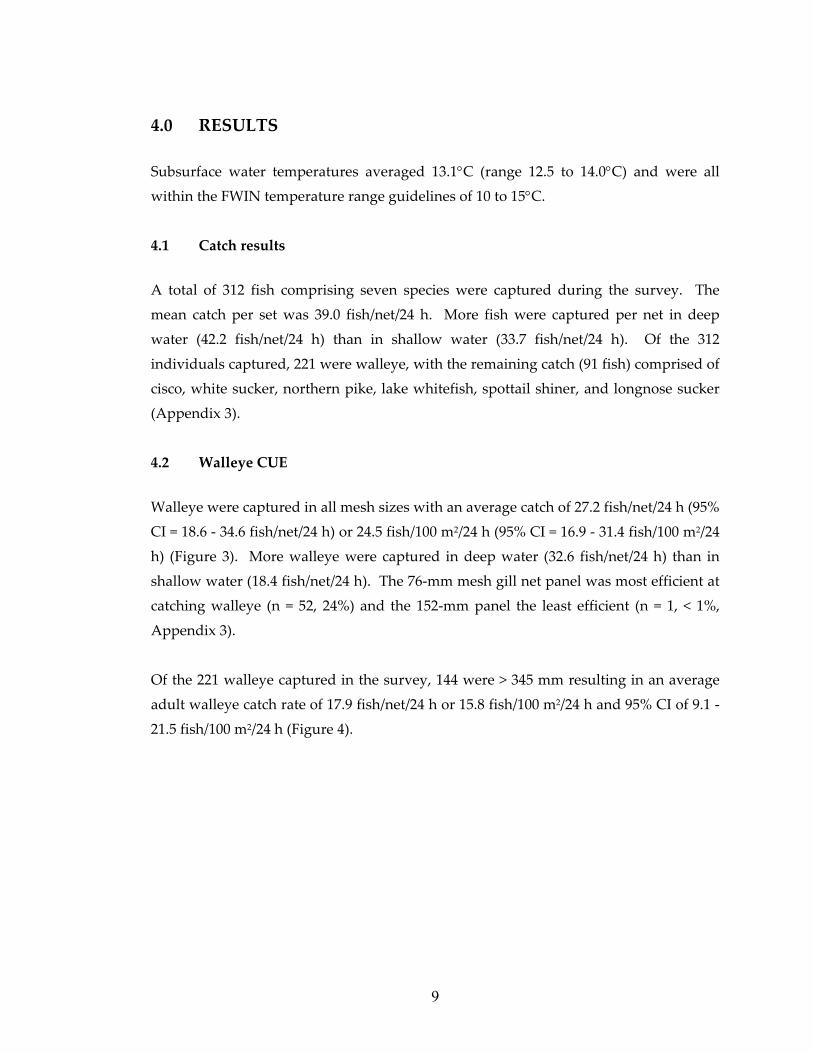
Of the 221 walleye captured in the survey, 144 were > 345 mm resulting in an average
adult walleye catch rate of 17.9 fish/net/24 h or 15.8 fish/100 m2/24 h and 95% CI of 9.1 ‐
21.5 fish/100 m2/24 h (Figure 4).
9
10
0
0.2
0.4
0.6
0.8
1
0 5 10 15 20 25 30 35 40 45 50 55
C U E (walleye/100m2/24h)
Stan
dardized Probability
Lower 95 % CI
Upp
er 95 % CI
Figure 3. Catch frequency distribution of all captured walleye from Crawling Valley
Reservoir, 2004. CUE and 95% confidence intervals (24.5 walleye/100 m2/24 h; 95% CI = 16.9 ‐ 31.4) calculated using bootstrapping methodology.
0
0.2
0.4
0.6
0.8
1
0 5 10 15 20 25 30 35 40 45 50 55
C U E (adult walleye/100m2/24h)
Stan
dardized Proba
bility
Lower 95 % CI
Upp
er 95 % CI
Figure 4. Catch frequency distribution of walleye > 345 mm FL from Crawling Valley
Reservoir, 2004. CUE and 95% confidence intervals (15.8 walleye/100 m2/24 h; 95% CI = 9.1 ‐ 21.5) calculated using bootstrapping methodology.

4.3 Age‐class distribution
Overall, 13 age classes, ranging from age‐0 (young‐of‐the‐year) to age‐14 fish with a
mean age of 5.2 + 0.3 y were represented in the catch (Figure 5). Dominant year‐classes
were 1997 (age‐7), 1998 (age‐6), and 2004 (age‐0) with respective catch rates of 5.1, 5.0,
and 5.0 fish/net. Collectively, these three age classes accounted for more than half
(58%) of the total catch. The 2000 and 2001 year‐classes, with combined catch rates of <
1 fish/net, were the weakest year‐classes. Individuals of all three initial stocking year‐
classes in 1990, 1991 and 1992 (ages‐12 to 14) were represented in the 2004 catch. There
was an absence of 1993 and 1994 year‐classes suggesting stocked walleye did not
successfully reproduce until 1995. The overall age‐class distribution suggests
recruitment has occurred annually since 1995.
N = 220
1992
2004
2003
2002
20012000 19931994
1998 1997
1996
1999 19951990
1991
0.0
1.0
2.0
3.0
4.0
5.0
6.0
yoy 1 2 3 4 5 6 7 8 9 10 11 12 13 14 15
Age (y)
CUE (walleye per net)
Initial stocking years
Figure 5. Age‐class distribution of walleye captured in Crawling Valley Reservoir, 2004.
4.4 Size distribution
Size (FL) of walleye in Crawling Valley Reservoir ranged from 104 ‐ 708 mm with an
average FL of 351 + 10.2 mm (Figure 6). The population exhibited a multimodal
11

12
distribution. A dominant peak at the 110 ‐ 125 mm range represented age‐0 walleye.
Other peaks at 200 ‐ 225 mm consisted primarily of yearling walleye with a few age‐2
and 3 fish. The 400 ‐ 525 mm range represented fish ranging from age‐4 to 12 y, but
was dominated by age‐6 and 7 fish. There were few fish within the 250 ‐ 350 mm size
range representing age‐4 fish. Although there were differences in gear used among
years, the size range of walleye captured in 2004 was similar to those of previous
surveys in 1998 and 2003 (Council and Clayton 1999; Council and Cooper 2003).
N = 220
0.0
1.0
2.0
3.0
4.0
5.0
0 50 100 150 200 250 300 350 400 450 500 550 600 650 700 750
Fork Length (mm)
CUE (w
alleye per net)
Figure 6. Fork length and age frequency distribution of walleye captured in Crawling
Valley Reservoir, 2004.

4.5 Age‐at‐maturity
Of the 144 adult walleye captured, 96 were mature. Of the mature fish, 47 were females
and 49 were males resulting in a female to male sex ratio of 1.0:1.04. Although nearly
twice as many females as males were represented in the overall catch (sex ratio = 1.9
females:1.0 males), sexes were equally represented among mature fish. Males and
females reached maturity by ages‐5 and 6, respectively (Figure 7). By age‐7 (473 mm
FL), 50% of walleye had reached maturity.
0
1
2
3
4
5
6
0 1 2 3 4 5 6 7 8 9 10 11 12 13 14
Age (y)
CU
E (w
alle
ye p
er n
et)
Immature unknowns, n=58
Immature males, n=8
Immature females, n=59
Mature males, n=49
Mature females, n=47
Figure 7. Age‐at‐maturity among male nd female walleye in Crawling Valley
.6 Growth rate and length‐at‐age
verall, mean length‐at‐age of the walleye population in Crawling Valley Reservoir
aReservoir, 2004.
4
O
ranged from 114.7 mm for age‐0 fish to 634.8 mm for age‐14 fish (Table 1). Male
walleye younger than age‐5 were not captured, therefore comparisons of growth rate
between the sexes were limited to ages‐5 through 13. In general, growth rate tended to
be higher for females than for males; however, unpaired t‐test results showed a
significant sex difference in mean length‐at‐age only for age‐13 fish (Table 2 and Figure
8).
13

Table 1. Summary of mean (± SE) length‐at‐age of walleye in Crawling Valley
Mean length (mm) ± SE
Reservoir, 2004.
Age
All fish n Females n (y) Males n
0 1 14.7 ± 1.0 39
1 204.4 + 2.4 27
2 225.9 + 13.3 9
3 261.3 + 65.7 3
4 365.0 1
5 378.9 + 6.0 367.5 10 + 16.5 381.82 + 7.3 8
6 407.9 + 4.2 40 408.9 + 20.8 21 406.8 + 18.6 19
7 440.6 + 4.6 41 435.3 + 19.3 15 443.7 + 23.7 26
8 478.9 + 6.3 19 476.7 + 25.8 7 480.3 + 21.2 12
9 502.6 + 16.8 9 493.8 + 27.1 6 520.0 + 46.0 3
10 0
11 0
12 531.9 + 15.0 512.5 9 + 31.2 547.4 4 + 31.4 5
13 559.1 + 14.0 9 507.0 + 14.0 2 574.0 + 19.3 7
14 634.8 + 32.9 4 634.8 + 34.7 4
able 2. Comparison of mean (± SE) length‐at‐age of female and male walleye.
ANOVA t‐test
T
Age Mean FL of Mean FL of
F p t p females (mm)
males (mm)
df df
5 381.8 + 7.3 367.5 + 16.5 0. 7 0. 7 0.856 0.41 8 78 7 29 8 6
6 406.8 + 18.6 408.9 + 20.8 0.799 18 0.319 ‐0.250 38 0.8037
7 443.7 + 23.7 435.3 + 19.3 1.512 25 0.211 0.8239 39 0.415
8 480.3 + 21.2 476.7 + 25.8 0.678 11 0.273 0.229 17 0.8214
9 520.0 + 46.0 493.8 + 27.1 2.301 2 0.216 0.678 6 0.523
12 547.4 + 31.4 512.5 + 31.2 1.011 4 0.517 1.176 7 0.2781
13 574.0 + 19.3 507.0 + 14.0 2.542 6 0.309 4.193 8 0.003
14

Males: FL = 147.9 (Ln Age) + 166.13; R2 = 0.867, n = 106
Females :FL = 161.5 (Ln Age) + 122.66; R2 = 0.5872, n = 57 0
100
200
300
400
500
600
700
800
4 5 6 7 8 9 10 11 12 13 14 15
Age (y)
Fork leng
th (m
m)
Females ‐ ‐ ‐ ‐ ‐Males _____
Figure 8. Length‐at‐age of walleye in Crawling Valley Reservoir, 2004. Equations are
natural log‐transformed values. The von Bertalanffy K values (rate at which the fish growth approaches maximum size)
showed an overall decrease in walleye growth from 2002 to 2004 (Table 3 and
Appendix 4). Results of one‐way ANOVA analyses showed that overall growth rates
significantly decreased among 2, 5, 6, 7 and 12 y age‐classes across years (Table 4).
Mean length‐at‐age of walleye from 1996 to 2004 also indicated an overall decreasing
trend in growth rate (Figure 9). In comparison to other reservoirs, growth rates of 2004
walleye in Crawling Valley Reservoir were similar to those from the 2003 Lake
McGregor population (Figure 10), which was the slowest growing of the southern
reservoir walleye populations sampled that year (Cooper 2004).
15

Table 3. Summary of von Bertalanffy growth indices (L∞, K, and t0) for walleye collected from Crawling Valley Reservoir in 1998, and in 2002 ‐ 2004.
1998 2002 2003 2004
Age 0 ‐ 8 3 ‐ 12 3 ‐ 12 0 – 14
L∞ 629 626 671 764
K 0.222 0.226 0.183 0.108
t0 ‐0.822 0.119 ‐0.318 ‐1.717
R2 0.989 0.967 0.976 0.981
p < 0.0001 < 0.0001 < 0.0001 < 0.0001
n 120 146 166 220
Lt = length at age t, L∞ = the asymptote or final maximum size, K = the rate at which the growth curve approaches the asymptote, t0 = the theoretical time when fork length = 0.
16

Table 4. Analysis of variance results for the difference in mean fork length per age class among sample years on Crawling Valley Reservoir.
Age Class Sample Year Mean FL (mm) ± SE n df F‐ratio p
2 1997 277.8 ± 12.8 7 1 9.27 0.0088
2004 225.9 ± 11.2 9
3 2002 278.8 ± 18.7 4 2 0.83 0.4578
2003 294.3 ± 14.2 7
2004 261.3 ± 21.7 3
4 2002 337.5 ± 2.8 34 1 0.39 0.5345
2003 342.0 ± 6.6 6
5 1997 413.8 ± 11.1 6 3 12.3 <0.0001
2002 407.8 ± 4.8 32
2003 374.5 ± 3.7 56
2004 378.9 ± 8.7 10
6 1997 449.8 ± 3.7 49 3 23.1 <0.0001
2002 447.3 ± 4.5 34
2003 427.9 ± 3.1 74
2004 407.9 ± 4.2 40
7 1997 534.2 ± 13.9 5 3 16.5 <0.0001
2002 470.4 ± 7.8 16
2003 469.7 ± 5.1 38
2004 440.6 ± 4.9 41
8 2002 479.7 ± 20.9 3 2 2.8 0.0817
2003 516.7 ± 13.8 7
2004 478.9 ± 8.4 19
9 2003 508.8 ± 20.3 5 1 0.061 0.8098
2004 502.6 ± 15.2 9
11 2002 521.5 ± 10.6 11 1 1.4 0.2457
2003 537.6 ± 8.5 17
12 2002 591.7 ± 33.1 3 2 3.5 0.0498
2003 590.2 ± 17.5 11
2004 531.9 ± 19.4 9
17

18
0
100
200
300
400
500
600
700
800
0 1 2 3 4 5 6 7 8 9 10 11 12 13 14 1Age (yrs)
Fork
leng
th (m
m)
5
CVR 1996CVR 1997CVR 1998CVR 2003CVR 2004
Figure 9. Comparison of mean length‐at‐age of walleye in Crawling Valley Reservoir
in 1996, 1997, 1998, 2003 and 2004 (Cooper 2004).
0
100
200
300
400
500
600
700
800
0 1 2 3 4 5 6 7 8 9 10 11 12 13 14 15Age (yrs)
Fork
Len
gth
(mm
)
CVR 2004Newell 2003
McGregor 2003
Figure 10. Comparison of mean length‐at‐age of walleye from Crawling Valley
Reservoir in 2004 with populations in 2003 from Newell Reservoir (highest growth rate) and McGregor Reservoir (lowest growth rate) (Cooper 2004).

4.7 Walleye catch rate comparison
A catch rate of 17.9 mature fish/net was observed in Crawling Valley Reservoir in 2004,
and was higher than those reported for two other southern region reservoirs in the
same year, Milk River Ridge (16.0 fish/net) and Forty Mile Coulee (11.1 fish/net) using
similar sampling gear and protocol (ASRD 2004c). Relative to other waterbodies in
Alberta, FWIN catch rates for Crawling Valley were moderate to high for total walleye
and moderate to low for adult walleye (Figure 11).
Lakes and Reservoirs in Alberta
Heart ʹ00
Release ʹ01
Seibert ʹ00
Milk River Ridge ʹ04
40 Mile ʹ04
Gregoir
eʹ02
Bourque ʹ00
Calling ʹ02
Long ʹ03
Calling ʹ01
LS Anne ʹ01
Crawling Valley ʹ04
Garner ʹ01
LS Anne ʹ02
Pigeon ʹ04
Vincent ʹ00
Pigeon ʹ03
CUE (walleye per net)
0
10
20
30
40
50
CV Adu
lt ‘04
Figure 11. Comparison of mean FWIN catch rate (walleye/net) at Crawling Valley
Reservoir to other Alberta waterbody FWIN surveys. Graph and data from Watters (2004).
19

4.8 Walleye population density and stability
An initial walleye density of 15.03 fish/ha was predicted for Crawling Valley Reservoir
using the regression equation. When juveniles were excluded, the corrected walleye
density was 9.6 fish/ha, consistent with data from an angler survey on the reservoir that
estimated walleye density at 9.67 fish/ha (Cooper and Blackburn 2005).
According to the ASRD Walleye Management and Recovery Plan classification
(Appendix 2), the status of the walleye population in Crawling Valley Reservoir was
determined to be “vulnerable”. Of the five criteria used to classify Alberta walleye
populations, three clearly indicated a vulnerable status (age‐class stability, length‐at‐
age, and age‐at‐maturity). The remaining two criteria, age‐class distribution and mean
CUE, fell within more than one status range but both had variables within the
vulnerable category.
Age‐class stability indicated vulnerable status because the population exhibits
considerable variation in year‐class strength with poor representation from 1999 to 2002
(severe drought years), even though several age‐classes were present (13 classes) it was
the variation in year‐class strength that suggests a vulnerable population. Length‐at‐
age was “moderate” as fish reached 50 cm FL within 6 to 9 years. Age‐at‐maturity
matched very closely to the vulnerable status category with mean age‐at‐maturity
ranging between 6 – 9 y for females and 5 – 9 y for males.
Walleye age‐class distribution was considered wide with 13 age‐classes present,
indicative of either a stable or a collapsed population. However, the mean age of
walleye was 5.2 y, leading to the classification of vulnerable for the age‐class
distribution criterion. Mean catch rate indicated a population that borders between a
status of stable and vulnerable with a wide confidence range of 16.9 ‐ 31.4 walleye/100
m2/24 h. However, when only adult fish were included, catch rates were
unambiguously within the vulnerable category at 9.1 – 21.5 walleye/100 m2/24 h.
20

21
4.9 Summary
When considering all criteria in the Alberta Walleye Management and Recovery Plan,
the walleye population in Crawling Valley Reservoir may be designated as vulnerable.
Although classified as vulnerable, the walleye population in Crawling Valley Reservoir
shows indications of increasing stability with high recent recruitment and ten
consecutive years of natural recruitment. Certain year‐classes are stronger than others,
but generally the age structure of Crawling Valley Reservoir appears to be approaching
a normalized, more stable level. In addition, K values derived from the von Bertalanffy
growth model suggest overall decreased growth rates, indicating a potential increase in
density. A similar trend was observed in overall mean length‐at‐age comparisons from
1996 to 2004. Comparison of mean length‐at‐age among age‐classes between sampling
years also suggest decreasing growth rates with significant decreases observed in five
age classes.
Uncertainty still exists surrounding the Crawling Valley Reservoir walleye population
as to whether it will attain a more stabilized state or if current pressures such as
incidental angling mortality and illegal harvest will keep the population in varying
states of vulnerability, or lead to collapse. A greater degree of certainty is needed
regarding the effects of these negative pressures and to what extent environmental
effects such as drought have on population stability. Future studies addressing these
factors may provide better insight as to whether a harvestable surplus of walleye
persists in Crawling Valley Reservoir.

5.0 LITERATURE CITED
Alberta Forestry, Lands and Wildlife. 1986‐1989. Fish planting list. Fish and Wildlife
Division, Edmonton, Alberta.
Alberta Sustainable Resource Development. 2004a. 2004 Alberta guide to sport fishing
regulations. Queens Printer Bookstore, Edmonton, Alberta, Canada. 92 pp.
Alberta Sustainable Resource Development. 2004b. Unpublished lake files on
Crawling Valley Reservoir stockings and bathymetric mapping. Alberta
Sustainable Resource Development, Fish and Wildlife Division, Brooks, Alberta.
Alberta Sustainable Resource Development. 2004c. Unpublished lake files on Forty
Mile Coulee and Milk River Ridge reservoirs FWIN sampling program. Alberta
Sustainable Resource Development, Fish and Wildlife Division, Lethbridge,
Alberta.
Berry, D.K. 1995. Alberta’s walleye management and recovery plan. No. T/310, Alberta
Environmental Protection, Natural Resources Service, Edmonton, Alberta. 32
pp.
Cooper, J.A. 2004. Walleye (Stizostedion vitreum) recruitment in southern region
reservoirs, Alberta, 2003 studies. Alberta Conservation Association, Lethbridge,
Alberta. Unpublished. 117 pp.
Cooper, J.A., and J.K. Blackburn. 2005. Population estimate of walleye (Sander vitreus)
in Crawling Valley Reservoir, 2004. Alberta Conservation Association,
Lethbridge, Alberta. Unpublished. 33 pp.
Council, T.F. 2000. Investigations into northern pike (Esox lucius) status in prairie
region reservoirs, Alberta, 1999 studies. Alberta Conservation Association,
Lethbridge, Alberta. 128 pp.
22

Council, T.F. 2001. Investigations into northern pike (Esox lucius) status in prairie
region reservoirs, Alberta, 2000 studies. Alberta Conservation Association,
Lethbridge, Alberta. 142 pp.
Council, T.F. 2002. Walleye (Stizostedion vitreum) recruitment in prairie region
reservoirs, Alberta, 2001 studies. Alberta Conservation Association, Lethbridge,
Alberta. 100 pp.
Council, T.F., and J.A. Cooper. 2003. Sport fish inventory in southern region reservoirs,
Alberta 2002 studies. Alberta Conservation Association, Lethbridge, Alberta.
152 pp.
Council, T.F., and T.B. Clayton. 1997. Walleye (Stizostedion vitreum) recruitment in
prairie region reservoirs, Alberta, 1996 studies. Alberta Conservation
Association, Lethbridge, Alberta. 167 pp.
Council, T.F., and T.B. Clayton. 1998. Walleye (Stizostedion vitreum) recruitment in
prairie region reservoirs, Alberta, 1997 studies. Alberta Conservation
Association, Lethbridge, Alberta. Unpublished. 183 pp.
Council, T.F., and T.B. Clayton. 1999. Walleye (Stizostedion vitreum) recruitment in
prairie region reservoirs, Alberta, 1998 studies. Alberta Conservation
Association, Lethbridge, Alberta. 205 pp.
English, W.G. 1988. Lake inventory survey: Crawling Valley Reservoir. Alberta
Forestry Lands and Wildlife, Fish and Wildlife Division, Lethbridge, Alberta.
Unpublished. 29 pp.
Haddon M. 2001. Modelling and quantitative methods in fisheries. Chapman and
Hall/CRC Press, Washington, D.C. 405 pp.
Mackay, W.C., G.R. Ash, and H.J. Norris. 1990. Fish ageing methods for Alberta. R.L.
& L. Environmental Services Ltd. In association with Alberta Fish and Wildlife
Division, and University of Alberta, Edmonton, Alberta, Canada. 113 pp.
23

24
Mitchell, P., and E. Prepas. 1990. Atlas of Alberta lakes. University of Alberta Press,
Edmonton, Alberta. 675 pp.
Morgan, G.E. 2000. Manual of instructions: Fall Walleye Index Netting (FWIN).
Ontario Ministry of Natural Resources, Fish and Wildlife Division.
Peterborough, Ontario, Canada. 34 pp.
Patterson, B. 2004. Stock status assessment of walleye (Sander vitreus) at Touchwood
Lake, Alberta. Data report produced by Alberta Conservation Association,
Edmonton, Alberta. 34 pp
Slipke, J.W., and M.J. Maceina. 2001. Fisheries analyses and simulation tools
(FAST2.0). Department of Fisheries and Allied Aquacultures, Auburn
University, Alabama, USA.
Sullivan, M.G. 2003. Active management of walleye fisheries in Alberta: dilemmas of
managing recovering fisheries. North American Journal of Fisheries
Management 23: 1343‐1358.
Sullivan, M.G. 2005. Personal Communication. ACA and ASRD joint meeting
regarding total allowable catch risk analysis, Calgary, Alberta.
Sullivan, M.G., and D. Park. 2004. Alberta walleye index netting protocols: summary of
joint ACA/ASRD index‐netting subcommittee. Alberta Fish and Wildlife
Division and Alberta Conservation Association, Edmonton, Alberta. 13p.
von Bertalanffy, L. 1938. A quantitative theory of organic growth. Human Biology 10:
181‐213.
Watters, D. 2004. Long Lake fall walleye index netting survey, 2003. Alberta Fish and
Wildlife Division, Edmonton, Alberta. Unpublished report. 28pp.

6.0 APPENDICES
Appendix 1. Catch distribution of walleye by gill net and depth stratum at Crawling Valley Reservoir, 2004. Codes: walleye = WALL; northern pike = NRPK; lake whitefish = LKWH; cisco = CISC; longnose sucker = LNSC; white sucker = WHSC; spottail shiner = SPSH.
Set
Grid # location & depth stratum Easting Northing
Temp (°C)
Time fished (h) WALL NRPK LKWH CISC LNSC WHSC SPSH Total
1 7B, shallow 400776 5644717 12.5 23.00 23 3 2 0 0 1 0 29
2 9D, shallow 402290 5644266 13.0 24.50 27 3 3 0 0 7 0 40
3 17C, deep 402742 5643278 13.0 25.50 45 1 1 10 1 5 3 66
4 44B, deep 403769 5637810 13.5 28.50 43 2 0 0 0 3 0 48
5 9C, deep 402774 5644257 13.0 22.75 26 5 1 0 0 5 0 37
6 12D, shallow 406401 5644083 12.0 20.50 4 4 0 0 0 19 0 27
7 25C, deep 404762 5642313 14.0 23.00 28 0 0 6 0 0 1 35
8 41A, deep 403315 5638756 13.5 21.75 25 1 0 3 0 1 0 30
Total/Mean 13.1 23.75 221 19 7 19 1 41 4 312
25
Appendix 2. Description of population classification criteria from the Alberta Walleye Management and Recovery Plan (Berry 1995; Sullivan and Park 2004)
Criterion Stable Vulnerable Collapsed
Wide > 8 y classes
Mean age 6‐9 y
Narrow Age‐class
Distribution 1‐ 3 y classes
Mean age 4 ‐ 6 y
Wide or Narrow Mean age 6 ‐ 10 y
Age‐class Stability Stable Unstable Stable or unstable
Length at age Slow
50 cm in 9 ‐12 y Moderate
50 cm in 7 – 9 y Fast
50 cm in 4 ‐ 7 y
Age‐at‐maturity (mean age)
Females 8 ‐ 10 y Males 7 ‐ 9 y
Females 7 ‐ 8 y Males 5 ‐ 7 y
Females 4 ‐ 7 y Males 3 – 6 y
Mean CUE (density) High Moderate Low Walleye/100 m2/24 h > 24/100 m2/24 h 4.6 ‐ 23/100 m2/24 h < 4.5/100 m2/24 h
Table from ASRD Walleye Management and Recovery Plan, modified from Berry 1995 and Patterson 2004 (Sullivan and Park 2004)
26

27
Appendix 2. Continued. Alberta Walleye Management and Recovery Plan ‐ Description of Status Categories Stable Status
• Age class distribution relatively broad • Minimal variation in individual year class strengths • Abundant adult fish, many 3 to 5 y fish • Moderate rate of fish growth ‐ 9 to 12 y to reach 50 cm in length • Mean age at maturity 8 – 12 y for females 7 – 9 y for males. • High catch rates: CUE >24 fish/100 m2/24 h
Vulnerable Status • Low numbers of fish • Narrow, unstable age‐class distributions • Year‐classes fluctuate between successful and unsuccessful spawning years • Adult densities are low • Fast fish growth and young age at maturity ‐ 7 to 9 y to reach 50 cm • Mean age at maturity 7 ‐ 8 y for females, 5 ‐ 7 y for males • Lower catch rates: CUE = 4.6 ‐ 23/100 m2/24 h
Collapsed Status • Very low fish densities • Unstable age class distribution‐ very narrow to very broad, absence of year
classes • Few fish reach maturity • Very fast growth and young maturity – 4 to 7 y to reach 50 cm • Mean age at maturity 4 ‐ 7 y for females, 3 ‐ 6 y for males • Catch rates poor: CUE < 4.5/100 m2/24 h • Divided into two sub‐categories:
1. Native (natural) populations severely over harvested 2. Stocked populations that have not become self‐sustaining
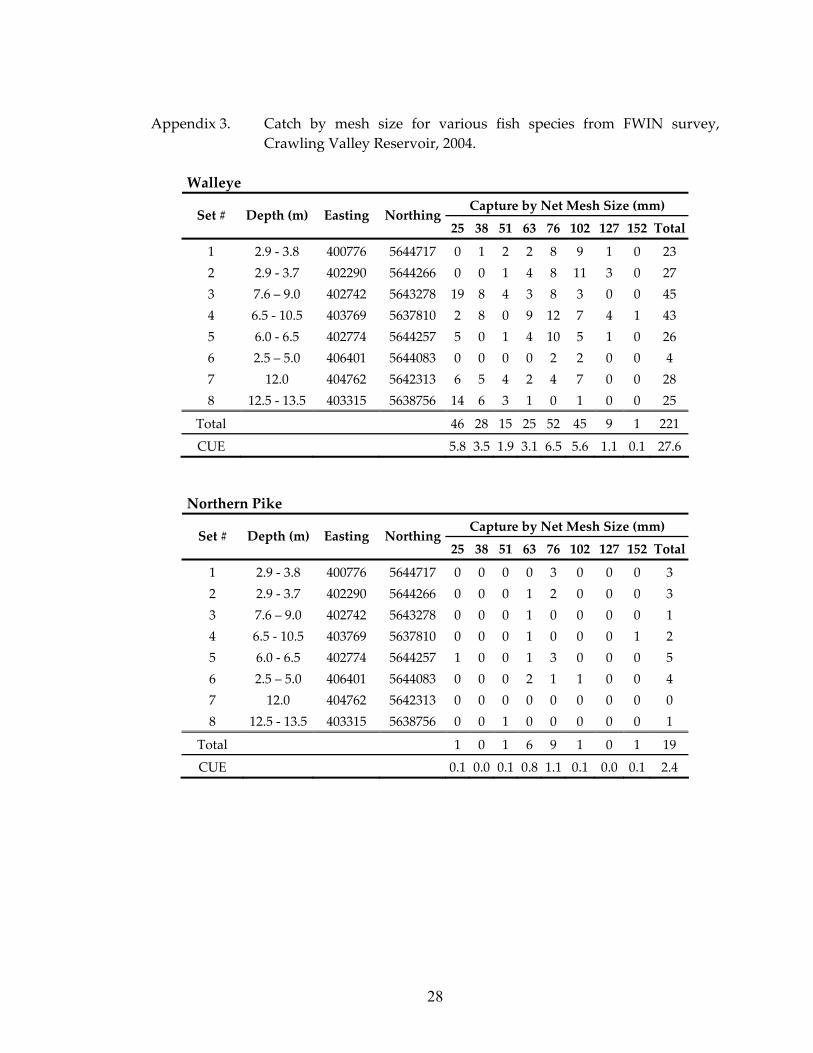
Appendix 3. Catch by mesh size for various fish species from FWIN survey, Crawling Valley Reservoir, 2004.
Walleye
Capture by Net Mesh Size (mm) Set # Depth (m) Easting Northing
25 38 51 63 76 102 127 152 Total
1 2.9 ‐ 3.8 400776 5644717 0 1 2 2 8 9 1 0 23 2 2.9 ‐ 3.7 402290 5644266 0 0 1 4 8 11 3 0 27 3 7.6 – 9.0 402742 5643278 19 8 4 3 8 3 0 0 45 4 6.5 ‐ 10.5 403769 5637810 2 8 0 9 12 7 4 1 43 5 6.0 ‐ 6.5 402774 5644257 5 0 1 4 10 5 1 0 26 6 2.5 – 5.0 406401 5644083 0 0 0 0 2 2 0 0 4 7 12.0 404762 5642313 6 5 4 2 4 7 0 0 28 8 12.5 ‐ 13.5 403315 5638756 14 6 3 1 0 1 0 0 25
Total 46 28 15 25 52 45 9 1 221
CUE 5.8 3.5 1.9 3.1 6.5 5.6 1.1 0.1 27.6
Northern Pike Capture by Net Mesh Size (mm)
Set # Depth (m) Easting Northing25 38 51 63 76 102 127 152 Total
1 2.9 ‐ 3.8 400776 5644717 0 0 0 0 3 0 0 0 3 2 2.9 ‐ 3.7 402290 5644266 0 0 0 1 2 0 0 0 3 3 7.6 – 9.0 402742 5643278 0 0 0 1 0 0 0 0 1 4 6.5 ‐ 10.5 403769 5637810 0 0 0 1 0 0 0 1 2 5 6.0 ‐ 6.5 402774 5644257 1 0 0 1 3 0 0 0 5 6 2.5 – 5.0 406401 5644083 0 0 0 2 1 1 0 0 4 7 12.0 404762 5642313 0 0 0 0 0 0 0 0 0 8 12.5 ‐ 13.5 403315 5638756 0 0 1 0 0 0 0 0 1
Total 1 0 1 6 9 1 0 1 19
CUE 0.1 0.0 0.1 0.8 1.1 0.1 0.0 0.1 2.4
28

Appendix 3. Continued.
Cisco Capture by Net Mesh Size (mm)
Set # Depth (m) Easting Northing25 38 51 63 76 102 127 152 Total
1 2.9 ‐ 3.8 400776 5644717 0 0 0 0 0 0 0 0 0 2 2.9 ‐ 3.7 402290 5644266 0 0 0 0 0 0 0 0 0 3 7.6 – 9.0 402742 5643278 1 1 1 2 0 2 1 2 10 4 6.5 ‐ 10.5 403769 5637810 0 0 0 0 0 0 0 0 0 5 6.0 ‐ 6.5 402774 5644257 0 0 0 0 0 0 0 0 0 6 2.5 – 5.0 406401 5644083 0 0 0 0 0 0 0 0 0 7 12.0 404762 5642313 0 0 3 2 0 0 1 0 6 8 12.5 ‐ 13.5 403315 5638756 0 0 0 0 1 0 2 0 3
Total 1 1 4 4 1 2 4 2 19
CUE 0.1 0.1 0.5 0.5 0.1 0.3 0.5 0.3 2.4
White Sucker Capture by Net Mesh Size (mm)
Set # Depth (m) Easting Northing25 38 51 63 76 102 127 152 Total
1 2.9 ‐ 3.8 400776 5644717 0 0 0 0 0 0 1 0 1 2 2.9 ‐ 3.7 402290 5644266 0 0 0 0 0 2 5 0 7 3 7.6 – 9.0 402742 5643278 0 0 0 1 0 3 1 0 5 4 6.5 ‐ 10.5 403769 5637810 0 0 0 0 0 2 1 0 3 5 6.0 ‐ 6.5 402774 5644257 0 0 0 0 0 2 3 0 5 6 2.5 – 5.0 406401 5644083 0 0 0 0 1 8 7 3 19 7 12.0 404762 5642313 0 0 0 0 0 0 0 0 0 8 12.5 ‐ 13.5 403315 5638756 0 0 0 0 1 0 0 0 1
Total 0 0 0 1 2 17 18 3 41
CUE 0.0 0.0 0.0 0.1 0.3 2.1 2.3 0.4 5.1
29

30
Appendix 3. Continued.
Lake Whitefish Capture by Net Mesh Size (mm)
Set # Depth (m) Easting Northing25 38 51 63 76 102 127 152 Total
1 2.9 ‐ 3.8 400776 5644717 0 0 0 0 0 0 2 0 2 2 2.9 ‐ 3.7 402290 5644266 0 0 0 1 1 0 1 0 3 3 7.6 ‐ 9 402742 5643278 0 0 0 0 1 0 0 0 1 4 6.5 ‐ 10.5 403769 5637810 0 0 0 0 0 0 0 0 0 5 6.0 ‐ 6.5 402774 5644257 0 0 0 0 0 0 1 0 1 6 2.5 – 5.0 406401 5644083 0 0 0 0 0 0 0 0 0 7 12.0 404762 5642313 0 0 0 0 0 0 0 0 0 8 12.5 ‐ 13.5 403315 5638756 0 0 0 0 0 0 0 0 0
Total 0 0 0 1 2 0 4 0 7
CUE 0.0 0.0 0.0 0.1 0.3 0.0 0.5 0.0 0.9
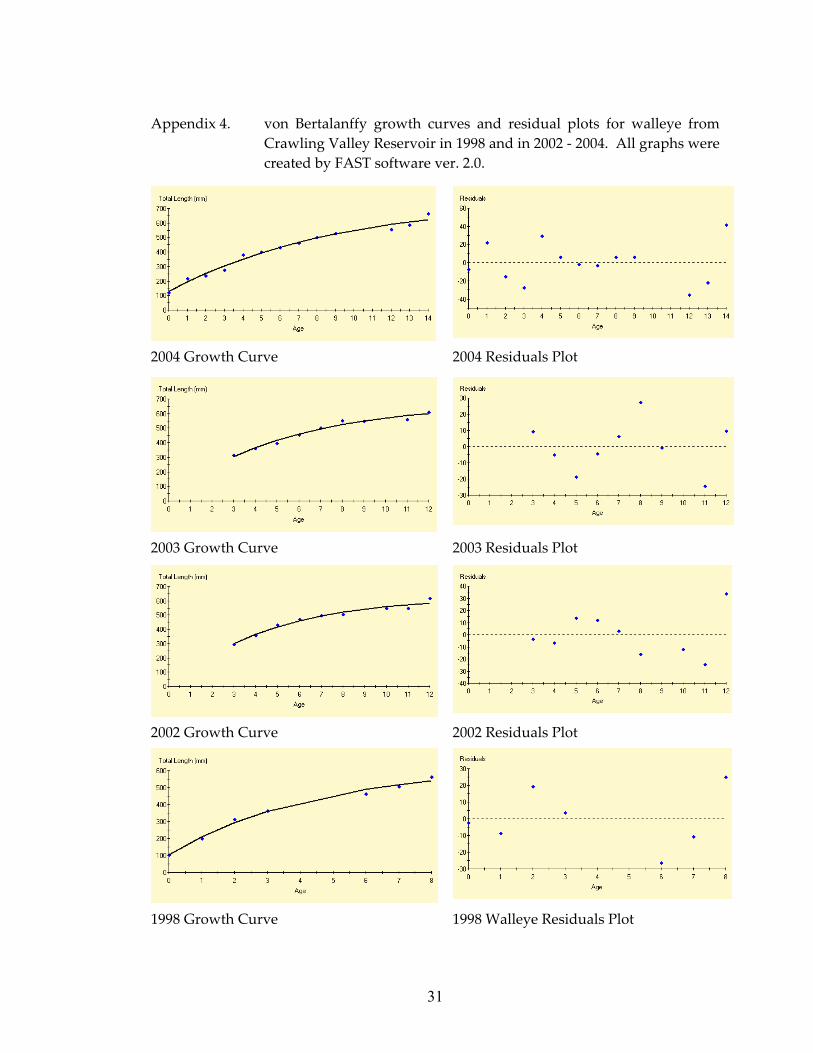
Appendix 4. von Bertalanffy growth curves and residual plots for walleye from Crawling Valley Reservoir in 1998 and in 2002 ‐ 2004. All graphs were created by FAST software ver. 2.0.
2004 Growth Curve 2004 Residuals Plot
2003 Growth Curve 2003 Residuals Plot
2002 Growth Curve 2002 Residuals Plot
1998 Growth Curve 1998 Walleye Residuals Plot
31


CONSERVATIONCONSERVATIONREPORT REPORT SERIESSERIES

The Alberta Conservation Association acknowledges the following partner for their generous support of
this project