status of occupational safety and health …...nairobi-kenya registered by the directorate of...
TRANSCRIPT

STATUS OF OCCUPATIONAL SAFETY AND HEALTH
IN FLOUR MILLING COMPANIES IN NAIROBI
KENYA
WILSON BARU WACHIRA
MASTER OF SCIENCE
(Occupational Safety and Health)
JOMO KENYATTA UNIVERSITY OF
AGRICULTURE AND TECHNOLOGY
2016

Status of Occupational Safety and Health in Flour Milling
Companies in Nairobi Kenya
Wilson Baru Wachira
A Thesis Submitted in Fulfilment for the Degree of Master of
Science in Occupational Safety and Health in the Jomo Kenyatta
University of Agriculture and Technology
2016

ii
DECLARATION
This thesis is my original work and has not been submitted for a degree in any other
University.
Signature…………………………… Date………………
Wilson Baru Wachira
This thesis has been submitted for examination with our approval as the University
supervisors.
Signature…………………………… Date………………
Prof. Ciira Kiiyukia
JKUAT, Kenya
Signature…………………............. Date………………
Mr. Pius Makhonge
JKUAT, Kenya
Signature…………………............. Date………………
Mrs. Margaret Kung’u
Kenyatta University, Kenya

iii
DEDICATION
To my loving wife Fraciah, for her support and encouraging words as I pursued my
degree. To my lovely daughter, Joy and parents.

iv
ACKNOWLEDGEMENT
I would like to thank God for keeping me in good health during the entire period of my
studies. To him is the glory.
I would like to express my earnest gratitude and appreciation to my supervisors Prof.
Ciira Kiiyukia, Mr.Pius Makhonge, Mr. Margaret Kung’u and Mr. Charles Mburu for
their constructive comments and corrections on the thesis. The management of JKUAT
and the entire staff of IEET are also acknowledged.
I also want to thank Richard Korir, Patrick Mwangi, Job Otieno and Solomon Kimeto
who helped me during data collection and analysis.

v
TABLE OF CONTENTS
DECLARATION........................................................................................................... ii
DEDICATION.............................................................................................................. iii
ACKNOWLEDGEMENT ........................................................................................... iv
TABLE OF CONTENTS ............................................................................................. v
LIST OF TABLES ..................................................................................................... viii
LIST OF FIGURES ...................................................................................................... x
LIST OF PLATES ....................................................................................................... xi
LIST OF APPENDICES ............................................................................................ xii
ACRONYMS/ABBREVIATIONS ........................................................................... xiii
DEFINITION OF TERMS........................................................................................ xiv
ABSTRACT ................................................................................................................. xv
CHAPTER ONE ........................................................................................................... 1
INTRODUCTION......................................................................................................... 1
1.1 Background information ....................................................................................... 1
1.2 Statement of the problem ...................................................................................... 3
1.3 Justification ........................................................................................................... 4
1.4 Research questions ................................................................................................ 4
1.5 Objectives .............................................................................................................. 4
1.5.1 Main objective ................................................................................................ 4
1.5.2 Specific objectives .......................................................................................... 5
1.6 Hypothesis of the study ......................................................................................... 5
1.6.1 Null hypothesis (H0) ...................................................................................... 5
1.7 Conceptual framework .......................................................................................... 6
CHAPTER TWO .......................................................................................................... 7
LITERATURE REVIEW ............................................................................................ 7
2.1 Introduction ........................................................................................................... 7
2.2 Theoretical Review ............................................................................................... 9
2.2.1 Causes of accidents ............................................................................................ 9
2.2 Causes of occupational accidents .......................................................................... 9
2.2.2 Dust ............................................................................................................... 12
2.2.3 Noise ............................................................................................................. 14
2.4 Legal Framework ................................................................................................ 18

vi
2.4.1 Managing OSH ............................................................................................. 18
2.3.2 Occupational Health and Safety in Kenya .................................................... 19
2.3.3 Subsidiary laws that deal with OSH issues .................................................. 20
2.4 Previous Related Studies ..................................................................................... 22
CHAPTER THREE .................................................................................................... 24
MATERIALS AND METHODS ............................................................................... 24
3.1 The Study design ................................................................................................. 24
3.2 Study area and Population ................................................................................... 24
3.4 Sample size determination .................................................................................. 26
3.5 Sampling method................................................................................................. 26
3.6 Inclusion and Exclusion criteria .......................................................................... 27
3.6.1 Inclusion Criteria .......................................................................................... 27
3.6.2 Exclusion Criteria ......................................................................................... 28
3.7 Instruments of data collection ............................................................................. 28
3.7.1 Observation ................................................................................................... 28
3.7.2 Questionnaire survey .................................................................................... 28
3.7.3 Review of existing records ........................................................................... 29
3.8 Validity of Instruments .................................................................................... 29
3.9 Reliability of instruments ................................................................................ 29
3.10 Data Management and Analysis ........................................................................ 29
3.11 Ethical Considerations....................................................................................... 30
CHAPTER FOUR ....................................................................................................... 31
RESULTS AND DISCUSSIONS ............................................................................... 31
4.1 Demographic Characteristics of the respondents ................................................ 31
4.1.1 Response rate ................................................................................................ 31
4.1.2 General Workers Characteristics .................................................................. 31
4.1.2 Characteristics of the management staff in the studied flour milling companies
............................................................................................................................... 32
4.2 Activities that constitute occupational safety and health hazards in the flour mills
................................................................................................................................... 36
4.2.1 Identified hazards in the flour milling companies ........................................ 39
4.2.3 Check list results on safety activities ............................................................ 49
4.3 Nature of injuries in flour milling companies studied ......................................... 59
4.3.1 Accidents and incidents in the flour milling companies under investigation59

vii
4.4.1 Causes of accidents ....................................................................................... 61
4.4.2 Control measures .......................................................................................... 62
4.2.2 Training on Occupational Safety and Health ............................................... 66
CHAPTER FIVE ........................................................................................................ 73
CONCLUSION AND RECOMMENDATIONS ...................................................... 73
5.1 Conclusion ........................................................................................................... 73
6.2 Recommendations ............................................................................................... 73
REFERENCES ............................................................................................................ 75
APPENDICES ............................................................................................................. 81

viii
LIST OF TABLES
Table 3.1: Flour Millers in Nairobi..................................................................... ..... ....... 21
Table 4.1: Response rate .................................................................................................. 31
Table 4.2: Characteristics of the general workers in the study ........................................ 32
Table 4.3: Managers and their respective flour milling companies ................................. 32
Table 4.4: Work experience and number of working hours per day ................................ 35
Table 4.5: Areas with high noise levels (db(A) ............................................................... 40
Table 4.6: Dust and related health problems among the management staff .................... 42
Table 4.7: Ailments/conditions related to work among the workers in the companies ... 43
Table 4.8: Identified hazards in the flour milling companies .......................................... 45
Table 4.8a Lifting heavy loads ......................................................................................... 45
Table 4.8 b: High noise levels ......................................................................................... 45
Table 4.8 c: Working with unguarded machines ............................................................. 46
Table 4.8 d: Excessive vibrations .................................................................................... 46
Table 4.8.e: Welding fumes ............................................................................................. 46
Table 4.8 f: Glare from welding fumes ............................................................................ 47
Table 4.8 g: Other hazards (exposed electrical cables, working in confined spaces: ...... 47
Table 4.9: Check list results on safety activities .............................................................. 50
Table 4.9 a: Gangways..................................................................................................... 50
Table 4.9 b: Ventilation ................................................................................................... 50
Table 4.9 c: Exits ............................................................................................................. 51
Table 4.9 d: Display of safety and health policy ............................................................. 51
Table 4.9 e: Display of safety signage ............................................................................. 52
Table 4.9 f: Existence of emergency facilities ................................................................. 52
Table 4.9 g: Observance of safe working procedures ...................................................... 53
Table 4.9h: Guarding of machines ................................................................................... 53
Table 4.9 i: Lifting and carrying of heavy load ............................................................... 54
Table 4.9 j: Condition of the floors ................................................................................. 54
Table 4.9 k: Housekeeping .............................................................................................. 55
Table 4.9 l: Workplace Layout ........................................................................................ 55
Table 4.9 m: Insulation and Protection of Electrical Cables ........................................... 56
Table 4.9 n: Provision and Use of Personal Protection Equipment (PPE) ...................... 56

ix
Table 4.9 o: Supervision .................................................................................................. 57
Table 4.10: Causes of Accidents ...................................................................................... 61
Table 4.11: What to be done to control accidents ............................................................ 63
Table 4.11 a: Prioritise safety and health issues .............................................................. 63
Table 4.11 b: Ensure machines are guarded .................................................................... 63
Table 4.11 c: Train workers on safe work procedures ..................................................... 64
Table 4.11 d: Maintain good housekeeping ..................................................................... 64
Table 4.11 e: Provide mechanical aids for lifting ............................................................ 65
Table 4.11 f: Package grains in smaller bags not exceeding 50kgs ................................. 65
Table 4.11 g: Provide workers with PPE and enforce their use ....................................... 66
Table 4.12: Training and duration of training .................................................................. 67
Table 4.13: Policy communication in the flour mills....................................................... 68
Table 4.14: The PPE provided to workers in the flour mills companies ......................... 69
Table 4.15: Reasons why PPE were not being used in the flour mills companies .......... 70
Table 4.16: Occupational safety and health audits and hygiene surveys ......................... 71

x
LIST OF FIGURES
Figure 1: Conceptual frame work ...................................................................................... 6
Figure 2.1: A process lay out of a typical flour mill .......................................................... 8
Figure 2.2: Main elements of the OSH management system (ILO, 2001). ..................... 18
Figure 3.1: Map of Kenya ................................................................................................ 25
Figure 3.2 A Map of Nairobi county................................................................................ 25
Figure 4.1: Management workers’ gender distribution per flour milling company ........ 33
Figure 4.2: Management staff educational level .............................................................. 33
Figure 4.3: Marital status of the management staff ......................................................... 34
Figure 4.4: Activities constituting occupational safety and health hazards .................... 38
Figure 4.5: Provision of safety and health information like high noise levels ................ 48
Figure 4.6: Nature of Injury at work ............................................................................... 59
Figure 4.7: Means of regular health and safety information ............................................ 67

xi
LIST OF PLATES
Plate 4.1: Unguarded milling machines ........................................................................... 39
Plate 4.2: Worker observed wearing ear muff in one of the companies ............................ 41
Plate 4.3: Workers involved in carrying of heavy load .................................................... 44
Plate 4.4: Signage on high noise levels ............................................................................ 48
Plate 4.5: Unsafe working platform ................................................................................. 57
Plate 4.6: Partially guarded machine in the workshop ..................................................... 58
Plate 4.7: High unsafe stacking and obstructed gangway ................................................ 58

xii
LIST OF APPENDICES
Appendix 1:Written Consent Form ............................................................................................... 81
Appendix 2: Questionnaire for Workers ....................................................................................... 84
Appendix 3: Questionnaire for management staffs ...................................................................... 88
Appendix 4: Observation Checklist on Occupational Health and Safety. .................................... 94
Appendix 5: Publication Abstract ................................................................................................. 98
Appendix 6: Publication Certificate .............................................................................................. 99

xiii
ACRONYMS/ABBREVIATIONS
dB(A) Average weighted sound level in decibel at A weighted system
DOSHS Directorate of Occupational Safety and Health Services
HSA Health and Safety Authority
HSE Health and Safety Executive
ILO International Labour Organization
NSSA National Social Security Association, Zimbabwe
NIOSH National Institute for Occupational Safety and Health, USA
OSH Occupational Safety and Health
OSHA Occupational Safety and Health Act, Kenya
PPE Personal Protective Equipment
SPSS Statistical Package for Social Sciences
WHO World Health Organization
WMSD Work-Related Musculoskeletal Disease

xiv
DEFINITION OF TERMS
Hazard A situation that poses a level of threat to life, health,
property, or environment.
General workers: Includes all workers (apart from the management
team), working in different departments such as
loaders, millers, packers in the packaging unit,
workshop workers and the drivers.
Nature of injury: a variable that identifies the principal physical
characteristic(s) of the injury or disease.
Occupational health services: the sum total of the programmes and activities
performed for the purpose of attaining the highest
level of health and safety of the workers and their
families.
Ugali: a dish made of maize flour (cornmeal), millet flour,
or Sorghum flour cooked in boiling liquid (water or
Milk) to a porridge- or dough-like consistency. It is
the most common staple starch featured in the East
and Central Africa.

xv
ABSTRACT
Flour milling business is an important industry in the Kenyan economy as it provides
maize flour (for ugali) and wheat flour to almost all the households. The study aimed at
assessing occupational safety and health hazards in 11 flour milling companies in
Nairobi-Kenya registered by the Directorate of Occupational Safety and Health Services.
The study employed a descriptive design which used proportionate sampling methods to
select the 310 participants but only 257 respondents filled and returned the questionnaires
(response rate of 82.9%). Respondents were the factory staff who had worked for more
than 6 months in management, milling, packaging, loading/offloading and workshop.
Structured questionnaires were used to collect quantitative data which was analysed using
statistic package for social sciences version 17. The study found out that the milling
processes, maintenance works on the machines, loading and offloading of grains/flour,
workshop activities and the packing activities were the main activities constituting safety
and health hazards in the flour milling companies. Dust related health problems reported
included wheezing, coughs and blocked chest problems. Other ailments believed to be as
a result of the flour milling work were low back pains, joint pains and eye problems.
65.4% of the workers agreed that they had been trained on the safety and health hazards
they were exposed to. The common injuries/incidents reported are, musculoskeletal
problems (44%) (Pain in the muscles and skeleton), minor cuts (27%) (Cuts managed
only by first aiders), major cuts (13%), (cuts managed by first aiders and referred for
medical help), had dislocation (8%), fractures (5%) and amputation (3%). The major
cause of accidents in the flour milling companies were unguarded machines (40%);
slippery floors (14.4%); Inadequate/lack of PPE (11.7%); Poor or lack of housekeeping
(10.9%); inadequate or lack of lifting equipment (10.5%); Trips/slips or falls (7.8%) and
Neglecting Safety Procedures (4.7%). The study recommends the flour milling companies
to ensure health and safety audit, health and safety risk assessment, noise survey, dust
survey and fire safety audit are conducted regularly by qualified personnel and that action
plans to implement recommendations provided there in should also be developed and the
same shared with DOSHS and follow up done. The study also recommends guarding of
all moving parts of the machines that can cause harm, ensure all floors are even, avoid
slippery floors, use mechanical aid for lifting/ carrying heavy loads ensure grains/flour
are packaged in small packages not exceeding 50kg. Adopt lock out tag out system for all
maintenance works on machines. Finally, the study recommends regular training of all the
employees in regards to occupational health and safety, fire safety and first aid. The
trainings should be conducted by qualified professionals who are licensed by DOSHS.

1
CHAPTER ONE
INTRODUCTION
1.1 Background information
Many people spend a significant fraction of the day and night at work in order to
meet their economic and social needs. During work, people are often faced with
various risks and safety hazards, which can expose them to a myriad of adverse
health problems. Depending on the nature of work, occupational hazards can be
associated with a variety of factors including physical, chemical, and biological
agents as well as unfavourable working conditions among others (Ajeel & Al-
Yassen, 2007). According to Kumar, Verma, and Neetika (2016) approximately
75% of the world labour force is living in developing countries but only between 5-
10% have access to occupational health services and therefore the presence of
hazards in the work place due to factors such as dust, heat stress, noise, toxic
chemicals, and dangerous machines which leads to huge burden of work-related
injuries, death and diseases is very common.
Understanding the inherent correlation between work and employee’s health is
crucial in acknowledging and practicing occupational safety and health.
Occupational safety and health is a multi-disciplinary issue that seeks to protect the
health, safety and the welfare of workers involved in various forms of employment in
order to achieve a safe working environment (Muchangi, 2009). In line with the
International Labor Organization (ILO) and World Health Organization (WHO)
regulations, ensuring occupational safety and health is a fundamental right of
workers around the world (Boateng & Amedofu, 2004).
Kenya has made significant progress towards attainment of occupational safety and
health particularly through enactment of the Occupational Health and Safety Act No.
15 of 2007 and the promulgation of the new Constitution of Kenya (Mitullah &
Wachira, 2011). Despite the presence of institutional and legal frameworks
addressing work related safety and health issues, workers in many sectors, including

2
manufacturing industries, especially flour milling, remain highly vulnerable to
occupational health hazards and risks.
The workers in the agricultural industry are highly exposed to hazards in their work
environment, such as dust, unfavourable microclimatic conditions, excessive noise
and insufficient light. In addition, there are numerous safety and health hazards
associated with grain handling operations, among them suffocation and falls are the
two leading causes of deaths. Other hazards include fires, explosions, electrocutions,
and injuries from improperly guarded machinery. Exposures to grain dust and
associated airborne contaminants can also occur; such contaminants include moulds,
chemical fumigants, and gases associated with decaying and fermenting silage
(Ijadunola, et al., 2004).
The hazardous work operations are not identified and therefore no measures are put
in place to ensure that the workers are not injured. Between 2005-2008, Health
Safety Executive (HSE, 2006) averaged injury incidence rate at 1215 per 100,000
workers. According to Workplace Health and Safety Queensland 2011,
approximately half of these injuries occur while a worker is performing a manual
task (for example lifting, moving, or putting down objects) (McCunney, 2007).
Muchemedzi and Charamba, (2006) define occupational health as a science
concerned with health in its relation to work or working environment. According to
Oxenburgh et al., (2005), the health and safety of all employees is closely linked to
the company’s productivity in all workplaces. In most cases, Occupational Safety
and Health (OSH) is largely measured by negative outcomes such as workplace
injury and illness but these measures have a shortfall, for instance, a low incidence of
injury does not necessarily mean that adequate safety systems and controls are in
place (HSE, 2006). At some flour milling factories, attention is mainly on negative
outcomes. As long as there are no serious accidents, occupational safety and health
policies and practices are not carried out fully. As a result, threats to employees’
safety are not eliminated in time because accident-prone areas are not recognized and
taken care of before accidents occur. It is therefore important that the conditions that

3
pose threat to the safety and health of the workers are identified and addressed
(Oxenburgh et al., 2004).
1.2 Statement of the problem
Iraj, et al., (2011) argues that the worker spends about one third of their time at the
workplace. During this time, they are exposed to various hazards including noise,
dust, vibrations, heat and harsh chemicals among others. The Occupational Safety
and Health Act (GOK, 2007) has various provisions for the safety, health and welfare
of workers and all persons lawfully present at workplaces in Kenya. Despite the fact
that the Government of Kenya has put in place legislations to safeguard the safety
and health of workers, the number of accidents at workplaces has continued to
increase (Muchiri, 2008). For instance the number of accidents between 2001 and
2007 in Nairobi was 1,035 accounting for 12,941 man days lost. This high number of
accidents and the attendant losses is attributed to failure to control workplaces
hazards and noncompliance with the legal and regulatory framework regarding
Occupational Safety and Health (OSH) (Muchiri, 2008).
Workers at flour milling companies are exposed to considerable hazards like manual
handling, inhalable dust, noise, working in confined spaces mainly silos as well as
slip, trip and falls. Workers normally load and offload long trucks without using any
lifting aids; most of those workers involved in loading and offloading are paid on
piece work. They experience occupational health and safety problems, with high
rates of injuries, fatalities and incapacitation due to lack of health and safety, or lack
of implementation of OSH policy (Ndirangu & Namusonge, 2014). Despite this, the
researcher did not find systematic studies that have been carried out to investigate the
occupational safety and health hazards in this industrial sector in Kenya, Most
research focused on outcomes such as productivity, profit, and turnover and worker
satisfaction. The study sought to find out the status of the occupational safety and
health hazards in flour milling companies in Nairobi. Furthermore, health and safety
programmes in many industries are poorly implemented raising serious concerns on
the issues of staff health and safety.

4
1.3 Justification
Most flour milling companies aim at maximum productivity from their workforce
and equipment. There is however a number of occupational hazards affecting staff in
the production departments at flour milling companies in Kenya leading to decreased
employee productivity. As the duration of a person’s employment in an unpleasant
environment increases his/her fitness is compromised leading to reduced
performance due to absenteeism as workers seek treatment, increased spending by
the company on treatment of workers injured in the course of duty and increased
insurance premiums.
Nairobi is home to various major industries and small scale industries in and around
the city. These industries are majorly involved in small-scale consumer goods
(plastic, furniture, batteries, textiles, clothing, soap, cigarettes, flour), agricultural
products, horticulture, oil refining, aluminium industries, steel industries, lead
industries, cement industries and motor vehicle assemblies. Industrial growth has in
turn resulted to creation of employment opportunities for many people. Therefore
there is need to examine the status of the occupational safety and health hazards by
flour milling industries in Nairobi to ensure that the health and safety of workers is
safeguarded.
1.4 Research questions
1. What are the main activities that constitute the occupational safety and health
hazards in milling companies in Nairobi?
2. What is the nature of injuries in flour milling companies in Nairobi?
3. What are the causes of the identified injuries and their control measures?
1.5 Objectives
1.5.1 Main objective
The main of the study was to determine the status of the occupational safety and
health in flour milling companies in Nairobi

5
1.5.2 Specific objectives
1. To establish the main activities that constitute the occupational safety and
health hazards in flour milling companies in Nairobi Kenya
2. To establish the nature of injuries in flour milling companies in Nairobi
Kenya
3. To determine the causes of the identified injuries and their control
measures in flour milling companies in Nairobi Kenya
1.6 Hypothesis of the study
1.6.1 Null hypothesis (H0)
There are no significant occupational health and safety hazards associated with flour
milling companies in Nairobi Kenya.

6
1.7 Conceptual framework
Dependent Variables Independent Variable
Figure 1: Conceptual frame work
CONTROL MEASURES
Guarding of machines
Provision of lifting aids
Provision of PPEs
Good housekeeping
OCCUPATIONAL SAFETY
AND HEALTH HAZARDS
Unguarded machine moving
parts
High noise levels
Dust
Glare
Slippery floors
INJURIES
Cuts
Dislocations
Fractures
Amputations
STATUS OF
OCCUPATIONAL
SAFETY AND HEALTH IN
FLOUR MILLING
COMPANIES,

7
CHAPTER TWO
LITERATURE REVIEW
2.1 Introduction
Flour milling can trace it origins back to prehistory, but the modern systems known
as gradual reduction flour mills have only been developed over the last 200–300
years. Grain handling facilities, as defined by the Occupational Health and Safety
Administration (OSHA) Grain Handling Standard, include: grain elevators, feed
mills, flour mills, rice mills, dust pelletizing plants, dry corn mills, soybean flaking
operations, and the dry grinding operations of soy cake. The modern flour-milling
process according to ASABE, (2007) can be separated into six very distinct areas:
1. The break system – the first grinding stages for the wheat;
2. Scalping, grading, dusting – the separation of the ground materials after each of
the break rolls;
3. The scratch system – the final removal of bran from the system, although sizing
systems are more commonly used in modern plants;
4. Purifiers – the cleaning up of semolina stocks (endosperm fragments) by grading
and aspiration to remove bran fragments;
5. The reduction system – the reduction of semolina to flour;
6. Flour dressing – the separation of flour from the other materials (mainly bran).

8
Figure 2.1: A process lay out of a typical flour mill
(Source: ASABE, 2007)

9
2.2 Theoretical Review
2.2.1 Causes of accidents
Muchemedzi and Charamba (2006) explain that accidents do not arise from a single
cause but from a combination of factors which act simultaneously. A potentially
unsafe situation does not cause an accident until someone is exposed to it. Accidents
are caused by the result of unsafe acts or practices (the human element that results
from poor attitudes, physical conditions and lack of knowledge or skills to enable
one to work safely). They are also caused by the result of unsafe conditions of
equipment or materials.
According to HSA (2006) accidents and illness can have a widespread impact on
individuals and their families. Many will find that their working life is significantly
affected: they may be unable to return to work, need a change of job or role to
accommodate new restrictions or be conscious that they now approach their work
with a level of caution and deliberation not previously in evidence; many will also
experience longer-term physical problems. There are also immediate and longer-term
economic consequences, both in terms of loss of income (most evident in the
construction sector) and the need for extra expenditure associated with the accident
or illness. When it results in permanent disability, the consequences are disastrous
for both the victim and the company. The victim loses his earning capacity and
ability to enjoy a normal active life, and the society and company are deprived of
his/her skill and contribution to production.
2.2 Causes of occupational accidents
Muchemedzi and Charamba (2006) established that the majority of accidents (98%)
do not just happen, instead people who perform unsafe acts and create unsafe
conditions cause them and therefore accidents are preventable. Katsuro (2010) found
out that most food factories do not abide by set OSH regulations. Most accidents are
so minor that they have no visible injury or damage. Taking care of these minor
problems results in a reduction or elimination of the major ones. There are four

10
factors that explain the link between productivity and employees’ overall health and
safety (Katsuro et.al., 2010): the need for more innovative ways to reduce the high
rates of workplace injury and illness; the pressure to reduce the social and economic
costs of injury and illness, particularly compensation costs; the need to improve
labour productivity without employees needing to work longer hours and/or taking
on more work; the need to offer good working conditions as an enticement to recruit
and retain skilled workers in a tight labour market.
According to Nadine and Jennifer, (2013) the primary beneficial impact of
occupational health and safety on productivity is reduced absenteeism. the health
risks and failure of employees to participate in fitness and health promotion
programmes are associated with higher rates of employee absenteeism. There is need
for much emphasis on the employer’s participation in ensuring that OSH
programmes and policies are existent. If these OSH practices are set, it is more likely
that the worker participates in order to preserve his/her life (Nadine & Jennifer,
2013). However, absenteeism may be encountered but may be completely neither
unjustified on medical grounds nor attributable to unsafe conditions or hazardous
events in the workplace. It is difficult to demonstrate conclusively the extent to
which business prosperity benefits from good health and safety or on the contrary, to
say that prosperous businesses have good health and safety because they are able to
afford it (Health and Safety Executive [HSE], 2006). However, based on available
evidence, the Occupational Health and Safety Reports argue that there is clearly a
vicious circle in that a healthy and happy workforce is more productive, leading to
increased investment in health and safety to reduce accidents, which in turn leads to
further productivity gains.
The HSE, (2006) further explains that genuine productivity gains can be realized by
those businesses that invest in high performance health and safety practices.
However, the HSE (2006) also recognizes that there is need to have a positive
attitude by many organizations if they are to move on from simply attaining
minimum legal compliance toward implementing the best practice of OSH. For those
organizations that make the transition, the rewards are well worth the effort. In other
words, when an organization is committed to OSH best practice and implements it in

11
a properly managed manner, the result is a win-win situation that benefits both the
workforce and the organization for which they work. There is need for a workplace
improvement in terms of occupational health and safety for the benefit of the
employer and the employee in order to increase productivity.
Occupational safety and health hazards are classified into six categories; these are
physical, chemical, mechanical, biological, ergonomic and psychological. (GOK,
2007, International Labour Organisation [ILO], 2001) All these hazards negatively
affect employees’ OSH that resultantly causes low productivity. For example,
psychological hazards include monotony which causes mental stress and decreases
productivity (Muchiri, 2008).
The Directorate of Occupational Safety and Health Services, Kenya has data on the
sound levels and the duration of time that an employee should be exposed to the
noise. This implies that the employer should be aware of the noise intensity that is
produced during plant operations and should protect the employee from noise. Most
workers in the flour milling companies are not protected from that noise especially
the ones in the milling section. This exposure to loud noise lowers employee morale
and productivity. Most OSH statutory instruments state that it is the employer’s
obligation to provide a safe working environment for the workers. These regulations
further clarify that it is the duty of the employer to disclose accident statistics to
DOSHS and Workers and to keep appropriate records. An employee should be
informed of the dangers that are eminent in their work. These statutes, further,
stipulate that this information should be posted on areas that all workers can see, for
example notice boards. Workers commonly refuse to work because of the health risk
involved in their work and this can be used as an indicator of poor OSH in the
workplace.
In most developing countries according to Mengesha and Bekele (2005), workers
rarely consider safety of their jobs due to the high levels of unemployment in such
countries (>70%). Since income is hard to earn and there are no efficient economic
security social nets, a worker opts to work in any environment that is risky than
losing a precious job. Therefore, data on stop-work, because of an unhealthy

12
situation, is virtually nil in the developing countries. McCunney (2007) demonstrates
that the health risks and failure of employees to participate in fitness and health
promotion programmes are associated with higher rates of employee absenteeism.
McCunney’s (2007) contribution can only be valid if the fitness programmes are in
place. There is need for the employer’s participation in ensuring that OSH
programmes and policies are existent. If these OSH programmes are in place, it is
more likely that the worker participates in order to preserve his/her life. Towers
(2003) explain that it is important to empower, educate and persuade workers to
exercise their powers in the protection of their OSH. Employees are left to form their
own OSH committees which are not taken seriously by the management.
2.2.2 Dust
2.2.2.1 Dust in flour mills
"Flour dust" refers to dust coming from finely milled or otherwise processed cereal.
Hypersensitivity reactions as well as irritant symptoms caused by flour dust
constitute a well-recognized occupational problem world-wide (Neitzel, 2004). Most
data on flour dusts have been derived from studies on wheat (Triticum sp.) and rye
(Secale cereale), and to a lesser extent on barley (Hordeum sp.) and oats (Avenea
sativa). From the point of view of hazard assessment, all these taxonomically related
cereals, belonging to the family Poaceae, are relevant. The allergens they contain
have been shown to cross-react with each other, indicating that these allergens are
common to different species. Flour from corn or maize (Zea mays) is not included in
the present risk assessment, as maize flour seems to present a low allergenic potency
and less cross-sensitization with other cereal grain flours(Parker et al 2007). Other
sensitizing flour dusts from non-cereal grains, such as soy (Glycine hispida) and
buckwheat (Fagopyrum escalentum) are also excluded for taxonomical reasons. The
flour dust in the bakery industry may contain several other non-cereal components,
so called dough-improvers, such as a variety of enzymes (e.g. α-amylase of various
origin, malt enzymes, cellulase, hemi-cellulase, xylanase), chemical ingredients (e.g.
preservatives, bleaching agents, antioxidants), flavourings, spices, and other
additives (e.g. baker’s yeast, egg powder, sugar) as well as contaminants such as

13
storage-related mites and microbes (Neitzel, 2004). Several of these components are
sensitizers. α-Amylase is an important sensitizer small amounts of which (0.1 to 1.0
mg/g flour) are naturally present in wheat. Α-Amylase may be of different origin
which may determine its 2 allergenic properties (Vanhanen 2000); most commonly it
is derived from fungal organisms such as Aspergillus oryzae or A. niger. The dose-
response data used for the present risk assessment are derived from studies on cereal
flour dust sensitization, and therefore this recommendation applies to flour dust from
wheat and other cereals (Scoel, 2008).
2.2.2.2 Grain dust
Grain dust is a complex mixture of husk particles, cellulose hairs and spikes, starch
granules, spores of fungi, insect debris, pollens, rat hair, and approximately 5 percent
mineral particles. The mean particle size of the airborne dusts may be less. Meo and
Al-Drees, (2005) studied lung function in forty-six male flour mill workers and a
similar number of male control subjects in Pakistan. All participants were non-
smokers with the age range from 18 to 65 years. The subjects were matched for age,
height, weight and socioeconomic status. The results showed that the flour mill
workers in Pakistan, like grain workers elsewhere, are at an increased risk of
developing occupationally related pulmonary function impairments. The results
suggest that there is an urgent need to improve dust control measures and the health
status of flour mill workers.
2.2.2.3 Physical and biochemical properties of dust
Wheat is the primary cereal grain used in bread making. Seeds are composed of
endosperm (85%), husk (13%) and germ (2%). The milling process separates the
endosperm from husk and germ and reduces the particle size of the endosperm.
Wheat flour is made from the endosperm. This wheat flour contains starch and four
different groups of proteins (water soluble albumins, globulins, prolamins (gliadin),
and glutelins (glutenin)). Both gliadins and glutenins form viscous complexes, called
gluten, which determine the structure and texture of bread to a great extent. The
proteins present in flour dust are potential allergens. The strongest allergic potency

14
has been observed with water-soluble albumin fractions in vitro (Baldo & Wrigley
1978), but the allergic potency of gliadin, globulin and glutenin protein fractions
should not be ruled out (Walsh et al., 2003).
The number of potent dust flour allergens from these four protein fractions is large.
In one study, 40 different allergens were identified by crossed immuno-
electrophoresis (Boateng and Amedofu, 2004). Burdorf et al. (1994) reported that
each patient showed an individual IgEbinding pattern with 4 to 50 different protein
spots in the immunoblots. The IgEantibodies in sensitized reacted with several of
these flour allergens, although individual reaction profiles showed large variability
(Agata & Rafał, 2015). Airborne flour dust particle sizes have been measured by
several investigators. Lillienberg and Brisman (1994) showed a bimodal distribution
of aerodynamic diameters of flour dust, using an IOM dust spectrometer. The
smallest particles were around 5 μm, and the bigger ones around 15-30 μm. Over
50% of the particle mass had an aerodynamic diameter over 15 μm. Using the IOM
personal inspirable aerosol spectrometer, Burdorf et al. (1994) estimated that the
thoracic fraction contributed 39% to the total mass of inhalable dust. The respirable
fraction (particles ≤4) amounted to 19%. Smith, Parker and Hussian, (2000)
measured that approximately 9%, 52% and 20% of the airborne flour proteins were
borne on particles 6 μm diameter in the bakery dough-brake, bakery roll-production
and in the flour mill-packing areas, respectively. The investigators concluded that in
dusty areas up to 20% of the airborne flour particles are of a diameter (≤5um) likely
to allow them to be deposited in the bronchial airways and alveoli.
2.2.3 Noise
Noise is considered as any unwanted sound that may adversely affect the health and
wellbeing of individuals or populations by causing disturbance of man’s work, rest,
sleep, and communication; or by damaging his hearing and evoke other
psychological, physiological, and possibly pathological reactions. It can also be
considered as a wrong sound, in the wrong place at the wrong time. Similarly, noise
pollution is defined as unwanted electromagnetic signal that produces a jarring or

15
displeasing effect and which interferes with human communication, comfort and
health (Bhatia, 2001). Hence from the acoustics point of view, sound and noise
constitute the same phenomenon of atmospheric pressure fluctuations about the mean
atmospheric pressure; the differentiation is greatly subjective. What is sound to one
person can very well be noise to somebody else (Nelson & Schwela, 2001).
In the industrial premises, it is important to remember that the objective of noise
control is not to reduce noise for its own sake, but for the sake of the receiver,
usually the human ear. Hence the straight forward approach recommended to be used
for noise control is the source-path-receiver concept (Liu, 1999).
2.2.3.1 Effects of noise
Negative effects of noise on human beings are generally of a physiological and
psychological nature. Hearing losses are the most common effects among the
physiological ones. It is possible to classify the effects of noise on ears in three
groups: acoustic trauma, temporary hearing losses and permanent hearing loss
(Nadine & Jennifer, 2013). Blood pressure increases, heart beat accelerations,
appearance of muscle reflexes, sleeping disorders may be considered among the
other physiological effects. The psychological effects of noise are more common
compared to the physiological ones and they can be seen in the forms of annoyance,
stress, anger and concentration disorders as well as difficulties in resting and
perception (Kumar, Verma, & Neetika, 2016).
The health effects of noise exposure can also be classified as non-auditory and
auditory. Non-auditory effects include stress, related physiological, behavioral
effects and safety concerns. Auditory effects include hearing impairment resulting
from excessive noise exposure. Noise-induced permanent hearing loss is the main
concern related to occupational noise exposure. The main auditory effects include
acoustic trauma that refers to sudden hearing damage caused by short burst of
extremely loud noise such as a gun-shot that rupture the tympanic membrane or
dislocate the ossicular chain and results in permanent hearing loss, tinnitus (ringing

16
or buzzing in the ear) and temporary hearing loss (Bhatia, 2001). Noise is not the
only industrial hazard to hearing.
Noise induced temporary threshold shift (NITTS) occurs immediately after exposure
to a high level of noise. There is gradual recovery when the affected person spends
time in a quiet place, however complete recovery may take several hours. Permanent
hearing loss, also known as noise induced permanent threshold shift (NIPTS),
progresses constantly as noise exposure continues month after month and year after
year. The hearing impairment is noticeable only when it is substantial enough to
interfere with routine activities. At this stage, a permanent and irreversible hearing
damage has occurred. Noise-induced hearing damage cannot be cured by medical
treatment and worsens as noise exposure continues. Generally, noise-induced hearing
loss (NIHL) is a cumulative process which comes as a result of both high levels of
noise and exposure times over a worker’s work history (Nadine & Jennifer, 2013).
In the workplace, hearing loss can be caused by blunt or penetrating head injuries,
explosions, and thermal injuries such as slag burns sustained when a piece of
welder’s slag penetrates the ear drum. All these conditions are treatable and
reversible. Sensori neural hearing loss results from deterioration of the cochlea,
usually due to loss of delicate hair cells from the organ of corti. Among the many
common causes of sensory hearing loss are continuous exposure to noise in excess of
85 dB, blunt head injury and exposure to ototoxic substances. Impulsive noises, such
as gunfire, appear to be particularly damaging (Nelson & Schwela, 2001).
2.2.3.2 Noise control in industrial premises
As far as industrial setting is concerned, the most effective approach to noise control
is to redesign or replace noisy equipment. If this is not possible, significant
reductions in noise levels can be achieved by structural and mechanical
modifications or the use of mufflers, vibration isolators and noise protection
enclosures (Nelson & Schwela, 2001). The best way of controlling noise at its source
is to replace noisy machines with quieter machines or trying to reduce noise by
redesigning the machine after purchase. Substituting a quieter process, machine, or

17
tool is another method of controlling noise. For instance welding is a quieter
substitute for riveting, drilling for punching, pressing and rolling for forging. Besides
engineering controls noise reduction and isolation can be approached through
machine mounting or by architectural means. If machines are spaced adequately
apart noise levels can be within acceptable limits.
Noise control in a transmission path can be achieved by absorbing the sound along
the path or by deflecting the sound in some other direction by placing a reflecting
barrier in its path. Using the absorptive capacity of the atmosphere is a simple and
economical method of reducing the noise level. If enough distance is available
between machines, the amount of noise produced becomes minimized (Kumar,
Verma, & Neetika, 2016). The distance from a point source is doubled; the sound
pressure level is lowered by 6 dB. If a soft, spongy material is placed on the walls,
floors and ceiling the reflected sound is diffused and soaked up (absorbed). Sound-
absorbing materials such as acoustical tile, carpets, and drapes placed on ceiling,
floor, or wall surfaces can reduce the noise level (Nelson & Schwela, 2001). Placing
physical barriers, screens, or deflectors in the noise path is an effective way of
reducing noise transmission. Sometimes enclosing a noisy machine in a separate
room or box is more practical and economical than quieting it by altering its design,
operation, or component parts.
As an administrative approach of noise regulation for the workers, the amount of
continuous exposure to high noise levels must be limited. For hearing protection,
scheduling noisy operation for short intervals of time each day over several days is
preferable to a continuous eight-hour run for a day or two (Neitzel, 2004). In
industrial or construction operations an intermittent work schedule benefits not only
the operator of the noisy equipment but also other workers in the vicinity. A personal
hearing protection devise is any devise designed to reduce the level of sound
reaching the ear drum. Ear muffs and ear plugs are the main types of hearing
protectors. Molded and pliable earplugs, cup-type protectors and helmets are
commercially available as hearing protectors. Such devices provide noise reductions
from 15 to 35 dB (Liu, 1999).

18
2.4 Legal Framework
2.4.1 Managing OSH
According to ILO (2001), Occupational safety and health, including compliance with
the OSH requirements pursuant to national laws and regulations, are the
responsibility and duty of the employer. The employer should show strong leadership
and commitment to OSH activities in the organization, and make appropriate
arrangements for the establishment of an OSH management system. The system
should contain the main elements of policy, organizing, planning and
implementation, evaluation and action for improvement, as shown in figure 2 below.
Figure 2.2: Main elements of the OSH management system (ILO, 2001).

19
2.3.2 Occupational Health and Safety in Kenya
The National Profile on Occupational Health and Safety (ILO, 2013) recognizes the
Constitution of Kenya as the supreme law, and lays the foundation for all other laws.
Although it is not specific on OSH, it provides, in the Bill of Rights, the right for
every citizen to fair labour practices, reasonable working conditions, and a clean and
healthy environment. (Constitution of Kenya, 2010 Articles 69,)
According to the National Profile on Occupational Safety and Health (2013), the
history of OSH in Kenya dates back to 1950, with the introduction of the Factories
Act (GOK, 1951 cap 514). In 1990 this Act was amended to the Factories and Other
Places of Work Act, to enlarge its scope. The Occupational Safety and Health Act
(OSHA) and the Work Injury Benefits Act (WIBA) were enacted in 2007, and are
now the principal laws that govern OSH in the country.
In Kenya, OSH is managed by the Directorate of Occupational Safety and Health
Services (DOSHS). DOSHS is the designated national authority for collection and
maintenance of a database, and for the analysis and investigation of occupational
accidents and diseases, and dangerous occurrences. The purpose of OSHA, 2007, is
to secure the safety, health and welfare of people at work, and to protect those not at
work from risks to their safety and health arising from, or in connection with, the
activities of people at work.
The purpose of WIBA, 2007, is to provide compensation to employees for work-
related injuries and diseases contracted in the course of their employment, and for
connected purposes.

20
2.3.3 Subsidiary laws that deal with OSH issues
2.3.3.1 The Factories and Other Places of Work (Safety and Health Committees)
Rules, L.N. No. 31/2004
These rules apply to workplaces with 20 or more regular employees. They require
the occupier to set up safety and health committees with equal representation of
management and workers.
The functions of the committee include conducting safety and health inspections,
investigating accidents, and making recommendations to the occupier on
improvements for the promotion of a safe and healthy working environment.
2.3.3.2 The Factories and Other Places of Work (Noise Prevention and Control)
Rules, L.N. No. 25/2005
These rules apply to workplaces where activities result in noise levels that could
impair or damage employees’ hearing ability. They specify the permissible levels of
noise, and require the occupier to carry out noise measurements, develop a noise
prevention programme to reduce noise levels, and provide hearing protection.
2.3.3.3 The Factories and Other Places of Work (Fire Risk Reduction) Rules,
L.N. No. 59/2007
These rules apply to workplaces, and require the occupier to put appropriate
measures in place to prevent the occurrence of fires within their premises. They
address the safe handling, storage and transportation of flammable substances. They
also require the occupier to provide means of evacuation, fire detection systems,
firefighting equipment, and firefighting teams.
The rules prescribe annual fire safety audits, the formulation of a fire safety policy,
and training of workers on fire safety issues.

21
2.3.3.4 Factories and Other Places of Work (Hazardous Substances) Rules, L.N.
No. 60/2007
These rules apply to workplaces where workers are likely to be exposed to hazardous
substances. They require the occupier to prevent employees from exposure to such
substances by putting various control measures in place, or, where these are not
reasonably practical, to ensure that personal protective equipment (PPE) is provided.
They prescribe occupational exposure limits (OEL) for hazardous chemical
substances, safe handling, use and disposal of hazardous substances.
2.3.3.5 The Factories and Other Places of Work (Medical Examination) Rules,
L.N. No. 24/2005
These rules apply to workplaces where employees are engaged in occupations that
expose them to hazards that might harm their health. They specify occupations
requiring medical examinations, and the types of examination of employees at the
employer’s cost.
2.3.3.6 The Factories (First Aid) Rules, L.N. No. 160/1977
These Rules apply to workplaces, and require the occupier to put in place appropriate
measures to ensure that those injured at work receive necessary medical attention.
The Rules specify the contents of the first-aid box in accordance with the number of
workers, and the training of first-aiders.
2.3.3.7 The Factories (Eye Protection) Rules, L.N. No. 44/1978
These rules apply to workplaces, and require the occupier to protect their employees
against exposure that is injurious to the eyes.
2.3.3.8 The Factories (Electric Power Special) Rules, L.N. No. 340/1979
These rules apply to the generation, transformation, conversion, switching, control,
regulation, distribution and use of electrical energy in workplaces. They require the
occupier to put appropriate measures in place to eliminate electrical hazards within

22
their premises by the insulation of conductors, and by the provision of circuit
breakers and personal protection.
2.4 Previous Related Studies
Flour dust has been associated with several health related problems. In a study by Iraj
et al (2011) on wheat flour mills in Iran, they confirmed that workers at flour packing
workstations were exposed to an appreciably higher level of respirable dusts than
others (p<0.05) and that workers such as packers, sweepers and sift operators who
were directly exposed to flour inhaled more flour dusts than others. Zuskin et al.
(1994b) showed that most respiratory symptoms in a group of confectionery workers
were caused by irritation of the respiratory tract by flour dust inhalation.
An investigation by Agbola (2012) on the impact of health and safety management
on employee safety at Ghana Ports Authority revealed that there are poor health and
safety management practices, poor training on safety, lack of information on
dangerous chemicals and hazardous materials, lack of monitoring and enforcement of
safety rules as well as essential safety equipment. On the contrary, Yiquan et al
(2012) noted that after developing and implementing a new framework to cultivate
good safety culture in workplaces, Singapore saw a drop in workplace fatalities
between 2004 and 2010 from 4.9% to 2.2% per 100,000 workers.
A study by Truchon and Fillion, (2000) to establish the role of psychosocial risk
factors in work-related low back pain, concluded that both lifting and awkward
postures were important contributors to the risk of low-back disorder. However,
studies done in India by Saiyed and Tiwari (2004) does not concur with the above
observation in that when transferring raw material (grains) from silos to the process
area, the transportation is mechanically operated and automatic. So the hazard of
suffocation in the grain area while emptying or shifting the grains was eliminated.
O’Toole (2002), conducted an employee safety perception survey over a 45 month
period at a Concrete producer within the United States of America. The study found
that leadership commitment to safety generated the strongest positive perception and
that this perception was closely associated with a reduction in the workplace injury

23
rate. A supervisor as the immediate hierarchical position for the worker plays a
pivotal role in a company’s health and safety practices. Most of the safety procedures
and monitoring means, which are formulated by the senior management, are usually
implemented by supervisors. Nelson and Schwela (2001), found out that when
supervisors engage in safety-promoting behaviour’s, employees perceive a positive
safety climate and get more involved in appropriate safety behaviour’s thus avoiding
more injuries and pain, due to increased awareness and focus on safety. Employees
who observe their leaders behaving safely at work will more likely behave in a safe
manner, while regarding their leaders as role models (O’Toole, 2002).
In a case of Kenya research done by Ndirangu & Namusonge (2014), it established
that attitude, leadership, motivation and organizational culture were significant
factors affecting the implementation of occupational safety and health at Kenya
vehicle manufacturers. Further, a study by Muchangi (2009), revealed organization
culture, structure, and resistance were the major factors affecting the successful
implementation of occupational health and safety strategies at East African Portland
Cement Company limited. Lukoko, Chege and Musiega (2014) analyzed the impact
of occupational safety and health practices on employee performance at Mumias
Company. Their study revealed that occupational hazards affect job performance;
this was attributed to high levels of ignorance on occupational hazards at the
workplace.

24
CHAPTER THREE
MATERIALS AND METHODS
3.1 The Study design
A descriptive cross sectional study design was employed for this study and since the
research was a fact finding survey, this type of research design according to
Chandran, (2004) is the most recommended. The descriptive design was used since it
ensures complete description of the situation as it is, making sure that there is
minimum bias in the collection of data and to reduce errors in interpreting the data
collected. The design also provides a detailed and highly accurate picture of the
situation that can be very useful in literature review (Cooper & Schindler, 2008).
3.2 Study area and Population
The study was carried out at selected flour milling companies in Nairobi County,
Kenya. Most of the companies under investigation were based in Nairobi’s industrial
area in Kenya. According to the DOSHS, there are more than 25 registered milling
companies employing more than 2,000 workers within the country. Only eleven of
the flour mills were in Nairobi. According to DOSHS, these eleven companies
employ a total of about 1,600 workers who were considered in the study. The milling
companies in Nairobi were conveniently chosen for the study due to limitation of
resources. All the eleven flour milling companies were coded since there actual
names had been withheld for confidentiality, were included in the study. Workers in
the milling companies were targeted for this study and every worker had an equal
chance of being included in the study. The management team which comprise of
managers, supervisors and safety and health officers were targeted for category one.
The second category included the general workers in different departments such as
loaders, millers, packers in the packaging unit, workshop workers and the drivers.

25
Figure 3.1: Map of Kenya
Source: Kenya Bureau of Statistics, 2013
Figure 3.2 A Map of Nairobi county
Source: Kenya Bureau of Statistics, 2010

26
3.4 Sample size determination
Estimation of sample size using Krejcie and Morgan (1970) was employed.
s= X 2NP (1− P) ÷ d
2 (N −1) + X
2P (1− P)
= 3.841 x 1600 x 0.5 (1-0.5)
0.052
(1600-1) +3.841 x 0.5(1-0.5)
= 1536.4
3.9975+0.96025
=310
s= required sample size.
X2 = the table value of chi-square for 1 degree of freedom at the desired confidence
level (3.841).
N = the population size (1600).
P = the population proportion (assumed to be .50 since this would provide the
maximum sample size).N
d = the degree of accuracy expressed as a proportion (.05).
310 employees were sampled to participate in this study.
3.5 Sampling method
The eleven milling companies in Nairobi were sampled for this study. Since the
companies employ different number of employees, proportionate to size sampling
was used to determine the number of respondents from each company as shown in
the Table 1. Number of respondents to participate from each company was
determined by dividing the number of workers in each company by the total number
of workers in the sampled flour milling companies (population size-1,600) multiplied
by the sample size (310)

27
Table 3.1: Flour Millers in Nairobi
Code Total No. of
Workers
No. of Management
sampled
No. of
General
Workers
Total No.
sampled
FMC 1 105 3 17 20
FMC 2 129 4 21 25
FMC 3 86 3 14 17
FMC 4 281 12 42 54
FMC 5 76 3 12 15
FMC 6 25 2 3 5
FMC 7 320 17 45 62
FMC 8 28 2 3 5
FMC 9 98 4 15 19
FMC 10 302 15 44 59
FMC 11 150 6 23 29
TOTAL 1600 71 239 310
The flour milling companies were clustered in terms of departments/units and,
simple random sampling method was used to select the study participants. The
clusters were the management team, milling unit, packaging, loading, workshop and
others. The numbers of participants were selected per cluster in order to add up to the
required total sample size depending on the participant’s workload in the respective
clusters.
3.6 Inclusion and Exclusion criteria
3.6.1 Inclusion Criteria
i. Only the flour millers that had been registered with Doshs were included in
the study as they were deemed to have some occupational safety and health
management system which would ensure the study achieves its objectives.

28
ii. Only workers who had worked in the milling companies for more than six (6)
months were included in the study, this was because they were deemed to
have more knowledge and experience with regards to exposure to hazards in
the flour mill companies.
3.6.2 Exclusion Criteria
i. Flour milling companies that had not been registered by the DOSHS were not
involved in the study.
ii. Workers who had worked in the milling companies for less than six (6)
months were not included in the study as they were deemed to have less
knowledge and experience with regards to exposure to hazards in the flour
mill companies.
3.7 Instruments of data collection
3.7.1 Observation
The study used observational method as one of the data collection tool. The
following parameters were observed using an observation checklist and the
conditions were recorded; the general condition of the machines, the work place
layout, housekeeping within the industry, worker behaviour and movement within
the industry, lighting and general ventilation within the industries. The observed
safety and health issues were classified as either satisfactory or unsatisfactory and
required action
3.7.2 Questionnaire survey
Questionnaires were used to collect data in the flour milling companies. Two
different questionnaires were prepared one for the management team and another one
for the general workers. The researcher used the drop and pick method of

29
administering questionnaires to the respondents. This method was appropriate since
it encouraged prompt responses from the respondents.
3.7.3 Review of existing records
The researcher reviewed documents which include; the health and safety audit
reports, health and safety risk assessment reports, noise survey reports, dust survey
reports, training records, accidents and occupational diseases records with the main
aim of establishing the safety and health hazards in the milling companies.
3.8 Validity of Instruments
Validity in this study was ensured by including only those questions that helped
achieve the set objectives in the questionnaire and carrying out very objective
interviews devoid of any form of personal bias.
3.9 Reliability of instruments
A pilot study was done to ensure reliability of the research instruments.
3.10 Data Management and Analysis
The researcher used descriptive statistics for the study. Descriptive statistics
(frequency and cross tabulations) were used to generate frequency tables. The
principal investigator reviewed the data collection tools regularly for completeness.
Data backup was done by using flash disks, CDs, DVDs and other forms of storage.
Files containing the data were password encrypted for data safety. Data cleaning for
errors and outliers was done before analysis. Data was stored in electronic storage
devices; DVDs, USB, and files containing the data were password encrypted.
Quantitative data analysis was aided by SPSS (Statistical Package for Social
Sciences) Version 17 to produce mean score, percentages and frequencies.
Percentages are the most widely used and understood standards proportions. (Kangu,
Onwong’a, Mamati, & Osongo, 2010). SPSS Version 17 has got descriptive statistics

30
features that assist in variable response comparison and gives a clear indication of
response frequencies (Mugenda, 2008) or SPSS Statistics 17.0 is a comprehensive
system for analyzing data. SPSS Statistics can take data from almost any type of file
and use them to generate tabulated reports, statistical analyses (Marija, 2008).
3.11 Ethical Considerations
Permission to carry out the study was sought from the Jomo Kenyatta University of
Agriculture and Technology and the flour milling industries where the study was
done. Consent of all the human participants were sought from the participants. The
objective of the study was explained to the companies’ management and the study
participants. Questionnaires were assigned unique codes and the results of each
individual questionnaire were kept in strict confidence. Participation in the study was
voluntary and the participants were given an option of withdrawing from the study at
will. A case where a participant withdrew from the study his or her data was not used
in the final analysis of the results.

31
CHAPTER FOUR
RESULTS AND DISCUSSIONS
In this chapter data obtained from the observation, questionnaires and review of
secondary data was examined, analysed and a presentation of the finding done.
4.1 Demographic Characteristics of the respondents
4.1.1 Response rate
The study's target population was 310 respondents. However, only 257
questionnaires were returned duly filled in, this makes a response rate of 82.9% as
shown in Table 4.1 below. This response rate is acceptable and representative and
conforms to Mugenda and Mugenda (2003) stipulation that a response rate of 50% is
adequate for analysis and reporting; a rate of 60% is good and a response rate of 70%
and over is excellent.
Table 4.1: Response rate
Questionnaires Frequency Percentage
Returned 257 82.9%
Not returned 53 17.1%
TOTAL 310 100
4.1.2 General Workers Characteristics
A total of 257 respondents (71 management staff and 186 general workers) drawn
from 11 selected flour milling companies in Nairobi County participated in the study.
The study focused on staffs who were directly working in the flour mills and their
supervisors/ managers. Regarding respondents gender, 164(88.2%) general workers
were male while 22(11.8%) were female. In terms of education level, 57(30.6%)
workers had completed primary school, 90(48.5%) had secondary school education,
while the rest 39(20.9%) had diploma and above. In terms of work experience,

32
11(5.9%) had up to 1 year of work experience, 88(47.4%) had between 2-3 years of
experience and 22(11.8%) had between 3-5 years of experience while 65(34.9%) had
over 5 years of work experience in their respective flour milling companies.
Table 4.2: Characteristics of the general workers in the study
Years of
experience
Level of education
(%)
0-1 year 5.9 Primary education (30.6)
2 to 3 years 47.1 Secondary education (48.5)
3 to 5 years 11.8 Diploma and above (20.9)
Over 5 years 35.2
Total 100.0
4.1.2 Characteristics of the management staff in the studied flour milling
companies
A total of 71(100%) management staff drawn from the 11 flour milling companies
took part in the study as shown in Table 4.3.
Table 4.3: Managers and their respective flour milling companies
Company (n) (%) Male (%) Female (%)
FMC 1 4 5.6 5.1 6.1
FMC 2 6 8.5 10.3 6.1
FMC 3 5 7.0 5.1 9.1
FMC 4 9 12.7 12.8 12.1
FMC 5 8 11.3 5.1 24.2
FMC 6 2 2.8 1.3 6.1
FMC 7 16 22.5 30.8 3.0
FMC 8 2 2.8 3.8 3.0
FMC 9 8 11.3 12.8 9.1
FMC 10 7 9.9 7.7 15.2
FMC 11 4 5.6 5.1 6.1
Total 71 100.0

33
Of the 71(100%) management workers who participated in the study, 50(70.4%)
were male while 21(29.6%) were female. Figure 4.1 shows the gender distribution of
management staff per company.
Figure 4.1: Management workers’ gender distribution per flour milling
company
Regarding education level, 2(2.8%) of the management staff’s from the flour milling
companies had attained primary level of education, 11(15.5%) had attained
secondary level of education, 39(54.9%) had attained diploma level of education
while the remaining 19(26.8%) had Bachelors degree as their highest education level
attained (Figure 4.2).
Figure 4.2: Management staff educational level

34
Regarding the marital status, 26(36.6%) management staff were single, 43(60.6%)
were married while the divorced and widowed were 1(1.4%) each as illustrated in
Figure 4.3.
Figure 4.3: Marital status of the management staff
Work experience was evaluated and 13(86.7%) management staff who had worked
for 7-12months were working 8 hours per day while 2(13.7%) were working for
more than 8 hour per day in this category. The second category was 13 months to 2
years work experience and 18(81.8%) of the management staff’s this category was
working for 8 hours while 4(18.2%) were working for more than 8 hours per day. Of
those who had worked for more than 2 years, 20(58.8%) were working for 8 hours
per day while 14(41.2%) were working for over 8 hours per day. The p-value
(p>0.05) indicates that there was no statistical significance between work experience
and the average working hours per day (Table 4.4)
.

35
Table 4.4: Work experience and number of working hours per day
Years worked Company
code:
8 hours (%) Over 8 hours (%) Total (%)
7- 12months FMC 1 (2)100.0 (2)100.0
FMC 3 (2)100.0 (2)100.0
FMC 4 (1)100.0 (1)100.0
FMC 5 (3)100.0 (3)100.0
FMC 6 (1)100.0 (1)100.0
FMC 7 (2)75.0 (1)25.0 (3)100.0
FMC 10 (2)100.0 (2)100.0
FMC 11 (1)100.0 (1)100.0
Total (13)86.3 (2)13.7 (15)100.0
13months- 2
years
FMC 1 (2)100.0 (2)100.0
FMC 2 (1)100.0 (1)100.0
FMC 3 (1)100.0 (1)100.0
FMC 4 (3)60.0 (2)40.0 (5)100.0
FMC 5 (3)100.0 (3)100.0
FMC 6 (1)100.0 (1)100.0
FMC 7 (2)100.0 (2)100.0
FMC 8 (1)50.0 (1)50.0 (2)100.0
FMC 9 (1) 50.0 (1) 50.0 (2)100.0
FMC 10 (2)100.0 (2)100.0
FMC 11 (1)100.0 (1)100.0
Total (18)81.8 (4)18.2 (22)100.0

36
Table 4.4 continued…
Years worked Company: 8 hours (%) Over 8 hours (%) Total (%)
Over 2years FMC 2 (4)80.0 (1)20.0 (5)100.0
FMC 4 (3)50.0 (3) 50.0 (6)100.0
FMC 5 (1)100.0 (1)100.0
FMC 6 (1)100.0 (1)100.0
FMC 7 (6)60.0 (4)40.0 (10)100.0
FMC 8 (1)100.0 (1)100.0
FMC 9 (2)33.3 (4)66.7 (6)100.0
FMC 10 (1)50.0 (1)50.0 (2)100.0
FMC 11 (1)50.0 (1)50.0 (2)100.0
Total (20)58.8 (14)41.2 (34)100.0
4.2 Activities that constitute occupational safety and health hazards in the flour
mills
Milling process, carrying out of maintenance works on the machines, loading and
offloading of grains/flour and packing were identified as some of the hazardous
processes in flour milling companies. Regarding the source of hazards in flour
milling companies; 121(65.1%) respondents identified milling process as a
hazardous work activity, 107(57.5%) identified carrying out of maintenance as
hazardous process while 124(66.7%) respondents identified offloading and loading
of grains as an activity causing hazard, respectively. 143(76.9%) respondents
identified workshop activities like welding, grinding, cutting, and 103 (55.4%)
respondents identified packing activities in the flour milling companies as
constituting safety and health hazards at their respective workplaces.
The milling process has rollers which rotate to crush the grains and sifters which
produce high noise levels [>90dB(A)] and vibration which the workers felt could
cause them harm. Maintenance works on machines can cause harm if not properly
carried out especially when done when machines are running. The packing activities
were observed to expose the workers in that section to high dust levels.

37
In 11(100%) of the companies studied, they had installed the state of the art packing
machines which fill and seal the flour bags/packets thereby minimizing the direct
contact of the worker and the flour. In (3)27.3% the flour mills studied, 35% of their
packing of the flour was done manually whereby the workers fill the flour to the bags
and this activity generates a lot of flour dust which is inhaled by the workers
especially those who do not wear the respirators (PPE). This indeed reduced the
exposure of the flour dust to the worker but it was however found that some minimal
dust still managed to escape and reach to the worker. Furthermore, it was established
that when these automated machines break down, the affected companies results to
manual packing of the flour when the machines are being repaired due to the high
demand of the flour. Other workers who are exposed to the high dust levels are the
sweepers and the sifter operators. This observation was in line with a study by Iraj et
al (2011) on wheat flour mills in Iran where they confirmed that workers at flour
packing workstations were exposed to an appreciably higher level of respirable dusts
than others (p<0.05) and that workers such as packers, sweepers and sift operators
who were directly exposed to flour inhaled more flour dusts than others. Flour dust
has been associated with several health related problems. In this study, flour dust was
mentioned to cause respiratory problems such as wheezing, coughing and blocked
chest problems among some respondents. Data analysis showed that there was a
significant statistical relationship (P <0.05)between exposure to dust and respiratory
problems.
Carrying of heavy loads from the trucks to the stores or silos, or carrying flour from
the packing areas to the stores or waiting trucks was another activity identified as a
hazard. The grains are usually packed in 90kg while flour is packed in bales of 24kg
and bags of 5kg, 10kg, 20kg, 50kg and 70kg. Workers involved in loading/offloading
are usually engaged on short term contracts and are paid piecemeal; this makes
workers to overload themselves with the main aim of ensuring they take home more
money. This is made worse by the fact that the floors are un-even/slippery and the
grains contain dust which the workers inhale while carrying the loads as most of
them do not use the provided respirators arguing that it inhibits breathing. However
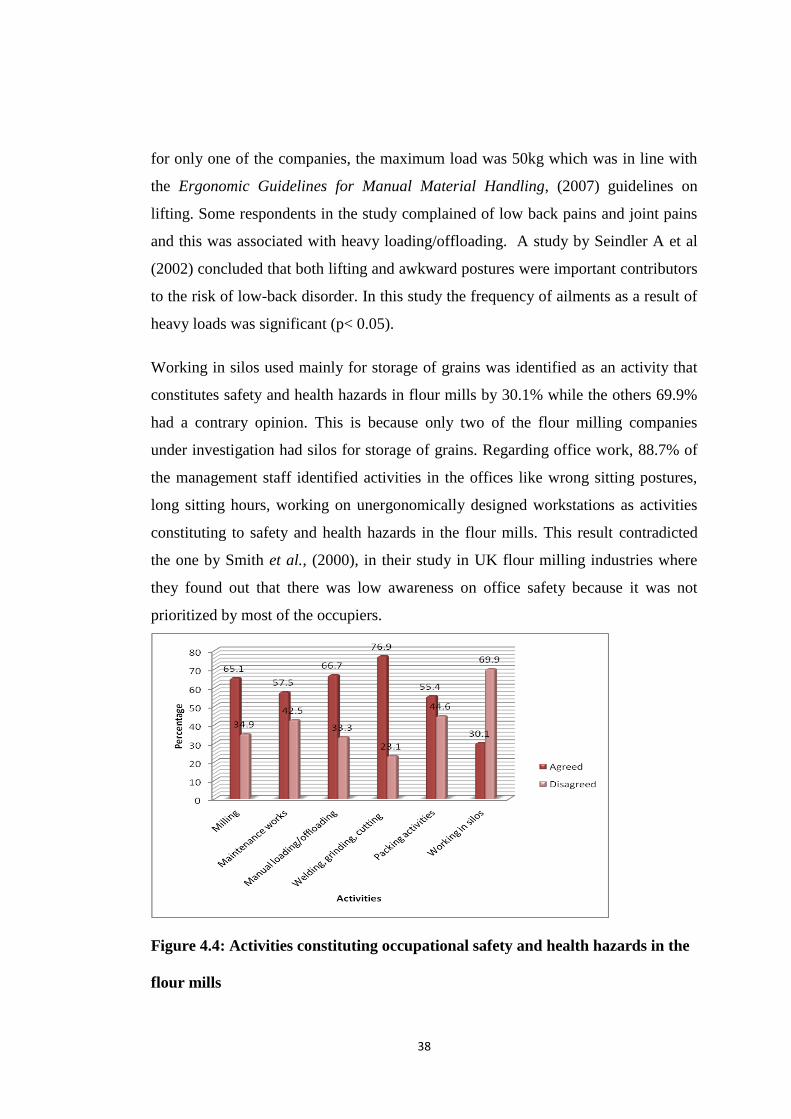
38
for only one of the companies, the maximum load was 50kg which was in line with
the Ergonomic Guidelines for Manual Material Handling, (2007) guidelines on
lifting. Some respondents in the study complained of low back pains and joint pains
and this was associated with heavy loading/offloading. A study by Seindler A et al
(2002) concluded that both lifting and awkward postures were important contributors
to the risk of low-back disorder. In this study the frequency of ailments as a result of
heavy loads was significant (p< 0.05).
Working in silos used mainly for storage of grains was identified as an activity that
constitutes safety and health hazards in flour mills by 30.1% while the others 69.9%
had a contrary opinion. This is because only two of the flour milling companies
under investigation had silos for storage of grains. Regarding office work, 88.7% of
the management staff identified activities in the offices like wrong sitting postures,
long sitting hours, working on unergonomically designed workstations as activities
constituting to safety and health hazards in the flour mills. This result contradicted
the one by Smith et al., (2000), in their study in UK flour milling industries where
they found out that there was low awareness on office safety because it was not
prioritized by most of the occupiers.
Figure 4.4: Activities constituting occupational safety and health hazards in the
flour mills

39
4.2.1 Identified hazards in the flour milling companies
Unguarded machinery was identified as a hazard by, 66(35.5%) workers from the
flour milling companies as shown in Table 4.8. The study observed that there were
unguarded machines in some companies which could expose the workers to
occupational hazards.
Plate 4.1: Unguarded milling machines
On the issue of high hazardous noise, all the general workers from the flour milling
companies confirmed that high noise levels were present at their workplaces.
118(63.4%) workers from the flour milling companies confirmed that milling
machines produced high noise levels while 68(36.6%) said that the noise produce by
those milling machines was tolerable. Regarding noise produced by heavy equipment
like the trucks; 80(43.0%) workers from the flour milling companies confirmed that
heavy equipment in their respective companies produced high noise levels while
106(57.0%) said that those machines produced tolerable noise. Regarding the
workshop noise; 113(60.8%) workers from the flour milling companies stated that
workshop activities produced high noise levels while 73(39.2%) stated that workshop
activities produced tolerable noise.
A review of the noise survey reports from flour milling companies indicated that
indeed some sections in the flour mills have high noise levels [>90dB(A)] which
include the milling area, workshop, sifters, intake hoppers, Destoner and separators

40
as shown in table 4.5. It is good to note that most companies had taken the action of
providing their workers with earmuffs and earplugs due to high noise/hazardous
levels but it was observed that most workers in these sections were not using the
given appropriate PPEs during the study. The p-value indicates that there was
statistical significance between noise sources (milling machines and workshop
activities) and the noise perception (p=0.00)
Table 4.5: Areas with high noise levels (db(A)
Company
Code
Roll
mill
section
Separat
ors
Destoner Intake
hopper
Sifter Workshop
FMC 1 98.2 90.9 90.9 89.6 89.2 77.2
FMC 2 94.8 90.0 89.6 94.8 94.3 89.2
FMC 3 93.6 88.2 90.2 96.9 90.3 67.8
FMC 4 96.7 99.4 85.4 91.2 89.8 100.0
FMC 5 90.3 92.1 87.9 77.7 87.7 94.2
FMC 6 94.1 95.6 93.9 99.7 88.1 94.1
FMC 7 89.7 90.2 94.7 91.9 93.3 97.5
FMC 8 96.2 87.3 79.8 79.1 87.2 95.4
FMC 9 92.1 91.0 90.2 92.1 90.1 96.4
FMC 10 90.3 91.5 88.3 86.3 87.3 88.9
FMC 11 91.2 89.3 92.1 87.9 92.3 94.3
Legend:
Colour
code
Noise rating Implication
Less than 85dB(A) Safe noise levels
Above 85Db(a) but
less than 90dB(A)
Noise levels which require the occupier to
develop and implement an effective noise
control and hearing conservation
programme
More than 90dB(A) High noise levels. Workers should not to be
exposed to such noise levels without
hearing protection. Occupier must develop
and implement an effective noise control
and hearing conservation programme

41
Plate 4.2: Worker observed wearing ear muff in one of the companies
Dust was also identified as a hazard in the flour milling companies with 176(94.6%)
workers from the flour milling companies confirming that dust hazards were present
in their workstations. the management staff, 15(21.1%) stated that the wheezing
problems they had were related to flour dusts, 36(50.7%) stated that their coughs
problems they had were related to flour dusts while 20(28.2%) stated that the
blocked chest problems they had were related to flour dusts as shown in Table 4.6.
The p-value indicates that there was statistical significance relationship between
experiencing problems related to flour dust and employee health (p=0.03), because
those agreeing to the effects were handling flour and grains directly.
Review of the dust survey (Pm10) reports available 9(81.8%) of the flour mills
studied revealed that the areas with high dust levels are packing, intake and storage
areas with average levels of 9.60, 10.90 and 8.40mg/m3
respectively.

42
Table 4.6: Dust and related health problems among the management staff
Company
Code
Wheezing (%) Coughs
(%)
Blocked
chest (%)
Total
(%)
p-
value
FMC 1 66.7 33.3
100.0
0.03
FMC 2 62.5 25.0 12.5 100.0
FMC 3
100.0
100.0
FMC 4 40.0 40.0 20.0 100.0
FMC 5 16.7 83.3
100.0
FMC 6
50.0 50.0 100.0
FMC 7 26.3 63.2 10.5 100.0
FMC 8
50.0 50.0 100.0
FMC 9 16.7 66.7 16.7 100.0
FMC 10 19.0 45.0 36.0 100.0
FMC 11 25.0 50.0 25.0 100.0
Total 21.1 50.7 28.2 100.0
A total of 115(62.2%) of the workers from flour milling companies with respiratory
complications believed that their problems were as a result of their work, 59(31%)
with low back problems believed that their problems were as a result of their work,
6(3.4%) with joint pains and eye problems each respectively believed that those
problems were as a result of their work as shown in Table 4.7.

43
Table 4. 7: Ailments/conditions related to work among the workers in the companies
Company: Respiratory
complication
(%)
Low back
pain (%)
Joints
Pain
(%)
(%) Eye
problems
Total
(%)
p-
value
FMC 1 66.7 33.3 100.0 0.04
FMC 2 66.7 33.3 100.0
FMC 3 75.0 25.0 100.0
FMC 4 42.9 42.9 14.3 100.0
FMC 5 66.7 33.3 100.0
FMC 7 81.3 12.5 6.3 100.0
FMC 8 66.7 33.3 100.0
FMC 9 33.3 44.4 11.1 11.1 100.0
FMC 10 50.0 50.0 100.0
FMC 11 50.0 50.0 100.0
Total 62.2 31.0 3.4 3.4 100.0
Employees working in the production area (packing, millers, and intake area.) were
found to have respiratory symptoms such as coughing, sneezing, stuffy or runny nose
while at work. On examination they were found to have enlarged inferior turbinate
an indication of allergic Rhinitis that shows they are being exposed to allergens such
as dust.
Heavy load (50kg and above) was classified as hazard in which 113(60.8%) general
workers from the flour milling companies confirmed that heavy load were present at
their respective work stations. A total of 117(62.9%) workers from the flour milling
companies confirmed that hazards related to poor housekeeping (sliding, slip and
skid) were present in their workplace. Regarding excessive vibrations as a hazard,
73(39.2%) workers from the flour milling companies agreed that excessive vibration
hazards were present in their workplaces while 113(60.8%) disagreed with this
statement. The study observed that workers were carrying 90kg bags (grains) and up
to 72kgs for the flour (Upto three bales each at 24kg)., refer to plate 1 and 3.These
loads are heavy and not in line with the Ergonomic Guidelines for Manual Material

44
Handling, (2007) guidelines on lifting. Some sections of the floors were uneven and
some slippery with a lot of noise and vibrations from heavy machinery.
Plate 4.3: Workers involved in carrying of heavy load
Regarding the workshop activities, 89(47.8%) confirmed that welding fumes hazards
were present in their respective companies. On welding glare, 101(54.3%) workers
from the mainly in the workshop identified it as a hazard. It was observed that some
workers involved in the welding, grinding and cutting had PPE while others were
working without the PPE’s. A total of 115(61.8%) general workers agreed that other
hazards (noise from cutting and grinding, exposed energised electrical cables, and
uneven floors) were present in their respective companies. The results are
summarized in Table 4.8 below.

45
Table 4.8: Identified hazards in the flour milling companies
Table 4.8a Lifting heavy loads
Variable Company: Yes (%) No (%) Total
(%) Lifting Heavy loads FMC 1 80.0 20.0 100.0
FMC 2 100.0 100.0
FMC 3 100.0 100.0
FMC 4 66.7 33.3 100.0
FMC 5 67.0 33.0 100.0
FMC 6 60.0 40.0 100.0
FMC 7 50.0 50.0 100.0
FMC 8 100.0 100.0
FMC 9 66.7 33.3 100.0
FMC 10 55.0 45.0 100.0
FMC 11 100.0 100.0
Total 60.8 39.2 100.0
Table 4.8 b: High noise levels
Variable Company: Yes (%) No (%) Total
(%) High noise levels FMC 1 100.0 100.0
FMC 2 100.0 100.0
FMC 3 100.0 100.0
FMC 4 100.0 100.0
FMC 5 100.0 100.0
FMC 6 100.0 100.0
FMC 7 100.0 100.0
FMC 8 100.0 100.0
FMC 9 100.0 100.0
FMC 10 100.0 100.0
FMC 11 100.0 100.0
Total 100.0 100.0

46
Table 4.8 c: Working with unguarded machines
Variable Company: Yes (%) No (%) Total (%)
Unguarded machines FMC 1 50.0 50.0 100.0
FMC 2 100.0 100.0
FMC 3 100.0 100.0
FMC 4 100.0 100.0
FMC 5 100.0 100.0
FMC 6 100.0 100.0
FMC 7 100.0 100.0
FMC 8 100.0 100.0
FMC 9 33.3 66.7 100.0
FMC 10 100.0 100.0
FMC 11 100.0 100.0
Total 35.5 64.5 100.0
Table 4.8 d: Excessive vibrations
Variable Company: Yes (%) No (%) Total
(%) Excessive vibration FMC 1 100.0 100.0
FMC 2 100.0 100.0
FMC 3 100.0 100.0
FMC 4 33.3 66.7 100.0
FMC 5 100.0 100.0
FMC 6 100.0 100.0
FMC 7 100.0 100.0
FMC 8 100.0 100.0
FMC 9 100.0 100.0
FMC 10 100.0 100.0
FMC 11 100.0 100.0
Total 39.2 60.8 100.0
Table 4.8.e: Welding fumes
Variable Company: Yes (%) No (%) Total (%)
Welding fumes FMC 1 100.0 100.0
FMC 2 100.0 100.0
FMC 3 100.0 100.0
FMC 4 100.0 100.0
FMC 5 100.0 100.0
FMC 6 100.0 100.0
FMC 7 100.0 100.0
FMC 8 100.0 100.0
FMC 9 33.3 66.7 100.0
FMC 10 100.0 100.0
FMC 11 100.0 100.0
Total 47.8 52.2 100.0

47
Table 4.8 f: Glare from welding fumes
Variable Company: Yes (%) No
(%)
Total (%)
Glare from welding FMC 1 100.0 100.0
FMC 2 100.0 100.0
FMC 3 100.0 100.0
FMC 4 100.0 100.0
FMC 5 100.0 100.0
FMC 6 100.0 100.0
FMC 7 100.0 100.0
FMC 8 100.0 100.0
FMC 9 66.7 33.3 100.0
FMC 10 75.0 25.0 100.0
FMC 11 100.0 100.0
Total 54.3 45.7 100.0
Table 4.8 g: Other hazards (exposed electrical cables, working in confined
spaces (Silos, work at height:
Variable Company: Yes (%) No
(%)
Total (%)
Others FMC 1 66.7 33.3 100.0
FMC 2 100.0 100.0
FMC 3 100.0 100.0
FMC 4 100.0 100.0
FMC 5 100.0 100.0
FMC 6 100.0 100.0
FMC 7 100.0 100.0
FMC 8 100.0 100.0
FMC 9 100.0 100.0
FMC 10 100.0 100.0
FMC 11 80.0 20.0 100.0
Total 61.8 38.2 100.0

48
Plate 4.4: Signage on high noise levels
Figure 4.5: Provision of safety and health information like high noise levels

49
4.2.3 Check list results on safety activities
Observational checklist was used to determine the status of each of the flour milling
company in order to capture data that could not be captured by questionnaires. The
status was categorised as; satisfactory and unsatisfactory which requires action.
The arrangement and the nature of gangways according to the checklist showed that
other that, FMC 1, 7, and 9 which was unsatisfactory and required action, all the rest
was generally satisfactory. On exit marking FMC 1, 5, 7, 8 and 9 was satisfactory
while 2, 3, 4, 6, 10 and 11 were unsatisfactory. Ventilation in all the companies was
satisfactory other than for FMC 1, 7, 8 and 9.
Regarding the Display of Safety and Health Policy, FMC 5, 7, 9 was unsatisfactory
and required action while in all the others it was satisfactory. On the Display of
Safety Signage; four companies required action (FMC 1, 5, 7 and 9) and the rest was
satisfactory. On the Existence of Emergency Facilities, that is Fire Extinguishers,
Fire Alarm, Fire Detectors, Fire Exits, Fire assembly points, emergency shutdown
buttons, factories 2,3, 4, 6, 10 and 11 had satisfactory results, while the others, FMC
1, 5,7 8 and 9 had unsatisfactory results. On guarding of the machines at the
workplace, FMC 1, 2, 7 and 10 was satisfactory while all the others were
unsatisfactory as shown in table 4.9 below.

50
Table 4.9: Check list results on safety activities
Table 4.9 a: Gangways
Status Company Satisfactory
Good
Unsatisfactory
Gangways FMC 1
√
FMC 2 √
FMC 3 √
FMC 4 √
FMC 5 √
FMC 6 √
FMC 7
√
FMC 8 √
FMC 9
√
FMC 10 √
FMC 11 √
Table 4.9 b: Ventilation
Status Company Satisfactory Unsatisfactory
Ventilation
FMC 1
√
FMC 2 √
FMC 3 √
FMC 4 √
FMC 5 √
FMC 6 √
FMC 7
√
FMC 8
√
FMC 9
√
FMC 10 √
FMC 11 √

51
Table 4.9 c: Exits
Status Company Satisfactory
Good
Unsatisfactory
Marking of Exits FMC 1 √
FMC 2 √
FMC 3 √
FMC 4 √
FMC 5 √
FMC 6 √
FMC 7 √
FMC 8 √
FMC 9 √
FMC 10 √
FMC 11 √
Table 4.9 d: Display of safety and health policy
Status Company Satisfactory Unsatisfactory
Display of Safety and
Health Policy
FMC 1 √
FMC 2 √
FMC 3 √
FMC 4 √
FMC 5 √
FMC 6 √
FMC 7 √
FMC 8 √
FMC 9 √
FMC 10 √
FMC 11 √

52
Table 4.9 e: Display of safety signage
Status Company Satisfactory
Good
Unsatisfactory
Display of Safety
Signage
FMC 1 √
FMC 2 √
FMC 3 √
FMC 4 √
FMC 5 √
FMC 6 √
FMC 7 √
FMC 8 √
FMC 9 √
FMC 10 √
FMC 11 √
Table 4.9 f: Existence of emergency facilities
Status Company Satisfactory Unsatisfactory
Existence of Emergency
Facilities, e.g. Fire
Extinguishers, Fire
Alarm,
FMC 1 √
FMC 2 √
FMC 3 √
FMC 4 √
FMC 5 √
FMC 6 √
FMC 7 √
FMC 8 √
FMC 9 √
FMC 10 √
FMC 11 √

53
Table 4.9 g: Observance of safe working procedures
Status Company Satisfactory Unsatisfactory
Observance of Safe
Working Procedures
FMC 1 √
FMC 2 √
FMC 3 √
FMC 4 √
FMC 5 √
FMC 6 √
FMC 7 √
FMC 8 √
FMC 9 √
FMC 10 √
FMC 11 √
Table 4.9h: Guarding of machines
Status Company Satisfactory Unsatisfactory
Guarding of machines FMC 1 √
FMC 2 √
FMC 3 √
FMC 4 √
FMC 5 √
FMC 6 √
FMC 7 √
FMC 8 √
FMC 9 √
FMC 10 √
FMC 11 √

54
Table 4.9 i: Lifting and carrying of heavy load
Status Company Satisfactory Unsatisfactory
Lifting and Carrying of
heavy load
FMC 1
√
FMC 2
√
FMC 3 √
FMC 4 √
FMC 5
√
FMC 6 √
FMC 7 √
FMC 8
√
FMC 9
√
FMC 10 √
FMC 11 √
Table 4.9 j Condition of the floors
Status Company Satisfactory Unsatisfactory
Condition of the floors FMC 1
√
FMC 2 √
FMC 3 √
FMC 4 √
FMC 5 √
FMC 6 √
FMC 7
√
FMC 8 √
FMC 9
√
FMC 10 √
FMC 11 √

55
Table 4.9 k: Housekeeping
Status Company Satisfactory Unsatisfactory
Housekeeping FMC 1 √
FMC 2 √
FMC 3 √
FMC 4 √
FMC 5
√
FMC 6 √
FMC 7
√
FMC 8 √
FMC 9
√
FMC 10 √
FMC 11 √
Table 4.9 l: Workplace Layout
Status Company Satisfactory Unsatisfactory
Workplace Layout FMC 1 √
FMC 2 √
FMC 3 √
FMC 4 √
FMC 5
√
FMC 6 √
FMC 7
√
FMC 8 √
FMC 9
√
FMC 10 √
FMC 11 √

56
Table 4.9 m: Insulation and Protection of Electrical Cables
Status Company Satisfactory Unsatisfactory
Insulation and
Protection of
Electrical Cables
FMC 1 √
FMC 2 √
FMC 3 √
FMC 4 √
FMC 5 √
FMC 6 √
FMC 7
√
FMC 8 √
FMC 9 √
FMC 10 √
FMC 11 √
Table 4.9 n: Provision and Use of Personal Protection Equipment (PPE)
Status Company Satisfactory Unsatisfactory
Provision And Use of
Personal Protection
Equipment (PPE)
FMC 1 √
FMC 2 √
FMC 3 √
FMC 4 √
FMC 5 √
FMC 6 √
FMC 7
√
FMC 8 √
FMC 9 √
FMC 10 √
FMC 11 √

57
Table 4.9 o: Supervision
Status Company Satisfactory Unsatisfactory
Supervision
FMC 1 √
FMC 2 √
FMC 3 √
FMC 4 √
FMC 5 √
FMC 6 √
FMC 7 √
FMC 8 √
FMC 9 √
FMC 10 √
FMC 11 √
Plate 4.5: Unsafe working platform

58
Plate 4.6: Partially guarded machine in the workshop
Plate 4.7: High unsafe stacking and obstructed gangway

59
4.3 Nature of injuries in flour milling companies studied
4.3.1 Accidents and incidents in the flour milling companies under investigation
Regarding injuries at work, 62(33.3%) workers reported to have been injured at work
for the last one year from the date of the study. Out of all those who had been
injured, 44% had suffered musculoskeletal problems (pain in the muscles and
skeleton), 27% had minor cuts (cuts managed only by first aiders), 13% had suffered
major cuts (cuts managed by first aiders and referred for medical help), 8% had
dislocation, 5% fractures and 3% had been amputated as shown in the figure below.
Figure 4.6: Nature of Injury at work
The leading type of non-fatal injury was musculoskeletal problems which could be
attributed to lifting/carrying of heavy loads, work postures and movements;
repetitiveness and pace of work; force of movements; vibration; increase pressured
(e.g., to produce more) and monotonous tasks. This finding was in line with a study
by National Institute for Occupational Safety and Health, [USA NIOSH] (2001) which
reviewed evidence linking physical task factors (repetition, force, posture and
vibration) to the development of work-related musculoskeletal disease (WMSD) of
the neck, upper extremity, and low back. The report concluded there is a substantial

60
body of credible epidemiologic research providing strong evidence of an association
between WMSDs and certain work-related physical factors when there are high
levels of exposure and especially in combination with exposure to more than one
physical factor.
Minor and major cuts were also reported to be experienced in the flour milling
companies; these were largely attributed to slips, trip or fall, low overhangs, tools
used on the job, exposed sharp surfaces, and many other causes such as unguarded
machines and failure to wear the provided PPE.
Some respondents reported to have experienced dislocation, fractures or amputation
while at work. Dislocation of the joints and fractures was associated from fall, slip,
trip, strain by, and struck by. Electric shock was pointed out as the cause of the
amputation in the companies.
Thirty one (50%) workers who confirmed to have been injured while at work,
reported to have gotten injuries that did not require them to stay out of work.
Likewise 21(33.9%) workers got injuries that made them to stay out of work between
1-7days from the unguarded machines while 10(16.1%) got the injuries while
carrying heavy loads on uneven and slippery floors.
Accidents and incidents in the flour mills companies were reported by the
employees. According to the result of the investigation, all the workers from the flour
milling companies who reported accidents to the human resource office had those
accidents investigated by the safety and health representatives. Those who did not
report accidents to the human resource office still had those accidents investigated by
the safety officers. Seventeen 17(27.4%) workers who reported their accidents to the
trained first aider had those accidents investigated while 45(72.6%) workers who
reported the accidents to the trained first aider confirmed that those accidents were
not investigated as they were minor injuries. Twenty seven (43.5%) who reported to
injuries to the health and safety officers confirmed that the reported accidents were
investigated while 35(56.5%) reported that the accidents were not investigated. All
the workers who did not report accidents to health and safety officers confirmed that
the accidents were never investigated.

61
4.4 Causes of the injuries and their control measures in flour milling companies
studied
4.4.1 Causes of accidents
In the flour mills companies under investigation, the participants reported various
causes of accidents being; - unguarded machines (40%); slippery floors (14.4%);
Inadequate/lack of PPE (11.7%); Poor or lack of housekeeping (10.9%); inadequate
or lack of lifting equipment (10.5%); Trips/slips or falls (7.8%) and Neglecting
Safety Procedures (4.7%) as shown in the table below
Table 4.10: Causes of Accidents
Causes of the accidents ` Frequency Percentage (%)
Unguarded machines 103 40
Slippery floor 37 14.4
Inadequate/lack of lifting equipment 27 10.5
Inadequate/lack of PPE 30 11.7
Neglecting Safety Procedures 12 4.7
Trips/slips or falls 20 7.8
Poor or lack of housekeeping 28 10.9
Total 257 100
Working without wearing any personal protective equipment (PPE) may
highly increase the probability for getting any undesired injured. According to a
study by Dorji and Hadikusumo (2006), many workers refused to wear PPE with
various reasons such as feeling uncomfortable with the gears while performing
their job and considered it as an obstacle to their work output. The ILO (1996)
revealed that some of the workers felt uncomfortable while wearing any types of PPE
and it indirectly decreases their work performance.

62
According to Federated (2007), good housekeeping is a vital function that can
improve overall safety performance by reducing the accidents from happening.
A good housekeeping program should be well planned and coordinated as well
as regularly practice. This is a continuous process which involved in everyone in
workplace. Many accidents are credited to the other causes, such as tripping
or slipping which are actually results of unsafe condition due to the poor
housekeeping.
4.4.2 Control measures
Regarding hazard control measures; 212(82.5%) workers from the flour milling
companies reported that their respective workplaces had adequate hazard control
measures while 45(17.5%) indicated that their respective workplaces did not have
adequate hazard control measures.
On prioritizing safety and health issue; 222(86.4%) workers stated that prioritizing of
safety and health issues could help improve work environment. Out of 257
participants, 165(64.2%) suggested that ensuring that machines were guarded would
make the work environment safe. A total of 202(78.6%) workers suggested that
regular training of workers on safe work practices would improve work environment.
Regarding housekeeping; 138(53.7%) workers suggested that maintaining of good
housekeeping would help improve work environment while 119(46.3%) thought
otherwise. On provision of mechanical aid for lifting; 187(72.8%) workers stated that
providing of mechanical aids for lifting would help improve work environment hence
controlling of accidents while 70(27.2%) thought otherwise. On PPE provision;
234(91.5%) workers proposed that the workers should be provided with proper PPE
so as to improve the work environment and reduce/control accident while 23(8.5%)
thought otherwise. On packaging of grains; 57(22.1%) workers from the flour
milling companies suggested that the grains to be packaged in smaller bags so as to
reduce accidents hence improving their work environment while 200(77.2%) thought
otherwise. These findings are summarised in Table 4.11 below.

63
Table 4.11: What to be done to control accidents
Table 4.11 a: Prioritise safety and health issues
Variable
Variable
Company Code: Yes (%) No (%) Total (%)
Prioritize safety and health issues
FMC 1 50.0 50.0 100.0
FMC 2 100.0 100.0
FMC 3 100.0 100.0
FMC 4 100.0 100.0
FMC 5 100.0 100.0
FMC 6 100.0 100.0
FMC 7 100.0 100.0
FMC 8 100.0 100.0
FMC 9 66.7 33.3 100.0
FMC 10 100.0 100.0
FMC 11 50.0 50.0 100.0
Total 86.4 13.6 100.0
Table 4.11 b: Ensure machines are guarded
Variable Company Code: Yes (%) No (%) Total (%)
Ensure machines are guarded
FMC 1 50.0 50.0 100.0
FMC 2 100.0 100.0
FMC 3 100.0 100.0
FMC 4 100.0 100.0
FMC 5 100.0 100.0
FMC 6 100.0 100.0
FMC 7 100.0 100.0
FMC 8 100.0 100.0
FMC 9 66.7 33.3 100.0
FMC 10 100.0 100.0
FMC 11 100.0 100.0
Total 64.2 35.8 100.0

64
Table 4.11 c: Train workers on safe work procedures
Variable Company Code: Yes (%) No (%) Total (%)
Train workers on safe work practices
FMC 1 100.0 100.0
FMC 2 100.0 100.0
FMC 3 100.0 100.0
FMC 4 33.3 66.7 100.0
FMC 5 100.0 100.0
FMC 6 100.0 100.0
FMC 7 66.7 33.3 100.0
FMC 8 100.0 100.0
FMC 9 100.0 100.0
FMC 10 100.0 100.0
FMC 11 50.0 50.0 100.0
Total 78.6 21.4 100.0
Table 4.11 d: Maintain good housekeeping
Variable Company Code: Yes (%) No (%) Total (%)
Maintain good housekeeping
FMC 1 100.0 100.0
FMC 2 100.0 100.0
FMC 3 100.0 100.0
FMC 4 66.7 33.3 100.0
FMC 5 100.0 100.0
FMC 6 100.0 100.0
FMC 7 100.0 100.0
FMC 8 100.0 100.0
FMC 9 66.7 33.3 100.0
FMC 10 100.0 100.0
FMC 11 100.0 100.0
Total 53.7 46.3 100.0

65
Table 4.11 e: Provide mechanical aids for lifting
Variable Company Code: Yes (%) No (%) Total (%)
Provide mechanical aids for lifting
FMC 1 100.0 100.0
FMC 2 100.0 100.0
FMC 3 100.0 100.0
FMC 4 100.0 100.0
FMC 5 100.0 100.0
FMC 6 100.0 100.0
FMC 7 100.0 100.0
FMC 8 100.0 100.0
FMC 9 33.3 66.7 100.0
FMC 10 100.0 100.0
FMC 11 100.0 100.0
Total 72.8 27.2 100.0
Table 4.11 f: Package grains in smaller bags not exceeding 50kgs
Variable Company Code: Yes (%) No (%) Total (%)
Package grains in smaller bags
FMC 1 100.0 100.0
FMC 2 100.0 100.0
FMC 3 100.0 100.0
FMC 4 100.0 100.0
FMC 5 100.0 100.0
FMC 6 100.0 100.0
FMC 7 100.0 100.0
FMC 8 100.0 100.0
FMC 9 100.0 100.0
FMC 10 100.0 100.0
FMC 11 100.0 100.0
Total 22.1 77.2 100.0

66
Table 4.11 g: Provide workers with PPE and enforce their use
Variable Company Code: Yes (%) No (%) Total (%)
Provide workers with PPE
FMC 1 100.0 100.0
FMC 2 100.0 100.0
FMC 3 100.0 100.0
FMC 4 33.3 66.7 100.0
FMC 5 100.0 100.0
FMC 6 100.0 100.0
FMC 7 100.0 100.0
FMC 8 100.0 100.0
FMC 9 50.0 50.0 100.0
FMC 10 100.0 100.0
FMC 11 100.0 100.0
Total 91.5 8.5 100.0
4.2.2 Training on Occupational Safety and Health
Regarding training on safety and health, 173 (92.9%) workers confirmed that their
respective flour milling companies had training programs on safety and health,
168(65.4%) respondents confirmed that they had been trained on the safety and
health hazards they were exposed to while at work. 69(26.8%) respondents from the
flour milling companies confirmed that they had been trained on safety and health
practices in the last one year by their health and safety officers in their respective
flour milling companies while 137(53.4%) were trained by external trainers and
51(19.8%) respondents confirmed that they had been trained on safety and health
practices in the previous 12 months by their health and safety committees in their
respective companies. One hundred and twenty two (65.5%) confirmed that they
been trained on first aid at least once.
The p-value indicates that there was no statistical significance between training on
safety and health and the use of PPE (Table 4.12).
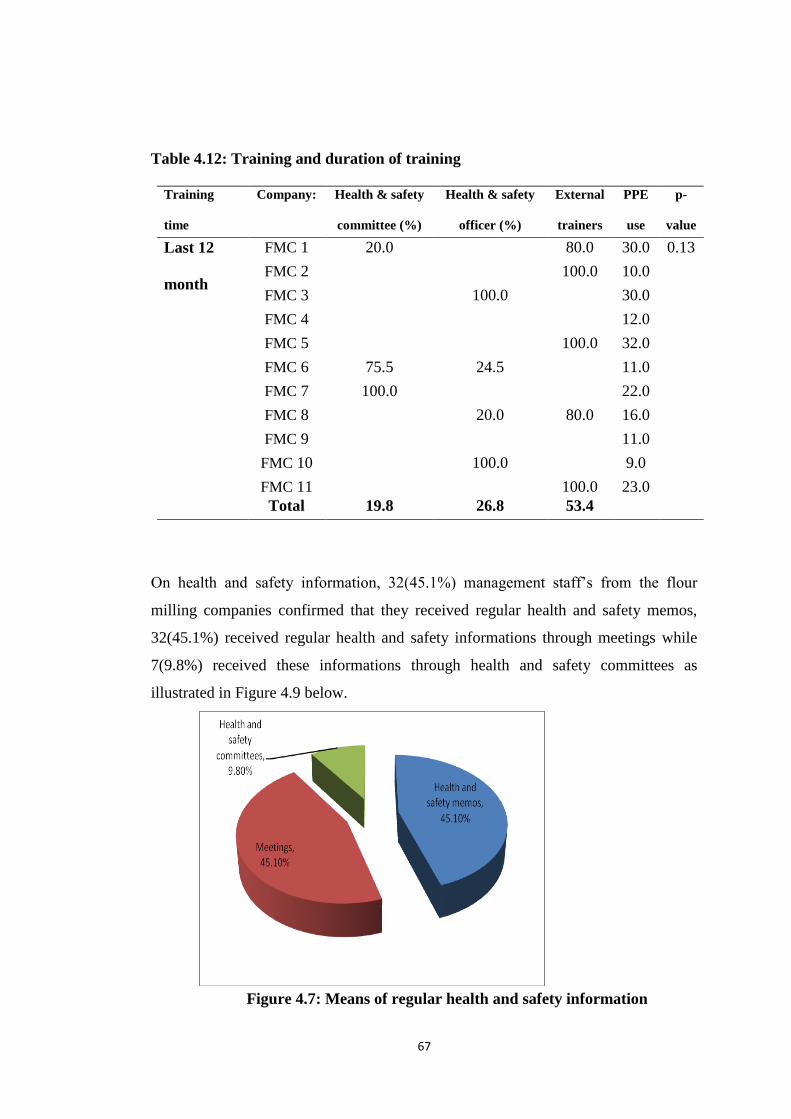
67
Table 4.12: Training and duration of training
Training
time
Company: Health & safety
committee (%)
Health & safety
officer (%)
External
trainers
(%)
PPE
use
(%)
p-
value
Last 12
month
FMC 1 20.0 80.0 30.0 0.13
FMC 2 100.0 10.0
FMC 3 100.0 30.0
FMC 4 12.0
FMC 5 100.0 32.0
FMC 6 75.5 24.5 11.0
FMC 7 100.0 22.0
FMC 8 20.0 80.0 16.0
FMC 9 11.0
FMC 10 100.0 9.0
FMC 11 100.0 23.0
Total 19.8 26.8 53.4
On health and safety information, 32(45.1%) management staff’s from the flour
milling companies confirmed that they received regular health and safety memos,
32(45.1%) received regular health and safety informations through meetings while
7(9.8%) received these informations through health and safety committees as
illustrated in Figure 4.9 below.
Figure 4.7: Means of regular health and safety information

68
A total of 181(70.6%) workers from all the flour milling companies indicated that
safety and health and related policies were communicated during induction trainings
while 75(29.4%) had contrary opinions. Posters were mentioned by 32(12.5%)
workers as a means of policy communication in the companies while 224(87.5%)
mentioned other means of communication like safety and health manuals and health
and safety committee meetings. Those who identified safety and health manuals as a
means of communication were 48(18.8%), Safety and health committee was
mentioned as a forum for policy communication by 130(50%) workers from the
sampled out flour milling companies. They indicated that their policies were
communicated during safety and health committee meetings compared to 128(50%)
who mentioned other means. Management meetings were identified by 32(12.5%)
workers as the means of policy communication.
Table 4.13: Policy communication in the flour mills
Means of Policies
communication
Has the policy been communicated
to all stakeholders?
Statistics
Yes (%) No (%) Total (%) p-value
Induction
training
Yes 75.0 60.0 70.6 0.54
No 25.0 40.0 29.4
Total 100.0 100.0 100.0
Posters Yes 16.7
12.5
0.38 No 83.3 100.0 87.5
Total 100.0 100.0 100.0
Safety and health
manuals
Yes 25.0
18.8
0.27 No 75.0 100.0 81.2
Total 100.0 100.0 100.0
Safety and health
committee
Yes 58.3 25.0 50.0
0.25 No 41.7 75.0 50.0
Total 100.0 100.0 100.0
Management
meetings
Yes 16.7
12.5 0.38

69
On PPE provisions; 62(33.3%) workers were provided with ear muffs/ plugs as PPE,
9(4.9%) were provided with safety shoes, 79(42.5%) were provided with gloves,
7(3.8%) were provided with goggles, 109(58.6%) were provided with aprons and
98(52.7%) were provided with dust masks as PPE as shown in Table 4.14.
Table 4.14: The PPE provided to workers in the flour mills companies
Company: Ear Muffs/
plugs (%)
Safety
shoes
(%)
Gloves
(%)
Goggles
(%)
Apro
ns
(%)
Dust
Masks
(%)
FMC 1 66.7 16.7 34.6 16.7
FMC 2 25.0 45.8 25.0 50.0
FMC 3 42.9 57.1
FMC 4 14.3 57.1 28.6
FMC 5 75.0 8.3 8.3 42.9 68.3
FMC 6 66.7 33.3 33.8 5.5
FMC 7 11.1 16.7 44.4 27.8
FMC 8 12.8 33.3 33.3 33.3
FMC 9 28.6 28.6 8.3 68.6 44.3
FMC 10 27.3 36.4 57.3 69.1
FMC 11 33.3 15.5 23.6 66.7
Total 33.3 4.9 42.5 3.8 58.6 52.7
On the usage of PPE; 112(60%) workers were not using provided PPE because they
found them to be uncomfortable while 37(20%) were not using them because they
did not find them helpful and 37(20%) because they did not provide them with
sufficient protection, respectively as shown in Table 4.18. The p-value indicates that
there was no statistical significance association between PPE provision and reasons
for not using them (p=0.08).

70
Table 4.15: Reasons why PPE were not being used in the flour mills companies
Company: They are
uncomfortable
(%)
I don’t
find them
helpful
(%)
They don’t
provide any
protection
(%)
Total
(%)
p-value
FMC 1 60.0 30.0 10.0 100.0 0.08
FMC 2 40.0 40.0 20.0 100.0
FMC 3 75.0 25.0 100.0
FMC 4 65.0 20.0 15.0 100.0
FMC 5 60.0 20.0 20.0 100.0
FMC 6 50.0 20.0 30.0 100.0
FMC 7 80.0 10.0 10.0 100.0
FMC 8 60.0 30.0 10.0 100.0
FMC 9 75.0 25.0 100.0
FMC 10 50.0 20.0 30.0 100.0
FMC 11 100.0 100.0
Total 60.0 20.0 20.0 100.0
During the study, the researcher made several observations regarding the hazard
control measures in place which contradicted the findings from the respondents. The
researcher found out that guarding of the machines was generally inadequate,
housekeeping in most companies required improvement; not all employees were
provided with appropriate PPE while some workers were found engaging in unsafe
work practices like working on /repairing energized machines.
On the issue of occupational medical examinations, 151(58.8%) respondents agreed
that they underwent occupational medical examination compared to 106(41.2%) who
disagreed with this statement. However most of the respondents could not
differentiate between occupational medical examinations and the food handlers
medical exams as required under Food, Drugs and Chemical Substances Act Cap
254.

71
Regarding safety and health audits 66(92.9%) management staffs confirmed that
safety and health audits were conducted after every twelve months, while 5(7.1%)
could not define when their health and safety audit were conducted.
Safety and Health risk assessment was also investigated and the response was that
51(71.8%) management staffs indicated that their respective companies conducted
safety and health risk assessment every 12 months while 20(28.2%) could not define
when safety and health risk assessment were conducted in their respective
companies.
On the issue of noise survey, 55(77.5%) staffs stated that their respective companies
conducted noise survey in twelve months while 16(22.5%) did not define when the
noise survey was conducted in their respective companies. 42(59.2%) management
staffs stated that dust surveys had been conducted in their respective companies in
the last twelve months while 29(40.8%) did not define when the dust survey was
conducted in their respective companies.
Regarding the fire safety audits, 44(61.9%) staffs confirmed that fire safety audits
were conducted after every 12 months while 27(38.1%) were either not sure or were
not able to define when the fire audits were conducted in their respective companies
as shown in Table 4.16 below. All the companies studied reported that there was no
fire incident in any of the company reported since their inceptions.
Table 4.16: Occupational safety and health audits and hygiene surveys
Occupational safety and health audits
and hygiene surveys
Audit conducted in last 12 months
Yes Not defined
Safety and Health Audits 92.9% 7.1%
Safety and Health Risk Assessments 71.8% 28.2%
Noise Surveys 77.5% 22.5%
Dust Surveys 59.2%) 40.8%
Fire Safety Audits 61.9%) 38.1%

72
Most of the respondents from the flour milling companies confirmed that safety and
health audit, safety and health risk assessment, noise survey, dust survey and fire
safety audit were conducted by qualified personnel. The p-value indicates that there
was no statistical significance association between audits and number of accidents
reported (p=0.70).
The audit reports for the health and safety, risk assessment, fire safety, noise and dust
survey were available at the workplaces, however most workers were not aware of
the existence of such audits. It was noted that the management of the companies
under investigation do not bring to the attention of the workers through the
workplace safety and health committees the findings of the audit reports. Most of the
management staff were also not aware of the findings of the audits.
Audits are supposed to raise issues on the management of safety and health in
workplace and give recommendations on how to improve the same resulting in safer
work environments for employee which should translate to reduced number of
accidents.these results however do not concur with the findings of a study done by
Wagh 2006, where the companies which undergo regular auditing had very good
health and safety management systems and reported few accidents.

73
CHAPTER FIVE
CONCLUSION AND RECOMMENDATIONS
5.1 Conclusion
The study concluded that the main activities that constituted the occupational safety
and health hazards in the flour mills included the milling process, carrying out of
maintenance works on the machines, manual loading and offloading of grains/flour
and packing, as well as workshop activities like welding, grinding and cutting.
The common injuries/incidents reported are, musculoskeletal problems (44%) (Pain
in the muscles and skeleton), minor cuts (27%) (Cuts managed only by first aiders),
major cuts (13%), (cuts managed by first aiders and referred for medical help),
dislocation (8%), fractures (5%) and amputation (3%).
The hazards in the flour milling companies include: unguarded machines, high
hazardous noise, dust, heavy loads, vibration, welding fumes and glare.
The major cause of accidents in the flour milling companies were unguarded
machines (40%); slippery floors (14.4%); Inadequate/lack of PPE (11.7%); Poor or
lack of housekeeping (10.9%); inadequate or lack of lifting equipment (10.5%);
trips/slips or falls (7.8%) and Neglecting Safety Procedures (4.7%).
Finally, due to the research findings drawn from this thesis, the study fails to accept
the null hypotheses which state that there are no significant occupational health and
safety hazards associated with flour milling companies in Nairobi Kenya.
6.2 Recommendations
Guard all moving parts of the machines that can cause harm, ensure all floors are
even, avoid slippery floors, use mechanical aid for lifting/ carrying heavy loads
ensure grains/flour are packaged in small packages not exceeding 50kg. Adopt lock

74
out tag out system for all maintenance works on machines. Machinery safety audits
should also be conducted
Develop clear accident/incident reporting and investigation system in place as well as
training workers on safety and health hazards they were exposed to and also provide
an insurance scheme to all the workers in the flour milling companies.
Develop Occupational Safety and Health programmes to guide employees to work
safely.

75
REFERENCES
Ajeel, N. A. H & Al-Yassen, A. K (2007). Work-related allergic disorders among
flour mill workers. The medical journal of Basrah University (MJBU), 25(1),
29-32.
Agata S & Rafał L. G (2015). Exposure to flour dust in the occupational
environment, International Journal of Occupational Safety and Ergonomics,
21(3), 241-249.
Agbola, R.M. (2012). The impact of health and safety management on employee
Safety at the Ghana Ports and Harbour Authority. International Journal of
Business and Social Science, 2.9.
ASABE (2007). Design considerations for the construction and operation of flour
milling facilities. part i: planning, structural, and life safety considerations.
American Society of Agricultural and Biological Engineers. An ASABE
Meeting Presentation: 074116.
Baldo, B.A, & Wrigley, C.W. (1978) IgE antibodies to wheat flour components
Studies with sera from subjects with bakers’ asthma or coeliac condition. Clin
Allergy.; 8,109–124.
Bhatia, S.C. (2001). Environmental pollution and control in chemical process
industries. Khanna Pub, Delhi. 365-395.
Boateng, C.A. and Amedofu, G.K. (2004). Industrial noise pollution and its effect
on the hearing capabilities of workers: A study from saw mills, printing Press
and corn mills. Afr J Health Sci, 11, 55-60.
Burdorf A, Lillienberg L, and Brisman J.(1994). Characterization of exposure to
inhalable flour dust in Swedish bakeries. Ann Occup Hyg; 38, 67-78.
Chandran, K., (2004). Research Methodology. World Scientific Ltd. London
Cooper, C. R., & Schindler, P. S. (2008). Business research methods (10 ed.).
Boston.
Ergonomic Guidelines for Manual Material Handling (2007), California
Department of Industrial Relations, retrieved from
http://www.cdc.gov/niosh/docs/2007-131/pdfs/2007-131.pdf

76
Federated (2007). Housekeeping during construction operations. ISO
Services Properties, Inc.
Government of Kenya [GOK] (1965). Food, Drugs and Chemical Substances Act
Cap 254. Nairobi: Government Printer.
GOK (1977). The Factories (First Aid) Rules, 1977. Nairobi: Government Printer.
GOK (1978). The Factories (Eye Protection) Rules, 1978. Nairobi: Government
Printer.
GOK (1979). The Factories (Electric Power Special) Rules, 1979. Nairobi:
Government Printer.
GOK (2004). The Factories and Other Places of Work (Safety and Health
Committees) Rules, 2004, Legal Notice No.31. Nairobi: Government Printer.
GOK (2005). The Factories and Other Places of Work (Medical Examination) Rules,
2005. Nairobi: Government Printer.
GOK (2005). The Factories and Other Places of Work (Noise Prevention and
Control) Rules, 2005, Legal Notice No. 25. Nairobi: Government Printer.
GOK (2007). Occupational Safety and Health Act (OSHA) (2007), Nairobi:
Government Printer.
GOK (2007).The Factories and Other Places of Work (Fire Risk Reduction) Rules,
2007, Nairobi: Government Printer.
GOK, (2007).The Factories and Other Places of Work (Hazardous Substances)
Rules, 2007, Nairobi: Government Printer.
GOK, (2007). Work Injury Benefits Act, 2007, Nairobi: Government Printer.
GOK,(2010). The Constitution of Kenya, Retrieved from,
http://www.parliament.go.ke
Health and Safety Authority, (2006). Summary of Fatality Injury & Ilness Statistics
2004- 2005. Health and Safety Authority, Dublin, Ireland.
Health Safety Executive (2006) The Department of labour. Model for Business,
Excellence. Government Printers.

77
Ijadunola K.T, Erhabor G.E, Onayade A.A, Ijadunola M.Y, Fatusi A.O &
Asuzu M.C (2004). Prevalence of respiratory symptoms among wheat flour
mill workers in Ibadan, Nigeria. Am J Ind Med. 45(3), 251-259.
International Labour Organisation (1996). Press Release: ILO Highlights
Growing Risks to Worker Health and Safety, retrieved from
http://www.ilo.org/global/about-the ilo/newsroom/news/ WCMS_008053/
lang--en/index.htm
International Labour Organisation (2001) Guidelines on Occupational Safety and
Health Management Systems, ILO-OSH 2001 Geneva, International Labour
Office
Iraj, K., Mohammad, A., Moshen, A., & Effat, S. (2011).Exposure to Respirable
Flour Dust and Gliadin in Wheat Flour Mills. Journal of Occupational
Health; 53, 417–422
Kangu, M.A., Mamati.F.W. Onwong’a, M.M, M.M. & Osongo, N.E.(2010). Product
Management and Retail Expectations on the Sale of Consumer Goods in Kenya,
Perspectives on Emerging Roles of Retailers from Supermarkets in Kisii Town,1,14
Katsuro P., Gadzirayi C. T., Taruwona M & Mupararano (2010) Impact of
Safety and Health on Worker Productivity: A Case Of Zimbabwe Food
Industry, African Journal Of Business Management, 4 (13), 2644-2651
Krejcie & Morgan (1970). Determining Sample Size for Research Activities.
Educational and Psychological Measurement, 30 (3), 607-610.
Kumar R, Verma K.C & Neetika (2016). An assessment of the knowledge,
attitudes and practices about the prevention of occupational hazards and
utilization of safety measures among meat workers in a city of Haryana state
of India. Indian Journal of Applied Research, 6, (3).
Lillienberg L & Brisman J. (1994). Flour dust in bakeries - a comparison between
methods. Ann Occup; 38, 571-575.
Liu, D.H.F. (1999). Environmental Engineers. Handbook. Noise pollution. CRC
Press LLC. (Eds), 470-525. New Jersey.
Lukoko, B. N., Chege, K. & Musiega, D. (2014). Impact of occupational safety and
health practices on employee performance at Mumias Sugar Company.

78
International Journal of Social Sciences and Entrepreneurship, 1 (11), 547-
559.
Marija, J.N. (2008). SPSS Statistics 17.0 Guide to Data Analysis, Delhi: Prentice
Hall.
Mc Cunney R. (2001). Occupational Health and Medicinal, J., 7(4), 3-5
Mengesha, Y. A & Bekele, A (2005). Relative chronic effects of occupational dusts
on respiratory indices and health of workers in three Ethiopian factories. Am J
Ind Med, 34(4) 373–80.
Meo, S. A & AL-Drees, A. M (2005). Lung function among non-smoking wheat
Flour mill workers. International Journal of Occupational Medicine and
Environmental Health. 18(3), 259-264.
Mitullah W. & Wachira I.N., (2011). Informal Labour In The Construction
Industry In Kenya: A Case Study of Nairobi, ILO, Geneva.
Muchemedzi S &Charamba L. (2006). National Health and Safety Training Course
on Occupational safety and health; NSSA. Harare.
Muchangi, J. M., (2009). Assessment of Occupational Health Hazards Management
in Construction Industry. Moi University, Kenya.
Muchiri,F.K. (2008). Do Occupational Health Services Really Exist in Kenya? a
special focus on industry and other sectors, Nairobi: Occupational Safety and
Health Profiles of Kenya.
Mugenda O.M. & Mugenda A.G. (2003). Research Methods Quantitative and
qualitative approaches. Nairobi: Acts Press.
Mugenda, A. (2008). Social Science Research: Theory and Practice Nairobi: Kijabe
printing press.
Nadine, M. & Jennifer, W. (2013). Enablers and challenges in implementing a
comprehensive workplace health and well-being approach. International
Journal of Workplace Health Management. 6 (2), 129-142.
National Profile on Occupational Safety and Health – Kenya (2013). Available
online at http://www.ilo.org/publns
Ndirangu, M. W. & Namusonge, G. S. (2014). Factors influencing implementation
of occupational health and safety: A case study of Kenya vehicle

79
manufacturers in Thika. International Journal of Social Sciences and
Entrepreneurship, 1 (11), 606-619.
Nelson, D. I. & Schwela, D. (2001).Occupational Exposure to Noise: Evaluation,
Prevention and Control (ed.).WHO. Occupational and Environmental Health.
Geneva, Switzerland, 183-196.
Neitzel, R. (2004). Contribution of Non Occupational activities to total noise
exposure of construction workers. British Occupational hygiene society.
Oxford University press. Ann. Occup.Hyg., 48,463-473.
NIOSH (2001). National Occupational Research Agenda for Musculoskeletal
Disorders. Appendix A, retrieved from www.cdc.gov/niosh/homepage.html
O’Toole, M., (2002).The relationship between employees’ perceptions of safety and
organizational culture. Journal of Safety Research 33, 231–243.
Oxenburgh, M., Marlow, P., & Oxenburgh, A. (2005). Increasing productivity
and profit through health and safety. The financial returns from a safe
working environment. (2nd ed.). Boca Raton, FL: CRC Press.
Parker, D., Brosseau, L., Samant, Y., Pan, W., Xi, M. & Haugan, D. (2007), A
comparison of the perceptions and beliefs of workers and owners with regard
to workplace safety in small metal fabrication businesses. American Journal
of Industrial Medicine. 50, 999- 1009
Saiyed, H. N & Tiwari, R. R (2004). Occupational Health Research in India.
Industrial Health 42, 141–148.
Seidler, A. (2001). The role of cumulative physical work load in lumbar spine
disease: risk factors for lumbar osteochondrosis and spondylosis associated
with chronic complaints. Occupational and Environmental Medicine, 58(11),
735-746 retrieved from http://dx.doi.org/10.1136/oem.58.11.735
Scoel SUM, (2008). Recommendation from the Scientific Committee on
Occupational Exposure Limits for Flour Dust: SCOEL/SUM/123, 37.
Smith T. A, Parker, J & Hussian, T (2000). Respiratory symptoms and wheat flour
exposure: a study of flour millers. Occupational Medicine (Lond). 50:25-9.
Towers B (2003). The Handbook of Employment Relations: Laws and Practice (4th
edition). Kogan Page: London.

80
Truchon, M. & Fillion, L. (2000). Bio psychosocial Determinants of Chronic
Disability and Low-Back Pain: A Review. Journal of Occupational
Rehabilitation. 10, 117-142.
Vanhanen M., (2000). Exposure, Sensitization and Allergy to Industrial Enzymes.
Doctoral Thesis. People and Work Research Reports; 58-60.
Wagh, N. D., Pachpandy, B. J., Patel, V. S., Attarde, S. B.,Ingle, S. T (2006). The
influence of workplace environment on lung function of flour mill workers in
Jalgaon urban centre. Journal of occupational health. 48, 396-401.
Walsh B.J, Wrigley C.W, Musk A.W & Baldo B.A.(2003). A comparison of the
binding of IgE in the sera of patients with bakers' asthma to soluble and
insoluble wheat-grain proteins. J Allergy Clin Immunol; 76, 23-28.
Yiquan et al. (2012), Singapore Workplace Safety and Health Research Agenda.
Journal of Safety, Health and Environmental Research, 8(1). 22-29
Zuskin, E., Kanceljak, B., Mustajbegovic, J., Schachter, E, N. (1994b).
Immunologic findings in confectionary workers. Ann Allergy; 73,521-526.

81
APPENDICES
Appendix 1:Written Consent Form
Dear respondent,
Hallo to you. My name is Wilson Baru Wachira, a student at Jomo Kenyatta
University of Agriculture and Technology. I am carrying out an occupational safety
and health study on management staff, and the workers. I would like to inform you
about the study using this form as I request you to participate in it.
Title of the Study
‘An assessment of Occupational Safety and Health Hazards in flour milling
companies in Nairobi County”
Purpose
It is to collect and analyze information about the health and safety hazards in flour
milling companies. This is in order to ensure that they have a safe and healthy
working environment like every other employee as stipulated by the Occupational
Safety and Health Act 2007 (OSHA, 2007).
Inconveniences or risks
You will be inconvenienced with your time since the researcher will need you to
respond to some questions on a questionnaire. It will take about 10 - 15 minutes at a
convenient time to allow minimal interruption in doing your work. No other potential
risks are foreseen.
Benefits: You will not get direct benefit as an individual however your participation
will contribute to the improvement of occupational safety and health provisions in
your workplace.
Alternatives: Your participation in this study is voluntary. You are free to ask
questions to the main researcher before you consent to participate or any other time
at will as they arise. You are also free to withdraw from the study if necessary
without any consequences. However, it will be useful to complete it.

82
Confidentiality: All the information in the questionnaire and files will be held in
confidence. At the end of the study there will be no way to link your name with the
data. It will be labelled by study code number and kept in lockable cabinets and only
the research staff will have access. Any additional information will be provided to
you including the final results
Costs: There is no financial cost to participate in this study.
Questions: If you have any questions, you can ask at the moment; ----------------------
-------------
If you do not have any question at the moment and yet a question may arise later; I
do hereby provide you with the contacts that you can use to have any arising maters
solved.
Contact:
If you get any questions or concerns about the study or in the event of the study:
please contact the principal investigator and/or the representative on; Telephone
numbers: 0720 312 257/0735 966 374; P. O. Box 56159-00200-00100, Nairobi;
email address: [email protected]
For any questions concerning your rights as a research participant, please contact:
The Secretary, JKUAT Ethics Review Committee, P. O. Box 62000- 00200,
Nairobi; Telephone numbers:
Should you agree to participate in this study about;
‘‘An assessment of occupational safety and health hazards in flour milling
companies in Nairobi County”
Then I do request you to fill a questionnaire attached. It includes; personal
information regarding your area of work either, management, workshop etc
.

83
If you are in agreement to participate in this study, please sign your name below,
indicating that, you have read and understood the nature of the study, your
responsibilities as a study participant, the inconveniences associated with voluntary
participation in the study as well as an indication that all your concerns regarding the
study have been addressed satisfactorily.
Subject’s statement
I have been clearly explained to about this study of; ‘An assessment of occupational
safety and health hazards in flour milling companies in Nairobi County’
I volunteer to participate in it. I have a chance to still ask questions about it in future
if I get any using the contacts I have been given.
I do accept to participate in this study
------------------------------------------------------------
Name and Signature of study participant and Date
-------------------------------------------------------------------
Name and Signature of person obtaining Consent and Date -----------------
-------------
--------------------------------------------------------------- Thumbprint of
participant

84
Appendix 2: Questionnaire for Workers
Survey ID number: ……………………………..
Name of interviewer: …………………………...
Date of interview: ………………… Time started: ……………. Time finished:
……………..
Company: ………………………….
………………….……………………………………….....
Complete address of contact:
……………………………………………………………………
Good morning/ afternoon. My name is Wilson Baru Wachira, REG NO:
EET32/2174/2011and I am from Jomo Kenyatta University of Agriculture and
technology. I am currently conducting research on the ‘‘An assessment of
occupational safety and health hazards in flour milling companies in Nairobi
County”
The purpose of this study is to assess the occupational safety and health hazards in
flour milling companies. This survey is undertaken by the Jomo Kenyatta University
of Agriculture and technology/ IEET (Institute for energy and environmental
technology). It is for research and academic purposes only. I personally assure you
that your answers will always be kept strictly confidential and never be revealed to
any other person. The only thing I am requesting from you is that you answer the
questions truthfully, in your best possible way, and to the best of your knowledge. If
you cannot answer some questions, simply say so.
SECTION A: GENERAL INFORMATION OF RESPONDENT
Please Tick one
1. Gender

85
Male Females
2. Highest level of education
Primary school Secondary school Diploma
Bachelors Degree Masters Degree
3. For how long have you worked in this company?
0- 1year 2 to 3 years 3 to 5 years over 5 years
MANAGEMENT OF SAFETY AND HEALTH
1. Does the workplace have an elaborate health and safety policy
Yes No
2. If yes above (1)Has the policy been communicated to all stakeholders?
Yes No
3. How is the policy communicate
Induction training
Posters
Safety and health manuals
Safety and health committee
Management meetings
Others, Specify_____________
4. Do you have a training program on safety and health?
Yes No
5. Does the training program cover the management
Yes No
6. Does induction program incorporate health and safety issues?
Yes No
7. Which of the following comes first when planning your work?
Production Health and safety of workers
Compliance
8. Are the PPE provided to the workers adequate?
Yes No
9. Are workers trained on proper use and maintenance of the PPE?

86
Yes No
10. Which of the following best describes how PPE are replaced?-------------------
----------------------------------
As soon as they are worn out
Every month
Every six months
On workers request
11. Do the workers go through occupational medical examinations
Yes No
12. Which hazards are present at the workplace?
High noise levels
Unguarded machines
Heavy loads
Poor housekeeping
Excessive vibration
Dust
Welding fumes
Glare from welding
Others, specify___________________
13. Does the workplace conduct the following?
Health and safety audit Yes No
Health and safety risk assessment Yes No
Noise survey Yes No
Dust survey Yes No
Fire safety audit Yes No
14. How often are they conducted?
Every six months
Every year
Every two years
Not defined

87
Other, specify _________________
15. If yes are they conducted by qualified persons?
Yes No
16. Are all accidents reported and investigated
Yes No
17. To whom are accidents reported
Human resource office
Trained first aiders
Health and safety officer
18. Does the workplace have hazard control measures?
Yes No
19. What do you think can be done to improve on the work environment?
Prioritise safety and health issues
Ensure machines are guarded
Train workers on safe work practices
Maintain good housekeeping
Provide mechanical aids for lifting
Provide workers with PPE
Package grains in smaller bags
Other,specify________________
End
Thank you very much / Asante sana

88
Appendix 3: Questionnaire for management staffs
Survey ID number: ……………………………..
Name of interviewer: …………………………...
Date of interview: ………………… Time started: ……………. Time finished:
……………..
Company: ………………………….
………………….……………………………………….....
Complete address of contact:
……………………………………………………………………
Good morning/ afternoon. My name is Wilson Baru Wachira, REG NO:
EET32/2174/2011and I am from Jomo Kenyatta University of Agriculture and technology. I
am currently conducting research on the ‘‘An assessment of occupational safety and health
hazards in flour milling companies in Nairobi County”
The purpose of this study is to assess the occupational safety and health hazards among
workers in flour milling companies. This survey is undertaken by the Jomo Kenyatta
University of Agriculture and technology/ IEET (Institute for energy and environmental
technology). It is for research and academic purposes only. I personally assure you that your
answers will always be kept strictly confidential and never be revealed to any other person.
The only thing I am requesting from you is that you answer the questions truthfully, in your
best possible way, and to the best of your knowledge. If you cannot answer some questions,
simply say so.
SECTION A: GENERAL INFORMATION OF RESPONDENT
Please Tick one
1. Gender
Male Female
2. Highest level of education
Primary school Secondary school Diploma
Bachelors Degree Masters Degree
3. Marital status
4. Single Married Divorce Widowed
5. For how long have you worked in this company?

89
0- 6months 6 months to 1 year over 1 year
6. How many hours do you work on average per day?
8 hours over 8 hours
7. If you work for more than 8 hrs, are you paid overtime
Yes No
SE CTION B: SAFETY AND HEALTH ISSUES
1. Did you go for medical examinations before joining the company
Yes No
2. Were you informed of the company’s health and safety policy when joining the
workplace?
Yes No
3. Were you trained on safety and health when joining the workplace
Yes No
4. Does the workplace produce high noise levels? (If no go to question 8)
Yes No
5. If yes ,Is the noise
Too loud Tolerable
6. What are the sources of the noise?
Milling machines Heavy machinery Others,
specify__________________
Workshop activities Vehicles
7. Where noise levels are high, are safety and health information like high noise levels,
use PPE provided
Yes No
8. Have you ever been injured while at work
Yes No (if no go to question 14)
9. If yes, what was the nature of the injury?
Cuts
Dislocation
Electrocution
Burns
Being struck by sharp objects

90
Other, specify_____________________________
How many days did you stay out of work as a result of the injury
0days 1-7days 8-15days 16-21days
22-28days More than 28days
10. What caused the injury
Unguarded machine Carrying Heavy Load Slippery floor
Uninsulated electrical cables repairing a machine when power is on
Other ____________________________
11. Are you aware of any accidents in the last six months?
Yes No
12. If yes, what happened?
Worker was injured by an unguarded machine
Worker was electrocuted
Worker tripped and fell when carrying a heavy load
Worker was cut by a sharp object
Worker was burnt by a hot object
Other, specify______________________
13. To who do you report any injuries
Supervisor Health and safety officer
Human Resource Office Trained first aider
14. Are the reported injuries/accidents investigated
Yes No
15. Are there trained first Aiders at the workplace
Yes No
16. Do you think you are assigned adequate supervision to ensure work is done right
Yes No
17. Have you been trained on the safety and health hazards you are exposed to
Yes No
18. Are you aware of any deaths within the workplace or related to operations in this
workplace?
Yes No
19. If yes, what was the cause?

91
Accidents Health problems related to flour milling
20. Do you experience problems related to flour dust?
Yes No
21. If yes, which ones?
Wheezing
Coughs
Blocked chest
22. Do you suffer from a condition that you have reason to believe has resulted from
what you do?
Yes No
If yes, which best describes the condition
Respiratory complication
Low back problems
Pain on joints
Eye problems
22. Have you ever been trained on safety and health?
Yes No
23. If yes, when was the training conducted
Last week Last month Last 3months Last 6months
Last 12 months more than year ago can’t remember
24. If Yes, Who did the training?
Health and safety committee health and safety officer External trainers
25. Do you receive regular health and safety information
Yes No
26. How is the message delivered
Posters
Memos
Meetings
Health and safety committee
Others, specify______________________________
Have you been provided with Personal Protective Equipment (PPE)
Yes No
27. If Yes, which ones?

92
Ear Muffs/ plugs Safety shoes
Gloves Goggles
Aprons Dust Masks
28. Do you use the protective equipment provided?
Yes No
29. If no, why
They are uncomfortable I don’t find them helpful
They don’t provide any protection Don’t know how to use them
They are not suitable Others, specify_____________________
30. Have you been trained on proper use and maintenance of PPE
Yes No
31. Have you ever undergone any occupational medical examinations?
Yes No
32. If yes, when
Last six months last one year more than one year ago
33. Do you use any mechanical aid for lifting loads?
Yes No
34. Are sanitary facilities provided?
Yes No ----
35. According to you what do you think constitute workplace hazards
High noise levels
Unguarded machines
Heavy loads
Poor housekeeping
Excessive vibration
Dust
Welding fumes
Glare from welding
Other, specify_________________________
36. In your opinion, do you think working in this workplace is safe?
Yes No
37. If No, what do you think can be done to improve safety and health conditions?
Ensure machines are guarded

93
Train workers on safe work practices
Maintain good housekeeping
Provide mechanical aids for lifting
Provide workers with PPE
Package grains in smaller bags
Other, specify___________________________________________
End
Thank you very much / Asante Sana

94
Appendix 4:Observation Checklist on Occupational Health and Safety.
Name of flour milling company: Checklist No.
(O)Satisfactory
(X) Unsatisfactory Action
Location Condition Comments
Safety and health information
Is the safety and health policy conspicuously posted at the
workplace
Are SOP conspicuously posted at the workplace
Is adequate instruction in the use of personal protective
equipment provided?
Is the OSHA,2007 abstract posted
Work Process
Are the material safety data sheets placed in locations
accessible to all employees?
Are hazards signaled by signs and tags?
Are lockout or tagout procedures in place and followed?
Is ventilation equipment working effectively?
Is the fume and dust collection hood working effectively?
Fire Emergency Procedures
Is there a clear fire response plan posted for each work area?
Do all workers know the plan?
Are drills held regularly?
Are fire extinguishers chosen for the type of fire most likely
in that area?
Are there enough extinguishers present to do the job?
Are extinguisher locations conspicuously marked?
Are extinguishers properly mounted and easily accessible?
Are all extinguishers fully charged and operable?
Are special purpose extinguishers clearly marked?
Means of Exit
Are there enough exits to allow prompt escape?

95
Do employees have easy access to exits?
Are exits unlocked to allow egress?
Are exits clearly marked?
Are exits and exit routes equipped with emergency lighting?
Loading/Unloading Racks
Are steps, railings and retractable ramps on raised platforms
in good repair?
Is the general condition of wiring and junction boxes, etc. in
good condition (visual inspection)?
Lighting
Is the level of light adequate for safe and comfortable
performance of work?
Does lighting produce glare on work surfaces, monitors,
screens and keyboards?
Is emergency lighting adequate and regularly tested?
Machine Guards
Are all dangerous machine parts adequately guarded?
Do machine guards meet standards?
Are lockout procedures followed when performing
maintenance with guards removed?
Electrical
Is the Electrical Code adhered to in operation, use, repair and
maintenance?
Are all machines properly grounded?
Are portable hand tools grounded or double insulated?
Are junction boxes closed?
Are extension cords out of the aisles where they can be
abused by heavy traffic?
Is permanent wiring used instead of extension cords?
Tools and Machinery
Are manufacturers' manuals kept for all tools and
machinery?

96
Are tools properly designed for use by employees?
Are defective tools and machines tagged and removed from
service as part of a regular maintenance program?
Are tools and machinery used so as to avoid electrical
hazards?
Is proper training given in the safe use of tools and
machinery?
Confined Spaces
Are the confined space procedures and training available and
followed by all involved?
Are entry and exit procedures adequate?
Are emergency and rescue procedures in place (e.g. trained
safety watchers)?
Housekeeping
Is the work area clean and orderly?
Are floors free from protruding nails, splinters, holes and
loose boards?
Are aisles and passageways kept clear of obstructions?
Are permanent aisles and passageways clearly marked?
Are covers or guardrails in place around open pits, tanks and
ditches?
Stairs, Ladders and Platforms
Are stairs and handrails in good condition?
Are ladders free of defects?
Are ladders set up properly before use?
Are the elevated platforms properly secured and do they
have handrails?
Sound Level/Noise
Is hearing protection available and used properly?
Employee Facilities
Are facilities kept clean and sanitary?
Are facilities in good repair?

97
Are hand washing facilities available?
Medical and First Aid
Are the names of the employees trained as first-aid
practitioners on each shift worked posted?
Are first-aid kits provided as per jurisdiction’s first-aid
regulations?
Are first-aid supplies replenished as they are used?
Personal Protective Equipment (PPE)
Is required equipment provided, maintained and used?
Is personal protection utilized only when it is not reasonably
practicable to eliminate or control the hazardous substance or
process?
Are the areas requiring PPE usage properly identified by
warning signs?
Materials Handling and Storage
Is there safe clearance for all equipment through aisles and
doors?
Is stored material stable and secure?
Are storage areas free from tipping hazards?
Do personnel use proper lifting techniques?
Is the size and condition of containers hazardous to workers?
Are elevators, hoists, conveyors, etc., properly used with
appropriate signals and directional warning signs?
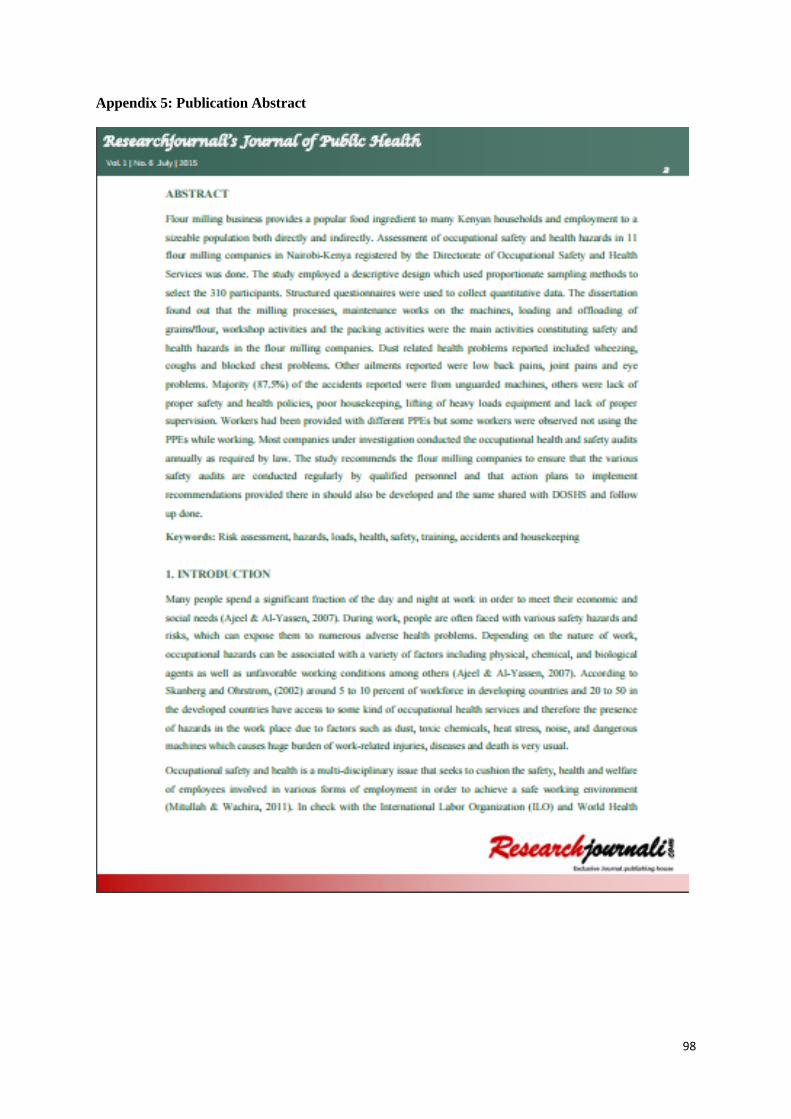
98
Appendix 5: Publication Abstract

99
Appendix 6: Publication Certificate