status none availavle lithology log none ... cross-section is located approximately 50 m upstream of...
TRANSCRIPT

WIN Site Id Site Type Site Site Geo AWRC AWRC AWRC Name AQWAB AQWAB AQWAB Asset Data Owner Region Zone Easting Northing Longitude Latitude Geographic Geographic Geographic Land Location 1:250,000 Location Geophysica Sketch Ind River Basin Aquifers Win 20003001 Ground Borehole or WGround 70111167 701 - GREENBORE 1840-4-SW-0004 701 - GREEN No Current Ow (none). 50 267282 6823935 114.618120433 -28.690910958 Geodetic Datu100 GDA94 ConveVictoria 1840-4 SH50-1 5805 N N 701 - GreenouDWAID= noneNO. 575
GRID D120003008 Ground Unknown Ground 70113643 701 - GREENWS 4 1840-4-SW-0011 701 - GREENWS 4 No Current Ow (none). 50 267673 6824634 114.622262024 -28.684677287 Geodetic Datu100 GDA94 ConveVictoria 1840-4 SH50-1 N N 701 - GreenouDWAID= noneINFORMATION20003009 Ground Unknown Ground 70113644 701 - GREENWS 5 1840-4-SW-0012 701 - GREENWS 5 No Current Ow (none). 50 267532 6823998 114.620690242 -28.690387784 Geodetic Datu100 GDA94 ConveVictoria 1840-4 SH50-1 N N 701 - GreenouDWAID= noneTOMATO IRRIGATION20003010 Ground Unknown Ground 70113645 701 - GREENWS 6 1840-4-SW-0013 701 - GREENWS 6 No Current Ow (none). 50 267675 6823374 114.622025558 -28.696041123 Geodetic Datu100 GDA94 ConveVictoria 1840-4 SH50-1 N N 701 - GreenouDWAID= noneINFORMATION
WIN Site Id Numbering Reference Zone Easting Northing Longitude Latitude Datum Elevation Elevation Elevation Margin Of Measureme Date Date Colloquial Name Comment20003001 AWRC 70111167 50 267282 6823935 114.618120433 -28.690910958 Not ApplicableGround level = 0.000 (none) 1000-01-01 0 Unknown
20003008 AWRC 70113643 50 267673 6824634 114.622262024 -28.684677287 Not ApplicableGround level = 0.000 (none) 1000-01-01 0 Unknown
20003009 AWRC 70113644 50 267532 6823998 114.620690242 -28.690387784 Not ApplicableGround level = 0.000 (none) 1000-01-01 0 Unknown
20003010 AWRC 70113645 50 267675 6823374 114.622025558 -28.696041123 Not ApplicableGround level = 0.000 (none) 1000-01-01 0 Unknown
WIN Site Id Numbering Reference Zone Easting Northing Longitude Latitude Start Date End Date Date Cons. Developed Depth Drilled Drilled Drill Method Pump How Test20003001 AWRC 70111167 50 267282 6823935 114.618120433 -28.690910958 1000-01-01 0 Unknown Authority Not Ground level = 6.096 (none)
20003008 AWRC 70113643 50 267673 6824634 114.622262024 -28.684677287 1000-01-01 0 Unknown Authority Not Ground level = 20.200 (none)
20003009 AWRC 70113644 50 267532 6823998 114.620690242 -28.690387784 1000-01-01 0 Unknown Authority Not Ground level = 3.600 (none)
20003010 AWRC 70113645 50 267675 6823374 114.622025558 -28.696041123 1000-01-01 0 Unknown Authority Not Ground level = 3.200 (none)
WIN Site Id AWRC Ref Site Default Site Default Site Default Collected Collect Time Collect Date Collect Collect Year Sample Id Group Code Project Sample Collection Sample Sample Depth M Sample Depth Sample Frequency Sample Borehole TDSolids 20003001 70111167 70111167 701 - GREENBORE 1000-01-01 0 00:00:00 01/01/1000 01 1000 20003780 WIN SAMP C UNKNOWN Field Unknown metST_STAND Water sampleUnknown (none) 3575
20003008 70113643 70113643 701 - GREENWS 4 1000-01-01 0 00:00:00 01/01/1000 01 1000 20003787 WIN SAMP C UNKNOWN Field Unknown metST_STAND Water sampleUnknown 3700
20003009 70113644 70113644 701 - GREENWS 5 1000-01-01 0 00:00:00 01/01/1000 01 1000 20003788 WIN SAMP C UNKNOWN Field Unknown metST_STAND Water sampleUnknown 940
20003010 70113645 70113645 701 - GREENWS 6 1000-01-01 0 00:00:00 01/01/1000 01 1000 20003789 WIN SAMP C UNKNOWN Field Unknown metST_STAND Water sampleUnknown 1180
STATUS NONE AVAILAVLE
DATUMS
SUMMARY LOG NONE AVAILAVLE
CONSTRUCTION
SITE DETAILS
WATER QUALITY
LITHOLOGY LOG NONE AVAILAVLE

AECOM
Glenfield Beach Local Structure Plan
Glenfield Beach Development-
26 September 2012
Appendix C
Geological Logs

AECOM
Glenfield Beach Local Structure Plan
Glenfield Beach Development-
26 September 2012
c-1
Appendix C Geological Logs


AECOM
Glenfield Beach Local Structure Plan
Glenfield Beach Development-
26 September 2012
Appendix D
Dolby Creek Flood Study

AECOM
Glenfield Beach Local Structure Plan
Glenfield Beach Development-
26 September 2012
d-1
Appendix D Dolby Creek Flood Study

Glenfield Beach Estate Development
26 September 2012
60213509-RPER-0001
Dolby Creek Flood Study

AECOM
Glenfield Beach Estate Development
Dolby Creek Flood Study
26 September 2012
Dolby Creek Flood Study
Prepared for
Prepared by
AECOM Australia Pty Ltd
3 Forrest Place, Perth WA 6000, GPO Box B59, Perth WA 6849, Australia
T +61 8 6208 0000 F +61 8 6208 0999 www.aecom.com
ABN 20 093 846 925
26 September 2012
60213509
AECOM in Australia and New Zealand is certified to the latest version of ISO9001 and ISO14001.
© AECOM Australia Pty Ltd (AECOM). All rights reserved.
AECOM has prepared this document for the sole use of the Client and for a specific purpose, each as expressly stated in the document. No other
party should rely on this document without the prior written consent of AECOM. AECOM undertakes no duty, nor accepts any responsibility, to any
third party who may rely upon or use this document. This document has been prepared based on the Client’s description of its requirements and
AECOM’s experience, having regard to assumptions that AECOM can reasonably be expected to make in accordance with sound professional
principles. AECOM may also have relied upon information provided by the Client and other third parties to prepare this document, some of which
may not have been verified. Subject to the above conditions, this document may be transmitted, reproduced or disseminated only in its entirety.

AECOM
Glenfield Beach Estate Development
Dolby Creek Flood Study
26 September 2012
Quality Information
Document Dolby Creek Flood Study
Ref 60213509
Date 26 September 2012
Prepared by Darryn Knoesen / Martin Boshoff
Reviewed by Ross Perrigo
Revision History
Revision Revision
Date Details
Authorised
Name/Position Signature
A 5-Sep-2011 For Client Review Mark Pearcey
Principal Hydrologist
B 11-Jul-2012 For Client Review. Flood
model reviewed to reflect
changes in development
layout. Levee details added.
Todd Hodgkin
Principal
Hydrogeologist
0 18-Jul-2012 Final for Client Issue Todd Hodgkin
Principal
Hydrogeologist
1 26-Sep-2012 Addendums & Revised LSP Chris Edwards
Geraldton Office
Manager

AECOM
Glenfield Beach Estate Development
Dolby Creek Flood Study
26 September 2012
Table of Contents
1.0 Introduction 1 2.0 Description of the Existing Hydraulic Model 1 3.0 Short-comings of the Existing Hydraulic Model 1 4.0 Extension of the Existing Hydraulic Model 1 5.0 Hydraulic Modelling Results 2 6.0 Proposed Flood Protection Details 5 7.0 Concluding Discussion 6 8.0 Flood Study Addendums 7
Appendix A Flood Study Addendums A
List of Figures
Figure 1 100 year ARI floodplain for the existing conditions 3 Figure 2 100 year ARI floodplain for the post-development scenario 4 Figure 3 Typical Levee Cross Section* 5

AECOM
Glenfield Beach Estate Development
Dolby Creek Flood Study
26 September 2012
1
1.0 Introduction
Glenfield Beach is located within the City of Greater Geraldton, approximately 10 km north of the Geraldton CBD.
AECOM was commissioned by Whelans to undertake a flood study of Dolby Creek for the Glenfield Beach Estate
development. Dolby Creek forms the eastern boundary of the proposed development and flows in a southerly
direction parallel to Chapman Road. The environmentally significant “Rum Jungle” area is located immediately
south of Glenfield Beach Drive and would at one time have been a continuation of Dolby Creek.
Development is proposed on Lot 1001 at Glenfield Beach and this will potentially alter the existing flood regime in
Dolby Creek. Additional flood modelling is required on Dolby Creek, south of Glenfield Beach Drive to assess the
impact of the proposed development on water levels in the ‘Rum Jungle’.
2.0 Description of the Existing Hydraulic Model
The Department of Water has previously undertaken flood modelling of Dolby Creek using a 1D HEC-RAS
hydraulic model. The HEC-RAS model provided to AECOM by the Department of Water (DoW) comprises cross-
sections of the Dolby Creek and its floodplain spanning an approximate 1 km section along the Dolby Creek. The
first cross-section is located approximately 50 m upstream of the two 3 m x 2.7 m box culverts through which the
Dolby Creek flows beneath Chapman Road. The last cross-section is located immediately north of Glenfield
Beach Drive and west of Chapman Road.
The DoW hydraulic modelling was undertaken for the 100yr ARI design event. The DoW advised AECOM that the
100 year ARI design peak discharge was previously determined to be 30 m3/s. The DoW set the upper and lower
boundary conditions to “normal depth’ and “known water surface levels”, respectively. The normal depth was
based on a slope of 0.01254 m/m. The known water surface level for the downstream boundary condition was set
to 3.65 m for a flow of 30 m3/s; based on the existing road (Glenfield Beach Drive) levels, while observations
during/following the 2008 flood event provided some confirmation in the validity of the level adopted (Personal
Communication, 2011).
The DoW model was constructed with a levee on the eastern floodplain such that flow is prevented from leaving
the lot boundary. Furthermore, cross-sections with chainages spanning form -80 m to -390 m appear to be
hypothetical cross-sections rather than surveyed cross-sections.
3.0 Short-comings of the Existing Hydraulic Model
A review of the existing hydraulic model for the study area revealed two short-comings:
- The hypothetical cross-sections do not adequately represent the floodplain north of Glenfield Beach Drive.
- The extent of the existing model does not allow for the assessment of post-development impacts, if any,
south of Glenfield Beach Drive.
4.0 Extension of the Existing Hydraulic Model
The HEC-RAS model was used to assess the impact of modifications to the flow path upstream of Glenfield
Beach Drive on water levels and velocities upstream and downstream of Glenfield Beach Drive. To increase the
accuracy of the simulations, the hydraulic model geometry (cross-sections; flow paths; levees; culverts) was input
into ArcMap utilising HEC-GeoRAS. This allowed for the cross-section elevations to be extracted from a Digital
Terrain Model (DTM), which was derived from LiDAR data, as well as geo-referencing all components of the
geometry. This data was subsequently exported for use in the HEC-RAS model for hydraulic modelling of the
previously calculated 100 year ARI peak discharge (30 m3/s). Review of the design peak discharge falls out with
the scope of this flood study and as such the peak flow of 30 m3/s was left unchanged within the model.
The adopted roughness coefficients (Manning’s n) that were used throughout the hydraulic model were 0.035 for
the main channel (and areas clear of any vegetation or obstructions) and 0.1 for the floodplain. There is no clear
channel south of Barnacle Road. Consequently, the entire lengths of the cross-sections south of Barnacle Drive
have been allocated a Manning’s n of 0.10.

AECOM
Glenfield Beach Estate Development
Dolby Creek Flood Study
26 September 2012
2
The upper boundary condition remained set at normal depth with a slope = 0.01254 m/m, while the revised
downstream boundary condition for the extended HEC-RAS model was set as the critical depth.
As there was no LiDAR topographical data available north of Barnacle Road, the surveyed cross-sections used in
the existing DoW model were applied.
Once the hydraulic modelling was completed, the resultant flood levels were imported into ArcMap in order to
delineate the 100 year ARI floodplain across the project area.
A potential post-development option was also investigated by including the following features in the model:
- Using natural high-points identified from the DEM a levee was positioned north of Glenfield Beach Drive on
the west bank to investigate what the potential impacts of flood-proofing the land earmarked for future
development.
- A levee was also positioned immediately downstream of Glenfield Beach Drive on the west bank to mimic
the planned access road. The access road is to be raised above the design flood level to prevent flood risk
to three new development lots.
5.0 Hydraulic Modelling Results
Modelling results from the extension of the hydraulic model south of Glenfield Beach Drive (Figure 1) indicate that
the original boundary condition at Glenfield Beach Drive adopted by the DoW for the 100 year ARI design event
(3.65 mAHD) is acceptable, with a modelled water level of 3.66 mAHD. This water level highlights that in a
100 year ARI event water will flow over Glenfield Beach Drive to the ‘Rum Jungle’ area. However, with no culverts
under Glenfield Beach Drive, events smaller than the 100 year ARI event are unlikely to contribute to flows
downstream of the road.
Water levels and velocities upstream of Glenfield Beach Drive, away from the more channelized area of Dolby
Creek, are typically low. Similarly, water depths in the ‘Rum Jungle’ area are also low, typically in the order of
0.5 m, with low velocities of between 0.12 and 0.42 m/s. Modelling results indicate that for a 100 year ARI event,
water will break out from Dolby Creek and over parts of Chapman Road south of Glenfield Beach Drive. Flooding
depths of up to 0.3m are expected on Chapman Road during the design flood event, assuming that no kerbs or
other flood protection measures are present protecting the road.
With no culverts under Glenfield Beach Drive allowing water to pass to the south the road embankment effectively
operates as a dam. Even in frequent flow events water is likely to be retained to the north of Glenfield Beach
Drive.
A proposed development scenario was assessed where levees were added upstream and downstream of
Glenfield Beach Drive respectively to allow for development free from unacceptable flood risk. Under this
scenario:
- Water levels in the area upstream of Glenfield Beach Drive near the proposed levee increase in the order of
0.35 m with the maximum increase of 0.57 m. Post-development velocities north of Glenfield Beach Drive
increase by up to 0.36 m/s.
- South of Glenfield Beach Road (adjacent to the proposed raised access road only) velocities are likely to
increase by 0.01 m/s which is considered negligible. However, there are no changes to the estimated flood
water levels as a result of the modelled development (Figure 2).

AECOM
Glenfield Beach Estate Development
Dolby Creek Flood Study
26 September 2012
3
Figure 1 100 year ARI floodplain for the existing conditions

AECOM
Glenfield Beach Estate Development
Dolby Creek Flood Study
26 September 2012
4
Figure 2 100 year ARI floodplain for the post-development scenario
AECOM
Glenfield Beach Estate Development
Dolby Creek Flood Study
26 September 2012
5
6.0 Proposed Flood Protection Details
The baseline flood mapping identified the following flood protection requirements to ensure that the proposed
development is free from unacceptable flood risk:
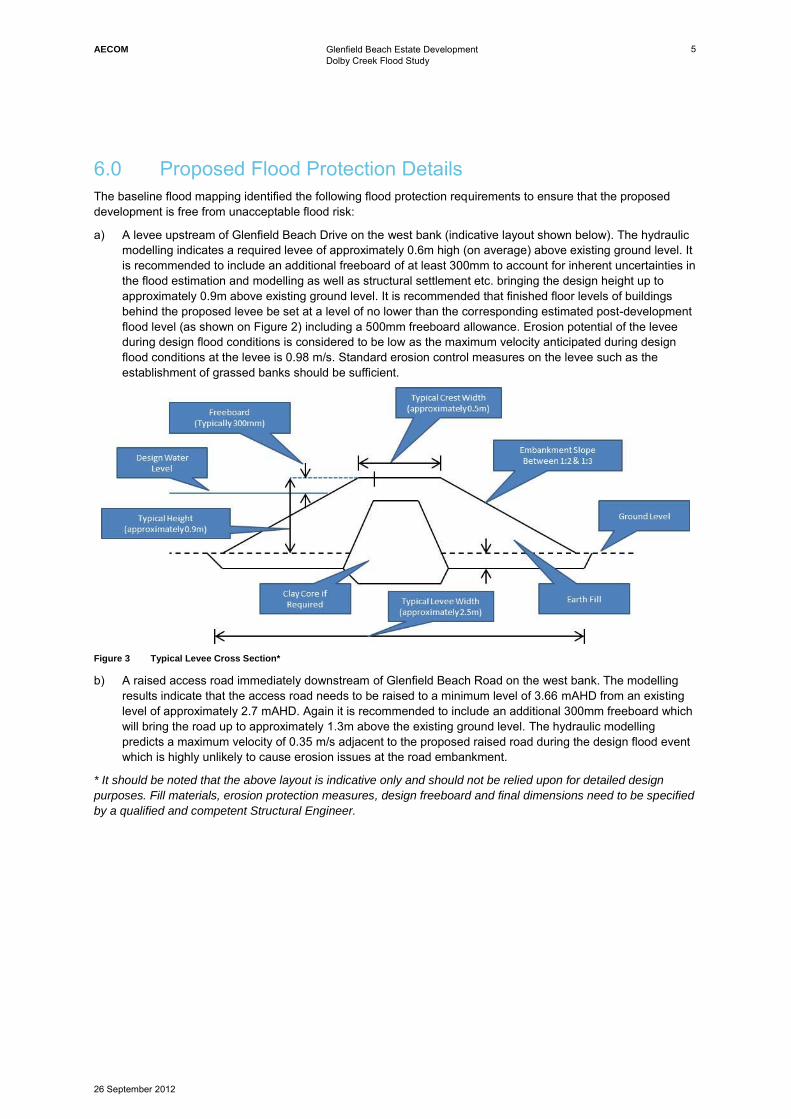
a) A levee upstream of Glenfield Beach Drive on the west bank (indicative layout shown below). The hydraulic
modelling indicates a required levee of approximately 0.6m high (on average) above existing ground level. It
is recommended to include an additional freeboard of at least 300mm to account for inherent uncertainties in
the flood estimation and modelling as well as structural settlement etc. bringing the design height up to
approximately 0.9m above existing ground level. It is recommended that finished floor levels of buildings
behind the proposed levee be set at a level of no lower than the corresponding estimated post-development
flood level (as shown on Figure 2) including a 500mm freeboard allowance. Erosion potential of the levee
during design flood conditions is considered to be low as the maximum velocity anticipated during design
flood conditions at the levee is 0.98 m/s. Standard erosion control measures on the levee such as the
establishment of grassed banks should be sufficient.
Figure 3 Typical Levee Cross Section*
b) A raised access road immediately downstream of Glenfield Beach Road on the west bank. The modelling
results indicate that the access road needs to be raised to a minimum level of 3.66 mAHD from an existing
level of approximately 2.7 mAHD. Again it is recommended to include an additional 300mm freeboard which
will bring the road up to approximately 1.3m above the existing ground level. The hydraulic modelling
predicts a maximum velocity of 0.35 m/s adjacent to the proposed raised road during the design flood event
which is highly unlikely to cause erosion issues at the road embankment.
* It should be noted that the above layout is indicative only and should not be relied upon for detailed design
purposes. Fill materials, erosion protection measures, design freeboard and final dimensions need to be specified
by a qualified and competent Structural Engineer.