status and trends of the rainbow trout population in the ... · graph showing mean catch per unit...
TRANSCRIPT

U.S. Department of the InteriorU.S. Geological Survey
Scientific Investigations Report 2011–5015
Prepared in cooperation with the Arizona Game and Fish Department
Status and Trends of the Rainbow Trout Population in the Lees Ferry Reach of the Colorado River downstream from Glen Canyon Dam, Arizona, 1991–2009

Cover. Two anglers and a river guide fly fishing for rainbow trout (Oncorhynchus mykiss) at Lees Ferry, Arizona (Photograph courtesy of Rory Aikens, Arizona Game and Fish Department. Used with permission).

Status and Trends of the Rainbow Trout Population in the Lees Ferry Reach of the Colorado River downstream from Glen Canyon Dam, Arizona, 1991–2009
By Andrew S. Makinster, William R. Persons, and Luke A. Avery
Prepared in cooperation with the Arizona Game and Fish Department
Scientific Investigations Report 2011–5015
U.S. Department of the InteriorU.S. Geological Survey

U.S. Department of the InteriorKEN SALAZAR, Secretary
U.S. Geological SurveyMarcia K. McNutt, Director
U.S. Geological Survey, Reston, Virginia: 2011
For more information on the USGS—the Federal source for science about the Earth, its natural and living resources, natural hazards, and the environment, visit http://www.usgs.gov or call 1–888–ASK–USGS.
For an overview of USGS information products, including maps, imagery, and publications, visit http://www.usgs.gov/pubprod
To order this and other USGS information products, visit http://store.usgs.gov
Any use of trade, product, or firm names is for descriptive purposes only and does not imply endorsement by the U.S. Government.
Although this report is in the public domain, permission must be secured from the individual copyright owners to reproduce any copyrighted materials contained within this report.
Suggested citation:Makinster, A.S., Persons, W.R., and Avery, L.A., 2011, Status and trends of the rainbow trout population in the Lees Ferry reach of the Colorado River downstream from Glen Canyon Dam, Arizona, 1991–2009: U.S. Geological Survey Scientific Investigations Report 2011–5015, 17 p.
ISBN 978-1-4113-3130-3

iii
Contents
Abstract ...........................................................................................................................................................1Introduction.....................................................................................................................................................1
Purpose and Scope ..............................................................................................................................2Description of Study Area ...................................................................................................................2
Flow Regimes................................................................................................................................2Previous Investigations........................................................................................................................3River Mile Naming Convention in Study Area ..................................................................................4
Methods of Investigation ..............................................................................................................................4Data Compilation ...................................................................................................................................4Rainbow Trout Sampling ......................................................................................................................4
Electrofishing ................................................................................................................................41991–96 .................................................................................................................................41997–2001 .............................................................................................................................42002–9 ..................................................................................................................................4
Data Collection and Fish Handling .....................................................................................................5Creel Surveys.........................................................................................................................................5Data Analysis .........................................................................................................................................5
Rainbow Trout Population Metrics ...........................................................................................5Comparison of Data from Fixed and Random Sampling Sites ..............................................6
Status and Trends of Rainbow Trout Population ......................................................................................7Catch per Unit Effort ............................................................................................................................7Proportional Stock Density .................................................................................................................8Relative Condition ................................................................................................................................8Effects of 2008 High-Flow Experiment ...............................................................................................8
Future Monitoring ........................................................................................................................................10Summary........................................................................................................................................................10Acknowledgments .......................................................................................................................................12References Cited..........................................................................................................................................12Appendix 1. Fish Sampling Results for 2009 ............................................................................................15
Figures 1. Map showing location of the Lees Ferry reach of the Colorado River, which
extends from Glen Canyon Dam at river mile (RM) -15.7 to Lees Ferry at RM 0 ................2 2. Graph showing daily mean discharge released from Glen Canyon Dam
during 2009 .....................................................................................................................................3 3. Graph showing mean catch per unit effort (CPUE) of rainbow trout captured
during electrofishing surveys in the Lees Ferry reach, 1991–2009 ......................................7 4. Graphs showing mean catch per unit effort (CPUE) of rainbow trout for fish of size
classes captured during electrofishing surveys in the Lees Ferry reach, 1991–2009 .......8 5. Graph showing mean angler catch per unit effort (CPUE) of rainbow trout in the
Lees Ferry reach, 1991–2009 .......................................................................................................9

iv
6. Graph showing mean proportional stock density (PSD) of rainbow trout in the Lees Ferry reach, 1991–2009 ................................................................................................................9
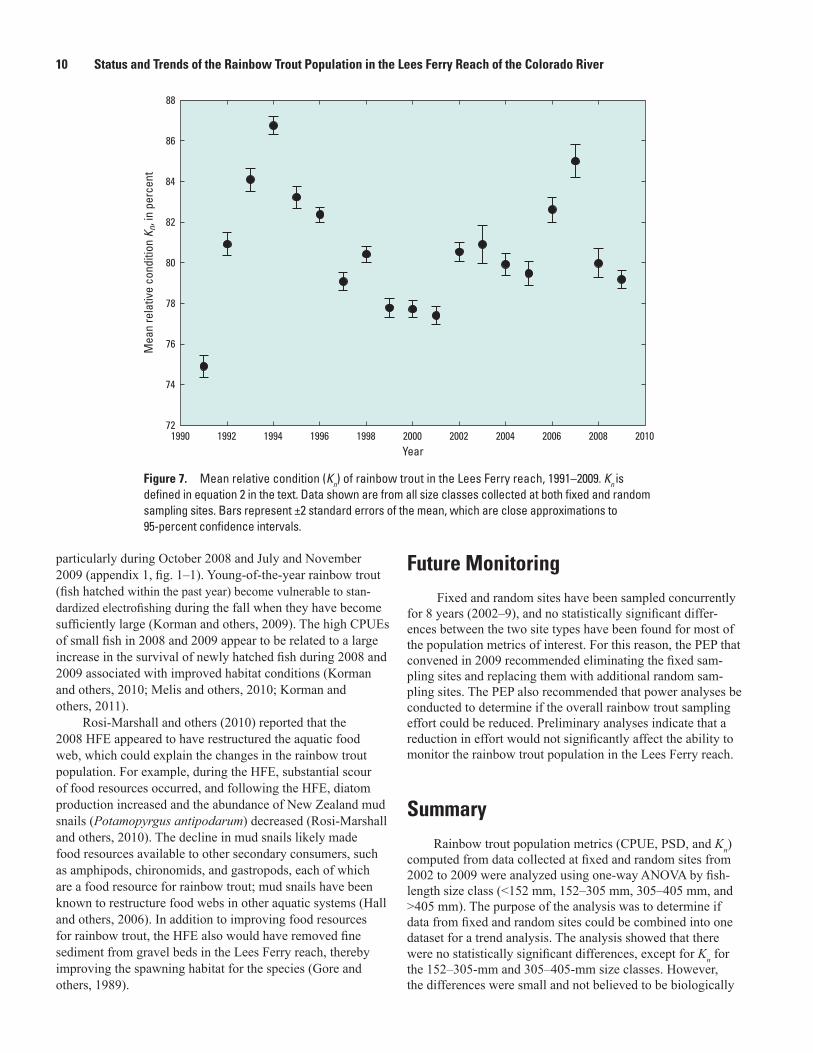
7. Graph showing mean relative condition (Kn) of rainbow trout in the Lees Ferry reach, 1991–2009 .........................................................................................................................10
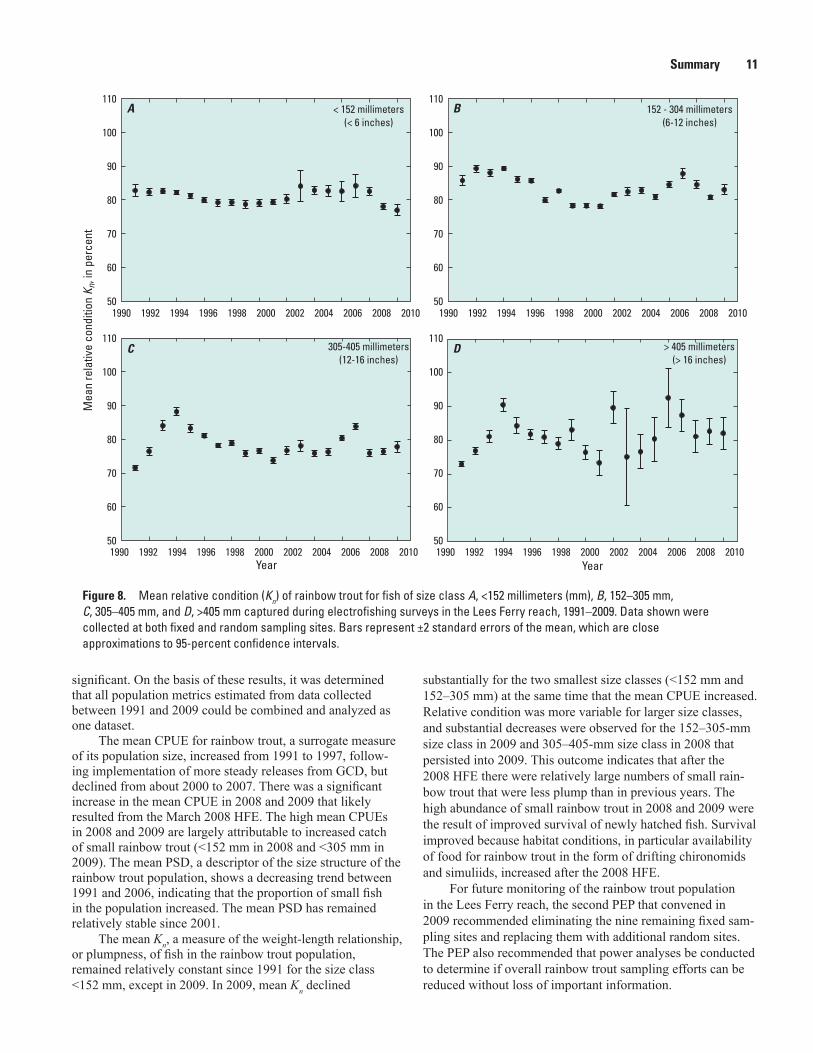
8. Graphs showing mean relative condition (Kn) of rainbow trout for fish of size classes captured during electrofishing surveys in the Lees Ferry reach, 1991–2009 .....................................................................................................................................11
1-1. Graphs showing frequency of capture in relation to size (total length) of rainbow trout captured in the Lees Ferry reach in April, July, November, and all three months, in 2009 .................................................................................................................17
Tables 1. One-way analysis of variance (ANOVA) results of rainbow trout population metrics
estimated from data collected at fixed and random sampling sites in the Lees Ferry reach, June 2002–November 2009 .............................................................................................6
1–1. Number of fish captured in the Lees Ferry reach by species and site type, 2009 ...............................................................................................................................................15
1–2. Instantaneous growth rate and related information of tagged fish recaptured in the Lees Ferry reach, 2009 ...............................................................................................................16
Conversion Factors
[This report uses metric units for all measurements except for river flow, the standard measure of which is cubic feet per second (ft3/s), and river mile (RM), which is used to describe distances along the Colorado River downstream of Glen Canyon Dam]
Multiply By To obtain
Length
inch (in.) 25.4 millimeter (mm)foot (ft) 0.3048 meter (m)mile (mi) 1.609 kilometer (km)
Flow rate
cubic foot per second (ft3/s) 0.02832 cubic meter per second (m3/s)
Temperature in degrees Celsius (°C) may be converted to degrees Fahrenheit (°F) as follows: °F= (1.8×°C) +32
Status and Trends of the Rainbow Trout Population in the Lees Ferry Reach of the Colorado River downstream from Glen Canyon Dam, Arizona, 1991–2009
By Andrew S. Makinster,1 William R. Persons,2 and Luke A. Avery1
1 Arizona Game and Fish Department, Research Branch, 5000 W. Carefree Highway, Phoenix, AZ 85035
2 U.S. Geological Survey, Southwest Biological Science Center, Grand Canyon Monitoring and Research Center, 2255 N. Gemini Drive, Flagstaff, AZ 86001
AbstractThe Lees Ferry reach of the Colorado River, a 25-kilometer
segment of river located immediately downstream from Glen Canyon Dam, has contained a nonnative rainbow trout (Oncorhynchus mykiss) sport fishery since it was first stocked in 1964. The fishery has evolved over time in response to changes in dam operations and fish management. Long-term monitoring of the rainbow trout population downstream of Glen Canyon Dam is an essential component of the Glen Canyon Dam Adap-tive Management Program. A standardized sampling design was implemented in 1991 and has changed several times in response to independent, external scientific-review recommendations and budget constraints. Population metrics (catch per unit effort, pro-portional stock density, and relative condition) were estimated from 1991 to 2009 by combining data collected at fixed sam-pling sites during this time period and at random sampling sites from 2002 to 2009. The validity of combining population met-rics for data collected at fixed and random sites was confirmed by a one-way analysis of variance by fish-length class size.
Analysis of the rainbow trout population metrics from 1991 to 2009 showed that the abundance of rainbow trout increased from 1991 to 1997, following implementation of a more steady flow regime, but declined from about 2000 to 2007. Abundance in 2008 and 2009 was high compared to previous years, which was likely the result of increased early survival caused by improved habitat conditions following the 2008 high-flow experiment at Glen Canyon Dam. Proportional stock density declined between 1991 and 2006, reflecting increased natural reproduction and large numbers of small fish in samples. Since 2001, the proportional stock density has been relatively stable. Relative condition varied with size class of rainbow trout but has been relatively stable since 1991 for fish smaller than 152 millimeters (mm), except for a substantial decrease in 2009. Relative condition was more variable for larger size classes, and substantial decreases were observed for the 152–304-mm size class in 2009 and 305–405-mm size class in 2008 that persisted into 2009.
IntroductionNonnative rainbow trout (Oncorhynchus mykiss) were
initially stocked in 1964 in the Lees Ferry reach of the Colorado River in lower Glen Canyon downstream from Glen Canyon Dam (GCD; fig. 1). Since that time, fish management efforts, dam operations, and flow regimes (U.S. Department of the Interior, 1996) have affected this trout fishery (Marzolf, 1991; McKinney and others, 1999, 2001; McKinney and Speas, 2001; Korman, 2009; Korman and Campana, 2009; Korman and others, 2010). Effects of flow regulation on rainbow trout in the Lees Ferry reach have been a source of interest and debate for resource managers and the public for several decades (Maddux and others, unpub. report,1987;1 McKinney and others, 1999, 2001; McKinney and Speas, 2001). Understanding how fish life histories are influenced by dam operations is essential to adaptively manage the water supply, hydroelectric power, and fishery, and meet other goals of the Glen Canyon Dam Adap-tive Management Program (GCDAMP). Established in 1997, the GCDAMP is a Federal advisory committee chartered by the Department of the Interior to advise the Secretary of the Interior on the effects of GCD operations on downstream resources of the Colorado River.
Rainbow trout in the Lees Ferry reach constitute a popular recreational fishery and coexist with native flannel-mouth sucker (Catostomus latipinnis) and nonnative com-mon carp (Cyprinus carpio). Before 1991, the rainbow trout population was sustained by annual stocking (McKinney and others, 2001). Since that time, the population has been largely self sustaining; although, stocking continued through 1998. The rainbow trout population in the Lees Ferry reach
1 Although the U.S. Geological Survey does not typically cite unpublished reports, this report makes reference to several unpublished reports to provide the reader with important background information. Copies of unpublished reports are available upon request by contacting the Center Director, U.S. Geological Survey, Southwest Biological Science Center, 2255 N. Gemini Drive, Flagstaff, AZ 86001.
2 Status and Trends of the Rainbow Trout Population in the Lees Ferry Reach of the Colorado River
has been monitored on a regular basis by the Arizona Game and Fish Department (AGFD) since 1991 as part of a coopera-tive agreement with the U.S. Geological Survey’s (USGS) Grand Canyon Monitoring and Research Center (GCMRC). Data collected through these efforts were summarized annu-ally in unpublished reports. The present study was initiated in 2010 to review, summarize, and interpret these previously unpublished data.
Purpose and Scope
The purpose of this report is to summarize rainbow trout monitoring in the Lees Ferry reach from 1991 through 2009, describing the results of (1) a comparison of rainbow trout data collected from two types of sampling sites (fixed and random) from June 2002 to November 2009 and (2) an evalua-tion of the status and trends of rainbow trout in the Lees Ferry reach from 1991 to 2009. Rainbow trout population variables evaluated for the study include catch per unit effort (CPUE), proportional stock density (PSD), and relative condition (Kn). Data from fixed and random sampling sites are statistically compared to determine whether they can be combined for analysis of population metrics. The CPUE data collected in 2008 and 2009 are described in relation to a 2008 high-flow experiment (HFE) at GCD.
Description of Study Area
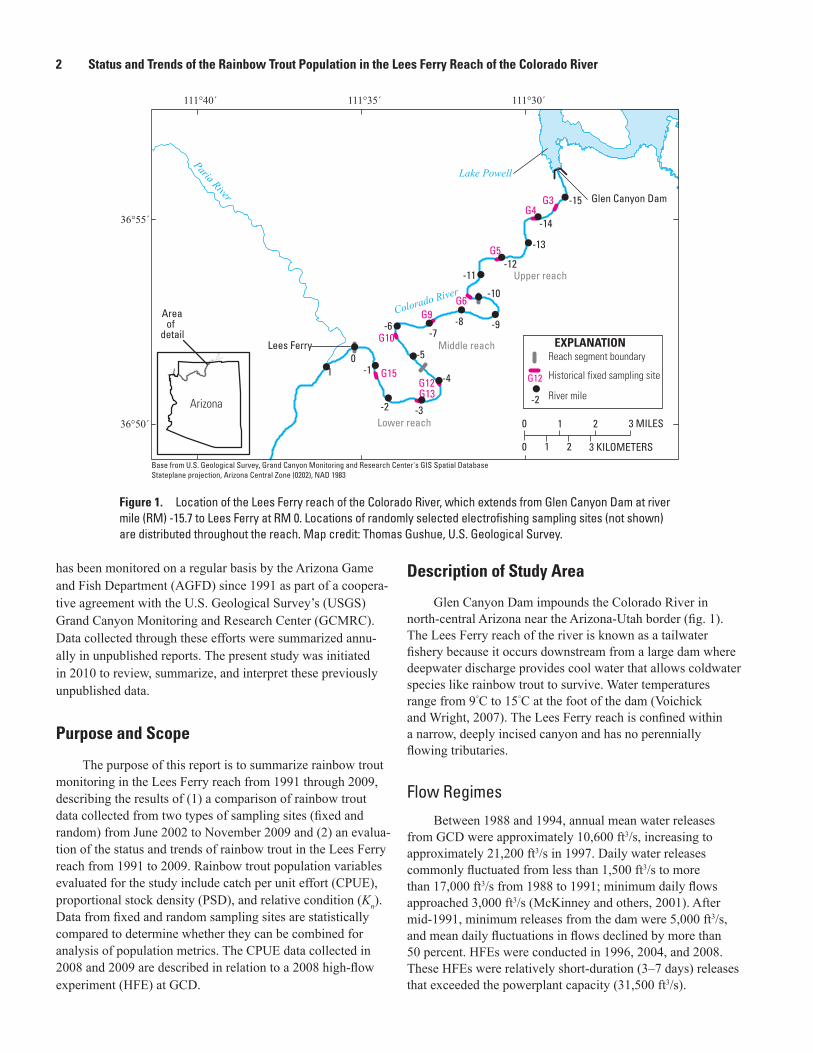
Glen Canyon Dam impounds the Colorado River in north-central Arizona near the Arizona-Utah border (fig. 1). The Lees Ferry reach of the river is known as a tailwater fishery because it occurs downstream from a large dam where deepwater discharge provides cool water that allows coldwater species like rainbow trout to survive. Water temperatures range from 9°C to 15°C at the foot of the dam (Voichick and Wright, 2007). The Lees Ferry reach is confined within a narrow, deeply incised canyon and has no perennially flowing tributaries.
Flow Regimes
Between 1988 and 1994, annual mean water releases from GCD were approximately 10,600 ft3/s, increasing to approximately 21,200 ft3/s in 1997. Daily water releases commonly fluctuated from less than 1,500 ft3/s to more than 17,000 ft3/s from 1988 to 1991; minimum daily flows approached 3,000 ft3/s (McKinney and others, 2001). After mid-1991, minimum releases from the dam were 5,000 ft3/s, and mean daily fluctuations in flows declined by more than 50 percent. HFEs were conducted in 1996, 2004, and 2008. These HFEs were relatively short-duration (3–7 days) releases that exceeded the powerplant capacity (31,500 ft3/s).
Figure 1. Location of the Lees Ferry reach of the Colorado River, which extends from Glen Canyon Dam at river mile (RM) -15.7 to Lees Ferry at RM 0. Locations of randomly selected electrofishing sampling sites (not shown) are distributed throughout the reach. Map credit: Thomas Gushue, U.S. Geological Survey.
0 1 2 3 MILES
0 1 2 3 KILOMETERS
River mile
Historical fixed sampling site
EXPLANATIONReach segment boundary
G3
G9
G4
G5
G6
G13
G15G12
G10
Glen Canyon Dam
Lake Powell
Lees Ferry
Upper reach
Middle reach
Lower reach
111°30´111°35´111°40´
36°55´
36°50´
Arizona
Areaof
detail
Paria
River
Colorado River
!
! !
!
!
! !! !
!
!!
!
!
!
!
!G121
0
-9-8-7
-6
-5
-4
-3-2
-1
-15
-14
-13
-12-11
-10
!-2
Base from U.S. Geological Survey, Grand Canyon Monitoring and Research Center's GIS Spatial DatabaseStateplane projection, Arizona Central Zone (0202), NAD 1983
Introduction 3
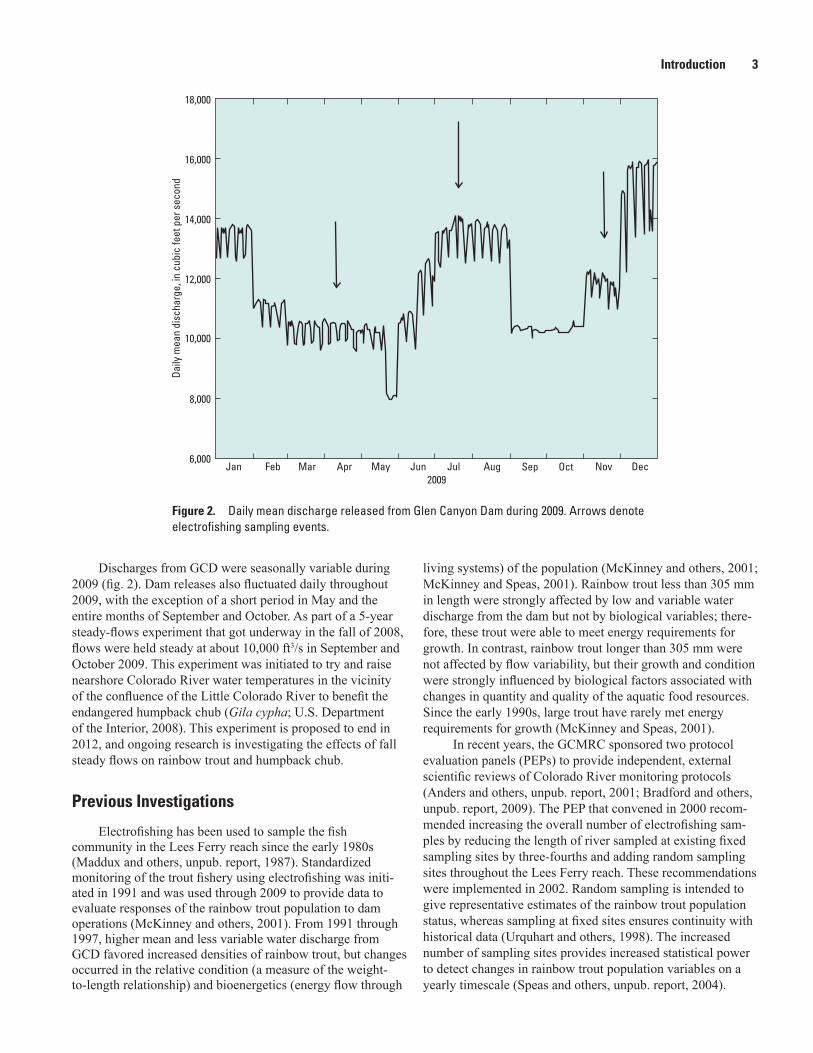
Discharges from GCD were seasonally variable during 2009 (fig. 2). Dam releases also fluctuated daily throughout 2009, with the exception of a short period in May and the entire months of September and October. As part of a 5-year steady-flows experiment that got underway in the fall of 2008, flows were held steady at about 10,000 ft3/s in September and October 2009. This experiment was initiated to try and raise nearshore Colorado River water temperatures in the vicinity of the confluence of the Little Colorado River to benefit the endangered humpback chub (Gila cypha; U.S. Department of the Interior, 2008). This experiment is proposed to end in 2012, and ongoing research is investigating the effects of fall steady flows on rainbow trout and humpback chub.
Previous Investigations
Electrofishing has been used to sample the fish community in the Lees Ferry reach since the early 1980s (Maddux and others, unpub. report, 1987). Standardized monitoring of the trout fishery using electrofishing was initi-ated in 1991 and was used through 2009 to provide data to evaluate responses of the rainbow trout population to dam operations (McKinney and others, 2001). From 1991 through 1997, higher mean and less variable water discharge from GCD favored increased densities of rainbow trout, but changes occurred in the relative condition (a measure of the weight-to-length relationship) and bioenergetics (energy flow through
living systems) of the population (McKinney and others, 2001; McKinney and Speas, 2001). Rainbow trout less than 305 mm in length were strongly affected by low and variable water discharge from the dam but not by biological variables; there-fore, these trout were able to meet energy requirements for growth. In contrast, rainbow trout longer than 305 mm were not affected by flow variability, but their growth and condition were strongly influenced by biological factors associated with changes in quantity and quality of the aquatic food resources. Since the early 1990s, large trout have rarely met energy requirements for growth (McKinney and Speas, 2001).
In recent years, the GCMRC sponsored two protocol evaluation panels (PEPs) to provide independent, external scientific reviews of Colorado River monitoring protocols (Anders and others, unpub. report, 2001; Bradford and others, unpub. report, 2009). The PEP that convened in 2000 recom-mended increasing the overall number of electrofishing sam-ples by reducing the length of river sampled at existing fixed sampling sites by three-fourths and adding random sampling sites throughout the Lees Ferry reach. These recommendations were implemented in 2002. Random sampling is intended to give representative estimates of the rainbow trout population status, whereas sampling at fixed sites ensures continuity with historical data (Urquhart and others, 1998). The increased number of sampling sites provides increased statistical power to detect changes in rainbow trout population variables on a yearly timescale (Speas and others, unpub. report, 2004).
Figure 2. Daily mean discharge released from Glen Canyon Dam during 2009. Arrows denote electrofishing sampling events.
18,000
16,000
14,000
12,000
10,000
8,000
6,000
Daily
mea
n di
scha
rge,
in c
ubic
feet
per
sec
ond
Jan Feb Mar Apr May Jun Jul Aug Sep Oct Nov Dec2009

4 Status and Trends of the Rainbow Trout Population in the Lees Ferry Reach of the Colorado River
River Mile Naming Convention in Study Area
The term river mile (RM) is used to describe distance along the Colorado River in the study area. The use of this term has historical precedent and provides a reproducible method for describing locations. Lees Ferry (fig. 1) is consid-ered the reference point, RM 0, with mileage measured from both upstream and downstream locations. Locations upstream from Lees Ferry in Glen Canyon Dam National Recreation Area are assigned negative river mile designations; thus, GCD is located at RM -15.7.
Methods of InvestigationHistorical information about the rainbow trout population
in the Lees Ferry reach, collected using electrofishing and creel surveys, or angler exit interviews, was compiled, docu-mented, and analyzed to determine how characteristics of the population changed over time.
Data Compilation
The rainbow trout population in the Lees Ferry reach has been sampled by the AGFD since 1984 and documented in unpublished AGFD annual reports. The GCMRC transferred the data collected by the AGFD to a Microsoft®Access fish database maintained by the GCMRC. Data analyzed in this study (1991–2009) were downloaded from the fish database and imported into SPSS software (SPSS Inc., Chicago, Ill.) for analysis. The data were filtered to exclude samples not collected using standard electrofishing methods, checked for errors, and coded for inclusion in analyses in this study. Data collected before 1991 were not included in this study because they were not collected in a consistent manner. The entire GCMRC fish database for the Colorado River downstream of GCD contains approximately 750,000 individual fish capture records, and, of this total, approximately 63,500 records were analyzed for this study for fish captured in the Lees Ferry reach during 1991–2009.
Rainbow Trout Sampling
From 1991 to 2009, rainbow trout were sampled in the Lees Ferry reach using electrofishing to collect fish two to four times per year. Information for each captured fish was recorded before it was released. Before 2002, sampling sites were selected on the basis of longitudinal (along-river) stratification, whereby the Lees Ferry reach was divided into lower (RM 0 to -4.5), middle (RM -4.5 to -10.0), and upper (RM -10.0 to -15.7) subreaches. Starting in 2002, sampling sites have also been selected on the basis of shoreline habi-tat stratification. These habitats include talus/cobble-bar and sandbar/cliff-face shorelines.
Electrofishing
The electrofishing equipment used to sample rainbow trout from 1991 to 2009 was operated from boats and con-sisted of a system that applied pulsed direct current (~310 V, ~15 A; Sharber and others, 1994) to a 356-mm spherical electrode system. Sampling typically commenced shortly after dusk and was conducted 5 to 7 hours per night when daily dam releases, and thus flows, were typically at a minimum. Over the years, two different boat types were used to conduct the sampling, but the electrofishing system configurations remained the same.
Capture probabilities (defined as the number of fish captured divided by the number of fish available to be cap-tured) during electrofishing were unlikely to be affected between sampling events by water temperature, discharge, and turbidity because sampling conditions were generally similar from year to year. Therefore, it has been assumed that CPUE, expressed as the number of fish captured per minute of electro-fishing, is a valid surrogate for rainbow trout population size.
1991–96
Fifteen fixed sampling sites were established along the 25-km Lees Ferry reach beginning in November 1991. These sites were relatively uniformly distributed along the Lees Ferry reach, so that the lower, middle, and upper subreaches each contained five fixed sites. The sites were sampled by electroshocking a reach about 610 m in length at each site for approximately 2,000 seconds. The electrofishing system was operated from a 6-m flat-bottomed aluminum boat.
1997–2001
Starting in April 1997, to eliminate redundancy in habitat types and reduce the cost of monitoring the Lees Ferry reach, 6 of the 15 sites that had been sampled since 1991 were removed from the sampling design. Of the six sites eliminated, half represented locations with high densities of rainbow trout and half represented locations with low densities. The remain-ing nine fixed sites were sampled during this period using the same methods and equipment used from 1991 to 1996, except that in 2001 a 5-m inflatable boat was used in addition to the 6-m aluminum boat. Comparisons showed no differences in catch rate between the two boat types (Speas and others, unpub. report, 2004).
2002–9
On the basis of the recommendations made by the PEP that convened in 2000, sampling was conducted at 9 historical fixed sites and 27 random sites from 2002 to 2009. Initially, the study area was stratified by Lees Ferry subreach and shore-line habitat within subreaches to ensure representation of the lower, middle, and upper subreaches and talus/cobble-bar and sandbar/cliff-face shorelines in each sampling event. For each sampling event, 27 sites were selected randomly (9 sites per
Methods of Investigation 5
stratum) without replacement (sites sampled previously were excluded). Again following the recommendations of the PEP, the river length sampled at each of the fixed sites was reduced from about 610 to 150 m, and the duration of electroshocking was reduced from approximately 2,000 to 500 seconds (Speas and others, unpub. report, 2004). The sampled river length and electroshocking duration were the same for fixed and random sites. The total length of river sampled for each sampling event was approximately 5.6 km or about 10 percent of the available shoreline. All sites were sampled using the same methods and equipment used from 1991 to 2001, except that the electrofishing system was operated from a 5-m inflatable boat starting in 2002.
Data Collection and Fish Handling
Total length (TL) was measured for all fish, and weight was measured when conditions permitted accurate measure-ments. The sex of captured fish was determined on the basis of manual extrusion of gametes. Starting in 2007, individu-ally numbered Floy FD-68B external anchor tags (Floy Tag Company, Seattle, Wash.) were inserted into rainbow trout longer than 200-mm TL that were captured at the random sampling sites. In 2009, previously untagged rainbow trout longer than 152-mm TL captured at the fixed sampling sites were implanted with 400-kHz passive integrated transponder (PIT) tags. That same year, standard ISO 134.2-kHz PIT tags were implanted in previously untagged flannelmouth sucker and brown trout (Salmo trutta) longer than 152-mm TL, consistent with Grand Canyon fish-handling protocols (Ward and Hangsleben, unpub. report, 2009). The 400-kHz tags were used in this study because they were surplus tags no longer used in other Colorado River studies. Both PIT tag types are full duplex, 12-mm tags. The adipose fins of the PIT-tagged rainbow and brown trout were clipped so that tag loss could be monitored. The tagging program is primarily intended to provide information in future years on fish movement and growth, because tagged fish are measured each time they are recaptured.
Subsamples of rainbow trout were sacrificed once per year during 2000 and 2002–6 (N=60–110 for each sampling event) and tested for whirling disease at the AGFD Pinetop Fish Health Laboratory. Tests used the modified polymerase chain reaction method. Starting in 2007, subsamples of rain-bow trout continued to be sacrificed once per year, but they were tested for whirling disease at the Washington Animal Disease Diagnostic Laboratory at Washington State University.
Creel Surveys
Creel surveys have been conducted by the AGFD since about 1977. In 2009, creel surveys were conducted during 6 random weekdays and 4 weekend days per month. As part of a creel survey, personnel recorded the number of fish caught and kept by anglers, the species, the number of hours fished
per angler, and other information. In this study, angler CPUE was calculated as the number of fish caught per hour fished. Historical creel survey data for the Lees Ferry reach are main-tained by AGFD and GCMRC.
Data Analysis
Rainbow trout data collected in the Lees Ferry reach from 1991 to 2009 were evaluated by analyzing the status and trends of selected population metrics. Before conduct-ing a trend analysis, however, it was necessary to determine if data collected at fixed and random sampling sites could be combined and analyzed as one dataset.
Rainbow Trout Population Metrics
CPUE, a surrogate measure of the size of the rainbow trout population in the Lees Ferry reach, was defined in this study as the number of rainbow trout captured per minute of electrofishing. The CPUE was computed for four fish-length size classes: less than 152 mm, 152 mm to less than 305 mm, 305 to less than 405 mm, and equal to or more than 405 mm. For ease of discussion, these size classes are referred to here-after as <152 mm, 152–305 mm, 305–405 mm, and >405 mm. As this report may be of interest to members of the general public who are more familiar with English units, the following equivalents are provided for the size classes:
Size class
in millimeters in inches
<152 <6152 to <305 6 to <12305 to <405 12 to <16
≥405 ≥16
The size structure of the rainbow trout population in the Lees Ferry reach was described by calculating proportional stock density (PSD; Anderson and Nuemann, 1996) as the ratio of “quality-sized” fish (defined as longer than 405 mm) to the sum of quality- and “stock-sized” fish (defined as longer than 305 mm). The PSD (in percent) is computed as
PSD
RBT
RBTQ
S
= ×
100 ,
(1)
where RBTQ is the number of rainbow trout longer than 405 mm, and RBTS is the number of rainbow trout longer than 305 mm. Rainbow trout longer than 405 mm have been protected from harvest by AGFD fishing regulations; most rainbow trout longer than 305 mm are sexually mature and generally desired by anglers (Todd Pringle, Arizona Game and Fish Department, written commun., 2004).
6 Status and Trends of the Rainbow Trout Population in the Lees Ferry Reach of the Colorado River
The relative condition (Kn; Le Cren, 1951) of individual rainbow trout was computed according to
K W
Wn= ×
' 100 ,
(2)
where Kn is expressed as a percentage, W is the weight (grams) of the fish, and W´ (grams) is the standard weight relationship W´ = 10[(-4.6 + 2.856*log10(TL))] estimated from a linear regression of rainbow trout length (TL in equation 2 is in millimeters) ver-sus weight (grams) for data collected in the Lees Ferry reach since 1991. The relative condition was computed for the four fish-length size classes defined earlier.
Comparison of Data from Fixed and Random Sampling Sites
The primary role of fixed sampling sites is to provide data that can be used to identify long-term trends in fish populations; the primary role of random sampling sites is to provide data that can be used to assess the status of fish populations at particular times (Urquhart and others, 1998). Guidelines for statistical analyses of data from fixed and ran-dom sites are unclear as to whether the two types of data can be combined for more powerful (that is, larger sample sizes
to reduce variance in estimators) evaluations of long-term trends (N.S. Urquhart, Colorado State University, written com-mun., 2002). In this study, it is assumed that if data collected at fixed sites have means and variances similar to those of data collected at random sites, then the two types of data may be combined for long-term trend analysis.
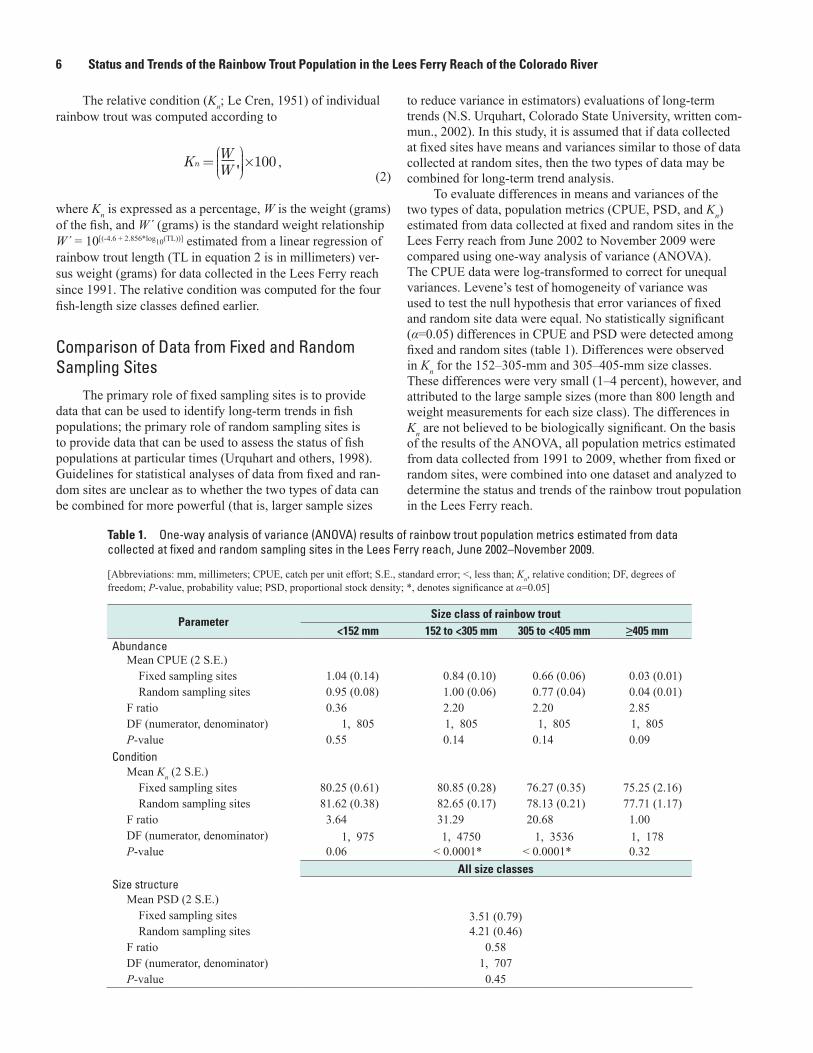
To evaluate differences in means and variances of the two types of data, population metrics (CPUE, PSD, and Kn) estimated from data collected at fixed and random sites in the Lees Ferry reach from June 2002 to November 2009 were compared using one-way analysis of variance (ANOVA). The CPUE data were log-transformed to correct for unequal variances. Levene’s test of homogeneity of variance was used to test the null hypothesis that error variances of fixed and random site data were equal. No statistically significant (α=0.05) differences in CPUE and PSD were detected among fixed and random sites (table 1). Differences were observed in Kn for the 152–305-mm and 305–405-mm size classes. These differences were very small (1–4 percent), however, and attributed to the large sample sizes (more than 800 length and weight measurements for each size class). The differences in Kn are not believed to be biologically significant. On the basis of the results of the ANOVA, all population metrics estimated from data collected from 1991 to 2009, whether from fixed or random sites, were combined into one dataset and analyzed to determine the status and trends of the rainbow trout population in the Lees Ferry reach.
Table 1. One-way analysis of variance (ANOVA) results of rainbow trout population metrics estimated from data collected at fixed and random sampling sites in the Lees Ferry reach, June 2002–November 2009.
[Abbreviations: mm, millimeters; CPUE, catch per unit effort; S.E., standard error; <, less than; Kn, relative condition; DF, degrees of freedom; P-value, probability value; PSD, proportional stock density; *, denotes significance at α=0.05]
ParameterSize class of rainbow trout
<152 mm 152 to <305 mm 305 to <405 mm ≥405 mmAbundance
Mean CPUE (2 S.E.) Fixed sampling sites 1.04 (0.14) 0.84 (0.10) 0.66 (0.06) 0.03 (0.01) Random sampling sites 0.95 (0.08) 1.00 (0.06) 0.77 (0.04) 0.04 (0.01)F ratio 0.36 2.20 2.20 2.85DF (numerator, denominator) 1, 805 1, 805 1, 805 1, 805P-value 0.55 0.14 0.14 0.09
ConditionMean Kn (2 S.E.) Fixed sampling sites 80.25 (0.61) 80.85 (0.28) 76.27 (0.35) 75.25 (2.16) Random sampling sites 81.62 (0.38) 82.65 (0.17) 78.13 (0.21) 77.71 (1.17)F ratio 3.64 31.29 20.68 1.00DF (numerator, denominator) 1, 975 1, 4750 1, 3536 1, 178P-value 0.06 < 0.0001* < 0.0001* 0.32
All size classesSize structure
Mean PSD (2 S.E.) Fixed sampling sites 3.51 (0.79) Random sampling sites 4.21 (0.46)F ratio 0.58DF (numerator, denominator) 1, 707P-value 0.45
Status and Trends of Rainbow Trout Population 7
Status and Trends of Rainbow Trout Population
The status and trends of the rainbow trout population in the Lees Ferry reach were evaluated by analyzing trout popu-lation metrics computed from data collected at fixed and ran-dom sampling sites from 1991 to 2009. These metrics included the annual mean CPUE, PSD, and Kn. Detailed results for fish data collected in 2009 are presented in appendix 1, including length frequency distributions and tag recapture information.
Catch per Unit Effort
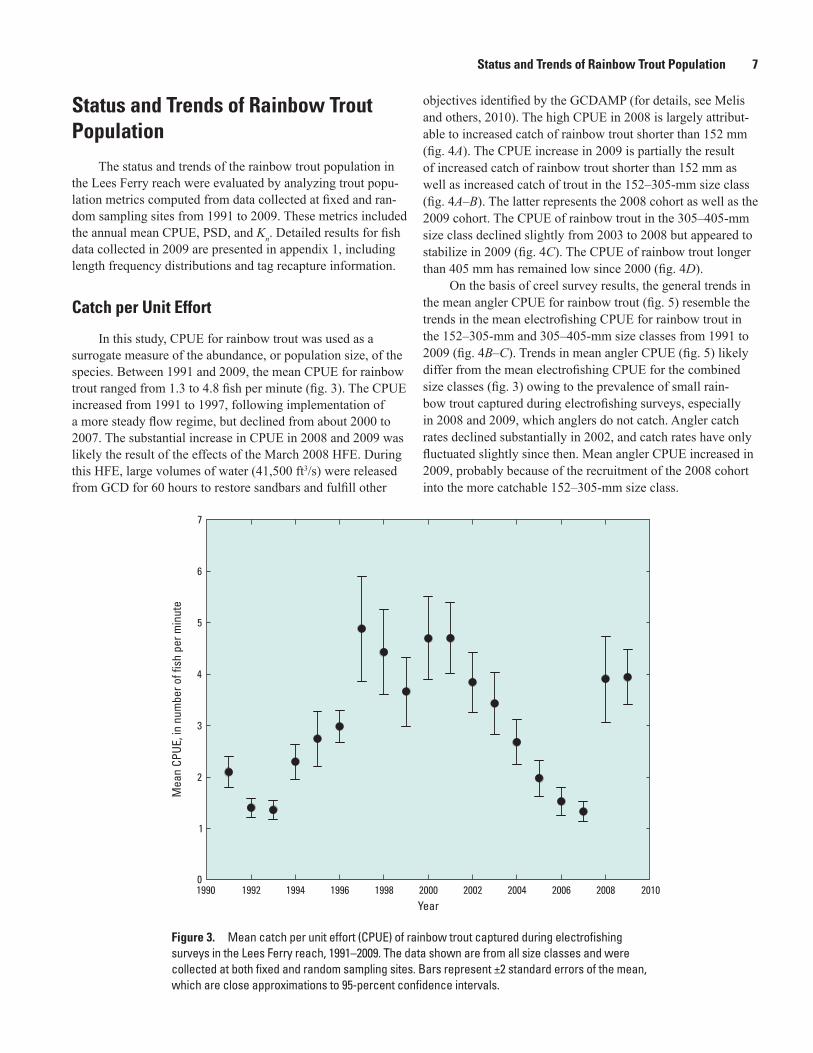
In this study, CPUE for rainbow trout was used as a surrogate measure of the abundance, or population size, of the species. Between 1991 and 2009, the mean CPUE for rainbow trout ranged from 1.3 to 4.8 fish per minute (fig. 3). The CPUE increased from 1991 to 1997, following implementation of a more steady flow regime, but declined from about 2000 to 2007. The substantial increase in CPUE in 2008 and 2009 was likely the result of the effects of the March 2008 HFE. During this HFE, large volumes of water (41,500 ft3/s) were released from GCD for 60 hours to restore sandbars and fulfill other
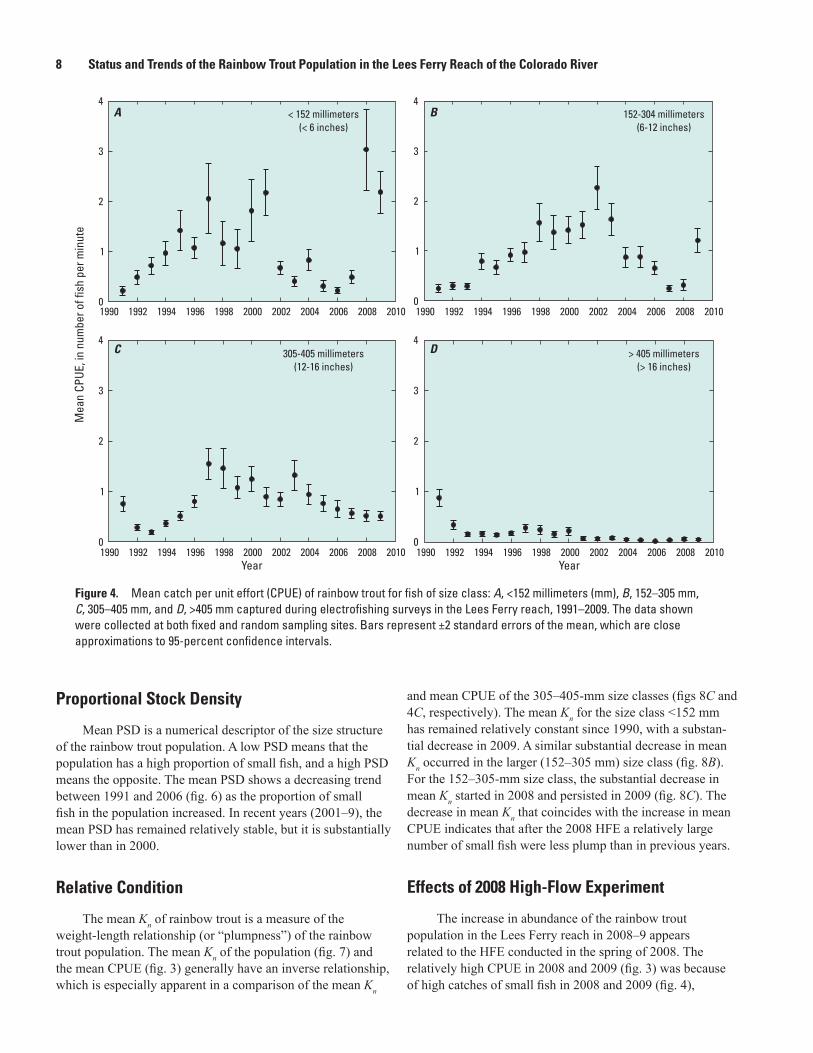
objectives identified by the GCDAMP (for details, see Melis and others, 2010). The high CPUE in 2008 is largely attribut-able to increased catch of rainbow trout shorter than 152 mm (fig. 4A). The CPUE increase in 2009 is partially the result of increased catch of rainbow trout shorter than 152 mm as well as increased catch of trout in the 152–305-mm size class (fig. 4A–B). The latter represents the 2008 cohort as well as the 2009 cohort. The CPUE of rainbow trout in the 305–405-mm size class declined slightly from 2003 to 2008 but appeared to stabilize in 2009 (fig. 4C). The CPUE of rainbow trout longer than 405 mm has remained low since 2000 (fig. 4D).
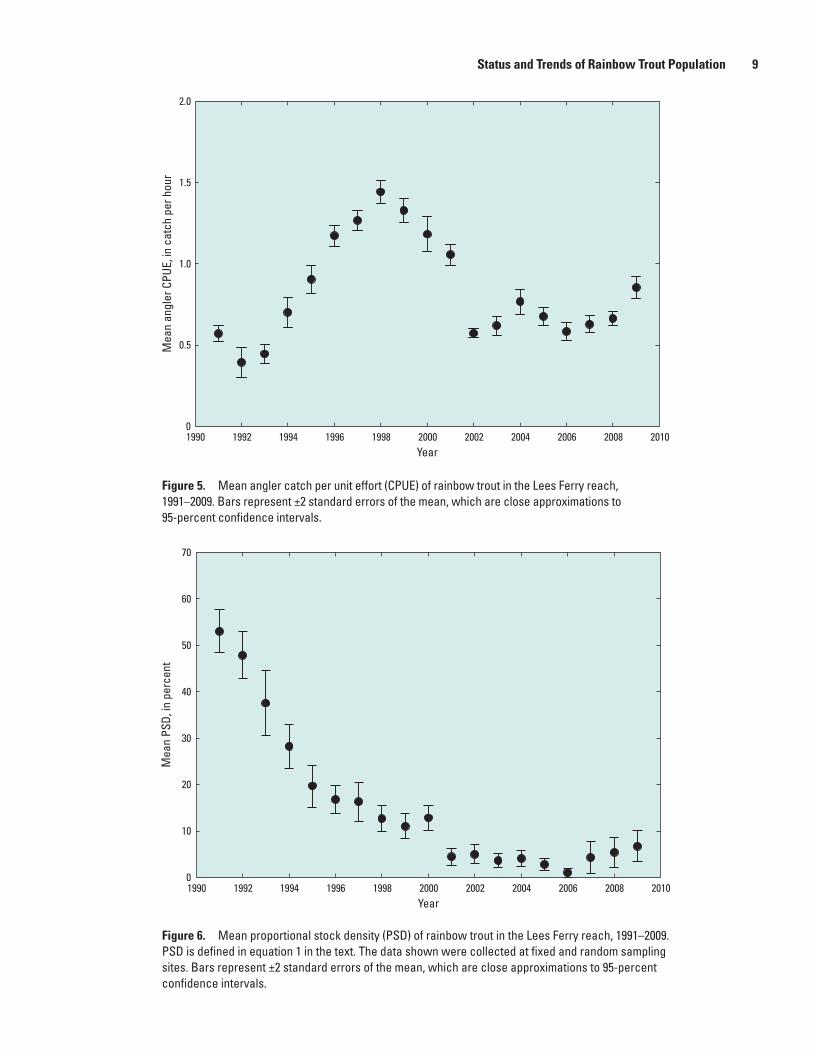
On the basis of creel survey results, the general trends in the mean angler CPUE for rainbow trout (fig. 5) resemble the trends in the mean electrofishing CPUE for rainbow trout in the 152–305-mm and 305–405-mm size classes from 1991 to 2009 (fig. 4B–C). Trends in mean angler CPUE (fig. 5) likely differ from the mean electrofishing CPUE for the combined size classes (fig. 3) owing to the prevalence of small rain-bow trout captured during electrofishing surveys, especially in 2008 and 2009, which anglers do not catch. Angler catch rates declined substantially in 2002, and catch rates have only fluctuated slightly since then. Mean angler CPUE increased in 2009, probably because of the recruitment of the 2008 cohort into the more catchable 152–305-mm size class.
Figure 3. Mean catch per unit effort (CPUE) of rainbow trout captured during electrofishing surveys in the Lees Ferry reach, 1991–2009. The data shown are from all size classes and were collected at both fixed and random sampling sites. Bars represent ±2 standard errors of the mean, which are close approximations to 95-percent confidence intervals.
Year1990 1992 1994 1996 1998 2000 2002 2004 2006 2008 2010
Mea
n CP
UE, i
n nu
mbe
r of f
ish
per m
inut
e
0
1
2
3
4
5
6
7
8 Status and Trends of the Rainbow Trout Population in the Lees Ferry Reach of the Colorado River
Proportional Stock Density
Mean PSD is a numerical descriptor of the size structure of the rainbow trout population. A low PSD means that the population has a high proportion of small fish, and a high PSD means the opposite. The mean PSD shows a decreasing trend between 1991 and 2006 (fig. 6) as the proportion of small fish in the population increased. In recent years (2001–9), the mean PSD has remained relatively stable, but it is substantially lower than in 2000.
Relative Condition
The mean Kn of rainbow trout is a measure of the weight-length relationship (or “plumpness”) of the rainbow trout population. The mean Kn of the population (fig. 7) and the mean CPUE (fig. 3) generally have an inverse relationship, which is especially apparent in a comparison of the mean Kn
and mean CPUE of the 305–405-mm size classes (figs 8C and 4C, respectively). The mean Kn for the size class <152 mm has remained relatively constant since 1990, with a substan-tial decrease in 2009. A similar substantial decrease in mean Kn occurred in the larger (152–305 mm) size class (fig. 8B). For the 152–305-mm size class, the substantial decrease in mean Kn started in 2008 and persisted in 2009 (fig. 8C). The decrease in mean Kn that coincides with the increase in mean CPUE indicates that after the 2008 HFE a relatively large number of small fish were less plump than in previous years.
Effects of 2008 High-Flow Experiment
The increase in abundance of the rainbow trout population in the Lees Ferry reach in 2008–9 appears related to the HFE conducted in the spring of 2008. The relatively high CPUE in 2008 and 2009 (fig. 3) was because of high catches of small fish in 2008 and 2009 (fig. 4),
Figure 4. Mean catch per unit effort (CPUE) of rainbow trout for fish of size class: A, <152 millimeters (mm), B, 152–305 mm, C, 305–405 mm, and D, >405 mm captured during electrofishing surveys in the Lees Ferry reach, 1991–2009. The data shown were collected at both fixed and random sampling sites. Bars represent ±2 standard errors of the mean, which are close approximations to 95-percent confidence intervals.
1990 1992 1994 1996 1998 2000 2002 2004 2006 2008 20100
1
2
3
4
Year1990 1992 1994 1996 1998 2000 2002 2004 2006 2008 20100
1
2
3
4
Year1990 1992 1994 1996 1998 2000 2002 2004 2006 2008 2010
0
1
2
3
4
A B
C D
Mea
n CP
UE, i
n nu
mbe
r of f
ish
per m
inut
e
1990 1992 1994 1996 1998 2000 2002 2004 2006 2008 20100
1
2
3
4
> 405(> 16 inches)
millimeters
152-304(6-12 inches)
millimeters< 152 millimeters(< 6 inches)
305-405(12-16 inches)
millimeters
Status and Trends of Rainbow Trout Population 9
Figure 5. Mean angler catch per unit effort (CPUE) of rainbow trout in the Lees Ferry reach, 1991–2009. Bars represent ±2 standard errors of the mean, which are close approximations to 95-percent confidence intervals.
Figure 6. Mean proportional stock density (PSD) of rainbow trout in the Lees Ferry reach, 1991–2009. PSD is defined in equation 1 in the text. The data shown were collected at fixed and random sampling sites. Bars represent ±2 standard errors of the mean, which are close approximations to 95-percent confidence intervals.
Year1990 1992 1994 1996 1998 2000 2002 2004 2006 2008 2010
Mea
n an
gler
CPU
E, in
cat
ch p
er h
our
0
0.5
1.0
1.5
2.0
Year1990 1992 1994 1996 1998 2000 2002 2004 2006 2008 2010
Mea
n PS
D, in
per
cent
0
10
20
30
40
50
60
70
10 Status and Trends of the Rainbow Trout Population in the Lees Ferry Reach of the Colorado River
particularly during October 2008 and July and November 2009 (appendix 1, fig. 1–1). Young-of-the-year rainbow trout (fish hatched within the past year) become vulnerable to stan-dardized electrofishing during the fall when they have become sufficiently large (Korman and others, 2009). The high CPUEs of small fish in 2008 and 2009 appear to be related to a large increase in the survival of newly hatched fish during 2008 and 2009 associated with improved habitat conditions (Korman and others, 2010; Melis and others, 2010; Korman and others, 2011).
Rosi-Marshall and others (2010) reported that the 2008 HFE appeared to have restructured the aquatic food web, which could explain the changes in the rainbow trout population. For example, during the HFE, substantial scour of food resources occurred, and following the HFE, diatom production increased and the abundance of New Zealand mud snails (Potamopyrgus antipodarum) decreased (Rosi-Marshall and others, 2010). The decline in mud snails likely made food resources available to other secondary consumers, such as amphipods, chironomids, and gastropods, each of which are a food resource for rainbow trout; mud snails have been known to restructure food webs in other aquatic systems (Hall and others, 2006). In addition to improving food resources for rainbow trout, the HFE also would have removed fine sediment from gravel beds in the Lees Ferry reach, thereby improving the spawning habitat for the species (Gore and others, 1989).
Future Monitoring Fixed and random sites have been sampled concurrently
for 8 years (2002–9), and no statistically significant differ-ences between the two site types have been found for most of the population metrics of interest. For this reason, the PEP that convened in 2009 recommended eliminating the fixed sam-pling sites and replacing them with additional random sam-pling sites. The PEP also recommended that power analyses be conducted to determine if the overall rainbow trout sampling effort could be reduced. Preliminary analyses indicate that a reduction in effort would not significantly affect the ability to monitor the rainbow trout population in the Lees Ferry reach.
SummaryRainbow trout population metrics (CPUE, PSD, and Kn)
computed from data collected at fixed and random sites from 2002 to 2009 were analyzed using one-way ANOVA by fish-length size class (<152 mm, 152–305 mm, 305–405 mm, and >405 mm). The purpose of the analysis was to determine if data from fixed and random sites could be combined into one dataset for a trend analysis. The analysis showed that there were no statistically significant differences, except for Kn for the 152–305-mm and 305–405-mm size classes. However, the differences were small and not believed to be biologically
Figure 7. Mean relative condition (Kn) of rainbow trout in the Lees Ferry reach, 1991–2009. Kn is defined in equation 2 in the text. Data shown are from all size classes collected at both fixed and random sampling sites. Bars represent ±2 standard errors of the mean, which are close approximations to 95-percent confidence intervals.
Year1990 1992 1994 1996 1998 2000 2002 2004 2006 2008 2010
Mea
n re
lativ
e co
nditi
on, i
n pe
rcen
tK n
72
74
76
78
80
82
84
86
88
Summary 11
significant. On the basis of these results, it was determined that all population metrics estimated from data collected between 1991 and 2009 could be combined and analyzed as one dataset.
The mean CPUE for rainbow trout, a surrogate measure of its population size, increased from 1991 to 1997, follow-ing implementation of more steady releases from GCD, but declined from about 2000 to 2007. There was a significant increase in the mean CPUE in 2008 and 2009 that likely resulted from the March 2008 HFE. The high mean CPUEs in 2008 and 2009 are largely attributable to increased catch of small rainbow trout (<152 mm in 2008 and <305 mm in 2009). The mean PSD, a descriptor of the size structure of the rainbow trout population, shows a decreasing trend between 1991 and 2006, indicating that the proportion of small fish in the population increased. The mean PSD has remained relatively stable since 2001.
The mean Kn, a measure of the weight-length relationship, or plumpness, of fish in the rainbow trout population, remained relatively constant since 1991 for the size class <152 mm, except in 2009. In 2009, mean Kn declined
substantially for the two smallest size classes (<152 mm and 152–305 mm) at the same time that the mean CPUE increased. Relative condition was more variable for larger size classes, and substantial decreases were observed for the 152–305-mm size class in 2009 and 305–405-mm size class in 2008 that persisted into 2009. This outcome indicates that after the 2008 HFE there were relatively large numbers of small rain-bow trout that were less plump than in previous years. The high abundance of small rainbow trout in 2008 and 2009 were the result of improved survival of newly hatched fish. Survival improved because habitat conditions, in particular availability of food for rainbow trout in the form of drifting chironomids and simuliids, increased after the 2008 HFE.
For future monitoring of the rainbow trout population in the Lees Ferry reach, the second PEP that convened in 2009 recommended eliminating the nine remaining fixed sam-pling sites and replacing them with additional random sites. The PEP also recommended that power analyses be conducted to determine if overall rainbow trout sampling efforts can be reduced without loss of important information.
Figure 8. Mean relative condition (Kn) of rainbow trout for fish of size class A, <152 millimeters (mm), B, 152–305 mm, C, 305–405 mm, and D, >405 mm captured during electrofishing surveys in the Lees Ferry reach, 1991–2009. Data shown were collected at both fixed and random sampling sites. Bars represent ±2 standard errors of the mean, which are close approximations to 95-percent confidence intervals.
12 Status and Trends of the Rainbow Trout Population in the Lees Ferry Reach of the Colorado River
Acknowledgments
This work was funded by hydropower revenues provided by the Bureau of Reclamation as part of the Glen Canyon Dam Adaptive Management Program. We wish to thank the following staff and contractors of the USGS GCMRC for their hard work operating boats and keeping clean, legible data-collection field notes: Stuart Reider, Dave Foster, Scott Davis, Scott Perry, and Brett Starks. We also thank Carol Fritzinger, GCMRC Logistics Program Manager, for coordinating trip schedules and equipment. Numerous Arizona Game and Fish Department personnel volunteered their time to collect the data analyzed in this study, for which we thank them. Aaron Bunch (AGFD), Marijke van Heeswijk (USGS), and two anonymous reviewers provided suggestions that greatly improved the quality of this report.
References Cited
Anders, P.J., Bradford, M.J, Higgins, P.S., Nislow, K.H., Rabeni, C.F., and Tate, Cathy, 2001, Final report of the aquatic protocol evaluation program panel: Unpublished report submitted to U.S. Geological Survey, Grand Canyon Monitoring and Research Center. [Available upon request by contacting the Center Director, U.S. Geological Survey, Southwest Biological Science Center, 2255 N. Gemini Drive, Flagstaff, AZ 86001.]
Anderson, R.O., and Neumann, R.M., 1996, Length, weight, and associated structural indices, in Murphy, B.R., and Willlis, D.W., eds., Fisheries techniques (2d ed.): Bethesda, Md., American Fisheries Society, p. 447–481.
Bradford, M.J., Bevelhimer, M.S., Hansen, M.J., Mueller, G.A., Osmundson, D.B., Rice J.A., and Winkelman, D.L., 2009, Report of the 2009 protocol evaluation panel for fish monitoring programs of the Grand Canyon Monitor-ing and Research Center: Unpublished report submitted to the U.S. Geological Survey Grand Canyon Monitoring and Research Center. [Available upon request by contact-ing the Center Director, U.S. Geological Survey, Southwest Biological Science Center, 2255 N. Gemini Drive, Flagstaff, AZ 86001.]
Gore, J.A., and Petts, G.E., eds., 1989, Alternatives in regulated river management: Boca Raton, Fla., CRC Press, 344 p.
Hall, R.O., Jr., Dybdahl, M.F., and VanderLoop, M.C., 2006, Extremely high secondary production of introduced snails in rivers: Ecological Applications, v. 16, no. 3, p. 1121–1131.
Korman, Josh, 2009, Early life history dynamics of rainbow trout in a large regulated river: Vancouver, University of British Columbia, Ph.D. dissertation, 214 p.
Korman, Josh, and Campana, S.E., 2009, Effects of hydropeaking on nearshore habitat use and growth of age-0 rainbow trout in a large regulated river: Transactions of the American Fisheries Society, v. 138, no. 1, p. 76–87.
Korman, Josh, Kaplinski, M.A., and Melis, T.S., 2010, Effects of high-flow experiments from Glen Canyon Dam on abundance, growth, and survival rates of early life stages of rainbow trout in the Lees Ferry reach of the Colorado River: U.S. Geological Survey Open-File Report 2010–1034, 31 p. (Available at http://pubs.usgs.gov/of/2010/1034.)
Korman, Josh, Kaplinski, M.A., and Melis, T.S., 2011, Effects of fluctuating flows and a controlled flood on incuba-tion success and early survival rates and growth of age-0 rainbow trout in a large regulated river: Transactions of the American Fisheries Society, v. 140, no. 2, p. 487–505.
Korman, Josh, Yard, M.D., Walters, C.J., and Coggins, L.G., 2009, Effects of fish size, habitat, flow, and density on capture probabilities of age-0 rainbow trout estimated from electrofishing at discrete sites in a large river: Transactions of the American Fisheries Society, v. 138, no. 1, p. 58–75.
Le Cren, E.D., 1951, The length-weight relationship and seasonal cycle in gonad weight and condition in the perch (Perca fluviatilis): Journal of Animal Ecology, v. 20, no. 2, p. 201–219.
Maddux, H.R., Kubly, D.M., deVos, J.C., Jr., Persons, W.R., Staedicke, R., and Wright, R.L., 1987, Effects of varied flow regimes on aquatic resources of Glen and Grand Canyons—Final report: Phoenix, Arizona Game and Fish Depart-ment, submitted to Bureau of Reclamation, Glen Canyon Environmental Studies, contract no. 4-AG-40-01810, 291 p. [Available from National Technical Information Service, Springfield, Va. as NTIS Report PB88-183439/AS.]
Makinster, A.S., Persons, W.R., Avery, L.A., and Bunch, A.J., 2010, Colorado River fish monitoring in Grand Canyon, Arizona—2000 to 2009 summary: U.S. Geological Sur-vey Open-File Report 2010–1246, 26 p. (Available at http://pubs.usgs.gov/of/2010/1246/.)
Marzolf, G.R., 1991, The role of science in natural resource management—The case for the Colorado River, in Colorado River ecology and dam management, Proceedings of a Symposium, May 24–25, 1990, Santa Fe, New Mexico: Washington, D.C., National Academy Press, p. 28–39.
McKinney, Ted, Rogers, R.S., Ayers, A.D., and Persons, W.R., 1999, Lotic community responses in the Lees Ferry reach, in Webb, R.H., Schmidt, J.C., Marzolf, G.R., and Valdez, R.A., eds., The controlled flood in Grand Can-yon: Washington, D.C., American Geophysical Union, Geophysical Monograph Series, v. 110, p. 249–258.
McKinney, Ted, and Speas, D.W., 2001, Observations of size-related asymmetries in diet and energy intake of rain-bow trout in a regulated river: Environmental Biology of Fishes, v. 61, no. 4, p. 435–444.
References Cited 13
McKinney, Ted, Speas, D.W., Rogers, R.S., and Persons, W.R., 2001, Rainbow trout in a regulated river below Glen Canyon Dam, Arizona, following increased minimum flows and reduced discharge variability: North American Journal of Fisheries Management, v. 21, no. 1, p. 216–222.
Melis, T.S., Topping, D.J., Grams, P.E., Rubin, D.M., Wright, S.A., Draut, A.E., Hazel, J.E., Jr., Ralston, B.E., Kennedy, T.A., Rosi-Marshall, Emma, Korman, Josh, Hilwig, K.D., and Schmit, L.M., 2010, 2008 High-flow experiment at Glen Canyon Dam benefits Colorado River resources in Grand Canyon National Park: U.S. Geological Survey Fact Sheet 2010–3009, 4 p. (Available at http://pubs.usgs.gov/fs/2010/3009/.)
Rosi-Marshall, E.J., Kennedy, T.A., Kincaid, D.W., Cross, W.F., Kelly, H.A.W., Behn, K.A., White, T., Hall, R.O., Jr., and Baxter, C.V., 2010, Short-term effects of the 2008 high-flow experiment on macroinvertebrates in the Colorado River below Glen Canyon Dam, Arizona: U.S. Geological Survey Open-File Report 2010–1031, 28 p. (Available at http://pubs.usgs.gov/of/2010/1031/.)
Sharber, N.G., Carothers, S.W., Sharber, J.P., DeVos, J.C., Jr., and House, D.A., 1994, Reducing electrofishing-induced injury of rainbow trout: North American Journal of Fisher-ies Management, v. 14, no. 2, p. 340–346.
Speas, D.W., Persons, W.R., Ward, D.L., Rogers, R.S., and Slaughter, J.E., IV, 2004, 2001 fish investigations in the Lees Ferry tailwater—2001 annual report: Phoenix, Arizona Game and Fish Department, submitted to U.S. Geological Survey, Grand Canyon Monitoring and Research Center, 59 p. [Available upon request by contacting the Center Direc-tor, U.S. Geological Survey, Southwest Biological Science Center, 2255 N. Gemini Drive, Flagstaff, AZ 86001.]
U.S. Department of the Interior, 1996, Record of Decision, Operation of Glen Canyon Dam—Final Environmental Impact Statement: Washington, D.C., Office of the Secre-tary of the Interior, Bureau of Reclamation, 15 p., accessed on October 13, 2010, at http://www.usbr.gov/uc/rm/amp/pdfs/sp_appndxG_ROD.pdf.
U.S. Department of the Interior, 2008, Final biological opinion on the operation of Glen Canyon Dam: Phoenix, Ariz., U.S. Fish and Wildlife Service, AESO/SE 22410-1993-F-167R1, 88 p., accessed on January 26, 2010, at http://www.usbr.gov/uc/envdocs/bo/FinalGCDBO2-26-08.pdf.
Urquhart, N.S., Paulsen, S.G., and Larsen, D.P., 1998, Monitoring for policy-relevant regional trends over time: Ecological Applications, v. 8, no. 2, p. 246–257.
Voichick, Nicholas, and Wright, S.A., 2007, Water-temper-ature data for the Colorado River and tributaries between Glen Canyon Dam and Spencer Canyon, northern Arizona, 1988–2005: U.S. Geological Survey Data Survey Series 251, 24 p. (Available at http://pubs.usgs.gov/ds/2007/251/.)
Ward, D.L., and Hangsleben, Matthew, 2002, Standard-ized methods for handling fish in Grand Canyon research: Phoenix, Arizona Game and Fish Department, unpublished report submitted to U.S. Geological Survey, Grand Canyon Monitoring and Research Center, 30 p. [Available upon request by contacting the Center Director, U.S. Geologi-cal Survey, Southwest Biological Science Center, 2255 N. Gemini Drive, Flagstaff, AZ 86001.]

Appendix 15
Appendix 1. Fish Sampling Results for 2009
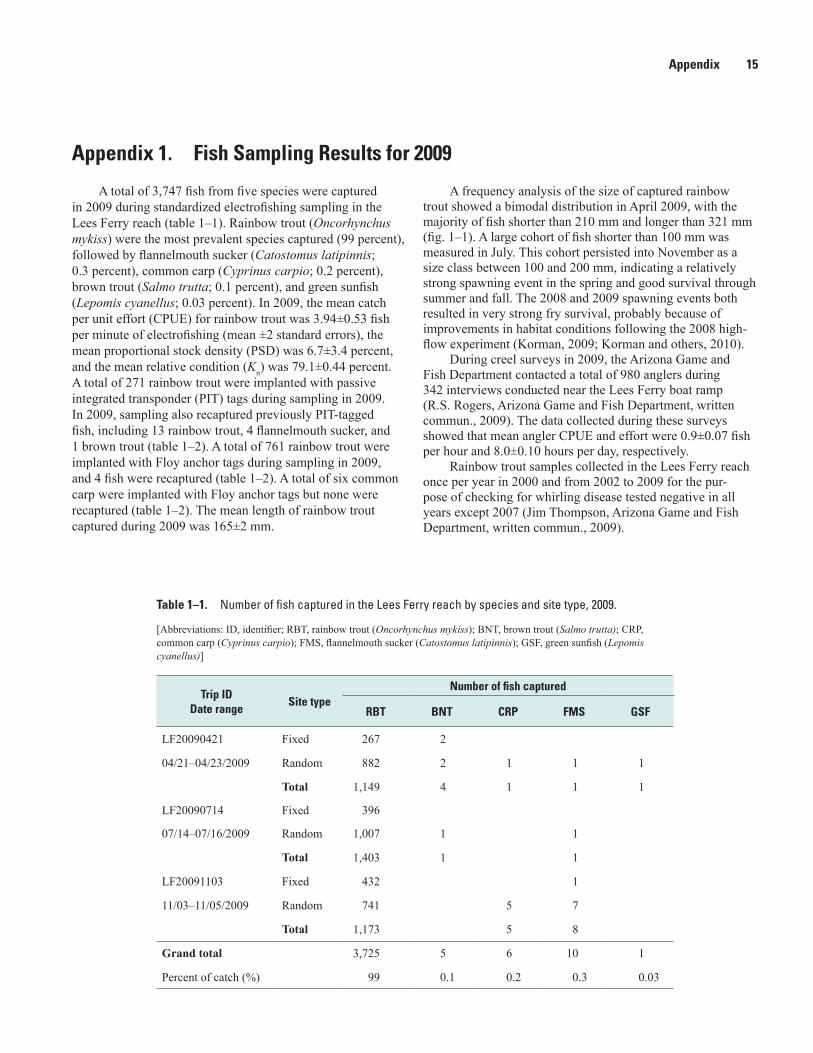
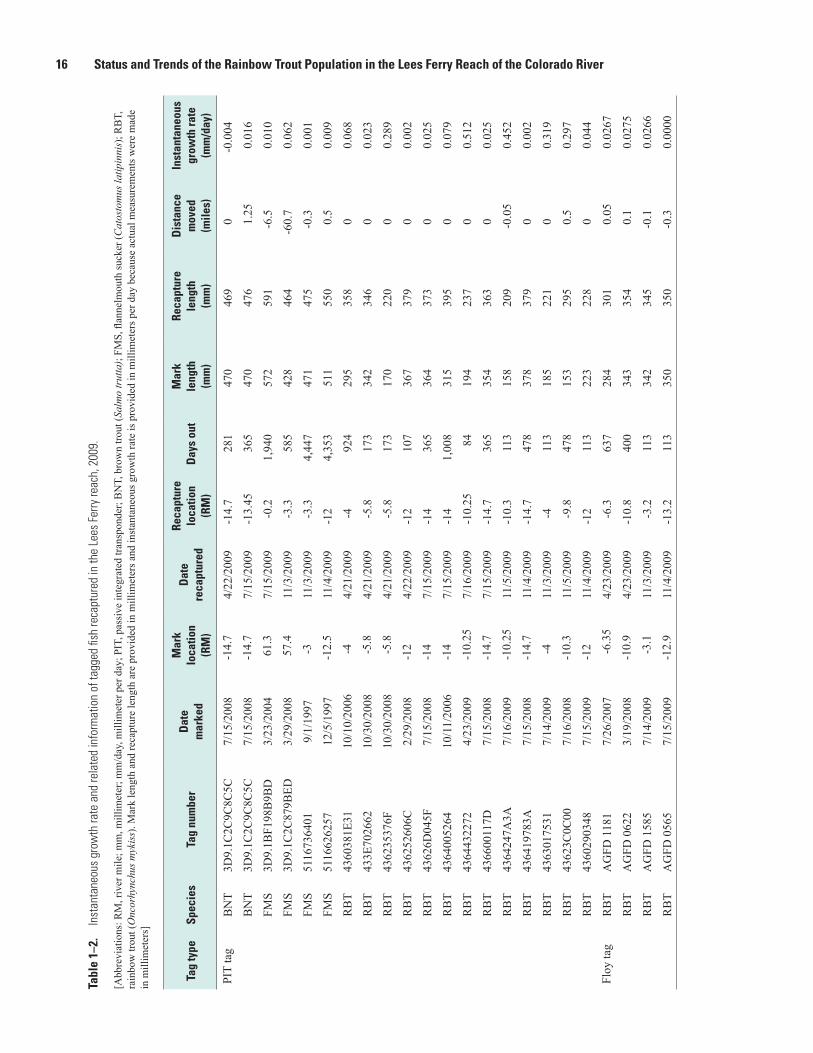
A total of 3,747 fish from five species were captured in 2009 during standardized electrofishing sampling in the Lees Ferry reach (table 1–1). Rainbow trout (Oncorhynchus mykiss) were the most prevalent species captured (99 percent), followed by flannelmouth sucker (Catostomus latipinnis; 0.3 percent), common carp (Cyprinus carpio; 0.2 percent), brown trout (Salmo trutta; 0.1 percent), and green sunfish (Lepomis cyanellus; 0.03 percent). In 2009, the mean catch per unit effort (CPUE) for rainbow trout was 3.94±0.53 fish per minute of electrofishing (mean ±2 standard errors), the mean proportional stock density (PSD) was 6.7±3.4 percent, and the mean relative condition (Kn) was 79.1±0.44 percent. A total of 271 rainbow trout were implanted with passive integrated transponder (PIT) tags during sampling in 2009. In 2009, sampling also recaptured previously PIT-tagged fish, including 13 rainbow trout, 4 flannelmouth sucker, and 1 brown trout (table 1–2). A total of 761 rainbow trout were implanted with Floy anchor tags during sampling in 2009, and 4 fish were recaptured (table 1–2). A total of six common carp were implanted with Floy anchor tags but none were recaptured (table 1–2). The mean length of rainbow trout captured during 2009 was 165±2 mm.
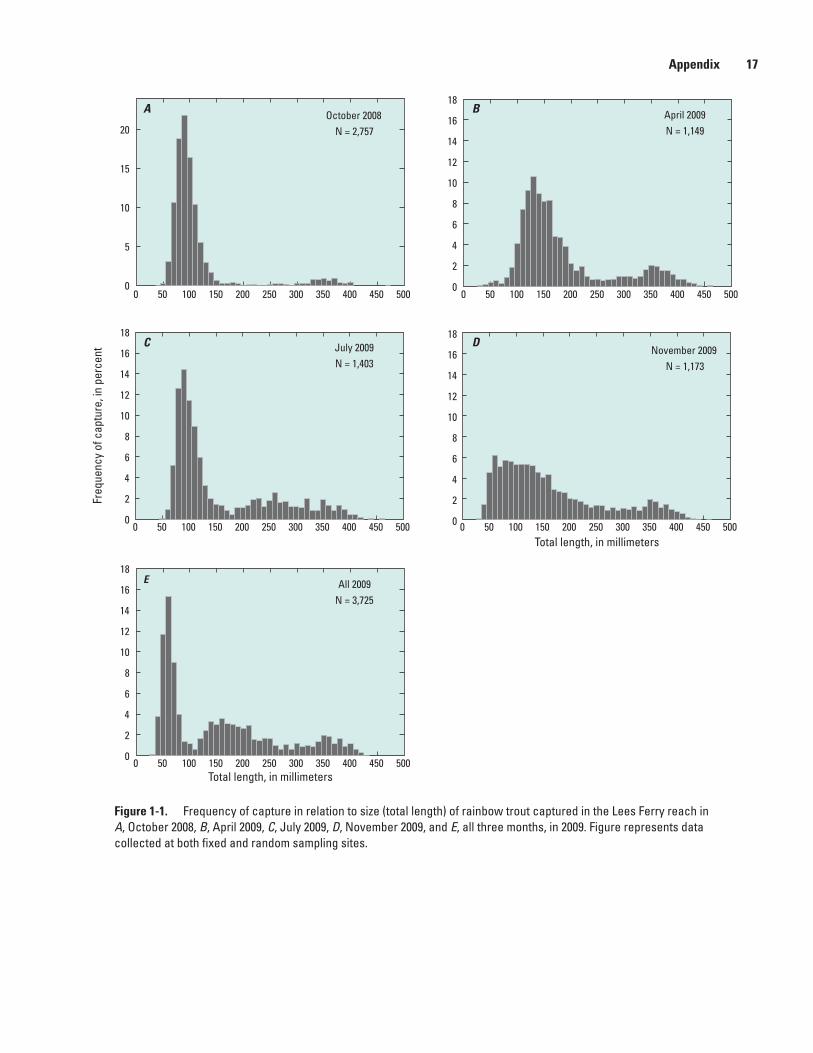
A frequency analysis of the size of captured rainbow trout showed a bimodal distribution in April 2009, with the majority of fish shorter than 210 mm and longer than 321 mm (fig. 1–1). A large cohort of fish shorter than 100 mm was measured in July. This cohort persisted into November as a size class between 100 and 200 mm, indicating a relatively strong spawning event in the spring and good survival through summer and fall. The 2008 and 2009 spawning events both resulted in very strong fry survival, probably because of improvements in habitat conditions following the 2008 high-flow experiment (Korman, 2009; Korman and others, 2010).
During creel surveys in 2009, the Arizona Game and Fish Department contacted a total of 980 anglers during 342 interviews conducted near the Lees Ferry boat ramp (R.S. Rogers, Arizona Game and Fish Department, written commun., 2009). The data collected during these surveys showed that mean angler CPUE and effort were 0.9±0.07 fish per hour and 8.0±0.10 hours per day, respectively.
Rainbow trout samples collected in the Lees Ferry reach once per year in 2000 and from 2002 to 2009 for the pur-pose of checking for whirling disease tested negative in all years except 2007 (Jim Thompson, Arizona Game and Fish Department, written commun., 2009).
Table 1–1. Number of fish captured in the Lees Ferry reach by species and site type, 2009.
[Abbreviations: ID, identifier; RBT, rainbow trout (Oncorhynchus mykiss); BNT, brown trout (Salmo trutta); CRP, common carp (Cyprinus carpio); FMS, flannelmouth sucker (Catostomus latipinnis); GSF, green sunfish (Lepomis cyanellus)]
Trip IDDate range
Site typeNumber of fish captured
RBT BNT CRP FMS GSF
LF20090421 Fixed 267 2
04/21–04/23/2009 Random 882 2 1 1 1
Total 1,149 4 1 1 1
LF20090714 Fixed 396
07/14–07/16/2009 Random 1,007 1 1
Total 1,403 1 1
LF20091103 Fixed 432 1
11/03–11/05/2009 Random 741 5 7
Total 1,173 5 8
Grand total 3,725 5 6 10 1
Percent of catch (%) 99 0.1 0.2 0.3 0.03

16 Status and Trends of the Rainbow Trout Population in the Lees Ferry Reach of the Colorado River
Tabl
e 1–
2.
Inst
anta
neou
s gr
owth
rate
and
rela
ted
info
rmat
ion
of ta
gged
fish
reca
ptur
ed in
the
Lees
Fer
ry re
ach,
200
9.
[Abb
revi
atio
ns: R
M, r
iver
mile
; mm
, mill
imet
er; m
m/d
ay, m
illim
eter
per
day
; PIT
, pas
sive
inte
grat
ed tr
ansp
onde
r; B
NT,
bro
wn
trout
(Sal
mo
trut
ta);
FMS,
flan
nelm
outh
suck
er (C
atos
tom
us la
tipin
nis)
; RB
T,
rain
bow
trou
t (O
ncor
hync
hus m
ykis
s). M
ark
leng
th a
nd re
capt
ure
leng
th a
re p
rovi
ded
in m
illim
eter
s and
inst
anta
neou
s gro
wth
rate
is p
rovi
ded
in m
illim
eter
s per
day
bec
ause
act
ual m
easu
rem
ents
wer
e m
ade
in m
illim
eter
s]
Tag
type
Spec
ies
Tag
num
ber
Dat
e m
arke
d
Mar
k lo
catio
n (R
M)
Dat
e re
capt
ured
Reca
ptur
e lo
catio
n (R
M)
Day
s ou
tM
ark
leng
th
(mm
)
Reca
ptur
e le
ngth
(m
m)
Dis
tanc
e m
oved
(m
iles)
Inst
anta
neou
s gr
owth
rate
(m
m/d
ay)
PIT
tag
BN
T3D
9.1C
2C9C
8C5C
7/15
/200
8-1
4.7
4/22
/200
9-1
4.7
281
470
469
0-0
.004
BN
T3D
9.1C
2C9C
8C5C
7/15
/200
8-1
4.7
7/15
/200
9-1
3.45
365
470
476
1.25
0.01
6
FMS
3D9.
1BF1
98B
9BD
3/23
/200
461
.37/
15/2
009
-0.2
1,94
057
259
1-6
.50.
010
FMS
3D9.
1C2C
879B
ED3/
29/2
008
57.4
11/3
/200
9-3
.358
542
846
4-6
0.7
0.06
2
FMS
5116
7364
019/
1/19
97-3
11/3
/200
9-3
.34,
447
471
475
-0.3
0.00
1
FMS
5116
6262
5712
/5/1
997
-12.
511
/4/2
009
-12
4,35
351
155
00.
50.
009
RB
T43
6038
1E31
10/1
0/20
06-4
4/21
/200
9-4
924
295
358
00.
068
RB
T43
3E70
2662
10/3
0/20
08-5
.84/
21/2
009
-5.8
173
342
346
00.
023
RB
T43
6235
376F
10/3
0/20
08-5
.84/
21/2
009
-5.8
173
170
220
00.
289
RB
T43
6252
606C
2/29
/200
8-1
24/
22/2
009
-12
107
367
379
00.
002
RB
T43
626D
045F
7/15
/200
8-1
47/
15/2
009
-14
365
364
373
00.
025
RB
T43
6400
5264
10/1
1/20
06-1
47/
15/2
009
-14
1,00
831
539
50
0.07
9
RB
T43
6443
2272
4/23
/200
9-1
0.25
7/16
/200
9-1
0.25
8419
423
70
0.51
2
RB
T43
6600
117D
7/15
/200
8-1
4.7
7/15
/200
9-1
4.7
365
354
363
00.
025
RB
T43
6424
7A3A
7/16
/200
9-1
0.25
11/5
/200
9-1
0.3
113
158
209
-0.0
50.
452
RB
T43
6419
783A
7/15
/200
8-1
4.7
11/4
/200
9-1
4.7
478
378
379
00.
002
RB
T43
6301
7531
7/14
/200
9-4
11/3
/200
9-4
113
185
221
00.
319
RB
T43
623C
0C00
7/16
/200
8-1
0.3
11/5
/200
9-9
.847
815
329
50.
50.
297
RB
T43
6029
0348
7/15
/200
9-1
211
/4/2
009
-12
113
223
228
00.
044
Floy
tag
RB
TA
GFD
118
17/
26/2
007
-6.3
54/
23/2
009
-6.3
637
284
301
0.05
0.02
67
RB
TA
GFD
062
23/
19/2
008
-10.
94/
23/2
009
-10.
840
034
335
40.
10.
0275
RB
TA
GFD
158
57/
14/2
009
-3.1
11/3
/200
9-3
.211
334
234
5-0
.10.
0266
RB
TA
GFD
056
57/
15/2
009
-12.
911
/4/2
009
-13.
211
335
035
0-0
.30.
0000
Appendix 17
Figure 1-1. Frequency of capture in relation to size (total length) of rainbow trout captured in the Lees Ferry reach in A, October 2008, B, April 2009, C, July 2009, D, November 2009, and E, all three months, in 2009. Figure represents data collected at both fixed and random sampling sites.
0 50 100 150 200 250 300 350 400 450 5000
2
4
6
8
10
12
14
16
18
E All 2009N = 3,725
0 50 100 150 200 250 300 350 400 450 5000
2
4
6
8
10
12
14
16
18
B April 2009N = 1,149
0 50 100 150 200 250 300 350 400 450 5000
2
4
6
8
10
12
14
16
18
DNovember 2009
N = 1,173
Total length, in millimeters
0 50 100 150 200 250 300 350 400 450 5000
2
4
6
8
10
12
14
16
18C July 2009
N = 1,403
A October 2008N = 2,757
0 50 100 150 200 250 300 350 400 450 5000
5
10
15
20
Total length, in millimeters
Freq
uenc
y of
cap
ture
, in
perc
ent


Makinster and others—
Status and Trends of the Rainbow Trout Population in the Lees Ferry Reach of the Colorado River—
Scientific Investigations Report 2011–5015
Printed on recycled paper