status and trends in suspended-sediment discharges, soil ... · u.s. army corps of engineers and...
TRANSCRIPT

In cooperation with theU.S. Army Corps of Engineers and theU.S. Department of Agriculture, Natural Resources Conservation Service
Status and Trends inSuspended-Sediment Discharges, Soil Erosion,and Conservation Tillage in the Maumee RiverBasin–Ohio, Michigan, and Indiana
U.S. Department of the InteriorU.S. Geological Survey

U.S. Department of the InteriorU.S. Geological Survey
Status and Trends in Suspended-Sediment Discharges, Soil Erosion, and Conservation Tillage in the Maumee RiverBasin—Ohio, Michigan, and Indiana
By Donna N. Myers and Kevin D. Metzker, U.S. Geological Survey, and Steven Davis, U.S. Department of Agriculture, Natural Resources Conservation Service
Water-Resources Investigations Report 00-4091
In cooperation with theU.S. Army Corps of Engineers and theU.S. Department of Agriculture, Natural Resources Conservation Service

U.S. Department of the InteriorBRUCE BABBITT, Secretary
U.S. Geological SurveyCharles G. Groat, Director
Any use of trade, product, or firm names is for descriptive purposes only and does not implyendorsement by the U.S. Government.
For additional information write to:
District ChiefU.S. Geological Survey6480 Doubletree AvenueColumbus, OH 43229-1111
Copies of this report can be purchased from:
U.S.Geological SurveyBranch of Information ServicesBox 25286Denver, CO 80225-0286
2000

Contents iii
CONTENTSAbstract ................................................................................................................................................................................. 1Introduction .......................................................................................................................................................................... 2
Purpose and scope ...................................................................................................................................................... 3Previous investigations ............................................................................................................................................... 5Environmental and hydrologic setting ........................................................................................................................ 6
Data collection and analysis ................................................................................................................................................. 11Sample collection and analysis ................................................................................................................................... 11Computation of suspended-sediment discharge ......................................................................................................... 12Computation of suspended-sediment budget .............................................................................................................. 14Crops, conservation tillage, and soil loss data ............................................................................................................ 15Trend analysis ............................................................................................................................................................. 16
Relation of suspended-sediment discharges and yields to soil loss, soil-erosion rates, delivery ratios, and conservation tillage .......................................................................................................................................... 16
Suspended-sediment discharge and yield ................................................................................................................... 16Soil loss, soil-erosion rates, conservation tillage, and delivery ratios ........................................................................ 18
Suspended-sediment budget ................................................................................................................................................. 22Trends in soil loss, conservation tillage, streamflow, and suspended-sediment discharge .................................................. 24
Auglaize River near Ft. Jennings, Ohio ...................................................................................................................... 25Maumee River at Waterville, Ohio ............................................................................................................................. 26
Implications for sediment management ................................................................................................................................ 27Evaluation of sediment-reduction goals ..................................................................................................................... 28Major source areas of sediment .................................................................................................................................. 30Implementation of best-management practices .......................................................................................................... 30
Summary and conclusions .................................................................................................................................................... 31References cited .................................................................................................................................................................... 32Appendix—Description of the use of LOADEST2 .............................................................................................................. 35
ILLUSTRATIONS
Figure 1–4. Maps showing: 1. Lake Erie-Lake St. Clair Basin study unit showing Maumee River Basin ............................................. 4 2. Distribution and thickness of unconsolidated sediments in the Maumee River Basin ........................... 7 3. Soil hydrologic groups in the Maumee River Basin ............................................................................... 9 4. Land use in the Maumee River Basin, 1994 ........................................................................................... 10
5. Graph showing trends in conservation tillage on corn and soybean fields in northwestern Ohio, 1982–98 ........................................................................................................................................................... 11
6. Map showing suspended-sediment sampling sites in the Maumee River Basin, 1950–98 ............................. 13 7. Graph showing relation between instantaneous suspended-sediment yield and instantaneous
streamflow at selected sites in the Maumee River Basin, 1996–98 ................................................................ 19 8–9. Maps showing:
8. Soil loss in the Maumee River Basin by hydrologic unit, 1996–98 ....................................................... 20 9. Percentage of fields in conservation tillage in the Maumee River Basin by hydrologic unit,
1996–98 ................................................................................................................................................... 21 10. Histograms showing suspended-sediment budget for the Maumee River Basin, 1996–98 ............................ 24 11. Box plots showing instantaneous streamflow at the Auglaize River near Ft. Jennings, Ohio,
1970–74 and 1996–98 ..................................................................................................................................... 26

iv Contents
Figure 12–14. Graphs showing: 12. Estimated daily suspended-sediment discharges for the Auglaize River near Ft. Jennings,
Ohio, 1970–74 and 1996–98 .................................................................................................................. 27 13. Relation of trend in the residuals of the natural logarithms of daily suspended-sediment
discharges for the Maumee River at Waterville, Ohio, 1970–98 to increases in percentage of crop fields in conservation tillage, 1982–98 ...................................................................................... 28
14. Mean daily suspended-sediment discharges for the Auglaize River near Ft. Jennings, Ohio, 1970–74 and 1996–98 ................................................................................................................. 29
TABLES
1. Characteristics of suspended-sediment concentration, discharge, and yield in selected streams of the Lake Erie–Lake St. Clair Basin ............................................................................................................ 6
2. Suspended-sediment sampling sites in the Maumee River Basin, 1950–98 .................................................. 12 3. Site name, data-collection period, drainage area, model coefficients, annual and seasonal mean
daily suspended-sediment discharges ............................................................................................................. 17 4. Soil loss as a percentage of the total at Waterville, Ohio, suspended-sediment discharge,
soil-erosion rates, and delivery ratios for selected sites in the Maumee River Basin, 1996–98 ..................... 18 5. Drainage area, average annual streamflow, and suspended-sediment discharge at selected sites in
the Maumee River Basin, expressed as a percentage of the total at Waterville, Ohio, 1996–98 .................... 236. Statistics, model coefficients, and probability values associated with trends in suspended-sediment
discharge for the Auglaize River near Ft. Jennings, Ohio and Maumee River at Waterville, Ohio ............... 25
CONVERSION FACTORS AND VERTICAL DATUM
Vertical datum: In this report, “sea level” refers to the National Geodetic Vertical Datum of 1929 (NGVD of 1929)—a geodetic datum derived from a general adjustment of the first-order level nets of both the United States and Canada, formerly called Sea Level Datum of 1929.Temperature: Temperature is given in degrees Celsius (°C), which can be converted to degrees Fahrenheit (°F) by use of the following equation:
°F = 1.8 (°C) + 32Concentrations of suspended sediment are given in miligrams per liter (mg/L), which is the same as parts per million.
Multiply By To obtaininch (in.) 25.4 millimeter
foot (ft) 0.3048 metermile (mi) 1.609 kilometer
square mile 2.590 square kilometeracre 0.4047 square hectometer (hectare)ton 0.4536 kilogram
gallon per minute (gal/min) 3.785 liter per minutecubic foot per second (ft3/s) 0.02832 cubic meter per second
cubic foot per day (ft3/d) 0.02832 cubic meter per daymillion gallons per day (Mgal/d) 0.04381 cubic meter per second
Contents v
ACKNOWLEDGMENTS
TECHNICAL ASSISTANCEMr. James Lake, Allen County Soil and Water Conservation District, Allen County, Indiana
TECHNICAL AND COLLEAGUE REVIEWERS:Charles G. Crawford, U.S. Geological Survey, Indianapolis, IndianaGreg F. Koltun, U.S. Geological Survey, Columbus, OhioJames C. Ebbert, U.S. Geological Survey, Tacoma, WashingtonSteven M. Hindall, U.S. Geological Survey, Columbus, OhioWiener Cadet, U.S. Army Corps of Engineers, Buffalo, New York
EDITORIAL, GRAPHICS, AND TEXT PREPARATION TEAM:Barbara A. Korzendorfer, Physical Scientist, East Hartford, ConnecticutC. Michael Eberle, Technical Publications Editor, U.S. Geological Survey, Columbus, OhioJoyce A. McClure, Scientific Illustrator, U.S. Geological Survey, Columbus, OhioMargery A. Tibbetts, Librarian, U.S. Geological Survey, Columbus, OhioRichard P. Frehs, Publications Graphics Specialist, U.S. Geological Survey, Columbus, Ohio

vi Contents

Abstract 1
Status and Trends in Suspended-Sediment Discharges, Soil Erosion, and Conservation Tillage in the Maumee River Basin—Ohio, Michigan, and IndianaBy Donna N. Myers, Kevin D. Metzker, and Steven Davis1
Abstract
The relation of suspended-sediment discharges to conservation-tillage practices and soil loss were analyzed for the Maumee River Basin in Ohio, Michigan, and Indiana as part of the U.S. Geolog-ical Survey’s National Water-Quality Assessment Program. Cropland in the basin is the largest con-tributor to soil erosion and suspended-sediment discharge to the Maumee River and the river is the largest source of suspended sediments to Lake Erie. Retrospective and recently-collected data from 1970–98 were used to demonstrate that increases in conservation tillage and decreases in soil loss can be related to decreases in suspended-sediment discharge from streams.
Average annual water and suspended-sedi-ment budgets computed for the Maumee River Basin and its principal tributaries indicate that soil drainage and runoff potential, stream slope, and agricultural land use are the major human and nat-ural factors related to suspended-sediment dis-charge. The Tiffin and St. Joseph Rivers drain areas of moderately to somewhat poorly drained soils with moderate runoff potential. Expressed as a percentage of the total for the Maumee River Basin, the St. Joseph and Tiffin Rivers represent 29.0 percent of the basin area, 30.7 percent of the
average-annual streamflow, and 9.31 percent of the average annual suspended-sediment dis-charge. The Auglaize and St. Marys Rivers drain areas of poorly to very poorly drained soils with high runoff potential. Expressed as a percentage of the total for the Maumee River Basin, the Auglaize and St. Marys Rivers represent 48.7 per-cent of the total basin area, 53.5 percent of the average annual streamflow, and 46.5 percent of the average annual suspended-sediment dis-charge. Areas of poorly drained soils with high runoff potential appear to be the major source areas of suspended sediment discharge in the Maumee River Basin.
Although conservation tillage differed in the degree of use throughout the basin, on aver-age, it was used on 55.4 percent of all crop fields in the Maumee River Basin from 1993–98. Con-servation tillage was used at relatively higher rates in areas draining to the lower main stem from Defiance to Waterville, Ohio and at rela-tively lower rates in the St. Marys and Auglaize River Basins, and in areas draining to the main stem between New Haven, Ind. and Defiance, Ohio. The areas that were identified as the most important sediment-source areas in the basin were characterized by some of the lowest rates of con-servation tillage.
The increased use of conservation tillage was found to correspond to decreases in sus-pended-sediment discharge over time at two loca-
1U.S. Department of Agriculture, Natural Resources Conservation Service, Lima, Ohio.

2 Status and Trends in Suspended-Sediment Discharges, Soil Erosion, and Conservation Tillage in the Maumee River Basin
tions in the Maumee River Basin. A 49.8 percent decrease in suspended-sediment discharge was detected when data from 1970–74 were compared to data from 1996–98 for the Auglaize River near Ft. Jennings, Ohio. A decrease in suspended-sedi-ment discharge of 11.2 percent was detected from 1970–98 for the Maumee River at Waterville, Ohio. No trends in streamflow at either site were detected over the period 1970–98. The lower rate of decline in suspended-sediment discharge for the Maumee River at Waterville, Ohio compared to the Auglaize River near Ft. Jennings, may be due to resuspension and export of stored sedi-ments from drainage ditches, stream channels, and flood plains in the large drainage basin upstream from Waterville. Similar findings by other investigators about the capacity of drainage networks to store sediment are supported by this investigation. These findings go undetected when soil loss estimates are used alone to evaluate the effectiveness of conservation tillage. Water-qual-ity data in combination with soil-loss estimates were needed to draw these conclusions. These findings provide information to farmers and soil conservation agents about the ability of conserva-tion tillage to reduce soil erosion and suspended-sediment discharge from the Maumee River Basin.
Introduction
Soil loss and soil erosion are among the most impor-tant economic and water-resource issues in the Lake Erie Basin. Excessive sediment degrades water qual-ity, carries contaminants, and when deposited within water-conveyance structures, reduces their capacity. But because soil loss is within the tolerable range in most areas of the Maumee River Basin, reduction of cropland productivity is not considered to be as great a concern as are effects on water quality and navigation (Wager, 1996). Tolerable soil loss is the upper limit of permissible soil loss over an extended period of time that results in no net loss of productivity (Kimberlin and Moldenhauer, 1977).
The Maumee River discharges more tons of sus-pended sediment per year than any other tributary to the Great Lakes (Baker, 1993). Agricultural land in the
Maumee River Basin, which is 70 percent cropland, is the primary source of sediment (U.S. Department of Agriculture, 1998). As a result of intensive agricul-tural activities, runoff to streamwaters in the Maumee Basin contains elevated amounts of suspended sedi-ments, fertilizers, and pesticides (Baker, 1993; Baker and others, 1998). Conventional tillage associated with row crop farming results in an accelerated loss of soil from fields, and as a consequence, sedimentation of stream channels. Stream channel and riparian habi-tats are affected by sediment dredging, ditching, and removing of streambank vegetation to maximize acres of cultivated land and to rapidly move water off and away from the land surface. Some of the most greatly modified stream channels and impacted fish and aquatic invertebrate communities in Ohio are found in selected areas of the Maumee River Basin. These neg-ative effects are attributed to habitat modification by agriculture (Ohio Environmental Protection Agency, 1989, 1992a,b; 1993a,b; 1994, 1995).
Industrialization of the lower main stem of the Maumee River, from Toledo to the mouth at Lake Erie, has resulted in impairments to water and sedi-ment quality from contaminants. Sediments coming from the watershed upstream from Toledo become contaminated by trace metals and PCBs (polychlori-nated biphenyls) as they pass through the Toledo area. Impairments from contaminated sediments include restrictions on human consumption of contaminated fish and documented impairments to benthic aquatic life (Ohio Environmental Protection Agency, 1989). Unlike clean sediments, contaminated sediments, once dredged, must be placed in CDFs (confined disposal facilities) rather than disposed of in the open waters of the lake. The restriction on the disposal of dredged sediment is considered an impairment to the beneficial use of the material. The lower main stem of the Maumee River has been identified by the International Joint Commission as an AOC (Area of Concern)—a waterway where beneficial uses of the water resources have been impaired by human activities. The Maumee River AOC is 1 of 43 in the Great Lakes Basin (Inter-national Joint Commission, 1987).
Economic effects on the Port of Toledo result from the need to dredge and dispose of 870,000 yd3
(cubic yards) of sediment per year from the Maumee River and the Maumee Bay of Lake Erie at an average annual cost of about $2.2 million. To maintain the fed-eral navigation channel at an adequate depth, approxi-mately 300,000 yd3 are dredged each year from the

Introduction 3
lower 7 mi (miles) of the Maumee River and 570,000 yd3 are dredged from Maumee Bay. Dredging and dis-posal in CDFs incurs an economic cost on shipping through fees levied on users of the Port of Toledo. Because no new CDFs are being licensed for the fed-eral navigation channel of the Maumee River, and existing CDFs are being filled to capacity, alternatives are needed.
The effects of suspended-sediment deposition from the Maumee River on the economy of the Port of Toledo and on the aquatic resources of the basin rank near the top of regional environmental concerns (U.S. Department of Agriculture, 1998; Ohio Lake Erie Commission, 1998). The Ohio Lake Erie Commission has set a goal of reducing the annual discharges of sus-pended sediment from Lake Erie tributaries in Ohio by 67 percent to improve water clarity and restore wet-lands along Lake Erie (Ohio Lake Erie Commission, 1998, p. 22). Recent changes in regulations governing the disposal of dredged sediments and the desire to improve aquatic resources of the Maumee River Basin have resulted in the adoption of basinwide programs to improve the management of land, soil, water, and sedi-ments. The long-term goal of the USACE (U.S. Army Corps of Engineers) is to reduce the amount of sedi-ment dredged from the Maumee River and Maumee Bay in Lake Erie by 15 percent, an equivalent of 130,000 yd3 each year (U.S. Department of Agricul-ture, 1998, p. 4).
Conservation tillage, a practice that reduces cul-tivation and retains the residue from the previous year’s crop at the soil surface, is being implemented as a means to decrease the amount of soil that is eroded and the amount of suspended sediment that is trans-ported, deposited, and dredged annually from the lower Maumee River and Maumee Bay. Natural-resource conservation programs such as the Conserva-tion Reserve Program and conservation tillage have been used since the mid-1980s to reduce sediment and phosphorus discharges in the Maumee River Basin and to improve aquatic habitat for fish and wildlife. Although conservation tillage is estimated to have reduced soil loss and soil erosion (U.S. Department of Agriculture, 1998), the response of the Maumee River and its tributaries to conservation tillage may be vari-able from location to location in the basin. Without direct evidence of improving water quality, farmers and others may become indifferent to the voluntary use of these practices and programs. This, in turn, could negate the apparent success of these programs
and the investments made by federal, State, and local natural-resource managers. Natural-resource managers need better information on where and how conserva-tion practices are improving water quality to make the best use of limited resources available for implementa-tion programs.
In 1994, The USGS (U.S. Geological Survey) began an intensive water-quality investigation in the Lake Erie-Lake St. Clair Basin as part of its NAWQA (National Water-Quality Assessment) Program. As part of this investigation, a study of the relation of sus-pended-sediment discharge to conservation-tillage practices was begun in the Maumee River Basin (fig. 1) in cooperation with the NRCS (Natural Resources Conservation Service) and the USACE. Conservation-tillage practices have been systemati-cally used on more than 50 percent of the 3.1 million acres of cropland in the Maumee River Basin as a method to reduce soil erosion from cropland, to reduce the amount of dredging required in the Port of Toledo, and to improve the water quality and aquatic habitat.
Purpose and scopeThe purposes of this report are to (1) identify the major source areas of sediment discharge in the Maumee River Basin, (2) quantify the suspended-sedi-ment discharge delivered to the main stem from major tributaries and from the upper main stem to the lower main stem, (3) relate natural factors such as soil drain-age, soil texture, and stream slope to discharges of sus-pended sediment, (4) examine whether conservation tillage has contributed to changes over time in sus-pended-sediment discharges, and (5) discuss the impli-cations for management of soil erosion from cropland in the Maumee River Basin.
Data analyzed for this report include retrospec-tive and recent data collected at eight sites in the Maumee River Basin at frequencies from daily to monthly, over a wide range of streamflows, and for different time periods between 1970–98. These sites represent the four largest tributaries to the Maumee River and three sites at key locations on the main stem. These data were used to answer questions about the role of natural and human factors in controlling soil erosion and suspended-sediment discharge in the Maumee River Basin.
Data were further extrapolated to provide an average annual sediment budget for the Maumee River Basin for 1996–98. Data on crop type, tillage prac-tices, and soil-loss estimates were used to document

4 Status and Trend in Suspended-Sediment Discharges, Soil Erosion, and Conservation Tillage in the Maumee River Basin
Figu
re 1
. Lak
e Er
ie-L
ake
St. C
lair
Basi
n st
udy
unit
show
ing
Mau
mee
Riv
er B
asin
.

Introduction 5
the spatial variation and location, type, and amount of conservation-tillage practices, soil-erosion rates, and soil loss in the Maumee River Basin. Trends in daily streamflow for the Maumee River at Waterville, Ohio and the Auglaize River near Ft. Jennings, Ohio from 1970–98 were examined along with trends in daily suspended-sediment discharge. Trends in suspended-sediment discharge were related to trends in stream-flow and interpreted in relation to information on crop types, soil-loss estimates, and changes in conserva-tion-tillage practices.
Previous investigationsBecause it is a major source of agrochemicals and sed-iments to Lake Erie, the Maumee River has been the focus of many water-quality studies (Jones and others, 1977; Logan, 1978; Baker, 1982, 1988; Richards and Baker, 1993; Baker and others, 1998). Suspended-sed-iment concentrations, discharges, yields, and trends have been summarized for the Maumee River Basin by Hindall (1989), Baker (1982, 1988), Richards and Baker (1993), and Baker and others (1998). Antilla and Tobin (1978) were the first to report on sediment discharges, concentrations, and yields with data col-lected from 1950–74.
Suspended-sediment discharge in the Maumee River Basin has been measured at one site near the downstream end of the basin, at the Maumee River at Waterville, Ohio. The Maumee River at Waterville receives drainage from 6,330 mi2 or 95.8 percent of the 6,609 mi2 basin. Daily suspended-sediment records have been reported for this site by the USGS from 1950–84 and from 1988–98 (Shindel and others, 1999). Another long-term monitoring program at this site is operated by the Heidelberg College Water-Qual-ity Laboratory, in Tiffin, Ohio. For the Heidelberg Water-Quality Program, daily or more frequent sam-ples for analysis of total nonfilterable residue have been collected from 1975–84 and 1988–98 (Baker and others, 1998). These data are valuable for characteriz-ing the mass transport and trends over time in concen-trations and discharges to Lake Erie of suspended sediment, fertilizers, and pesticides.
Compared to other tributary streams, the Maumee River is the largest source of suspended sedi-ments to Lake Erie, and the average and range of annual suspended-sediment discharges in the Maumee River far exceed that reported for the other principal streams of the Lake Erie Basin (table 1). The large size of the Maumee River Basin and year-to-year varia-
tions in rainfall result in annual discharges of sus-pended sediment that ranged from 275,000 tons to 1,940,000 tons—a factor of 7 (table 1). The impor-tance of tributaries such as the Auglaize River as major sources of suspended-sediment discharges to the Maumee River were first reported by Antilla and Tobin (1978).
Analyses of trends in suspended-sediment dis-charge were reported by Hindall (1989). Trends in total nonfilterable residue concentrations were reported by Richards and Baker (1993) and Baker and others (1998). Although no trends in suspended-sedi-ment discharge were detected for the Maumee River at Waterville from 1950–87 (Hindall, 1989) or in total nonfilterable residue from 1975–90 (Richards and Baker, 1993), an approximate 17.5 percent downward trend in the concentration of total nonfilterable residue was reported recently for 1975–95 (Baker and others, 1998). The reason for this downward trend was attrib-uted to conservation tillage (Baker and others, 1998). Little is known about trends upstream from Waterville, and the trends at Waterville have not been interpreted in relation to areal patterns in soil loss and conserva-tion tillage. Another water-quality study was under-taken in the Palouse River Basin in Washington and Idaho as part of the NAWQA Program (Ebbert and Roe, 1998). That study reported on potential reduc-tions in soil erosion and sediment discharge from 1979–94 resulting from erosion control practices such as conservation tillage and other practices for dry-land farming.
Several previous studies have examined the drainage class, surface texture, hydrologic group, and parent material of soils in the Maumee River Basin in relation to soil-erosion potential and conservation practices. Logan (1978) reported that soils of the basin are mostly fine textured and produce sediment during runoff in relation to their slope, internal drainage, tex-ture, and susceptibility to sediment transport. Beasely (1985) modeled soil-erosion potential in the Maumee River Basin and model predictions suggest that rela-tively higher soil-erosion rates are likely to be associ-ated with watersheds containing soils derived from till, lacustrine deposits, or lacustrine-till deposits that are poorly to very poorly drained with high runoff poten-tial (Beasely, 1985). Jones and others (1977) found that the very poorly drained and fine-textured Pauld-ing soils yielded the highest suspended-sediment con-centrations compared to the somewhat poorly drained Hoytville soils, and the moderately well-drained Mill

6 Status and Trend in Suspended-Sediment Discharges, Soil Erosion, and Conservation Tillage in the Maumee River Basin
Table 1. Characteristics of suspended-sediment concentration, discharge, and yield in selected streams of the Lake Erie-Lake St. Clair Basin[mg/L, milligrams per liter; ton/yr, tons per year; ton/mi2/yr, tons per square mile per year; NR, not reported]
Clinton River River Raisin Auglaize
River Maumee River Sandusky River Cuyahoga River Grand River
Period of record 1974–80 1966–721978–80
1982–85 1946–70 1946–701988–94
1982–85 1946–701988–94
1982–85 1946–701988–94
1982–85 1946–701988–91
Mean or range of annual mean concentrations (mg/L)
42 42 49-91 216 244a 180-205 250a 144-283 266a 158-269 102a
Average sediment discharge or range of annual sediment discharges (ton/yr x 1,000)
NR NR 47-88 373 275-1,940b 989-1,410 197-350b 118-433 99-431b 180-273 65-261c
Yield or range of annual yields (ton/mi2/yr)
22 47-63 17-33 187 43-306b 156-223 75-431b 94-346 140-610b 231-386 95-381c
Reference ( 1 ) ( 1 ) ( 2 ) ( 3 ) ( 3, 4 ) ( 2 ) ( 3, 4 ) ( 2 ) ( 3, 4 ) ( 2 ) ( 3, 4 )
a Corresponds to 1946-70 period of record. 1 Cummings, 1983.b Corresponds to 1988-94 period of record. 2 Baker, 1988. c Corresponds to 1988-91 period of record. 3 Antilla and Tobin, 1978. 4 Shindel and others, 1991-95.
grove soils (Jones and others, 1977). Conclusions by Jones and others (1977) were that fine-textured, nearly flat watersheds in the Maumee River Basin may repre-sent significant contributing areas of sediment dis-charge to the Maumee River.
Environmental and hydrologic settingThe Maumee River, with a drainage area of 6,609 mi2, is the largest stream discharging to Lake Erie in the United States and Canada (fig. 1). The Maumee River discharges just under 24 percent of the surface water that flows into Lake Erie from the United States, excluding that which is delivered from the upper lakes through the St. Clair River and Detroit River connect-ing channels (Casey and others, 1997). The four larg-est tributaries to the Maumee River, in descending order, are the Auglaize River, the St. Joseph River, the St. Marys River, and the Tiffin River (fig. 1). The Maumee River is formed by the confluence of the St. Joseph and St. Marys Rivers near Ft. Wayne, Ind.
The basin comprises a flat lake plain in the cen-ter and sloping till plains around the edges. The U.S. Department of Agriculture (1993) reported the average slope of the Maumee River from Fort Wayne to Toledo is 1.3 ft/mi. The average slopes of the major tributaries of the Maumee River are 2.8 ft/mi for the St. Marys
River; 1.6 ft/mi for the St. Joseph River, 1.2 ft/mi for the Tiffin River; 3.2 ft/mi for the Auglaize River; and 0.9 ft/mi for the Blanchard River. Some of the head-waters of these tributaries have slopes of 10 ft/mi., especially those in the upper St. Joseph River Basin.
The modern Maumee River was formed during the glacial ice recession from the western end of the Lake Erie Basin, between 8,000 and 12,000 years ago. The Maumee River Basin is overlain by three types of Pleistocene glacial deposits—till, consisting of poorly sorted and generally unstratified particles ranging in size from clay to large boulders; and to a lesser degree, coarse-grained stratified sediments, consisting of sand and gravel; and fine-grained stratified sediments, con-sisting of clay, silt, and very fine sand (Casey and oth-ers, 1997). Sediments overlying bedrock range in thickness from less than 1 ft near Lake Erie to more than 200 ft in northwestern Indiana and southeastern Michigan (fig. 2).
The stream-drainage pattern of the Maumee River is dendritic owing to the consistent thick cover of surficial material deposited over the sandstones and shales in the northwestern part of the basin and the thin layers of surficial material deposited on the rela-tively flat limestone and dolomite bedrock units in the southern part of the basin (Casey and others, 1997). The dendritic pattern of stream development in the

Introduction 7
Figure 2. Distribution and thickness of unconsolidated sediments in the Maumee River Basin.

8 Status and Trends in Suspended-Sediment Discharges, Soil Erosion, and Conservation Tillage in the Maumee River Basin
basin shortens the distances from land surfaces to waterways and increases the efficiency of sediment delivery to streams.
Areal patterns in suspended-sediment dis-charges are influenced by human and natural factors such as precipitation, climate, physiography, geology, and land use. The factors most affecting soil erosion and sediment transport from the land surface are inten-sity and duration of rainfall, topography, soil charac-teristics, and vegetative cover (Antilla and Tobin, 1978, p. 4). Rainfall is the most important and most variable factor from year to year (Guy, 1969). Annual precipitation from 1961–90 in the Maumee River Basin ranged from 31.9 in. near Lake Erie to 39.8 in. in the extreme southwestern part of the basin (Casey and others, 1997). Rainfall is highest in May and June and lowest in January and February (Casey and others, 1997). As a result of seasonally low evaporation and evapotranspiration, streamflow in the Maumee River are highest in February, March, and April and lowest in September and October (Casey and others, 1997, p. 40).
The parent materials of soils in the Maumee River Basin are the three types of glacial deposits mentioned previously. More than 90 percent of the soils in the basin are poorly to very poorly drained silts, clays, and fine sands of lacustrine or till origin (Beasely, 1985). Runoff potential of soils and soil-drainage characteristics are described by a classifica-tion of soils into four soil hydrologic groups; A-D (fig. 3). Group A soils are well-drained to excessively well-drained sands or gravels with low runoff poten-tial. None of the soils in the Maumee River Basin are in Group A. Group B soils are well drained to moder-ately well drained with moderately fine to moderately coarse textures and moderate runoff potential. A small fraction of soils in the Maumee River Basin are in Group B, most of which are in southeastern Michigan (fig. 3). Group C soils are moderately poor to poorly drained soils with slow infiltration rates and moder-ately high runoff potential. Group D soils are soils with a permanently high water table consisting of clays, with a claypan, clay layer, or other relatively impervious layer near the surface and are poorly drained to very poorly drained with high runoff poten-tial. Most soils in the Maumee River Basin are in the soil hydrologic groups C and D (fig. 3).
Dual hydrologic groups, A/D, B/D, and C/D are given for certain wet Group D soils that are artificially drained by tiles and (or) ditches. The dual group indi-
cates that soil permeability has been increased through the use of drainage improvements. Artificial drainage from tiles increases runoff and decreases sediment dis-charge by increasing infiltration to the depth of the tile. In tile-drainage systems, runoff is quickly directed from the tiles to a system of ditches and eventually to streams (Logan, 1978; Fausey and others, 1995). Ditches may store eroded sediments because of their proximity to fields where gulley, sheet, and rill erosion occur.
The Maumee River Basin lies in the eastern U.S. Corn Belt. The major crops grown in the basin are corn, soybeans, wheat, oats, and alfalfa (hay). In 1996–97, 78.6 percent of all agricultural lands were cropland, and the crop rotation was corn and soybeans with some wheat and other small grains. As a percent-age of total crops, 87.2 percent were row crops; 28.8 percent corn, 43.8 percent soybeans, and 14.6 percent small grains (Hess, 1995). As a percentage of total crops in 1975–76, 93.7 percent of all agricultural lands were cropland; 34.4 percent corn, 34.8 percent soy-beans, and 24.5 percent small grains (Logan, 1978). The relative percentage of wide-row crops to total cropland has remained largely the same from 1975–98, between 69.2 percent and 72.6 percent. Greater soil erosion is associated with wide-row crops such as corn and soybeans, compared to narrow-row crops such as wheat and other small grains.
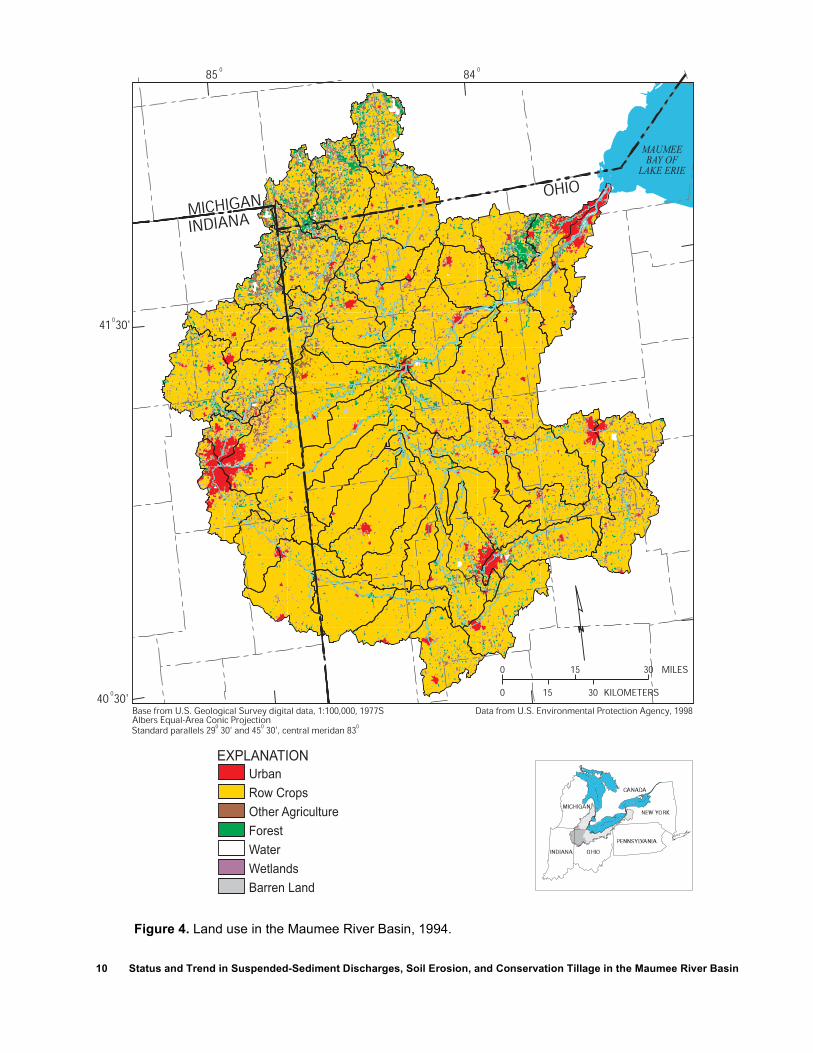
Campbell (1995) documented changes in land use in the Maumee River Basin during the past 160 years and showed that today, the basin is a highly altered environment compared to its natural condition. The central part of the Maumee River Basin extending from Toledo, Ohio, to Ft.Wayne, Ind., contains the highest clay content soils (fig. 3). This area was origi-nally a large wetland called the Black Swamp, about one-third the size of the original Everglades. Human influences in the Maumee River Basin began with the logging of the Black Swamp as early as 1840. By 1870, half the basin had been cleared of trees for agri-culture and drainage ditches were being installed. Dur-ing the past 150 years, nearly all original wetlands have been deforested, drained, and converted to pro-ductive farmland (Campbell, 1995). In 1994, just over 70 percent of the basin was agricultural (fig. 4) and only 10 percent of the original wetland remained (Campbell, 1995). The Maumee River Basin is affected by urban land use as well as agricultural land use (fig. 4). Major cities in the basin with populations of more than 100,000 (in 1990) are Toledo, Ohio and

Introduction 9
Figure 3. Soil hydrologic groups in the Maumee River Basin.
10 Status and Trend in Suspended-Sediment Discharges, Soil Erosion, and Conservation Tillage in the Maumee River Basin
Figure 4. Land use in the Maumee River Basin, 1994.

Data collection and analysis 11
Ft. Wayne, Ind. (American Map Corporation, 1993 and fig. 1).
Conservation tillage increases crop residue at the soil surface and protects the soil by reducing the impact of rain drops. Conservation tillage reduces sheet and rill erosion, reduces concentrated flow, and enhances infiltration. Conservation tillage consists of three types of practices; no till, mulch till, and ridge till. No till is a minimum cultivation method that pre-serves 40 percent or more of the crop-residue cover from the previous year’s crop on the surface of the field. Mulch till and ridge till are methods that pre-serve about 30 percent or more of crop-residue cover at the surface of the field. Conservation tillage was used by farmers on about 50 percent of all the corn and soybean acres in northwestern Ohio from 1993–98 (fig. 5). During that time, about 40 percent of the total acres in conservation tillage were in no till practices (U.S. Department of Agriculture, 1998).
Data collection and analysis
Suspended-sediment data were collected by the USGS as part of three ongoing water-quality projects—the National Water Quality Assessment Program in the
Lake Erie–Lake St. Clair Basin, the Toledo Harbor Project of the U.S. Army Corps of Engineers-Buffalo District, and the sediment-inventory network of the USGS and the ODNR (Ohio Department of Natural Resources). Table 2 and figure 6 show the stream sites sampled as part of these projects.
Sample collection and analysisData were aggregated from eight stream sites with drainage areas ranging from 332 mi2 to 6,330 mi2. Daily streamflow data were available for all sites dur-ing the time periods when suspended-sediment sam-ples were collected (table 2). The eight sites sampled include three sites on the main stem and five sites on tributary streams (fig. 6). The main stem sites are the Maumee River at New Haven, Ind., just downstream from the point where the St. Joseph River and St. Marys River join to become the Maumee River; mid-way along the main stem near Defiance, Ohio; and at a site representing 95.8 percent of the drainage basin, at Waterville, Ohio (fig. 6). The five other sites are on major tributaries to the Maumee River. One of five tributary sampling sites is in Indiana—the St. Joseph River near Newville, Ind. Four sampling sites are in Ohio—the Auglaize River near Defiance, the Auglaize
Figure 5. Trends in conservation tillage on corn and soybean fields in northwestern Ohio, 1982–98 (Ohio Lake Erie Commission, 1993; U.S. Department of Agriculture, 1998).
12 Status and Trend in Suspended-Sediment Discharges, Soil Erosion, and Conservation Tillage in the Maumee River Basin
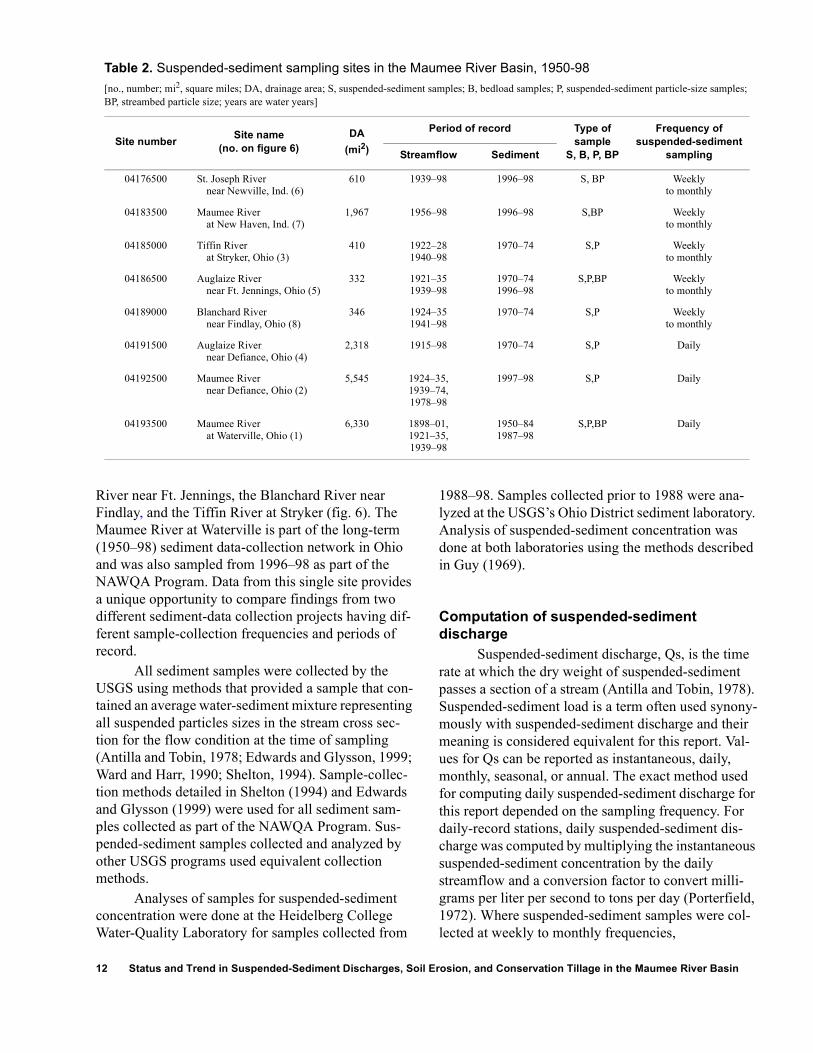
Table 2. Suspended-sediment sampling sites in the Maumee River Basin, 1950-98[no., number; mi2, square miles; DA, drainage area; S, suspended-sediment samples; B, bedload samples; P, suspended-sediment particle-size samples; BP, streambed particle size; years are water years]
Site number Site name(no. on figure 6)
DA (mi2)
Period of record Type of sample
S, B, P, BP
Frequency of suspended-sediment
samplingStreamflow Sediment
04176500 St. Joseph River near Newville, Ind. (6)
610 1939–98 1996–98 S, BP Weekly to monthly
04183500 Maumee River at New Haven, Ind. (7)
1,967 1956–98 1996–98 S,BP Weekly to monthly
04185000 Tiffin River at Stryker, Ohio (3)
410 1922–28 1940–98
1970–74 S,P Weekly to monthly
04186500 Auglaize River near Ft. Jennings, Ohio (5)
332 1921–35 1939–98
1970–74 1996–98
S,P,BP Weekly to monthly
04189000 Blanchard River near Findlay, Ohio (8)
346 1924–35 1941–98
1970–74 S,P Weekly to monthly
04191500 Auglaize River near Defiance, Ohio (4)
2,318 1915–98 1970–74 S,P Daily
04192500 Maumee River near Defiance, Ohio (2)
5,545 1924–35, 1939–74, 1978–98
1997–98 S,P Daily
04193500 Maumee River at Waterville, Ohio (1)
6,330 1898–01, 1921–35, 1939–98
1950–84 1987–98
S,P,BP Daily
River near Ft. Jennings, the Blanchard River near Findlay, and the Tiffin River at Stryker (fig. 6). The Maumee River at Waterville is part of the long-term (1950–98) sediment data-collection network in Ohio and was also sampled from 1996–98 as part of the NAWQA Program. Data from this single site provides a unique opportunity to compare findings from two different sediment-data collection projects having dif-ferent sample-collection frequencies and periods of record.
All sediment samples were collected by the USGS using methods that provided a sample that con-tained an average water-sediment mixture representing all suspended particles sizes in the stream cross sec-tion for the flow condition at the time of sampling (Antilla and Tobin, 1978; Edwards and Glysson, 1999; Ward and Harr, 1990; Shelton, 1994). Sample-collec-tion methods detailed in Shelton (1994) and Edwards and Glysson (1999) were used for all sediment sam-ples collected as part of the NAWQA Program. Sus-pended-sediment samples collected and analyzed by other USGS programs used equivalent collection methods.
Analyses of samples for suspended-sediment concentration were done at the Heidelberg College Water-Quality Laboratory for samples collected from
1988–98. Samples collected prior to 1988 were ana-lyzed at the USGS’s Ohio District sediment laboratory. Analysis of suspended-sediment concentration was done at both laboratories using the methods described in Guy (1969).
Computation of suspended-sediment discharge
Suspended-sediment discharge, Qs, is the time rate at which the dry weight of suspended-sediment passes a section of a stream (Antilla and Tobin, 1978). Suspended-sediment load is a term often used synony-mously with suspended-sediment discharge and their meaning is considered equivalent for this report. Val-ues for Qs can be reported as instantaneous, daily, monthly, seasonal, or annual. The exact method used for computing daily suspended-sediment discharge for this report depended on the sampling frequency. For daily-record stations, daily suspended-sediment dis-charge was computed by multiplying the instantaneous suspended-sediment concentration by the daily streamflow and a conversion factor to convert milli-grams per liter per second to tons per day (Porterfield, 1972). Where suspended-sediment samples were col-lected at weekly to monthly frequencies,

Data collection and analysis 13
Figure 6. Suspended-sediment sampling sites in the Maumee River Basin, 1950–98.

14 Status and Trends in Suspended-Sediment Discharges, Soil Erosion, and Conservation Tillage in the Maumee River Basin
suspended-sediment discharges were computed using a regression-based, multi-parameter statistical model (Cohn and others, 1989; Crawford, 1991). The model, LOADEST2 (Crawford, 1996), constructs a sus-pended-sediment transport curve based on coefficients developed from a multiple regression model with three or more parameters. The calibration data set consists of natural log-transformed values for instantaneous or daily streamflow in cubic feet per second, the natural log-transformed values for instantaneous suspended-sediment concentration in milligrams per liter, and decimal time.
The regression coefficients from the calibration data set for slope, intercept, season, and time are used to construct the model that predicts daily suspended-sediment discharge from daily streamflow. The model used for this report was developed from the MLE (maximum likelihood estimate) method. Results are reported in tons per day and can be summed to provide annual and seasonal values. The model output also provides standard deviations for the average daily sus-pended-sediment discharge for the year and average seasonal daily suspended-sediment discharges for spring, summer, fall, and winter. Summary statistics are provided for minimum, maximum, and the follow-ing percentiles: 25th, 50th, 75th, 90th, 95th, and 99th. A more detailed description of the use of LOADEST2 is given in the appendix to this report.
Computation of suspended-sediment budgetA suspended-sediment budget for the Maumee River Basin was constructed to express the percentage of average annual suspended-sediment discharge (in tons per year) contributed from sites in subbasins upstream from the Maumee River at Waterville, Ohio. Annual suspended-sediment discharges were computed using estimates from available data at eight sites (table 2); five sites sampled from 1996–98 and three sites sam-pled from 1970–74. Two of the three sites for which only retrospective data were used, contributed only a small percentage of the annual discharge relative to the sites monitored from 1996–98. The percentage of the annual suspended-sediment discharge from areas upstream from the Maumee River at Waterville were computed by dividing each into the suspended-sedi-ment discharge for the Maumee River at Waterville and multiplying by 100 to provide the percent of total. The suspended-sediment discharge at Waterville is assumed to represent 100 percent of the drainage area of the basin for purposes of this report. In reality, the
site at Waterville represents 95.8 percent of the total drainage area of the Maumee River Basin.
To obtain average annual suspended-sediment discharge estimates for sites with no data, retrospec-tive data (1970–74) and (or) recent data (1996–98) were used, and extrapolations were made to the ungaged sites. Where data were available for an upstream site but not for the most downstream site of the subbasin, suspended-sediment discharge was esti-mated for the downstream unmeasured site by multi-plying the average annual yield in tons per square mile per year from the upstream site by the drainage area for the downstream site. Because suspended-sediment yield usually decreases with increasing drainage area, a ratio of either the drainage areas or the yields was used as a correction factor where possible. Retrospec-tive data were used only in the absence of recent data. If both periods of data were available, a comparison was made to evaluate the similarity of sediment yield from the retrospective period to the recent period and from upstream to downstream sites. Land use (fig. 4) and other basin characteristics, such as soils and slopes, are similar in areas where extrapolations were made.
For the Auglaize River, the annual suspended-sediment discharge near Defiance for 1996–98 was estimated from data obtained at the upstream site near Ft. Jennings from 1996–98 and from retrospective data collected from 1970–74 at both sites. The average annual yields of suspended sediment for both sites reported by Antilla and Tobin (1978) were compared to the average annual yield computed for the Auglaize River near Ft. Jennings for 1996–98. Historically, the yield computed for the Auglaize River near Ft. Jen-nings, Ohio was 236 ton/mi2, and the yield computed for the Auglaize River near Defiance, Ohio was 216 ton/mi2 (Antilla and Tobin, 1978). The ratio of the two yields, 0.915, was used as the correction factor to com-pute the annual suspended-sediment discharge for the Defiance site based on 1996–98 data from the Ft. Jen-nings site. The corrected average annual yield esti-mated for the Auglaize River near Defiance was multiplied by the drainage area of the Auglaize River near Defiance, Ohio to provide the annual suspended-sediment discharge for the subbasin. For the St. Joseph River, only recent average annual yield estimates were available. The suspended-sediment discharge for the St. Joseph River at Ft. Wayne, Ind. was estimated by multiplying the yield computed for the St. Joseph River near Newville, Ind. by the drainage area near the

Data collection and analysis 15
mouth at the Ft. Wayne streamflow gaging station. The estimate for the St. Marys River and the Maumee River upstream from New Haven, Ind. was made by subtracting the value for the St. Joseph River from the value for the Maumee River at New Haven. Average annual sediment yield from the 1970–74 data set was the only retrospective data relied on entirely and was substituted in the sediment budget for the Tiffin River at Stryker. Data from the Blanchard River near Find-lay, Ohio was not used for the computation of sus-pended-sediment budgets although yield estimates for the Blanchard River were compared to other sites in the Auglaize River Basin.
Crops, conservation tillage, and soil loss dataAgricultural data on crops, conservation-tillage prac-tices, and soil-erosion rates were obtained from tillage transect surveys compiled for northwestern Ohio and northeastern Indiana for 1996–98 and for the Michi-gan portion of the St. Joseph River Basin for 1998. The Tillage Transect Survey is a data base developed by the CTIC (Conservation Technology Information Center) at Purdue University (Hess, 1996). Tillage Transect Survey is a computerized tracking system used by the NRCS to record various types of agricul-tural data. Tillage transect data are collected at approx-imately 400 agricultural fields per county using a random-selection method. Field surveys of crop types, land-management practices, soils, slopes, and other surface attributes are made from roadsides. Experi-enced NRCS district conservationists who collect these data provide user confidence in the quality of the data base. Data are scanned into a relational data base and can be retrieved by county or by 11-digit hydro-logic unit, which is equivalent to a part of a watershed. Survey data in tillage transect files represent only agri-cultural land uses and do not include other land uses.
From 1996–98, there were different levels of county participation in completing the tillage transect forms. In 1996–97, data files for 46 of 49 11-digit hydrologic units in the Maumee River Basin contained data on crops, tillage practices, and soil-erosion rates. In 1998, fewer counties participated. For this report, data from 1996–97 were used except when not avail-able, as was the case for the Michigan section of the St. Joseph River Basin for which 1998 data were used. Data for crops, tillage practices, and soil-erosion rates were retrieved from tillage transect files by 11-digit hydrologic unit. Maps showing the percentage of fields in conservation tillage and soil-loss by 11-digit
hydrologic units were constructed by overlaying these data on areas of mapped agricultural land use for the Maumee River Basin.
Soil-erosion rate is the unit area soil loss, expressed in tons per acre or tons per square mile. Soil-erosion rates are computed in the tillage transect program by use of the USLE (Universal Soil Loss Equation) (Wischmeier and Smith, 1978). The USLE can be used to predict the average rate of soil erosion for each combination of crop system and management practices in association with a specified soil type, rain-fall pattern, and topography (Wischmeier and Smith, 1978). As such, soil-erosion rate is an average value based on factors that are set in the USLE. Some fac-tors, such as soil type and drainage class, change little from year to year, but others, such as land use, crop-ping system, and management practices, can be changed by market forces and weather patterns from year to year.
Soil loss, in tons per year, is computed by multi-plying the average soil-erosion rate for each 11-digit hydrologic unit for each year by the area of each 11-digit hydrologic unit. Soil loss by 11-digit hydrologic unit was further averaged for 1996–97. Soil loss repre-sents only that eroded from the land surface as sheet and rill erosion and does not include erosion from stream banks or channels. Bank and channel erosion are thought to contribute only about 1 percent per year to the suspended-sediment discharge of the Maumee River Basin (U.S. Department of Agriculture, 1993). Soil loss from the land surface, or wash load, is useful for comparing the values in this report to those reported by other investigators (Logan, 1978; Baker, 1982). Soil-erosion rates from cropland in the Maumee River Basin reported in the tillage transect files range from less than 1.0 to 5.0 ton/acre.
The tillage transect files do not contain soil-ero-sion rates for land cover other than agricultural land. A value of 0.03 ton/acre is a typical estimate of soil loss from forested land, which is the second most common type of land cover in the Maumee River Basin. The value, 0.03, is mid-range between the values reported for soil-erosion rates on forested land in general, which range from 0.001 to 0.06 ton/acre (Kimberlin and Moldenhauer, 1977). Forested land contributes a minor amount soil erosion in the Maumee River Basin and was not included in the estimates reported here.

16 Status and Trends in Suspended-Sediment Discharges, Soil Erosion, and Conservation Tillage in the Maumee River Basin
Trend analysisTrends in suspended-sediment discharge were ana-lyzed at two sites, the Maumee River at Waterville and the Auglaize River near Ft. Jennings. The significance level set for the trend test statistics was α=0.05. A parametric approach was used for suspended-sediment trend analysis at both sites. Ordinary least squares regression with multiple explanatory variables was used to detect trends in daily suspended-sediment dis-charge for data collected from 1970–98 at the Maumee River at Waterville, Ohio. The data set of daily sus-pended-sediment discharges was nearly continuous with missing data only from 1984–87. The multiple-regression model used to test for trends at the Maumee River at Waterville specified streamflow, season, and time as explanatory variables. Serial correlation of the residuals with time was corrected by using the auto-correlated errors procedures, AUTOREG, in SAS (Helsel and Hirsch, 1992, p. 250-253). Afterwards, the regression model was checked for adequacy, that is (1) a linear form of the relation between suspended-sedi-ment discharge and time, (2) normality, homoscedas-ticity and independence of residuals, and (3) slope and other coefficients that are significantly different from zero (Helsel and Hirsch, 1992). The results from the trend test for the Maumee River at Waterville were plotted as a time series of regression residual values corrected for streamflow and season. Results were smoothed using LOWESS (Locally Weighted Scatter-plot Smoothing) (Cleveland, 1979) with a smoothing factor of 0.6 to show the trend over time in the residu-als of daily suspended-sediment discharge.
For the Auglaize River near Ft. Jennings, Ohio, a two-sample step-trend test was done using ANCOVA (analysis of covariance) to compare esti-mates of observed daily suspended-sediment discharge for 1970–74 to 1996–98 (Helsel and Hirsch, 1992, p. 348-351). Step-trend procedures such as ANCOVA are recommended when the time periods to be compared are broken-up by a relatively long time interval (Helsel and Hirsch, 1992, p. 349). For the Auglaize River near Ft. Jennings, there is a 23-year lapse between the periods of data collection.
The ANCOVA for the Auglaize River near Ft. Jennings was used to compare the two data sets of instantaneous suspended-sediment discharge, stream-flow, and season (1970–74 and 1996–98). These data sets were the same calibration data sets used in LOADEST2 to predict daily suspended-sediment dis-charge. An indicator variable was used to discriminate
between the 48 values of instantaneous suspended-sediment discharge from samples collected from 1996–98 from the combined data set of 88 instanta-neous values (1970–74 and 1996–98). The ANCOVA tested whether the instantaneous suspended-sediment discharge from the combined data set was significantly different from the more recent data set (1996–98). The test result is based on the probability value associated with the indicator variable comparing the data sets from the two time periods. To determine the amount and percent change over time in suspended-sediment discharge for the Auglaize River near Ft. Jennings, annual suspended-sediment discharges were computed using a set of daily streamflow values for 1997 and the two suspended-sediment rating curves generated from LOADEST2, one for 1970–74, and the other for 1996–98.
Relation of suspended-sediment discharges and yields to soil loss, soil-erosion rates, delivery ratios, and conservation tillage
Soil loss (erosion) and sedimentation by water prima-rily involve the processes of detachment, transport, and deposition of sediment from raindrop impact and flowing water. In turn, these processes are affected by drainage area size, slope, soil drainage, and vegetative cover that determine the proportion of sediment that is delivered to waterways. The proportion of the export of these materials from the land surface out of the drainage basin (delivery ratio) and the unit area dis-charge of suspended sediment (yield) are measures that can be used to identify areas of proportionately greater suspended-sediment discharge. In the Maumee River Basin, soil losses are usually less than the tolera-ble amount (from 2–4 ton/acre). Suspended-sediment discharges from the basin are considered high even though soil loss is low because of the relatively large size of the drainage area.
Suspended-sediment discharge and yieldThe annual and seasonal mean daily values for sus-pended-sediment discharge, the standard deviation of the mean daily values, data-collection period, drainage area, number of samples, and LOADEST2 model coefficients, are shown in table 3 for the five sites sampled from 1996–98. Because suspended-sediment discharges from daily record stations on the Maumee

Relation of suspended-sediment discharges and yields to soil loss, soil-erosion rates, delivery ratios, and conservation tillage 17
River near Defiance and at Waterville were used in the data analysis, these results are compared to the LOADEST2 estimates to examine differences in sam-pling frequency (table 3). Retrospective data (1970–74) and combined data (1970–74 and 1996–98) for the Auglaize River near Ft. Jennings are also shown in table 3.
Annual and seasonal mean daily values for sus-pended-sediment discharge increase with increasing drainage area, although values for the St. Joseph River are smaller than those for the Auglaize River near Ft. Jennings even though the drainage area contributing suspended sediment to the St. Joseph River is almost twice as large. In general, the highest mean daily sus-pended-sediment discharges are in the spring, fol-lowed by summer, winter, and fall. One exception is the Auglaize River, where the highest mean daily val-ues are in summer. This pattern, which is evident in both data sets (1970–74 and 1996–98) was unex-pected, and its cause is not known. The standard devi-ations of the mean daily values were about 20 percent of the mean but ranged from about 3.3 to 45 percent of the mean. Standard deviations of mean daily sus-pended-sediment discharge are useful to assess the
uncertainty of estimates and to compare differences among sites and among seasons at the same site.
It is possible to compare estimates of sus-pended-sediment discharge computed using LOADEST2 to those generated from daily record because both types of estimates are available for the Maumee River near Defiance and at Waterville. For these two main stem sites, LOADEST2 provided somewhat higher estimates of mean daily suspended-sediment discharge than did a daily value summed for each year and averaged. For the main stem near Defi-ance, the two estimates fell within 2 standard devia-tions of each other. For Waterville, the daily value estimate fell more than 2 standard deviations below the LOADEST2 estimate. It is assumed that the daily value would be more representative of the suspended-sediment discharge than the modeled value. This com-parison provides some measure of the uncertainty of using rating-curve models to estimate annual sus-pended-sediment discharges from data collected at weekly to monthly sampling frequencies.
Average and annual suspended-sediment dis-charges and yields are compared for the Maumee River Basin at the five sites sampled from 1996–98 (table 4). Annual variations in these measures are
Table 3. Site name, data-collection period, drainage area, model coefficients, annual and seasonal mean daily suspended-sediment discharges[DA, drainage area; mi2, square mile; βo, y-intercept; β1, β2 slope coefficients; β3,β4, seasonal coefficients; β5, decimal time coefficient; ln, natural logarithm; n, sample size; d, day; nc, not computed; --, term not needed in model]
Site nameData-
collection period
DA(mi2)
Model coefficientsAnnual and seasonal average daily
suspended-sediment discharge (and standard deviation), in tons per day
βo β1 β2 β3 β4 β5 n Annual Spring Summer Fall Winter
St. Joseph River near Newville, Ind.
1996–98 610 1.8824 1.6013 -- -0.2871 -0.7446 -- 52 200(20)
260(33)
230(15)
62(28)
140(30)
Maumee River at New Haven, Ind.
1996–98 1,967 0.82875 1.6942 -- -.22997 -.52227 -- 32 1,100(130)
5,600(210)
1,300(210)
240(71)
880(140)
Auglaize River near Ft. Jennings, Ohio
1970–74
1996–98
332 5.8162
2.6661
0.5450
1.5797
0.0919
--
-.5572
-.41961
-.9715
-.93885
--
--
40
48
540(150)
260(52)
230(36)
160(29)
1,700(520)
740(160)
10(2)
7(1)
220(51)
130(35)
Maumee River at Defiance, Ohio
1997–98LOADEST2
Daily value
5,545 1828.8 0.63172 .07351 -.46255 -.22506 -0.9135 299
730
6,100(430)
5,370
9,100(740)
5,500(670)
1,100(80)
8,400(410)
Maumee River at Waterville, Ohio
1996–98 LOADEST2
Daily value
6,330 219.25 .23102 .08200 -.25508 -.22267 -1.0944 294
1,096
6,300(590)
4,960
10,700(1,000)
5,000(1,000)
1,000(54)
8,300(450)

18 Status and Trends in Suspended-Sediment Discharges, Soil Erosion, and Conservation Tillage in the Maumee River Basin
related to natural factors such as drainage area, rain-fall, soil erosion driven by runoff, soil drainage and runoff potential, crop type, cover, and conservation tillage practices. Annual and average annual sus-pended-sediment discharge increased with drainage area, although not proportionately (table 4). Average annual suspended-sediment discharge for the period 1996–98 ranged from 71,800 ton/yr for the St. Joseph River near Newville to 1,960,000 ton/yr for the Maumee River at Defiance (table 4). The Auglaize River near Ft. Jennings discharged an average of 88,900 ton/yr of suspended sediment from 1996–98, 1.2 times that of the St. Joseph River near Newville for the same time period even though the drainage area contributing to the Auglaize River near Ft. Jennings is just 54.4 percent the size of the drainage area contrib-uting to the St. Joseph River near Newville (table 4).
The unit discharge (yield) of suspended sedi-ment, measured in tons per square mile per year for the sites sampled from 1996–98, ranged from 118 ton/mi2/yr for the St. Joseph River near Newville to 354 ton/mi2/yr for the Maumee River near Defiance, Ohio
(table 4). The average yields from the tributaries and the main stem differ considerably, with the highest average annual tributary yields coming from the Auglaize River near Ft. Jennings, which drains rela-tively fine textured and very poorly drained soils with low permeability and high runoff potential. The great-est annual and average annual yields of suspended-sediment in the Maumee River Basin reported by Logan (1977; 1978, p. 79) were also in areas with the finest textured soils. When normalized against stream-flow, instantaneous suspended-sediment yields, unlike annual yields, decrease with increasing drainage area for the Auglaize River near Ft. Jennings, St. Joseph River near Newville, Maumee River at New Haven, and Maumee River at Waterville (fig. 7).
Soil loss, soil-erosion rates, conservation tillage, and delivery ratiosSoil loss from the land surface, in tons per year, is greatest in the similarly sized hydrologic units at the outer edges of the Maumee River Basin where stream
Table 4. Soil loss, soil loss as a percentage of the total at Waterville, Ohio, suspended-sediment discharge, soil-erosion rates, and delivery ratios for selected sites in the Maumee River Basin; 1996–98[t/mi2/yr, tons per square mile per year; DR, Delivery Ratio; mi2, square mile; avg, average; nd, no data]
Site name(Drainage area in mi2)
Wateryear
(1)Total soil
loss(tons)
Soil loss as a percentage of
total at Waterville, Ohio
Soil erosion
rate (ton/mi2)
(2)Suspended-
sediment discharge
(tons)
Annual yield
(ton/mi2/yr)
Deliveryratio(2/1)
St. Joseph River near Newville, Indiana (610)
199619971998avg
977,000995,000919,000964,000
19.018.5nd
18.4 1,580
91,30054,80069,40071,800
15089.8114118
0.0930.0550.0760.074
Maumee River at New Haven, Indiana(1,967)
199619971998avg
2,470,0002,680,000
nd2,580,000
48.149.8nd
49.0 1,310
402,000438,000365,000402,000
204223186205
0.1630.164
nd0.156
Auglaize River near Ft. Jennings, Ohio (332)
199619971998avg
244,000285,000
nd264,000
4.755.30nd
5.02 795
91,300102,00073,00088,900
275308220268
0.3740.359
nd0.337
Maumee River near Defiance, Ohio (5,545)
199619971998avg
4,510,0005,020,000
nd4,760,000
87.793.3nd
90.5 858
nd2,350,0001,570,0001,960,000
nd424283354
nd0.468
nd0.412
Maumee River at Waterville, Ohio (6,330)
199619971998avg
5,140,0005,380,000
nd5,260,000
100100nd100 831
1,360,0002,070,0001,990,0001,810,000
215327314285
0.2650.385
nd0.344

Relation of suspended-sediment discharges and yields to soil loss, soil-erosion rates, delivery ratios, and conservation tillage 19
Figure 7. Relation between instantaneous suspended-sediment yield and instantaneous streamflow at selected sites in the Maumee River Basin, 1996–98
10 100,000100 1,000 10,000INSTANTANEOUS STREAMFLOW,
IN CUBIC FEET PER SECOND
0.001
100
0.01
0.1
1
10
INS
TAN
TAN
EO
US
SED
IMEN
T YI
ELD
,IN
TO
NS
PER
DA
Y PE
R S
QU
ARE
MIL
E EXPLANATION
Auglaize River near Ft. Jennings, Ohio (drainage area, 332 square miles)
St. Joseph River near Newville, Indiana (drainage area, 610 square miles)
Maumee River at New Haven, Indiana (drainage area, 1,967 square miles)
Maumee River at Waterville, Ohio (drainage area, 6,330 square miles)
slope is the greatest (fig. 8). In comparison, soil loss is much lower in the hydrologic units in the relatively flat center of the basin (fig. 8). Like suspended-sedi-ment discharge, soil loss increases in a downstream direction as drainage area increases at monitored sites (table 4). From 1996–98, soil loss ranged from an average of 264,000 ton/yr in the smallest monitored basin, the Auglaize River near Ft. Jennings, to an aver-age of 5,260,000 ton/yr for the Maumee River at Waterville, the largest monitored basin (table 4). Unlike soil loss, which increased in a downstream direction, average soil-erosion rates from 1996–98 dif-fered from basin to basin with the highest rates in the St. Joseph River near Newville at 1,580 ton/mi2; fol-lowed by the Maumee River at New Haven at 1,310 ton/mi2; the Maumee River near Defiance at 858 ton/mi2; the Maumee River at Waterville at 831 ton/mi2, and the Auglaize River near Ft. Jennings at 795 ton/mi2.
Because soil loss is determined, in part, by land cover and crop residue, conservation tillage patterns for 1996–98 were mapped for the 11-digit hydrologic units in the Maumee River Basin to determine where the greatest amounts of conservation tillage were
being used (fig. 9). Cover and cropping practices, which can cause relatively large annual variations in soil loss, remained largely the same from 1996–97. The percentage of fields in conservation tillage was highest in small subbasins of the main stem down-stream from Defiance, in the Tiffin River Basin, and in the St. Joseph River Basin. Comparing figures 8 and 9, the percentage of fields in conservation tillage was somewhat lower in the hydrologic units draining to the main stem between New Haven and Defiance where soil loss also was lower relative to the rest of the basin. Conservation tillage was relatively higher in some areas with higher soil loss such as the St. Joseph River Basin and relatively lower in some areas with high soil loss such as the St. Marys River Basin and Auglaize River Basin (figs. 8 and 9).
Typically, not all eroded soil leaves the basin or even the field where it originates. The DR (Delivery Ratio) is the fraction of soil loss that leaves the basin by stream transport. The DR is computed by dividing suspended-sediment discharge in tons per year by soil loss in tons per year. For this report, only the sus-pended fraction of sediment discharge was used to compute DRs. Bed load also contributes to sediment.

20 Status and Trend in Suspended-Sediment Discharges, Soil Erosion, and Conservation Tillage in the Maumee River Basin
Figure 8. Soil loss in the Maumee River Basin by hydrologic unit, 1996-98.

Relation of suspended-sediment discharges and yields to soil loss, soil-erosion rates, delivery ratios, and conservation tillage 21
Figure 9. Percentage of fields in conservation tillage in the Maumee River Basin by hydrologic unit, 1996-98.

22 Status and Trends in Suspended-Sediment Discharges, Soil Erosion, and Conservation Tillage in the Maumee River Basin
discharge, but detailed information of this type is not available for the Maumee River or its tributaries. Val-ues for suspended-sediment DRs range from 0 to 1.0. A delivery ratio of 0 indicates complete retention of soil loss in a basin with no transport as sediment dis-charge. A delivery ratio of 1.0 indicates that all soil loss is transported from a basin as sediment discharge.
The average annual DRs at the five sites mea-sured from 1996–98 (table 4) ranged by a factor of 5.6; from 0.074 at the St. Joseph River near Newville to 0.412 at the Maumee River near Defiance (table 4). The DRs reported herein for the Auglaize River near Ft. Jennings and the St. Joseph River near Newville are similar to those reported by Logan (1978, p. 79). Logan (1978) reported DRs from small subbasins con-taining very poorly drained soils that ranged from 0.217 to 0.619 and DRs from subbasins containing moderately well-drained to somewhat poorly drained soils that ranged from 0.063 to 0.161. The long-term average DR reported for the Maumee River at Water-ville by NRCS in the late 1980s was 0.12 (U.S. Department of Agriculture, 1993). The Great Lakes Basin Commission (reported by Logan, 1978) esti-mated an average DR for the Maumee River at Water-ville of 0.149. The average DR computed for the Maumee River at Waterville in this report, 0.344, is about three times higher than the long-term DRs reported by Baker (1982) and U.S. Department of Agriculture (1993, p. 3). Although DRs reported by Baker (1982) and USDA (1993) are long-term aver-ages, the DRs reported in this study were computed from samples collected during two relatively wet years and so might be expected to be higher than a long-term average. Delivery ratios reported for rivers in the United States range from 0.03 to 0.95 (Holeman, 1968). Delivery ratios reported for the Maumee River appear to be low to mid-range compared to rivers of the nation and world (Holeman, 1968; Trimble, 1975).
The findings in this report suggest that the high-est DRs and yields are associated with subbasins in the Maumee River with the lowest soil-erosion rates. These are areas of fine-textured, poorly drained soils with high runoff potential. These areas of fine-textured soils were not necessarily the same areas where con-servation tillage was used in the highest percentages (figs. 8 and 9). These findings further suggest that the poorly drained soils with high runoff potential are more readily exported from subbasins and do not accumulate in the watershed to the same degree as coarse-grained particles. Because of their smaller size,
fine particles can be transported for longer periods of time and greater distances than coarse-grained parti-cles. In addition, these areas of very fine-textured soils may be the most important areas to control in terms of reducing the amount of sediment dredged from the lower Maumee River. These findings are consistent with those reported by other investigators (Jones and others, 1977; Logan, 1978; Beasely, 1985) about the importance of areas of fine-textured, poorly drained soils with high runoff potential to suspended-sediment discharge.
Suspended-sediment budget
Suspended-sediment budgets can be useful for sedi-ment management and control in the Maumee River Basin by helping to further identify areas that dis-charge the greatest amounts of suspended sediment. A question that can be answered through use of a sedi-ment budget is which subbasins or segments of the main stem contribute the greatest amounts of sus-pended sediment to the downstream end of the basin at Waterville?
Results of the suspended-sediment discharge computations and sediment budget for 1996–98 (table 5, fig. 10) indicate that average annual sus-pended-sediment discharges in the Maumee River main stem increased from 402,000 ton/yr at New Haven, Ind., to 1,960,000 ton/yr at Defiance, Ohio and then decreased to 1,810,000 ton/yr at Waterville, Ohio. Expressed as percentage of the total suspended sedi-ment measured at Waterville, Ohio, 22.2 percent of the total passes through the main stem at New Haven and 108 percent of the total passes through the main stem near Defiance, Ohio (table 5, fig. 10). The small differ-ence, 8 percent, between the main stem sites at Water-ville and near Defiance is likely within the precision of the load-estimation method.
The estimated amount of sediment discharged from the major tributaries for 1996–98 was 565,000 ton/yr from the Auglaize River, 277,000 ton/yr from the St. Marys River and the portion of the main stem that flowed past New Haven, Ind.; 125,000 ton/yr from the St. Joseph River; and 43,500 ton/yr from the Tiffin River (table 5). Expressed as a percentage of the total measured at Waterville, Ohio; 31.2 percent was discharged from the Auglaize River; 15.3 percent was discharged from the St. Marys River and flowed past New Haven, Ind.; 6.91 percent was discharged from

Suspended-sediment budget 23
the St. Joseph River; and 2.40 percent was discharged from the Tiffin River (table 5, fig. 10).
The average amount of suspended-sediment discharged from the Auglaize, the St. Joseph, the St. Marys, and the Tiffin Rivers; the four largest tributar-ies to the Maumee River, is estimated to be about 1,010,000 tons; 950,000 tons less than the 1,960,000 tons measured at the downstream site on the main stem near Defiance, Ohio. The total tributary contribu-tion was 800,000 tons less than the 1,810,000 ton/yr discharged from the main stem at Waterville. A rela-tively large amount of suspended sediment, 954,000 tons or 52.7 percent of the total suspended-sediment discharged at Waterville, was discharged in the main stem between New Haven, Ind., and Defiance, Ohio. This sediment discharge could not be attributed to the
four major tributaries—the Auglaize, St. Joseph, St. Marys, or Tiffin Rivers—but is attributed to a small drainage area of the main stem of only 483 mi2 between New Haven, Ind. and Defiance, Ohio (table 5, fig. 10). The suspended-sediment yield computed for this area is 1,980 ton/mi2/yr.
Potential sources of this additional sediment could be the tributaries draining to the main stem between New Haven and Defiance and (or) sediment deposited and stored in the main stem channel, the flood plains, and ditches. These deposits would be available for resuspension during floods. Another explanation may be errors in the suspended-sediment budget resulting from the use of retrospective data to estimate tributary sediment discharge. For example, extrapolations using upstream estimates to compute
Table 5. Drainage area, average annual streamflow, and suspended-sediment discharge at selected sites in the Maumee River Basin, expressed as a percentage of the total at Waterville, Ohio, 1996–98 [ft3/s, cubic feet per second; ton/yr, tons per year; mi2, square mile]
Site name(time period of data collection)
Mean annual streamflow;
1996–98 (ft3/s)
Percentage of average annual streamflow at
Waterville, Ohio1996-98
Average annual
suspended-sediment discharge
(ton/yr)
Percentage of average annual
suspended-sediment discharge at Waterville, Ohio
Drainage area(mi2)
Tiffin River at Stryker, Ohio (1970–74)
458 6.62 23,000 1.27 410
Tiffin River Basin, Michigan and Ohio 869 12.6 43,500 2.40 777
St. Joseph River near Newville, Ind. (1996–98)
678 9.80 71,800 3.97 610
St. Joseph River at Ft. Wayne, Ind. 1,250 18.1 125,000 6.91 1,060
St. Marys River and Maumee River betweenFt. Wayne and New Haven, Ind. (1996–98)
1,140 16.5 277,000 15.3 762
Auglaize River near Ft. Jennings, Ohio (1996–98)
367 5.30 88,900 4.91 332
Auglaize River near Defiance, Ohio
(1970–74)2,560 37.0 565,000 31.2 2,318
Maumee River from New Haven to Defiance, Ohio 295 4.26 954,000 52.7 483
Maumee River from Defiance to Waterville, Ohio 796 11.5 (150,000)a -8.29 785
Maumee River at New Haven, Ind. (1996–98)
2,390 34.5 402,000 22.2 1,967
Maumee River near Defiance, Ohio
(1997–98)6,120 88.4 1,960,000 108 5,545
Maumee River at Waterville, Ohio (1996–98)
6,920 100 1,810,000 100 6,330
aSuspended-sediment discharge at upstream site is higher than at downstream site.

24 Status and Trend in Suspended-Sediment Discharges, Soil Erosion, and Conservation Tillage in the Maumee River Basin
Figure 10. Suspended-sediment budget for the Maumee River Basin, 1996–98.
the suspended-sediment discharge at the downstream terminus of major tributaries could be a partial expla-nation for the elevated yields computed for the main stem from New Haven to Defiance. Another source of error could be the greater uncertainty arising from computations based on samples collected at a less than daily frequency at all but two main stem sites. Clearly, the estimates of the suspended-sediment budget could be improved by additional data collection at selected sites.
Trends in soil loss, conservation tillage, streamflow, and suspended-sediment discharge
The periods of time over which trends are examined in this report, 1970–98 and 1970–74 compared to 1996–98, represent periods of change in farming practices in
the Maumee River Basin that may affect changes in suspended-sediment discharge. From the early 1950s to late 1970s, a combination of high commodity prices, the increased use of agricultural chemicals, and larger and more efficient farming machines led to the elimination of fence rows and a switch from a longer to a shorter crop rotation. These factors led to greater soil erosion and sedimentation in the Maumee River Basin (Logan, 1978; U.S. Department of Agriculture, 1993). Field sizes before 1950 were from 5 to 10 acres and were planted in small grains and hay. “Small fields and long rotations provided a reasonable measure of soil erosion and sediment control until the period fol-lowing World War II” (U.S. Department of Agricul-ture, 1993). With the use of larger, more efficient farm machinery, farm size increased from 1975–95 even though the number of farms decreased (Baker and oth-ers, 1998). Comparison of estimates for the Maumee River Basin from the mid-1970s (Logan, 1978) to the

Trends in soil loss, conservation tillage, streamflow, and suspended-sediment discharge 25
mid-1990s from tillage transect data, shows a down-ward trend in number of acres planted in corn and small grains of 6.5 percent and 9.0 percent, respec-tively. Over the same period, 9.0 percent more acres were planted in soybeans. Overall, from 1975–95 total crop acres remained relatively stable (Baker and oth-ers, 1998).
Soil losses and soil erosion rates from agricul-tural lands in the Maumee River Basin during the 1970s, at a time when conservation tillage was not used (Logan, 1978, p. 21; Waldron, 1984, p. 24), were estimated to be about 9 million ton/yr (U.S. Depart-ment of Agriculture, 1993) or about 2.24 ton/acre on average (Baker, 1982, p. 21). Conservation tillage was used on 5 percent or less of all crop fields before 1988, on 15 to 30 percent of all crop fields from 1988–92, and on about 50 percent of all crop fields from 1993–98 (fig. 5). At an average of 1.30 ton/acre, the average soil erosion rate for the Maumee River Basin reported in this study appears to be 58 percent less than that reported in the 1970s. There would be some uncer-tainty in this estimated downward trend because the parameter values used in USLE estimates from the late 1970s (Baker, 1982) could not be checked against the parameter values used in the tillage transect files for 1996–98.
Changes in suspended-sediment discharges resulting from best-management practices such as con-servation tillage can be difficult to detect because of the high degree of variability from year to year in pre-cipitation, streamflow, and suspended-sediment dis-charge. Hydrologic factors that can affect suspended-sediment discharge are major floods and droughts. Casey and others (1997) reported the occurrence of
major floods and droughts in the Lake Erie–Lake St. Clair Basin on the basis of work compiled by Paulson and others (1991) and flood and drought reports from the USGS’s Michigan, Indiana, and Ohio Offices (1990–98). Major floods in Maumee River Basin between 1950–98 were in January and February 1959, in March 1978, and in March 1982. Major floods on the St. Joseph River were noted in March 1982 and on the Blanchard River in June 1981. Greater than aver-age streamflows were recorded on the Auglaize River from 1968–87, interrupted by a mild drought from 1975–77 and in 1988. Droughts also were recorded for the Auglaize River in 1957 and statewide in southeast-ern Michigan, Ohio, and Indiana in 1988. This anec-dotal information can be used to help interpret results of trend tests. Higher than average streamflows were noted in the Maumee River Basin during the study (1996–98).
Auglaize River near Ft. Jennings, OhioA highly significant downward trend in mean daily suspended-sediment discharge for the Auglaize River near Ft. Jennings (p=0.0011) was detected when sus-pended-sediment discharges from 1996–98 were com-pared to those from 1970–74. The coefficients for streamflow, season, and the indicator variable discrim-inating between the two data sets were all highly sig-nificant (p<0.001, table 6). The R2 value, or coefficient of determination, was 0.936, indicating that the model accounted for most of the variation in sus-pended-sediment discharge (table 6). Because the indi-cator variable was significantly different from 0, the two data sets were judged to be significantly different
Table 6. Statistics, model coefficients, and probability values associated with trends in suspended-sediment discharge for the Auglaize River near Ft. Jennings, Ohio and Maumee River at Waterville, Ohio[Q, streamflow terms; n, sample size; βo, y-intercept; β1, ln Q term of slope; β2, Q2 term of slope; β3, seasonal coefficient for sin(2pi*decimal time); β4, seasonal coefficient for cos(2pi*decimal time); β5, coefficient of decimal time; ln, natural logarithm; I, indicator variable; Lag 1, coefficient of serial correlation for lag ei-1 residuals; Lag 2, coefficient of serial correlation for lag ei-2 residuals; nc, not computed; --, term not needed in model; nr, not reported]
Site name (Data- collection
period)
Modelstatistics n
Model coefficients (approximate p-values) Durbin-WatsonstatisticR2 βo β1 β3 β4 β5 I Lag 1 Lag 2
Auglaize River near Ft. Jennings, Ohio(1970–74 compared to 1996–98)
F-statistic303.3p=0.0001
88 0.936 3.1443(0.0001)
1.5855(0.0001)
-0.5400(0.0001)
-0.9522(0.0001)
-- -0.5079(0.0011)
-- -- --
Maumee River at Waterville, Ohio(1970–98)
nr 9,490 .985 -3.9253(0.3824)
1.6131(0.0001)
-0.2557(0.0001)
-0.4424(0.0001)
-0.0054(0.0174)
-- -1.0070(0.0001)
0.1491(0.0001)
1.9799

26 Status and Trends in Suspended-Sediment Discharges, Soil Erosion, and Conservation Tillage in the Maumee River Basin
from each other. The sign of the indicator variable was negative, indicating that the suspended-sediment dis-charge computed for 1996–98 was lower than that in 1970–74.
The Kendall-tau test indicated no significant long-term trend in mean daily streamflow from 1970–98 at the USGS streamflow gage at the Auglaize River near Ft. Jennings. Box plots of streamflow comparing daily values during 1970–74 and 1996–98 show that the maximum streamflows, the flows at which most sediment is transported, were fairly similar for the two time periods. The median and range of daily stream-flows were higher in the more recent time period (fig. 11). The reason for the trend in the suspended-sedi-ment discharge, therefore, does not appear to be related to a long-term trend or large difference in mean daily streamflow even though greater than average streamflows were reported on the Auglaize River from 1996–98 and elevated streamflows were previously documented from 1968–87 (Paulson and others, 1991). The effects of streamflow on average daily sus-pended-sediment discharge were factored out of the ANCOVA, leaving the conclusion that if other impor-
tant variables, such as streamflow, were not changing over the same period, the differences detected in sus-pended-sediment discharges may be the result of wide-spread adoption of conservation tillage. A scatterplot (fig. 12) of daily suspended-sediment discharge shows that at the same streamflows, the suspended-sediment discharge was proportionately lower in 1996–98 than in 1970–74.
Maumee River at Waterville, OhioDownward trends in average daily suspended-
sediment discharge were detected from 1970–98 at the Maumee River at Waterville, Ohio. After the removal of serial correlation of the errors with time, the coeffi-cients of the slope and seasonal terms (b1–b4) were found to be significantly different from zero (p=0.0001, table 6). The coefficient for time, -0.0054 (b5 in table 6), was significant at p=0.0174, indicating a long-term downward trend during 1970–98. Because the residuals of the parametric regression model, although distributed symmetrically, were not distrib-uted normally, the nonparametric Kendall-tau
Figure 11. Instantaneous streamflow at the Auglaize River near Ft. Jennings, Ohio, 1970–74 and 1996–98.

Implications for sediment management 27
Figure 12. Estimated daily suspended-sediment discharges for the Auglaize River near Ft. Jennings, Ohio, 1970–74 and 1996–98.
1970-74
1996-98
test also was used to test for monotonic trends with time in suspended-sediment discharge (adjusted for streamflow, season, and serial correlation). The Ken-dall-tau statistic computed for the correlation between the residuals of daily suspended-sediment discharge and time was -0.02968 (p=0.0001). Trends in mean daily streamflow also examined for the time series using the Kendall-tau test indicated no significant change in mean daily streamflow from 1970–98. The reason for this downward trend is inferred to be the widespread adoption of conservation tillage through-out the Maumee River Basin.
The time trend in the daily values for sus-pended-sediment discharge corrected for variability caused by streamflow, season, and serial correlation are plotted in figure 13. The LOWESS smoothed line shows the downward trend with time from 1970–98.A sharp downward trend is noticeable from about 1978–82 and may be the result of a recovery from accelerated soil erosion caused by the adoption of row-crop rotations in the mid-1950s to mid-1970s and
higher than normal streamflow discharges during the same time. The downward trend with time appears to resume in the late 1980s, about the time when conser-vation tillage was first adopted. The downward trend appears to continue but at a slightly higher rate from 1993–98, about the time of accelerated adoption of conservation tillage in the basin (fig. 13).
Implications for sediment management
Natural factors like slope, soil texture, and soil-runoff potential play important roles in determining the effec-tiveness of conservation tillage in reducing sediment discharge in the Maumee River Basin. Comparatively higher delivery ratios and higher yields are associated with the areas of either comparatively lower soil-ero-sion rates or comparatively lower use of conservation tillage. These areas are characterized by relatively fine-textured soils that are more vulnerable to dis-placement and transport by water. Where these soil

28 Status and Trend in Suspended-Sediment Discharges, Soil Erosion, and Conservation Tillage in the Maumee River Basin
Figure 13. Relation of trend in the residuals of the naturallogarithms of daily suspended-sediment discharges for the Maumee River at Waterville, Ohio, 1970–98 to increases in percentage of crop fields in conservation tillage, 1982–98.
types and slopes are present, as in the basins of the Auglaize and St. Marys Rivers, suspended-sediment discharges appear to be greater, and sediment appears to be transported more efficiently to downstream areas, as indicated by relatively higher yields and delivery ratios. These findings are not obvious when only the USLE estimates of soil erosion are consid-ered. Water-quality data were needed to draw these conclusions.
Evaluation of sediment-reduction goalsThe statistical models that detected significant down-ward trends in suspended-sediment discharges for the Auglaize River near Ft. Jennings and Maumee River at Waterville were used to estimate the change in tons of suspended-sediment discharged per year and to what degree the goals set by the USACE and Ohio Lake Erie Commission are being attained. To determine sus-pended-sediment reductions for the Auglaize River near Ft. Jennings, annual suspended-sediment dis-charges were computed using a set of daily streamflow values for 1997 and the two suspended-sediment rat-ing curves generated from LOADEST2, one for 1970–74, and the other for 1996–98. The annual suspended-sediment discharge for 1997 computed using the old rating curve (1970–74) was 560 ton/d and 205,000
ton/yr compared to 280 ton/d and 102,000 ton/yr com-puted using the new rating curve (1996–98). Annual suspended-sediment discharge is 49.8 percent lower in the 1996–98 data set than in the 1970–74 data set (fig. 14). This result can be interpreted to mean that at the same daily streamflows, sediment discharge in the later period was about half that in the earlier period. If realistic, the 49.8 percent decrease in suspended-sedi-ment discharge corresponds to an increase in the use of conservation-tillage practices to 65.3 percent in the areas upstream from Ft. Jennings from 1996–98. A large seasonal variation in average daily suspended-sediment discharge took place in both time periods (fig. 14), with the highest seasonal daily suspended-sediment discharges in summer (fig. 14 and table 3).
A slightly different computation was used to estimate the decrease in suspended-sediment discharge for the Maumee River at Waterville. The slope of the regression line used for computing suspended-sedi-ment discharge indicates that suspended-sediment dis-charge is decreasing at an average rate of 0.4 percent per year, or 11.2 percent during 1970–98. At a rate of 0.4 percent per year or 6,700 ton/yr, a total cumulative decrease per year for the past six years (1993–98), when conservation tillage was the highest, is estimated to be about 81,000 tons. The average use of

Implications for sediment management 29
Figure 14. Mean daily suspended-sediment discharges for the Auglaize River near Ft. Jennings, Ohio, 1970-74 and 1996-98.
conservation tillage for 1996–98 was 55.4 percent in the Maumee River Basin, compared to about 50 per-cent for northwestern Ohio and 45.0 percent Statewide (U.S. Department of Agriculture, 1998 and fig. 5).
The trend data for the Maumee River at Water-ville can be used to evaluate attainment of sediment-dredging-reduction goals established for the Port of Toledo. The U.S. Department of Agriculture (1998) recommended that use of conservation tillage could reduce the agricultural contribution to sediment dredged from the main stem of the river in Toledo, Ohio by 15 percent. The annual average suspended-sediment discharge at Waterville from 1950–92 was 1,270,000 ton/yr (rounded to 1,300,000; U.S. Depart-ment of Agriculture, 1998; Shindel and others, 1993). The trapping efficiency of suspended sediment by the Maumee River is estimated to be about 0.33, or 33 percent of the discharge of sediment at the Maumee River at Waterville, Ohio (U.S. Department of Agri-culture, 1993, 1998). Based on empirical data from the USDA, the estimated average density of sediment dredged from the river is about 0.54 ton/yd3. The reciprocal of this value, 1.85, is used as a conversion factor to compute the cubic yards per ton of sediment from tons per year. The computation used by USDA for determining success in reaching this goal is:
1,300,000 ton/yr x 0.33 (trapping efficiency) x (1.85 yd3/ton) = 793,650 yd3/yr
This formula was used to determine the 1992 reference condition of 800,000 yd3 of sediment (rounded) dredged from the navigation channel. A 15 percent reduction in 800,000 yd3 is 120,000 yd3. If the trapping efficiency estimate is reasonable, a back-cal-culation from a 15 percent reduction goal of 680,000 yd3 to an equivalent average annual discharge of sus-pended-sediment from the Maumee River at Water-ville is 1,110,000 ton/yr.
The time, in years and days expressed as deci-mal time (dectime), required to reach the goals estab-lished by the USDA and the Ohio Lake Erie Commission (1998) can be evaluated for the Maumee River at Waterville. The time it would take to achieve 15 and 67 percent reductions in suspended-sediment discharge can be computed from the coefficients of the statistical model (table 6) as follows:
Qs = boQbl exp (dectime*b5)
Q = Streamflow, in cubic feet per second bo = y intercept b1 = Coefficient of slope b5 = Coefficient of time
dectime = ln (1-fractional reduction goal)/ b5

30 Status and Trends in Suspended-Sediment Discharges, Soil Erosion, and Conservation Tillage in the Maumee River Basin
If the fractional reduction goals are set to 0.85 and 0.33, the time necessary to reach a goal of a 15 and 67 percent reduction, respectively, is computed to be 30.1 and 205 years. This prediction assumes that the conditions leading to the downward trend in sus-pended-sediment discharge will remain roughly the same as in the time series analyzed.
Major source areas of sedimentIncreasing the use of conservation tillage or other practices in areas showing the highest sediment-deliv-ery ratios and highest yields, like the Auglaize and St. Marys Rivers, might accelerate reductions in the need for dredging at downstream sites. Slightly coarser soil types appear to be retained to a greater degree in the basin where they originate and these soil particles have the tendency to be deposited and remain in ditches, stream channels, and flood plains. This appears to be the case in the St. Joseph and Tiffin Rivers.
The relations between sediment-particle size, sediment sources, and stream transport have been known for many years (Mulkey and Falco, 1977). If the capacity of the stream to transport sediment is lower when the particles are sand sized, then relatively more sediment deposition and storage may take place in watersheds consisting of more coarse-textured soils. As the use of conservation tillage increases and soil losses decrease, sediment transport from certain stream basins may increase temporarily as the streams erode sediment from alluvial and colluvial deposits. In this case, sediment yields may remain the same or even increase, at least temporarily, even though con-servation practices are effectively decreasing soil ero-sion from the land surface (Trimble, 1975, 1999). Natural factors such as hydrology, slope, soil texture, and watershed size, may be as important as conserva-tion tillage in controlling the delivery of sediment from the land surface to the downstream areas in the Maumee River Basin.
Implementation of best-management practicesSediment discharge and channel deposition can affect aquatic biota and their habitats as well as result in a continuing need to dredge streams and the lower main stem of the Maumee River. Best-management prac-tices for soil-erosion control can address both prob-lems. Conservation tillage practiced on different types of soils in the Maumee River Basin might result in
somewhat different benefits. Sedimentation and dredging of stream channels and ditches to remove sediment affects aquatic biota and stream-channel-habitat. For example, embeddedness, or the burial of large particles in a stream channel by sediment, is a primary factor that degrades habitat and the diversity of fish and freshwater mussel communities in the St. Joseph River Basin (Ohio Environmental Protection Agency, 1994). Stream channel habitat data collected in 1996–97, as part of the NAWQA study, showed that the degree of embeddedness of large particles in rif-fles, about 70 percent in the channel of the St. Joseph River near Newville, was the highest of four sites mea-sured in the Maumee River Basin. Embeddedness in riffles measured for the Auglaize River near Ft. Jen-nings, at 55 percent, where sediment transport rather than deposition may be the dominant fluvial process, was lower than that in the St. Joseph River near Newville. At the St. Joseph River near Newville, the dominant substrate types in riffles, where the coarsest particles are typically found, were sands followed by gravels and cobbles, whereas at the Auglaize River near Ft. Jennings, the dominant substrate types in rif-fles were cobbles and exposed bedrock.
Conservation tillage applied in areas of poorly drained clay soils may be more effective at controlling sediment transport over long distances than in areas of moderately drained to poorly drained silty to sandy soils. Compared to other soil textures, poorly drained soils in the Maumee River Basin are characterized by lower rates of soil erosion and relatively higher deliv-ery ratios and yields. Conversely, when conservation tillage is applied to soils that are silty to sandy and which are retained to a greater degree in stream basins, greater benefits might be gained by the local aquatic biota and their stream channel habitats. In either situa-tion, benefits to human and natural systems are achieved.
The use of riparian buffer strips along water-ways is a management practice gaining favor as a method to control erosion of stream banks and stream channels. Grassed buffer strips along small waterways and wooded riparian corridors along larger streams reduce small rivulets of concentrated flow, protect stream channels and banks, and capture sheet and rill erosion from the land surface. The use of riparian buff-ers would complement the use of conservation tillage in the control of suspended sediment discharge. Ripar-ian buffers are a best-management practice that could benefit aquatic biota and reduce maintenance dredging

Summary and conclusions 31
in navigation channels. Tracking and evaluation of buffer strips and concurrent monitoring of suspended sediments and aquatic biota may be helpful in the same way that tracking of conservation tillage and monitoring suspended-sediment discharge was helpful in evaluating the effectiveness of the conservation till-age in reducing suspended-sediment discharge.
Summary and conclusions
The U.S. Geological Survey began an intensive water-quality investigation in the Lake Erie–Lake St. Clair Basin in 1994 as part of its National Water-Quality Assessment Program. As part of the this investigation, studies of suspended-sediment discharge in relation to conservation tillage were undertaken in the Maumee River Basin. This report (1) describes areal patterns in conservation tillage, soil loss, soil-erosion rates, sus-pended-sediment discharges, yields, and delivery ratios at selected locations in the Maumee River Basin, (2) describes how suspended-sediment discharge is changing with time in relation to conservation-tillage practices and other factors like agricultural manage-ment and hydrology of the basin, and (3) improves our understanding of the primary natural and human fac-tors that affect suspended-sediment discharge.
Erosion of soils from farm fields in agricultural areas results in the need for maintenance dredging of approximately 300,000 tons of sediment each year from the lower 7 miles of the Maumee River at an average annual cost of about $2.2 million. Aquatic biota are affected by intensive agricultural land use, mainly through the degradation of stream-channel habitat as a result of sediment deposition, dredging, and channelization. Reductions in soil erosion from farm fields can decrease the amount of material that is transported, deposited, and dredged from the Maumee River and tributaries.
Nearly all sediment dredged from the lower main stem of the Maumee River is thought to originate in the watershed upstream from Toledo. The Maumee River is the largest tributary source of suspended sedi-ments discharged to Lake Erie. The large size of the Maumee River Basin and year-to-year variations in rainfall resulted in annual discharges of suspended sediment that ranged from 275,000 tons to 1,940,000 tons—a factor of 7. Large variations in suspended-sed-iment discharge and yield were measured in the Maumee River Basin from March 1996 to February 1998. Mean annual suspended-sediment discharge for
the period ranged from 71,800 tons for the St. Joseph River near Newville to 1,960,000 ton/yr for the Maumee River at Defiance. From 1996–98, the aver-age unit discharge of suspended sediment, or the yield, ranged from 118 ton/mi2 for the St. Joseph River near Newville to 354 ton/mi2 for the Maumee River at Defiance. Delivery ratios differed as much from site to site and over time as did sediment discharge and yield, and with similar patterns to sediment yield. Average delivery ratios of suspended sediment—the fraction of soil loss in a basin that leaves by stream trans-port—ranged by a factor of 5.6 from 1996–98, from 0.074 at the St. Joseph River near Newville to 0.412 at the Maumee River near Defiance, Ohio. The highest delivery ratios and yields on the main stem came from the reach between New Haven, Indiana and Defiance, Ohio. These areas of the basin are characterized by some of the lowest soil-erosion rates and the finest textured and most poorly drained soils with highest runoff potential. Although these areas contributed the greatest unit area discharges of suspended sediment, they were the areas with some of the lowest soil-ero-sion rates and lowest use of conservation tillage.
Expressed as percentage of the total measured at Waterville, Ohio, 31.2 percent of the suspended sed-iment in the basin was discharged from the Auglaize River, 15.3 percent was discharged from the St. Marys River and flowed past New Haven, Ind., 6.91 percent was discharged from the St. Joseph River, and 2.40 percent was discharged from the Tiffin River. The total amount of suspended sediment discharged from these four tributaries was 1,010,000 tons—950,000 tons less than the 1,960,000 tons discharged from the main stem at Defiance, Ohio. The tributary contribution was 800,000 tons less than the 1,810,000 ton/yr discharged on average from the main stem at Waterville from 1996–98.
Trends in suspended-sediment discharge were examined statistically at two sites. Suspended-sedi-ment discharges in the Auglaize River near Ft. Jen-nings from 1970–74 were compared to discharges for the period 1996–98. Suspended-sediment discharges in the Maumee River at Waterville were compared over the period 1970–98. Suspended-sediment dis-charges, normalized for streamflow and season, were 49.8 percent lower at the Auglaize River near Ft. Jen-nings, Ohio from 1996–98 compared to 1970–74. The reason for the trends in the suspended-sediment dis-charge may be the widespread use of conservation till-age. If realistic, the 49.8 percent decrease in

32 Status and Trends in Suspended-Sediment Discharges, Soil Erosion, and Conservation Tillage in the Maumee River Basin
suspended-sediment discharge at the Auglaize River near Ft. Jennings corresponds to a similar magnitude change of 65.3 percent in the use of conservation-till-age practices from the early period compared to the later period. A long-term average decrease during the period of record of 11.2 percent was detected for the Maumee River at Waterville. The use of conservation tillage at a rate of 55.4 percent in the Maumee River Basin from 1993–98 equates to a decrease of 0.4 per-cent per year in suspended-sediment discharge. Trends in mean daily streamflow also examined for 1970–98 using the Kendall-tau test indicated no significant changes at the USGS streamflow gaging stations at the Auglaize River near Ft. Jennings and at the Maumee River at Waterville.
Natural factors like slope, soil texture, and run-off potential play an important role in determining the effectiveness of conservation tillage in reducing sus-pended-sediment discharge in the Maumee River Basin. Comparatively higher delivery ratios and higher yields of suspended sediment were found in areas with high erosion rates, poorly drained to very poorly drained soils with high runoff potential, and relatively low use of conservation tillage. Where these conditions exist singly or in combination, as in the Auglaize and St. Marys Rivers, suspended-sediment discharges appear to be greater and sediment appears to be exported more efficiently to downstream areas. These findings are not obvious when only the Univer-sal Soil Loss Equation estimates of soil erosion are considered. Water-quality data were needed to draw these conclusions.
Sediment discharge and channel deposition can affect aquatic biota and their habitats as well as result in a continuing need to dredge the streams of the basin and lower main stem of the Maumee River. Conserva-tion tillage may be more effective at controlling sedi-ment transport over long distances when these practices are applied to poorly drained soils with high runoff potential than to moderately drained to poorly drained silty to sandy soils that have higher rates of soil erosion but relatively lower delivery ratios and yields. Conversely, when conservation tillage is applied to soils that are silty to sandy and retained to a greater degree in stream basins, greater benefits might be gained locally by aquatic biota and their stream-channel habitats. In either situation, benefits to human and natural systems are achieved.
References cited
American Map Corporation, 1993, Business Control Atlas: p. 36-37, 52-53, 72-75, 80-84, 88-93.
Antilla, P.W., and Tobin, R.L., 1978, Fluvial sediment in Ohio: U.S. Geological Survey Water-Supply Paper 2045, 58 p.
Baker, D.B., 1982, Fluvial transport and processing of sedi-ment and nutrients in large agricultural river basins, Final report Lake Erie Wastewater management study: U.S. Army Corps of Engineers and U.S. Environmen-tal Protection Agency, 125 p.
_____ 1988, Sediment, nutrient, and pesticide transport in selected lower Great Lakes tributaries: U.S. Environ-mental Protection Agency, Great Lakes National Pro-gram Office Report 1, EPA–905/4–88–001, 225 p.
______ 1993, Lake Erie agroecosystem program—Water quality assessments: Agriculture, Ecosystems, and Environment, v. 46, p.197-215.
Baker, D.B., Calhoun, F.G., and Matisoff, Gerald, 1998, LEASEQ, the Lake Erie agricultural systems for envi-ronmental quality project: Fact Sheet, 2 p.
Beasely, D.B., 1985, Spatial simulation to aid in evaluating and treating erosion and water quality problems affect-ing Lake Erie, in Soil Erosion and Conservation, S.A. El-Swaify, W.C. Molderhauer, and Andrew Lo eds.: Ankeny, Iowa, Soil Conservation Society of America, p. 566-573.
Campbell, L.W., 1995, The marshes of southwestern Lake Erie: Athens, Ohio, Ohio University Press, p. 107.
Casey, G.D., Myers, D.N., Finnegan, D.P., and Wieczorek, M.E., 1997, National water-quality assessment of the Lake Erie-Lake St. Clair Basin, Michigan, Indiana, Ohio, Pennsylvania, and New York–Environmental and hydrologic setting: U.S. Geological Survey Water-Resources Investigations Report 97-4256, 93 p.
Cleveland, W.S., 1979, Robust locally weighted regression and smoothing scatterplots: Journal of the American Statistical Association, v. 74, p. 829-836.
Cohn, T.A., Delong, L.L., Gilroy, E.J., Hirsch, R.M., and Wells, D.K., 1989, Estimating constituent loads: Water Resources Research, v. 25, p. 937-942.
Crawford, C.G., 1991, Estimation of suspended-sediment rating curves and mean suspended-sediment loads: Journal of Hydrology, v. 129, p. 331-348.
_______1996, Estimating mean constituent loads in rivers by the rating-curve and flow-duration methods: Bloomington, Indiana, Indiana University, Ph.D. dis-sertation, 245 p.
Cummings, T.R, 1983, Estimates of dissolved and sus-pended substance yield of stream basins in Michigan: U.S. Geological Survey Water-Resources Investiga-tions Report 83–4288, 57 p.

References cited 33
Ebbert, J.C., and Roe, R.D., 1998, Soil erosion in the Pal-ouse River Basin—Indications for improvement: U.S. Geological Survey Fact Sheet 069-98, July 1998, 4 p.
Edwards, T.K., and Glysson, G.D., 1999, Field methods for measurement of fluvial sediment: U.S. Geological Sur-vey Techniques of Water-Resources Investigations, book 3, chap. C2, 89 p.
Fausey, N.R., Brown, L.C., Belcher, H.W., and Kanwar, R.S., 1995, Drainage and water quality in Great Lakes and Cornbelt states: Journal of Irrigation and Drainage Engineering, v. 121, p. 283-287.
Fenneman, N.M., 1938, Physiography of the eastern United States: New York, McGraw-Hill, 689 p.
Foster, G.R., and Meyer, L.D., 1977, Soil erosion and sedi-mentation by water–An overview; in Proceedings of the national symposium on soil erosion and sedimenta-tion by water: Chicago, Ill., Dec. 12-13, 1977, Ameri-can Society of Agricultural Engineers, Publ. 4-77, p. 1-13
Great Lakes Commission, 1998, An agricultural profile of the Great Lakes Basin—Characteristics and trends in production, land use, and environmental impacts: Ann Arbor, Mich., Great Lakes Commission, p. 14.
Guy, H.P., 1969, Laboratory theory and methods for sedi-ment analysis: U.S. Geological Survey Techniques of Water-Resources Investigations, book 5, chap. C1, 58 p.
Helsel, D.R., and Hirsch, R.M., 1992, Statistical methods in water resources; studies in environmental science 49: New York, Elsevier Press, 529 p.
Hess, Philip, 1995, Transect; Software for managing crop-land survey data, 1996 user guide: West Lafayette, Ind., Purdue University, 38 p.
Hindall, S.M., 1989, Summary of fluvial-sediment studies in Ohio, through 1987: U.S.Geological Survey Water-Resources Investigations Report 89-4066, 29 p.
Holeman, J.N., 1968, The sediment yield of major rivers of the world: Water Resources Research, v. 4., p. 738-747.
International Joint Commission, 1987, Revised Great Lakes Water Quality Agreement of 1978: Windsor, Ontario, International Joint Commission, p. 31
Jones, L.A., Smeck, N.E., and Wilding, L.P., 1977, Quality of water discharged from three small agricultural watersheds in the Maumee River Basin: Journal of Environmental Quality, v. 6, p. 296-302.
Kimberlin, L.W., and Moldenhauer, W.C., 1977, Predicting soil erosion, in Proceedings of the national symposium on soil erosion and sedimentation by water: Chicago, Ill., Dec. 12-13, 1977, American Society of Agricul-tural Engineers, Publ. 4-77, p. 31-42.
Logan, T.J., 1977, Establishing soil loss and sediment yield limits for agricultural land, in Proceedings of the national symposium on soil erosion and sedimentation by water: Chicago, Ill., Dec. 12-13, 1977, American
Society of Agricultural Engineers, Publ. 4-77, p. 59-67.
_______ 1978, Maumee River Basin pilot watershed report, summary: International Joint Commission, Reference Group on Pollution from Land-Use Activities, 96 p.
Mulkey, L.A., and Falco, J.W., 1977, Sedimentation and erosion control implications for water-quality manage-ment, in Proceedings of the national symposium on soil erosion and sedimentation by water: Chicago, Ill., Dec. 12-13, 1977, American Society of Agricultural Engineers, Publ. 4-77, p. 69-90.
Ohio Environmental Protection Agency, 1989, Biological and water-quality study of the lower Maumee River main stem and major tributaries: Columbus, Ohio, Ohio Environmental Protection Agency, 53 p.
_______ 1992a, Biological and water-quality study of the St. Marys River: Technical Report EAS/1992–11–10, Columbus, Ohio, Ohio Environmental Protection Agency, 33 p.
_______ 1992b, Biological and water-quality study of the Auglaize River and selected tributaries: Technical Report EAS/1992–11–8, Columbus, Ohio, Ohio Envi-ronmental Protection Agency, 80 p.
_______ 1993a, Biological and water-quality study of the Blanchard River, 1989 to 1991: Technical Report EAS/1992–12–12, Columbus, Ohio, Ohio Environmental Protection Agency, 36 p.
_______ 1993b, Biological and water-quality study of the Tiffin River and selected tributaries: Technical Report EAS/1993–12–5, Columbus, Ohio, Ohio Environmen-tal Protection Agency, 68 p.
_______ 1994, Biological and water-quality study of the St. Joseph River and selected tributaries: Technical Report EAS/1993–12–7, Columbus, Ohio, Ohio Environmen-tal Protection Agency, 15 p.
_______ 1995, Ohio water-resource inventory, 1994—Sum-mary, conclusions, and recommendations: Technical Bulletin EAS/1995–7–2, Columbus, Ohio, Ohio Envi-ronmental Protection Agency, 69 p.
Ohio Lake Erie Commission, 1993, State of the lake, 1992 Governor’s report on Lake Erie: Ohio Lake Erie Com-mission, Toledo, Ohio, 88 p.
_______ 1998, State of the Lake report, Lake Erie quality index: Toledo, Ohio, Ohio Lake Erie Commission, 88 p.
Paulson, R.W., Chase, E.B., Roberts, R.S., and Moody, D.W., 1991 National Water Summary 1988–89; Hydrologic events and floods and droughts: U.S. Geo-logical Survey Water-Supply Paper 2375, p. 471-474.
Porterfield, George, 1972, Computation of fluvial-sediment discharge: U.S. Geological Survey Techniques of Water-Resources Investigations, book 3, chap. C3, 66 p.

34 Status and Trends in Suspended-Sediment Discharges, Soil Erosion, and Conservation Tillage in the Maumee River Basin
Richards, P.R., and Baker, D.B., 1993, Trends in nutrient and suspended-sediment concentrations in Lake Erie tributaries, 1975-1990: Journal of Great Lakes Research, v. 19, p. 200-211.
Shelton, L.R., 1994, Field guide for collecting and process-ing stream-water samples for the National Water-Qual-ity Assessment Program: U.S. Geological Survey Open-File Report 94-455, 42 p.
Shindel, H.L., Klingler, J.H., Mangus, J.P., and Trimble, L.E., 1991, Water-resources data, Ohio, water year 1990, v. 2, St. Lawrence River Basin: U.S. Geological Survey Water-Data Report OH–90–2, 281 p.
_______ 1992, Water-resources data, Ohio, water year 1991, v. 2, St. Lawrence River Basin: U.S. Geological Survey Water-Data Report OH–91–2, 430 p.
_______ 1993, Water-resources data, Ohio, water year 1992, v. 2, St. Lawrence River Basin: U.S. Geological Survey Water-Data Report OH–92–2, 481 p.
Shindel, H.L., Mangus, J.P. and Trimble, 1994, Water-resources data, Ohio, water year 1993, v. 2, St. Lawrence River Basin: U.S. Geological Survey Water-Data Report OH–93–2, 416 p.
_______ 1995, Water resources data, Ohio, water year 1994, v. 2, St. Lawrence River Basin: U.S. Geological Survey Water-Data Report OH–94–2, p. 39–109.
_______ 1999, Water-resources data, Ohio, water year 1998, v. 2, St. Lawrence River Basin: U.S. Geological Survey Water-Data Report OH–98–2 p. 39–60.
Soller, D.R. 1993, 1994, Maps showing the thickness and character of Quarternary sediments in the glaciated United States east of the Rocky Mountains: U.S. Geo-logical Survey Miscellaneous Investigations Series Maps I–1970–A–B–C–D, scale 1:1,000,000.
Trimble, S.W., 1975, Denudation studies—Can we assume stream steady state? Science, v. 188, p. 1207-1208.
_______ 1999, Decreased rates of alluvial sediment storage in the Coon Creek Basin, Wisconsin, 1973-93: Sci-ence, v. 285, p. 1244-1246.
U.S. Department of Agriculture, 1991, State soil geographic data base (STATSGO): Soil Conservation Service Mis-cellaneous Publication 1492, 88 p.
_______ 1993, Erosion and sedimentation dynamics of the Maumee River Basin and their impact on Toledo Har-bor: Columbus, Ohio, Soil Conservation Service, 3 p.
_______1998, Toledo Harbor pilot project, final report: Columbus, Ohio, Natural Resources Conservation Ser-vice, 65 p.
Wager, Jerry, 1996, Soil issues, in An agricultural profile of the Great Lakes Basin—Characteristics and trends in production, land use, and environmental impacts: Ann Arbor, Mich., Great Lakes Commission, p. 116-121.
Waldron, A.C., 1984, Pesticide use on major field crops in Ohio–1982: Columbus, Ohio, Ohio Cooperative Extension Service, Bulletin 715, The Ohio State Uni-versity, 24 p.
Ward, J.A., and Harr, C.A., 1990, Methods for collection and processing of surface-water and bed-material sam-ples for physical and chemical analysis: U.S. Geologi-cal Survey Open-File Report 90-140, 70 p.
Wischmeier, W.H., and Smith D.D., 1978, Predicting rain-fall erosion losses–A guide to conservation planning: Washington, D.C., U.S. Department of Agriculture Handbook 537, p. 4.

APPENDIX 35
APPENDIX
Description of the use of LOADEST2
Suspended-sediment discharges for this report were estimated by the rating-curve method (Cohn and oth-ers, 1989, 1992; Crawford, 1991, 1996). For each site, a rating curve was selected from among eight candi-date models on the basis of Aikaike’s information cri-terion (Judge and others, 1985). This criterion involves a measure of model precision and a measure of model parsimony and is designed to trade-off preci-sion for parsimony (that is, it evaluates increasing model complexity and compares it to increased model precision and only selects the more complex model when the increased precision exceeds a certain thresh-old). The eight models considered are:
Model 1: ln (load) = b0 + b1 ln (streamflow),Model 2: ln (load) = b0 + b1 ln (streamflow)
+ b2 ln (streamflow)**2,Model 3: ln (load) = b0 + b1 ln (streamflow)
+ b2 dectime,Model 4: ln (load) = b0 + b1 ln (streamflow)
+ b2 sin (dectime) + b3 cos (dectime),Model 5: ln (load) = b0 + b1 ln (streamflow)
+ b2 ln (streamflow)**2 + b3 dectime,Model 6: ln (load) = b0 + b1 ln (streamflow)
+ b2 ln (streamflow)**2 + b3 sin (dectime) + b4 cos (dectime),
Model 7: ln (load) = b0 + b1 ln (streamflow) + b2 sin (dectime) + b3 cos (dectime)+ b4 dectime,
Model 8: ln (load) = b0 + b1 ln (streamflow) + b2 ln (streamflow)**2 + b3 sin(dectime) + b4 cos (dectime) + b5 dectime.
where: b0–b5 are rating-curve parameters;streamflow is instantaneous or daily streamflow, in
cubic feet per second,load is suspended-sediment discharge, in tons per
day, and dectime is time in fractional years
(for example, midnight on December 31, 1992 is 1993.0000; 1200 on July 2, 1993 is 1993.5000; and 0100 on September 30, 1993 is 1993.7453.)
Because model parameters are estimated from a model in which the response variable (load) is log transformed using natural logs, a correction for trans-formation bias is necessary when converting model predictions back from logarithmic units into arithmetic units (Miller, 1984). The method of Bradu and Mund-lak (1970) was used. An estimate of the uncertainty in the estimated loads was obtained using the method described by Likes (1980) and Gilroy and others (1990).
References cited
Bradu, D., and Mundlak, Y., 1970, Estimation in lognormal linear models: Journal of the American Statistical Association, v. 65, p. 198-211.
Cohn, T.A., Delong, L.L., Gilroy, E.J., Hirsch, R.M., and Wells, D.K., 1989, Estimating constituent loads: Water Resources Research, v. 25, p. 937-942.
Cohn, T.A., Caulder, D.L., Gilroy, E.J., Zynjuk, L.D., and Summers, R.M., 1992, The validity of a simple log-lin-ear model for estimating fluvial constituent loads—An empirical study involving nutrient loads entering Ches-apeake Bay: Water Resources Research, v. 28, no. 9, p. 2353-2363.
Crawford, C.G., 1991, Estimation of suspended-sediment rating curves and mean suspended-sediment loads: Journal of Hydrology, v. 129, p. 331-348.
_______1996, Estimating mean constituent loads in rivers by the rating-curve and flow-duration methods: Bloomington, Indiana, Indiana University, Ph.D. dis-sertation, 245 p.
Gilroy, E.J., Hirsch, R.M., and Cohn, T.A., 1990, Mean square error of regression-based constituent transport estimates: Water Resources Research, v. 26, no. 9, p. 2069-2077.
Judge, G.G., Griffiths, W.E., Hill, R.C., Lutkepohl, H., and Lee, T.C., 1985, The theory and practice of economet-rics: New York, John Wiley, 1019 p.
Likes, Jiri, 1980, Variance of the MVUE for lognormal vari-ance: Technometrics, v. 22, no. 2, p. 253-258.
Miller, D.M., 1984, Reducing transformation bias in curve fitting: American Statistician, v. 38, no. 2, p. 124-126.

36 Status and Trends in Suspended-Sediment Discharges, Soil Erosion, and Conservation Tillage in the Maumee River Basin

References cited 37

38 Status and Trends in Suspended-Sediment Discharges, Soil Erosion, and Conservation Tillage in the Maumee River Basin