status and issues for natural gas in the united states · status and issues for natural gas in ......
TRANSCRIPT
Status and Issues for Natural Gas in the United States Alternative Fuel and Advanced Vehicle Technology Market Trends Argonne National Laboratory
Andy Burnham, Marianne Mintz, and Marcy Rood Werpy
February 2015
Status and Issues for Natural Gas in the United States Alternative Fuel and Advanced Vehicle Technology Market Trends
Andy Burnham Marianne Mintz
Marcy Rood Werpy Argonne National Laboratory
February 2015
Prepared by
ARGONNE NATIONAL LABORATORY Lemont, IL 60439
managed by U-CHICAGO ARGONNE, LLC
for the U.S. DEPARTMENT OF ENERGY
Executive Summary
Natural gas vehicles (NGVs) have received significant interest in recent years due to stable low fuel prices as well as the increased availability of vehicles and fueling infrastructure. This document was prepared for the U.S. Department of Energy’s Clean Cities Program — a public-private partnership that advances the energy, economic, and environmental security of the United States by supporting local decisions that reduce petroleum use in the transportation sector — to examine the current status of NGVs, infrastructure, and policies; energy, environmental, and economic benefits; current barriers, opportunities, and strategies for greater market penetration. Heavy-duty NGVs account for about 25% of the NGV population but more than 80% of fuel consumption, as economics drive interest in high-fuel use vocations. Clean Cities Recovery Act funding deployed a significant number of these vehicles, which has demonstrated the success of NGVs in a wide range of market segments. Furthermore, the release of a new engine has provided fleets requiring more power a natural gas (NG) option. Today there are 1,500 fueling stations that dispense compressed natural gas and 100 that dispense liquefied natural gas, with more than half being publicly accessible. In addition, station counts have risen steadily over the past few years due to both public and private funding, with Recovery Act projects accounting for about 15% public access stations. While there are barriers to further NGV market penetration, such as fueling infrastructure access and the incremental price of vehicles, several market niches offer significant opportunities. The market segments discussed include regional haul freight trucks, concrete mixers, paratransit/shuttles, school buses, and utility service vehicles. In addition, renewable natural gas is discussed as another opportunity for NGVs due to its environmental benefits. Strategies discussed include building on Clean Cities activities such as communication products, partnerships, technical assistance, and tools as well as new activities that may support targeted niche markets. Introduction Natural gas has long been an important alternative fuel and recent developments have intensified interest in it. The rapid increase in natural gas (NG) production from shale formations has stabilized prices and increased supplies. Coupled with relatively higher and more volatile long-term gasoline and diesel prices, the market penetration of natural gas vehicles (NGVs) has escalated, especially in several heavy-duty segments. NG fueling infrastructure and heavy-duty NG engines have become more widely available, a further boost to NGV market development. Current Market Status Nearly all of the natural gas consumed in the United States is produced domestically via drilling. Significant supplies come from the Lower 48 States, mainly from unconventional resources, such as shale as advanced drilling technologies such as horizontal drilling and hydro-fracturing have spurred increases in supply. From 2002 to 2012, shale gas increased from 3% to 40% of the total
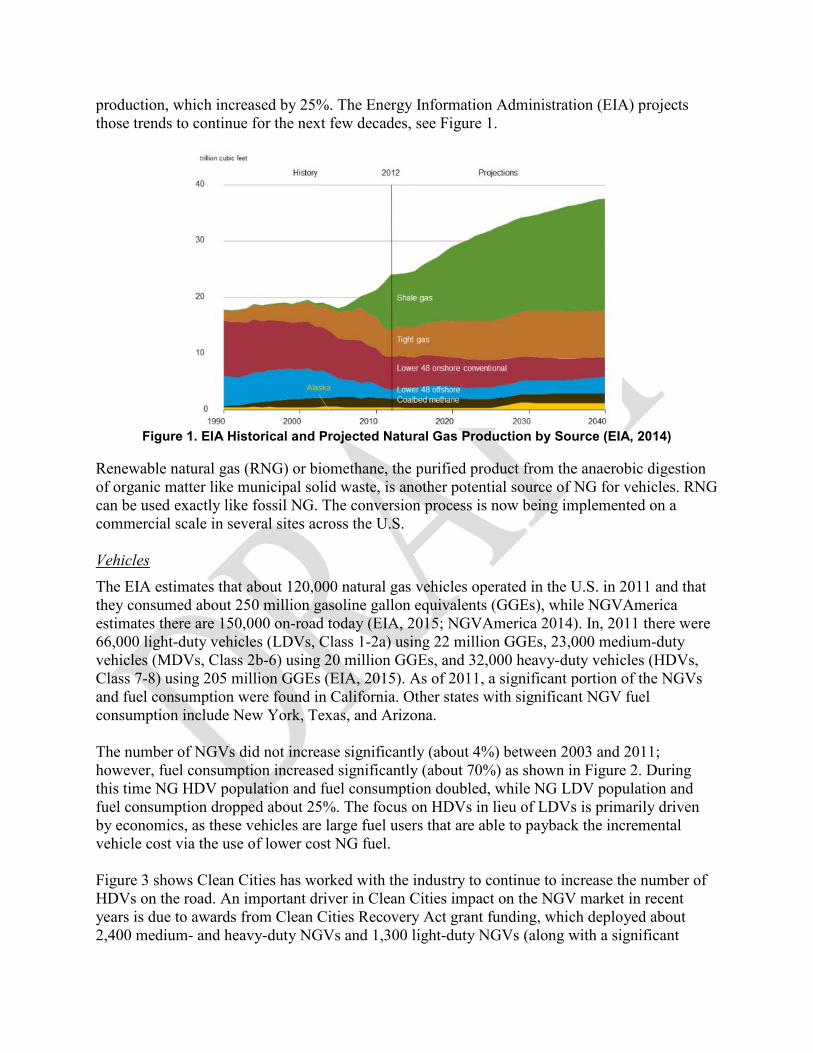
production, which increased by 25%. The Energy Information Administration (EIA) projects those trends to continue for the next few decades, see Figure 1.
Figure 1. EIA Historical and Projected Natural Gas Production by Source (EIA, 2014)
Renewable natural gas (RNG) or biomethane, the purified product from the anaerobic digestion of organic matter like municipal solid waste, is another potential source of NG for vehicles. RNG can be used exactly like fossil NG. The conversion process is now being implemented on a commercial scale in several sites across the U.S. Vehicles The EIA estimates that about 120,000 natural gas vehicles operated in the U.S. in 2011 and that they consumed about 250 million gasoline gallon equivalents (GGEs), while NGVAmerica estimates there are 150,000 on-road today (EIA, 2015; NGVAmerica 2014). In, 2011 there were 66,000 light-duty vehicles (LDVs, Class 1-2a) using 22 million GGEs, 23,000 medium-duty vehicles (MDVs, Class 2b-6) using 20 million GGEs, and 32,000 heavy-duty vehicles (HDVs, Class 7-8) using 205 million GGEs (EIA, 2015). As of 2011, a significant portion of the NGVs and fuel consumption were found in California. Other states with significant NGV fuel consumption include New York, Texas, and Arizona. The number of NGVs did not increase significantly (about 4%) between 2003 and 2011; however, fuel consumption increased significantly (about 70%) as shown in Figure 2. During this time NG HDV population and fuel consumption doubled, while NG LDV population and fuel consumption dropped about 25%. The focus on HDVs in lieu of LDVs is primarily driven by economics, as these vehicles are large fuel users that are able to payback the incremental vehicle cost via the use of lower cost NG fuel. Figure 3 shows Clean Cities has worked with the industry to continue to increase the number of HDVs on the road. An important driver in Clean Cities impact on the NGV market in recent years is due to awards from Clean Cities Recovery Act grant funding, which deployed about 2,400 medium- and heavy-duty NGVs and 1,300 light-duty NGVs (along with a significant
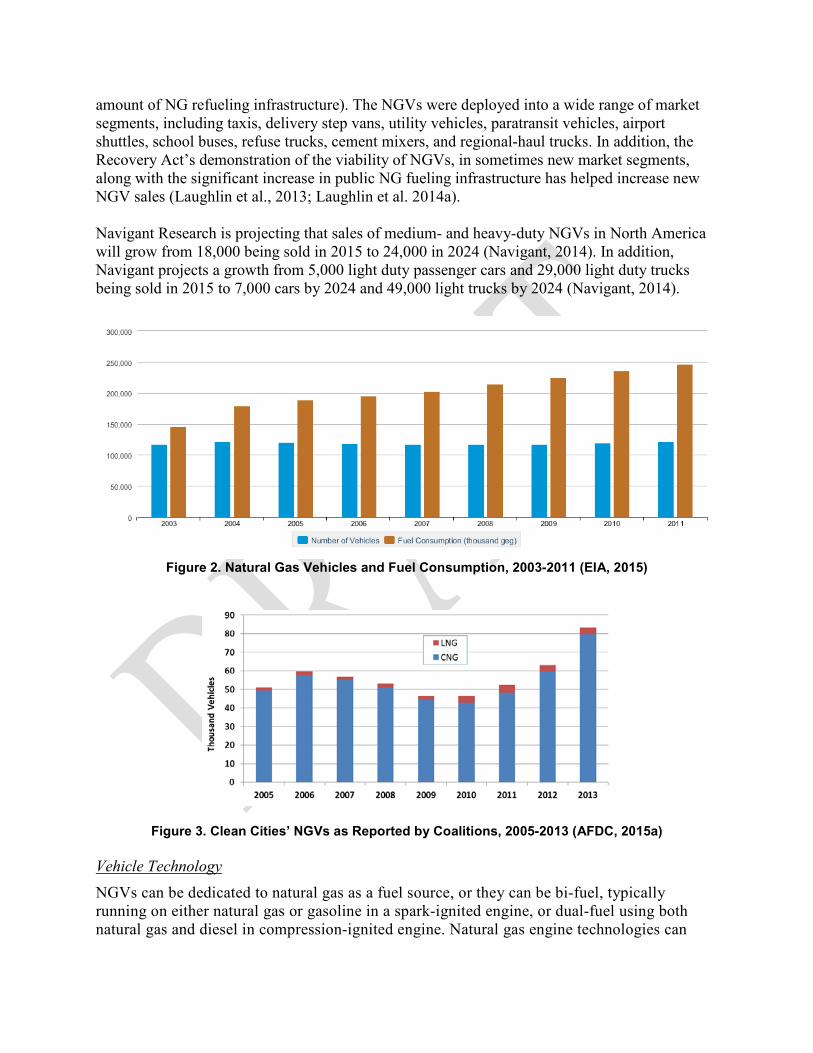
amount of NG refueling infrastructure). The NGVs were deployed into a wide range of market segments, including taxis, delivery step vans, utility vehicles, paratransit vehicles, airport shuttles, school buses, refuse trucks, cement mixers, and regional-haul trucks. In addition, the Recovery Act’s demonstration of the viability of NGVs, in sometimes new market segments, along with the significant increase in public NG fueling infrastructure has helped increase new NGV sales (Laughlin et al., 2013; Laughlin et al. 2014a). Navigant Research is projecting that sales of medium- and heavy-duty NGVs in North America will grow from 18,000 being sold in 2015 to 24,000 in 2024 (Navigant, 2014). In addition, Navigant projects a growth from 5,000 light duty passenger cars and 29,000 light duty trucks being sold in 2015 to 7,000 cars by 2024 and 49,000 light trucks by 2024 (Navigant, 2014).
Figure 2. Natural Gas Vehicles and Fuel Consumption, 2003-2011 (EIA, 2015)
Figure 3. Clean Cities’ NGVs as Reported by Coalitions, 2005-2013 (AFDC, 2015a) Vehicle Technology NGVs can be dedicated to natural gas as a fuel source, or they can be bi-fuel, typically running on either natural gas or gasoline in a spark-ignited engine, or dual-fuel using both natural gas and diesel in compression-ignited engine. Natural gas engine technologies can

differ in the method used to ignite the fuel in the engine cylinders, the air-fuel ratio, the compression ratio, and the resulting performance and emissions capabilities. Because natural gas occupies a considerably larger storage volume per unit of energy at atmospheric pressure than refined petroleum liquids, it is stored aboard the vehicle as either a compressed gas or a liquid. The storage requirements are still much greater than those for refined petroleum products, which increases vehicle weight and tends to reduce fuel economy. Natural gas is stored aboard a vehicle either a compressed gas or a liquid. Compressed natural gas (CNG) is pressurized in a storage tank (also called a cylinder) at up to 3,600 pounds per square inch (psi). These tanks can come in various designs, ranging from full metal (typically steel) construction (Type 1), hoop-wrapped composite with a metal liner (Type 2), full composite wrap with a metal liner (Type 3), and full composite wrap with a plastic liner (Type 4). In the U.S., weight and space are important considerations, thus the NGVs typically use the lightest types of tanks (e.g., Type 3 and Type 4). Even at 3,600 psi, CNG has a lower energy density than either gasoline or diesel, so vehicle range can be reduced unless the vehicle carries a significant number of cylinders. In LDVs, the tank is typically mounted in the trunk and replaces the existing fuel tank. In trucks and buses, cylinders can be mounted in several places, including the frame rails, back of the cabin, roof, and under the vehicle. Liquefied natural gas (LNG) is produced by purifying NG to remove impurities such as hydrogen sulfide and CO2 and then cooling the NG to –260ºF. LNG is stored in double-walled, vacuum-insulated tanks. LNG is used in several HDV applications, as it requires smaller storage volumes than CNG to provide sufficient range. Light-duty NGV engines range in size from about 2 to 6 liters (L) and are produced by OEMs such as GM, Ford, Chrysler and Honda, see Figure 4. NG engines are similar to gasoline engines but with hardened valves and high pressure fuel lines. Small-volume manufacturers (SVMs) provide additional engine options through aftermarket conversions of cars, trucks, and vans. Companies offering EPA- (and in some cases CARB-) certified conversions include Altech-Eco, BAF, Baytech, IMPCO, Landi Renzo, and Westport (EPA 2015).
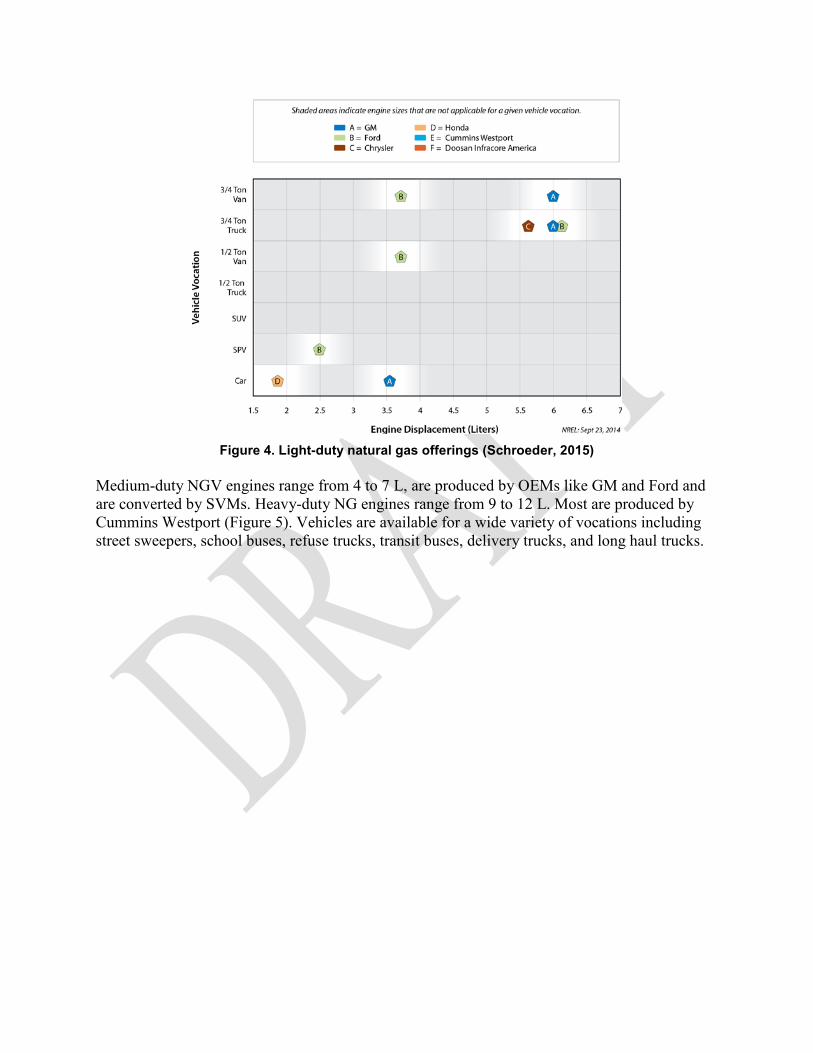
Figure 4. Light-duty natural gas offerings (Schroeder, 2015)
Medium-duty NGV engines range from 4 to 7 L, are produced by OEMs like GM and Ford and are converted by SVMs. Heavy-duty NG engines range from 9 to 12 L. Most are produced by Cummins Westport (Figure 5). Vehicles are available for a wide variety of vocations including street sweepers, school buses, refuse trucks, transit buses, delivery trucks, and long haul trucks.
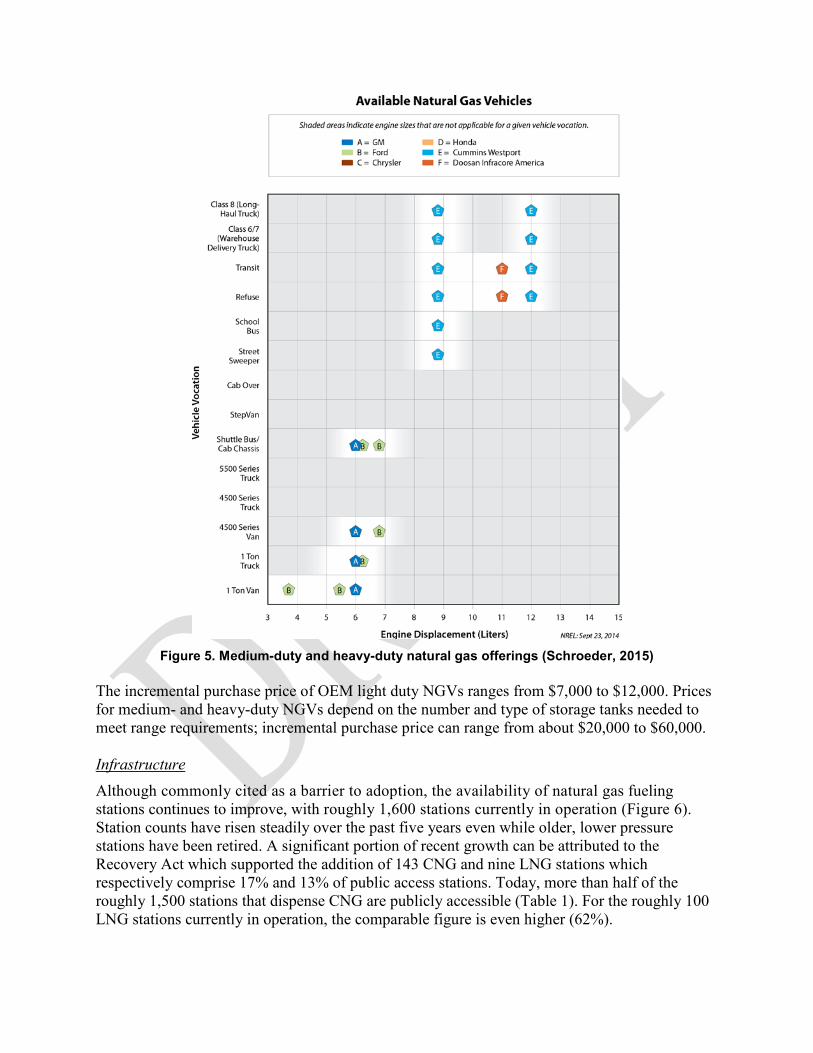
Figure 5. Medium-duty and heavy-duty natural gas offerings (Schroeder, 2015)
The incremental purchase price of OEM light duty NGVs ranges from $7,000 to $12,000. Prices for medium- and heavy-duty NGVs depend on the number and type of storage tanks needed to meet range requirements; incremental purchase price can range from about $20,000 to $60,000. Infrastructure Although commonly cited as a barrier to adoption, the availability of natural gas fueling stations continues to improve, with roughly 1,600 stations currently in operation (Figure 6). Station counts have risen steadily over the past five years even while older, lower pressure stations have been retired. A significant portion of recent growth can be attributed to the Recovery Act which supported the addition of 143 CNG and nine LNG stations which respectively comprise 17% and 13% of public access stations. Today, more than half of the roughly 1,500 stations that dispense CNG are publicly accessible (Table 1). For the roughly 100 LNG stations currently in operation, the comparable figure is even higher (62%).
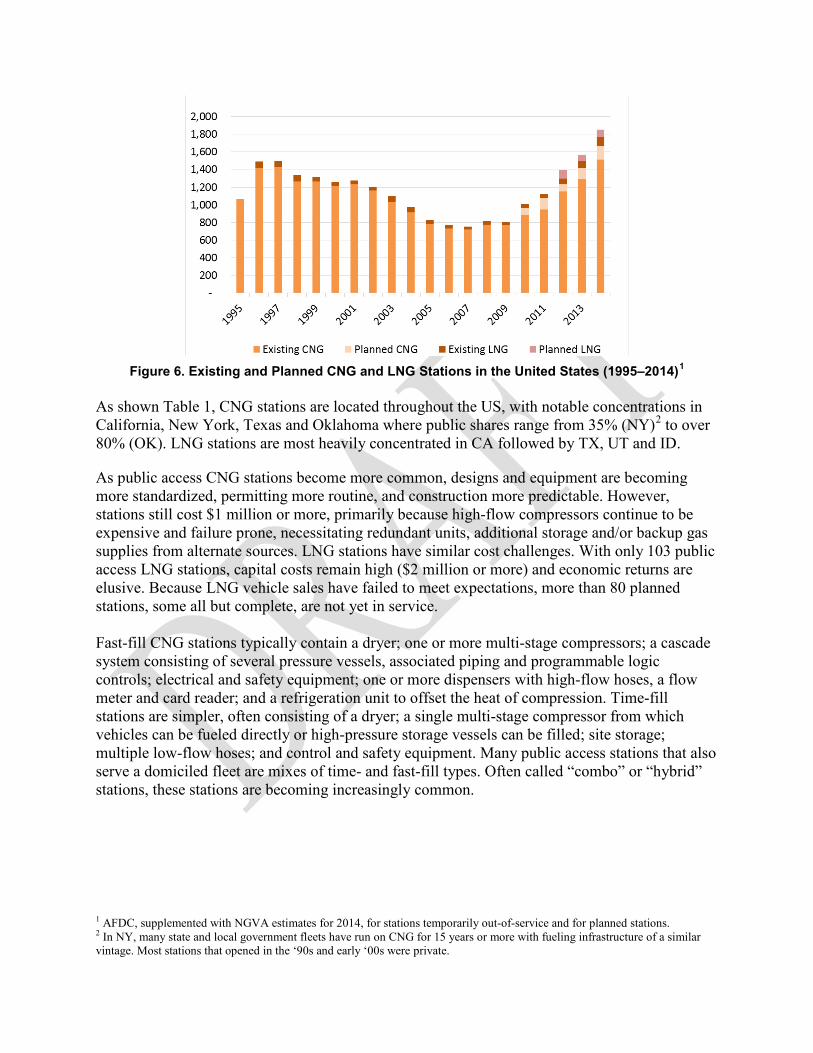
Figure 6. Existing and Planned CNG and LNG Stations in the United States (1995–2014)1
As shown Table 1, CNG stations are located throughout the US, with notable concentrations in California, New York, Texas and Oklahoma where public shares range from 35% (NY)2 to over 80% (OK). LNG stations are most heavily concentrated in CA followed by TX, UT and ID.
As public access CNG stations become more common, designs and equipment are becoming more standardized, permitting more routine, and construction more predictable. However, stations still cost $1 million or more, primarily because high-flow compressors continue to be expensive and failure prone, necessitating redundant units, additional storage and/or backup gas supplies from alternate sources. LNG stations have similar cost challenges. With only 103 public access LNG stations, capital costs remain high ($2 million or more) and economic returns are elusive. Because LNG vehicle sales have failed to meet expectations, more than 80 planned stations, some all but complete, are not yet in service. Fast-fill CNG stations typically contain a dryer; one or more multi-stage compressors; a cascade system consisting of several pressure vessels, associated piping and programmable logic controls; electrical and safety equipment; one or more dispensers with high-flow hoses, a flow meter and card reader; and a refrigeration unit to offset the heat of compression. Time-fill stations are simpler, often consisting of a dryer; a single multi-stage compressor from which vehicles can be fueled directly or high-pressure storage vessels can be filled; site storage; multiple low-flow hoses; and control and safety equipment. Many public access stations that also serve a domiciled fleet are mixes of time- and fast-fill types. Often called “combo” or “hybrid” stations, these stations are becoming increasingly common.
1 AFDC, supplemented with NGVA estimates for 2014, for stations temporarily out-of-service and for planned stations. 2 In NY, many state and local government fleets have run on CNG for 15 years or more with fueling infrastructure of a similar vintage. Most stations that opened in the ‘90s and early ‘00s were private.
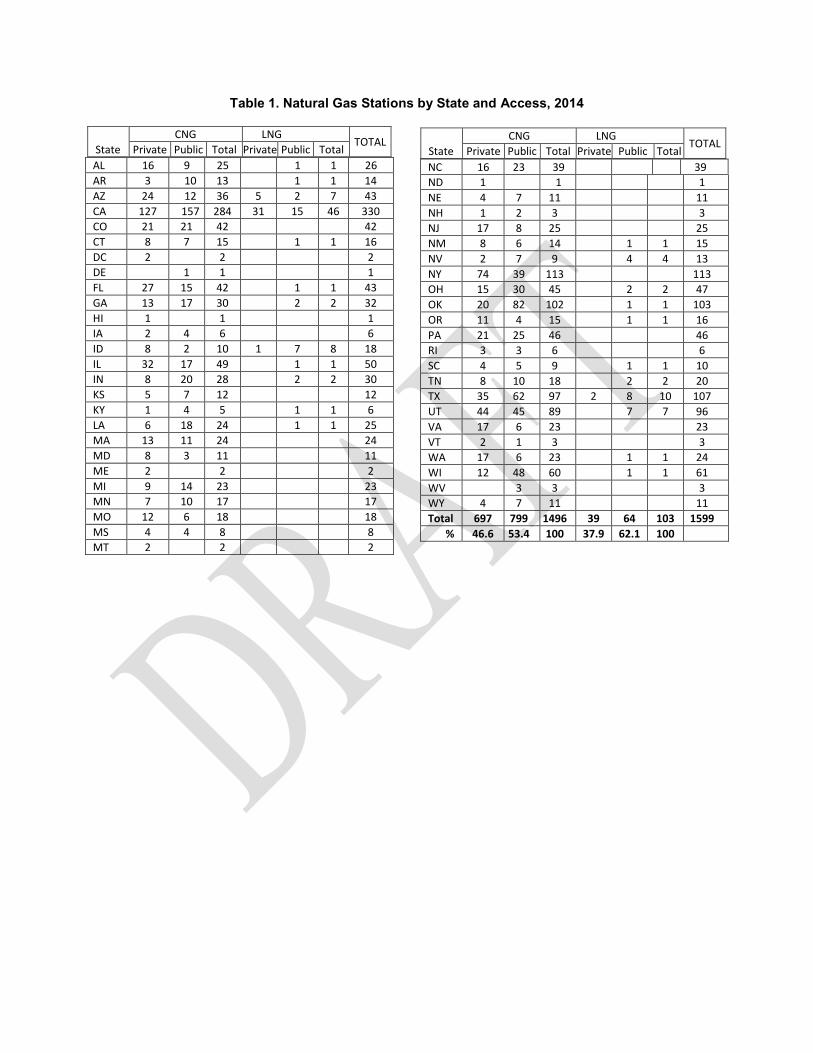
Table 1. Natural Gas Stations by State and Access, 2014
State CNG LNG
TOTAL Private Public Total Private Public Total
AL 16 9 25 1 1 26 AR 3 10 13 1 1 14 AZ 24 12 36 5 2 7 43 CA 127 157 284 31 15 46 330 CO 21 21 42 42 CT 8 7 15 1 1 16 DC 2 2 2 DE 1 1 1 FL 27 15 42 1 1 43 GA 13 17 30 2 2 32 HI 1 1 1 IA 2 4 6 6 ID 8 2 10 1 7 8 18 IL 32 17 49 1 1 50 IN 8 20 28 2 2 30 KS 5 7 12 12 KY 1 4 5 1 1 6 LA 6 18 24 1 1 25 MA 13 11 24 24 MD 8 3 11 11 ME 2 2 2 MI 9 14 23 23 MN 7 10 17 17 MO 12 6 18 18 MS 4 4 8 8 MT 2 2 2
NC 16 23 39 39 ND 1 1 1 NE 4 7 11 11 NH 1 2 3 3 NJ 17 8 25 25 NM 8 6 14 1 1 15 NV 2 7 9 4 4 13 NY 74 39 113 113 OH 15 30 45 2 2 47 OK 20 82 102 1 1 103 OR 11 4 15 1 1 16 PA 21 25 46 46 RI 3 3 6 6 SC 4 5 9 1 1 10 TN 8 10 18 2 2 20 TX 35 62 97 2 8 10 107 UT 44 45 89 7 7 96 VA 17 6 23 23 VT 2 1 3 3 WA 17 6 23 1 1 24 WI 12 48 60 1 1 61 WV 3 3 3 WY 4 7 11 11 Total 697 799 1496 39 64 103 1599
% 46.6 53.4 100 37.9 62.1 100
State CNG LNG
TOTAL Private Public Total Private Public Total
LNG stations include a cryogenic storage tank into which the fuel is pumped and stored; a cryo pump and associated piping; one or more dispensers and card readers; and, if the station also dispenses L/CNG (i.e. both LNG and CNG), some form of compression and storage. Since most CNG stations are supplied from local distribution pipelines, on-site storage tends to be limited to high-pressure buffer tanks from which fuel can be drawn when the cascade system is depleted by multiple back-to-back fills or the inlet pipeline pressure is depleted by unusually high demand along the line (e.g., during unusually cold weather). CNG stations that are not served by pipeline can be supplied by gas transportation modules (GTMs), either steel tube-trailers or fiber-reinforced cylinders filled in a central location and delivered to the site. Often referred to as “mother-daughter” stations or “virtual pipeline” systems, GTM supply is particularly promising for remote applications (e.g., oil field service equipment or mine trucks) or regions with sparse natural gas infrastructure (e.g., the northeastern U.S.). Vehicle and Fuel Incentives and Policies
Various federal and state laws provide incentives for natural gas fuel, vehicles and infrastructure. Federal incentives include tax credits of $0.50 per gal for CNG and LNG sold or used between January 1, 2005, and December 31, 2014 and 30% of the cost (not to exceed $30,000) of natural gas fueling equipment installed between January 1, 2006, and December 31, 2014. Both were recently retroactively extended through December 31, 2014. For RNG, USDA offers grants for up to 25% and loan guarantees for up to 75% of total project cost for commercially available renewable energy systems like anaerobic digesters. The maximum grant amount is $500,000 and the maximum loan amount is $25 million per applicant. USDA also offers grants to organizations that help farmers, ranchers, and small businesses operate these renewable energy projects. Every state has at least one NGV policy or incentive program, with 363 such efforts currently catalogued to date (AFDC, 2015b). States with significant incentives include CA, CO, TX, UT, and OK. One major state-level initiative was a 2011 memorandum of understanding (MOU) that was signed by 15 states to stimulate the production and demand for OEM light- and medium-duty NGVs, boost private investment in NG fueling infrastructure, and encourage greater coordination between state and local agencies. From this effort, in 2012, the National Association of State Procurement Officials coordinated the solicitation of a joint request for proposals, issued on behalf of the MOU signatories as well as seven additional states, to increase access to more affordable NGVs in state vehicle purchasing bids. Oklahoma, which was a leader in drafting the MOU, is highlighted below to provide an illustration of state-level policies. Oklahoma, which has significant NG resources, has a portfolio of incentives aimed to build the market for NG vehicles and infrastructure, many of which are in effect until 2020 to provide certainty to stakeholders. The state has a goal to have one public fueling station located every 100 miles along the interstate highway system by 2015 and one public fueling station every 50 miles by 2025. The state also allows its agencies to operate publicly accessible CNG stations to encourage NGV adoption and provides a waiver of state income tax to in-state producers of fueling equipment installed in the state of Oklahoma.
The state offers tax credits for up to 75% of the cost of installing new commercial CNG or LNG fueling infrastructure, and up to 50% of the cost of installing a residential CNG fueling system. Complementing the infrastructure tax credit, a one-time tax credit is available for 45% of the incremental cost of purchasing a new OEM NGV or conversion. The state also provides a tax credit of 10% of total vehicle cost, up to $1500, when a NGV is repurchased, as long as the credit has not already been taken on that NGV, creating a good strategy to encourage resale of vehicles. CNG used in motor vehicles is subject to a state motor fuel tax of $0.05 per gasoline gallon equivalent (GGE), while HDVs using LNG are subject to an annual flat-fee. Oklahoma also has a state-run private loan program that provides a 3% interest rate to private fleets for the incremental cost of purchasing an OEM NGV or converting a vehicle to run on NG. Two credit unions also offer loans for new or converted CNG vehicles that use state-licensed facilities, while a state utility offers rebates for home fueling devices and new or converted NGVs. The state’s licensing of CNG conversion shops is another unique program. The regulation dictates that equipment used for conversions must be new, meet applicable federal and state safety standards, and be installed by a state certified alternative fuels equipment technician. Technicians who install, modify, repair, or renovate equipment used in alternative fueling infrastructure must also be trained and certified. Trends Medium- and Heavy-Duty Engine Technology and Availability
Currently, Cummins Westport is the primary manufacturer of NG engines for HDVs. Its offerings include the 8.9-liter ISL G engine, which was released in 2007, for refuse, transit, shuttle, school, vocational, and freight applications up to 66,000 GVWR. In 2013, it released the larger 11.9-liter ISX12 G engine for more demanding freight applications (up to 80,000 GVWR). These engines utilize spark-ignition and turbocharging, and can use either CNG or LNG as fuels. To meet EPA and CARB 2010 heavy-duty engine emission standards, these engines use stoichiometric combustion with cooled exhaust gas recirculation and a three-way catalyst (TWC). These engines do not need to use particulate filters or selective catalytic reduction (SCR) for particulate matter (PM) or NOx emission control. Cummins Westport plans to start production in 2015 of its 6.7-liter ISB G engine to provide a less powerful but more fuel-efficient option for medium-duty vehicles, such as shuttle/paratransit, school, and utility vehicles (Piellisch, 2014a). Cummins planned to develop a 15-liter ISX15 G for freight applications, but in 2014, they announced that the project was on hold (Bates, 2014). In 2010, Westport Innovations released the HD 15-liter high-pressure direct injection (HPDITM) diesel pilot ignition engine. The HPDI engine uses a small amount of diesel (about 5% on an energy basis) to enable compression-ignition of NG, and may exhibit significantly improved engine efficiency while consuming NG as its primary fuel. In this system, LNG is directly injected into the cylinder at a high pressure (4,500 psi) along with the diesel pilot fuel. This lean-burn engine maintains “diesel-like” torque and thermodynamic efficiency but requires a diesel particulate filter (DPF) and SCR to meet 2007/2010 emission standards. In 2013, the engine was discontinued because of market considerations, though Westport announced the development of its next-generation HPDI 2.0 engine with improved reliability and reduced costs. Volvo had

planned to use the HPDI 2.0 technology for a 13-liter engine to be released in 2015, but recently announced it was putting the project on hold (Piellisch, 2014b). Infrastructure Trends As noted above, private sites that fuel only domiciled vehicles or fleets under prior arrangement are giving way to public access stations. However, there are still many private stations and restrictions at many public ones. Some public stations require card key access or that customers call ahead. Some require users to complete special training or enter PIN codes. Even stations that have the look and feel of conventional retail sites may impose restrictions, although this is becoming less common as their accumulated experience makes them increasingly comfortable alternative fuel providers. Today, chains like Kwiktrip, Love’s, and OnCue dispense CNG and/or LNG along with gasoline and diesel, and often alongside B20, E85, and propane as well. As the public refueling focus is on HDVs, these chains have made their stations “truck friendly”, locating dispensers on the far side of islands where canopies do not interfere with cab-mounted equipment, less maneuvering is needed, and turning radii permit easy access and egress. Figure 8 illustrates how the majority of stations operated by or for transit, government, waste disposal, school bus, and regional-haul fleets are private, while most stations operated by/for airports, utilities, and the natural gas industry are public.3 Both time-fill and combo stations are numerous in the waste, local government, and utility sectors. Along with public access stations (all of which provide fast fills), 90% of the CNG stations currently in service are fast-fill. Station Owner/Operator/Market
Figure 8 Existing Public and Private Access CNG Stations by Fill Type and Station Owner/Operator/Market Served (AFDC 2015c, NGVA 2015)
3 Note that because conventional and alternative fuel retailers also serve these markets, the counts shown in Figure 8 are by no means totals. While some retail stations serve specific markets and were categorized as such for purposes of this analysis, many serve a cross-section of users, both fleet and non-fleet, and were simply classed as conventional or alternative fuel retailers.
Today more than 95% of all CNG stations dispense fuel at 3600 psi. Many employ refrigeration and dispensing systems that permit filling to 3750 psi or more so that “settled” pressure will be approximately 3600 even on hot summer days or when dispensing into a warm vehicle tank. LNG stations also struggle to achieve full fills, especially when fuel has warmed or become “saturated”, resulting in lower pressure in both onboard and off-board tanks. Although progress has been made to improve thermal properties of tanks and ancillary equipment and some engines operate as well with lower pressure fuel, the use of saturated LNG does reduce range. Equally challenging has been slow growth in station availability due to lower than anticipated LNG vehicle sales. The combination of delayed product introductions and a narrower spread between diesel and LNG pump price has pushed fuel providers to cut back on LNG station development. For example, Blu LNG opened 7 out of 9 US stations planned for 2014 while Shell (in partnership with Travel Centers of America) opened only one of three. While Clean Energy opened 11 new LNG stations in 2014, the company has another 37 on hold. An increasing number of natural gas stations dispense renewable natural gas (RNG), either from on-site production associated with landfills or anaerobic digesters or via a paper trail involving off-site production and pipeline transport. Clean Energy Renewable Fuels sells a compressed RNG blend under the brand name Redeem™ to refuse fleets and vehicles fueled at airport stations in California where the blend qualifies for incentives under both the federal Renewable Fuel Standard (RFS) and California’s Low Carbon Fuel Standard. Quasar Energy Group operates three public CNG stations in Ohio where RNG is sold as “quasar natural gas”, some of which also generates renewable identification numbers (RINs) under the RFS. Other public access stations dispensing compressed RNG include AMP America’s Fair Oaks station in Indiana and DeKalb County’s Seminole Road station outside Atlanta. A number of private stations, mostly associated with landfills, dispense RNG to their own or partner fleets. These include Waste Management’s Altamont site in California, St. Landry Parish’s landfill in Louisiana, Clean World Partners’ Organic Waste Recycling Center in Sacramento, Dane County’s Rodefeld Landfill in Wisconsin and Rumpke’s Colerain landfill in Ohio. With the exception of Altamont, these stations all dispense renewable CNG. The growth of public access stations has brought many alternative fuel retailers to the CNG/ LNG market. In addition to Clean Energy, Trillium CNG (a subsidiary of Integrys Energy Group) and Blu (a joint venture of CH4 Energy Inc. and ENN Group, one of China's largest private companies), market entrants have come from the utility, natural gas and petroleum retailing industries, as well as from operators of NGV fleets. Today CNG “chains” are operated by conventional fuel retailers, oil and natural gas producers, new retail entities and utilities.4 In the past year retailers like CNG Fuel Inc. and Northville have been acquired by Constellation Energy (a unit of Exelon) and American Natural Gas, a development that is likely to continue. Impacts and Benefits
4 Oil and natural gas producers include Gain Clean Fuel (a division of US Oil), Mansfield Energy, Apache, and Sparq Natural Gas. New retailers include AMP Americas (solely or in partnership with Trillium), Clean‘n Green (a unit of Waste Management), Fast Flow/Independence Fuel Systems, Spire NG (a joint venture of Laclede and Siemens) and CNG 4 America. Utilities include Questar Gas, Piedmont NG, SoCal Gas, Oklahoma NG, PSNC and DTE Energy.
Petroleum Reduction Impacts The Alternative Fuel Life-Cycle Environmental and Economic Transportation (AFLEET) Tool developed by Argonne National Laboratory for the Clean Cities program estimates petroleum use, greenhouse gas emissions, air pollutant emissions, and cost of ownership of alternative fuel and conventional vehicles ranging from light-duty passenger cars to heavy-duty combination freight trucks. The AFLEET Tool, which uses data from the GREET Model, estimates that dedicated natural gas vehicles reduce lifecycle petroleum use by 99% when compared to conventional vehicles. These reductions remain consistent whether the fuel is CNG or LNG or from fossil NG or RNG and whether the vehicle is a light-duty car or heavy-duty truck. Air Pollutant Emission Reduction Impacts Strict air pollutant emission standards for both light-duty and heavy-duty vehicles have forced conventional vehicles to develop advanced engine controls and after-treatment systems to meet them. As a result, NGVs typically have similar emissions as gasoline and diesel vehicles. Though recent research suggests heavy-duty NGVs can have significant in-use NOx benefits in certain duty-cycles (Burnham, 2015). In addition, these standards, particularly for heavy-duty, have added costs to conventional vehicles in comparison to natural gas vehicles, which in many cases do not require the same type of controls. Greenhouse Gas Emissions Reduction Impacts The AFLEET Tool estimates that dedicated CNG LDVs reduce greenhouse gas (GHG) emissions by about 15% compared to gasoline vehicles when using fossil NG, while dedicated CNG and LNG HDVs reduce emission by about 10% compared to diesel vehicles (AFLEET, 2013). Relative to diesel fuel, RNG-fueled vehicles achieve GHG reductions of 80-115% depending on the source of the RNG. Economic Impacts Based on the JOBS NG model, developed by Argonne for the Clean Cities program, a fast-fill CNG station of average size is estimated to be associated with roughly 30 jobs, $160 million in earnings and $540 million in gross economic output. These figures include station design and engineering, permitting, construction, equipment fabrication and integration, shipping, installation, fuel supply and all aspects of station operation for the initial year. These estimates do not include the potential displacement of jobs, earnings or economic output from not developing conventional fuel stations since CNG stations are not anticipated to displace gasoline or diesel stations in the near term. Barriers The outlook of the natural gas vehicle market is much better than it was in the past, but there are still key barriers that should be addressed to further adoption rates. The two key barriers recently identified by NGV stakeholders were fueling infrastructure access and the incremental cost of vehicles (NGV Today 2014a). As mentioned previously, Recovery Act funding made a large impact on NG fueling infrastructure and private companies have been steadily adding stations, development of many others have been put on hold (especially for LNG). High incremental vehicle costs due to CNG or LNG storage systems are a major reason why station development has lagged as it can be difficult to make the economic case for NGVs for certain market segments, especially in HD sector as NGVs typically see a 10-15% fuel economy penalty. Some

progress has been made in this area as well with the introduction of a LNG tank package about 40% cheaper than others on the market, but further progress needs to be seen for CNG and LNG systems (NGV Today 2014b). Other barriers brought up in the survey include the lack of knowledge regarding NGVs, lack of vehicle options, and higher maintenance costs; each of these were considered smaller barriers than infrastructure and vehicle costs. More recent discussions with stakeholders have shown that volatility of gasoline and diesel prices are a key concern (NGV Today 2015). NG prices have remained very steady over the past several years, as the NG commodity cost is a relatively small portion, about 10-15%, of the fuel’s price, while for petroleum fuels the commodity cost can account for 60-80% of the fuel’s price (Ward 2012). Thus, in times when the price of crude oil drops, the incremental price advantage NG is diminished. However, this price volatility has more often been in NG’s favor, with much higher oil prices pushing the interest in NGVs. Other issues related NG fuel price include that federal excise tax is 24.3 cents per gallon of LNG, which is the same tax per gallon of diesel. The issue is that a gallon of diesel has about 170% more energy than a gallon of LNG. If the tax were on an energy equivalent basis, the tax would be about 14 cents per LNG gallon, which can be significant for high fuel use fleets. Similarly, there have been proposals at the National Conference on Weights and Measures to develop a standard for dispensing LNG based on a diesel gallon equivalent (DGE) basis, but at this time the measure has not been adopted. If the DGE standard is adopted it would likely pave the way to more uniform NGV fuel taxation. Opportunities Natural gas is already an important fuel in several heavy-duty markets, specifically transit where NGVs account for about 20% of fuel use and 25% of new bus sales, and refuse where they account for about 50% of new refuse truck sales (APTA 2014; Boyce 2013). Several other vehicle types with NGV market potential are discussed below. Table 2 provides details for each of these potential markets, including number of vehicles, annual vehicle miles traveled (VMT), and annual fuel consumption. The AFLEET Tool was used to estimate simple paybacks for two price scenarios, as well as petroleum use and GHG reductions under a 10% market penetration scenario to gauge the potential impact of each niche. • Regional Haul: Regional-haul (or short-haul) freight trucks are typically Class 8 vehicles
that generally travel 200 miles per day and return to the same location each night. Regional- haul trucks serve various industries including food and beverage, retail, and construction. In Table 1, we separate the regional haul segment into two ranges – trucks that travel up to 100 miles per day and trucks that travel between 100 and 200 miles per day. In addition, we illustrate a key niche within the broad regional haul market, port drayage trucks, which typically move goods between ports and distribution centers. Current NGV availability provides good coverage for this market with several manufacturers offering semi-trucks using either the 8.9 L or 11.9 L Cummins engine. The regional haul market is the largest of the opportunities discussed, with about 800,000 vehicles, typically Class 8, driving 50 billion miles and using 9 billion gallons of diesel per year. This segment provides a significant opportunity for NGVs. Return-to-base fleets with moderate daily driving needs can be fast-filled at either an onsite private station or a nearby retail outlet where they can serve as an anchor fleet. Alternatively, if vehicles are idle for
eight hours or more, the fleet can be time-filled using less costly equipment which can speed the payback of incremental NGV costs. At present, regional haulers own more private CNG stations (some operated by third parties like Trillium) than public stations and an unknown number refuel their vehicles at retail stations. Very few of these fleets use time filling.
• Concrete Mixers: Concrete mixers are specially designed to mix and transport cement to
construction sites via a rotating drum mounted to the chassis. Much like refuse trucks, ready mix concrete trucks utilize a power take-off (PTO) system, which allows the vehicle’s engine to power the mixer. Concrete mixers are typically Class 8 vehicles. They are heavy fuel users because of their PTO systems and duty cycle, which involves extensive idling while concrete is dispensed at a job site. Current NGV availability is good for this market with various manufacturers offering vocational trucks using either the 8.9 L or 11.9 Cummins engine. The market size is about 76,000 vehicles, driving a total of 1.8 billion miles and using 380 million gallons of diesel per year. Most cement mixers are centrally fueled and able to time-fill at the fleet’s depot. Thus, fleets can take advantage of private fuel pricing with its potential to achieve faster payback on incremental NGV costs. Moreover, the similarity in duty cycle to refuse trucks suggests the potential for significant NGV penetration into this market. For example, Ozinga Brothers, Inc. has committed to convert its entire 500-unit fleet of concrete mixers, work trucks and ancillary vehicles to CNG by 2020. Through its subsidiary, Ozinga Energy, the company also has entered the fueling market where it currently operates 3 public access stations “across the fence” from Ozinga yards.
• Paratransit: Paratransit vehicles perform demand-response (or flexible route) transit service
and often provide transport for senior citizens and people with disabilities. Vehicles typically have wheelchair lifts or ramps to improve access. Paratransit is often supplementary to fixed route service provided by transit buses and rail systems. Vehicles range from medium-duty vans (Class 3) to larger shuttle buses (Class 7). Current NGV availability includes vans with SVM conversions of OEM engines and larger buses with the 8.9 L Cummins engine. The market size is about 69,000 vehicles, driving a total of 1.4 billion miles and using 190 million gallons of fuel per year. Currently available NG engines match the duty-cycles of many paratransit operations and the forthcoming 6.7 L engine will provide additional coverage. As most paratransit vehicles are heavily utilized, good paybacks are possible (Table 2). With Federal Transit Administration (FTA) funding to cover 90% of the incremental cost, even faster paybacks are possible for transit agencies (FTA, 2015). Therefore, if public fueling is available or private infrastructure can be financed, many paratransit operators will see NGVs as a good fit. While this market is the smallest with respect to total fuel use per year, the similarity to transit operations and the potential for fast paybacks suggests that a significant penetration of NG for paratransit is possible. Other shuttle bus operations with similar duty-cycles as paratransit, such as those for airports and hotels, are also good candidates for NG. As shown in Figure 8, CNG currently is available at 53 airport locations.
• School Bus: Transport vehicles for school districts range in size from small (Class 3-4) Type A and B buses to large Type D (Class 7-8) buses, with Type C (Class 6-7) being the most common. These vehicles are heavily utilized during the school year, typically running two morning and two evening shifts, with significantly lower usage during summer months (Laughlin et al., 2014b). Current NGV availability covers Class A and B with SVM conversions of OEM engines and Class D with the 8.9 L Cummins engine. This market is the second largest of the opportunities discussed, with about 675,000 vehicles driving a total of 8.1 billion miles and using 1.3 billion gallons of fuel per year. While payback periods for these vehicles are typically longer than for paratransit, school buses often have access to other incentives to reduce purchase price of AFVs. Thus, if public fueling is available or private infrastructure can be financed, many school districts can find NGVs a good fit, especially when the 6.7 L engine is released as it will provide an option for Class C buses. Fueling is currently available at roughly 75 sites owned by school districts.
• Utility Service: Utility service vehicles typically range in size from Class 3-6, and often are equipped with tool boxes and other equipment, such as aerial lifts that use PTO systems or on-board generators. Utility service vans (Class 3) offer a good market as demonstrated by the uptake of NGVs into fleets with similar duty cycles, such as AT&T and Verizon. In addition, utility service trucks with PTO systems often must idle while at the job site. Current NGV availability includes vans with SVM conversions of OEM engines and larger service trucks with the 8.9 L Cummins engine. The market size is about 256,000 vehicles, driving a total of 3.2 billion miles and using 410 million gallons of fuel per year. This is a large and diverse market and one NGV solution is unlikely to fit all vehicles. Depending on a utility van’s service area, either public infrastructure or a bi-fuel option may be needed to meet range requirements. Private fueling infrastructure may be suitable for the duty cycle of larger service trucks, permitting faster paybacks. However, as shown in Figure 8, relatively few “time-fill only” stations serve this market,5 perhaps because overnight fueling is not always possible (e.g., in emergencies). Renewable Natural Gas: Although having the lowest carbon intensity of any currently available vehicular fuel, renewable natural gas – the upgraded product from the anaerobic conversion of organic material in landfills, farm digesters and wastewater treatment plants (WWTPs) – is still relatively uncommon. More typically, biogas produced at landfills (i.e., landfill gas) or in anaerobic digesters (AD) is either flared to reduce criteria pollutant emissions or used to generate electricity (and perhaps heat) for on-site use. Where infrastructure permits, renewable power or gas may be supplied to the grid. But in the absence of incentives, the combination of large upfront costs, long development timeframes and uncertain demand have been major barriers to doing so. Tax credits have come and gone, providing temporary boosts but little certainty to investors. While mandates like Renewable Portfolio Standards have spurred utilities to consider biogas-based projects, other options often have fewer regulatory hurdles and less complexity. Thus, EPA’s mid-2014 decision to qualify RNG or electricity produced from biogas and used by vehicles as a cellulosic biofuel eligible for incentives under the Renewable Fuel Standard (RFS) has the potential to
5 And about half of them are older, 3000 psi stations.
transform the RNG landscape. In 2014, renewable CNG and LNG accounted for 98% of the cellulosic biofuel qualified under the RFS (Voegele, 2015) which provided producers with an incentive worth roughly $0.80/diesel gal equivalent (DGE).6
In addition to reducing its price relative to fossil natural gas and diesel, expanding the production and use of RNG will require substantial quantities of organic feedstock. Of the 1,076 landfills, 6,900 dairy and swine farms and 1200 large WWTPs that could supply that feedstock, some 636 landfills, 239 farms and over 160 WWTPs currently have operational waste-to-energy (WTE) projects. However, only 46 of those projects (37 landfills, 3 dairies and 6 WWTPs) produce RNG for pipeline injection or use as a vehicular fuel. Thus, there is a substantial untapped market of candidate sites without operational WTE projects and existing projects that may be able to add purification of the biogas to produce RNG.
Of potential RNG sources, farm digesters and WWTPs currently appear less promising for Clean Cities’ coalitions because large farms are often remote (though some like Fair Oaks are on major truck corridors) and WWTPs often need all the power and heat produced to displace purchased electricity and maintain digester temperature (leaving little for export to the grid or for vehicle fuel).7 Thus, landfills and food waste are the most promising near-term opportunities. Landfills tend to be located near urban centers and already account for most RNG feedstock. Food waste also tends to be concentrated around large residential populations, is relatively energy dense and, using materials like fats, oils and greases (FOG), can boost AD yield. To date, five states (CA, VT, MA, CT and RI) have banned food waste from landfills, presenting an opportunity to use that diverted waste for RNG production. According to a recent BioCycle survey, 198 communities (including some outside these 5 states) currently have curbside collection of food scraps for composting (Yepsen, 2015). Curbside collection programs present another promising opportunity for RNG production since AD can be combined with composting to produce both fuel and soil amendments.
6 Assuming an average RIN value of $0.50/ethanol gal equivalent and that 33 million gals of ethanol are equivalent to 19.64 million DGE. 7 However, if efforts to improve digester efficiency and reduce cost are successful, many more sites near truck corridors could be attractive.

Table 2. U.S. Natural Gas Vehicle Niche Market Analysis
Vehicle type Population
Average Annual Mileage (VMT/ vehicle)
Average Annual Fuel Use (gallons/ vehicle)
High Oil Price Simple Payback (years)
Low Oil Price Simple Payback (years)
Per Vehicle Petroleum Use Reductions (bbl/ vehicle/yr)
Per Vehicle GHG Benefits (tons/ vehicle/ yr)
10% Market Penetration Petroleum Use Reductions (bbl/yr)
10% Market Penetration GHG Benefits (tons/yr)
Regional Haul
100 < x < 200 mile daily range 411,000 49,000 8,900 3 5 286 21 11,700,000 863,000
x < 100 mile daily range 371,000 30,000 5,400 3 6 170 13 6,300,000 465,000
Port Drayage 79,000 54,000 10,700 2 4 345 25 2,700,000 200,000 Concrete Mixers 76,000 16,000 5,000 4 9 162 7 1,200,000 55,000 Paratransit 69,000 24,000 2,700 5 10 97 7 700,000 49,000 School Bus 675,000 12,000 1,900 7 13 60 4 4,100,000 299,000 Utility Service Trucks 256,000 13,000 1,600 8 16 44 2 1,100,000 50,000 • Regional haul niche broken down into 3 categories: regional haul trucks with a daily range between 100 and 200 miles per day, regional haul trucks with a
range less than 100 miles per day, and drayage trucks. • Regional haul truck with daily range between 0 and 200 miles per day data from VIUS, 2002 • Port drayage trucks are not differentiated by range in this table. Data from CALSTART, 2013; Conway, 2012; GNA 2013; NCFRP, 2011 • Concrete mixers data from NRMCA, 2014 • Paratransit data from APTA, 2014; does not include FTA funding in payback calculation • School bus data from American School Bus Association, 2015 and Federal Highway Administration, 2012 • Utility service truck data from VIUS, 2002 • Simple payback, petroleum reduction, and GHG benefit calculations from AFLEET Tool
o NG price = $2.21/GGE; high oil price = $4.11/diesel gallon; low oil price = $3.50/diesel gallon; o VMT = 25% above average values in table o Incremental cost = $20k for paratransit, school and utility; $30k for concrete mixers and regional haul (x<100 mi); $40k for regional haul
(100<x<200 mi) and drayage
Strategies for Advancing the Use of CNG, LNG and RNG Coordination with Existing Clean Cities Activities Several existing national Clean Cities activities are being updated or enhanced to address natural gas vehicle market barriers or showcasing opportunities. COMMUNICATION PRODUCTS
• AFDC and Clean Cities Websites: http://www.afdc.energy.gov/fuels/electricity.html; www.cleancities.energy.gov A variety of tools and information are provided on these sites, such as the Vehicle Cost Calculator, Alternative Fuel and Advance Vehicle Search, and Laws and Incentives Database. The CNG Vehicle Fuel Tank Animation is one example of a visual tutorial on how ambient temperatures and fill speeds affect the capacity of the natural gas tank. YouTube postings on the Clean Cities website feature local Clean Cities success stories.
• MotorWeek Series: www.youtube.com/cleancitiestv For more than 10 years, Clean Cities has had a long-standing relationship with MotorWeek which produces a series of Clean Cities success stories and feature-length segments for public television.
• Toolkits: http://www.afdc.energy.gov/uploads/publication/casestudy_cng_refuse_feb2014.pdf Several niche markets, like natural gas refuse haulers and transit buses, have seen significant NG market penetration. Clean Cities has supported this phenomenon by publishing three case studies highlighting refuse fleets that used Recovery Act funding for NG vehicles and/or infrastructure. By documenting fleet experiences case studies help other fleets understand how NG might work for them. Toolkits like Idle Box are an extension of the case study concept. A Refuse Toolkit is currently under development. It will feature a PowerPoint presentation based on the Recovery Act case studies, Frequently Asked Questions, a primer of key terms, and links to other technical and marketing materials that have been developed for this market segment. Several other toolkits are planned: on NG bakery trucks, cement mixers and airport shuttle vehicles, as well as one focused on RNG which will include links to a mapping feature of projects through the country.
PARTNERSHIPS
• Annual Natural Gas Vehicle Technology Forum: http://www1.eere.energy.gov/cleancities/natural_gas_forum.html In partnership with the South Coast Air Quality District and the California Energy Commission, Clean Cities hosts an annual forum supporting the development and deployment of commercially competitive natural gas engines, vehicles, and infrastructure. By bringing together equipment manufacturers, national laboratories, government agencies, vehicle fleets, and industry groups, the stakeholder interaction provides the ability to hear status reports, discuss technology goals, and set priorities for the future.
• National Clean Fleets Partnership:http://www1.eere.energy.gov/cleancities/national_partnership.html Many of the nearly 30 partner fleets use NGVs. These large private-sector fleets operate in multiple states and work closely with Clean Cities to reduce petroleum consumption and
increase throughput at public stations, thereby reducing infrastructure costs. Fleets receive special resources, expertise and support to incorporate alternative fuels and advanced vehicles into their operations and share lessons learned with the Clean Cities network.
TECHNICAL ASSISTANCE
• Clean Cities University: http://www1.eere.energy.gov/cleancities/toolbox/university.html In addition to the NG infrastructure course, a new NG-related technical training course could help coordinators increase their understanding of such issues as cold vs. warm LNG, dispenser technology, metering differences, infrastructure operation, and fuel supply contracts. A RNG course could be included to help coordinators understand the various feed stocks, technical terminology, and the procedures for generating and tracking RINS.
• Tiger Teams: Since 2002, Clean Cities has been offering local coalitions troubleshooting help for specific vehicle, fuel or infrastructure complexities including NG.
• Technology Bulletins and Reports: http://www.afdc.energy.gov/vehicles/cng_tank_animation.html “Reliable Temperature Compensation is Critical to CNG Vehicle Safety” is one example of a specific technical issue addressed in a bulletin developed by laboratory experts and industry. “Business Case for Compressed Natural Gas in Municipal Fleets” is a popular case study that continues to be updated http://www.afdc.energy.gov/bulletins/2014_09_18_CNG_Temp.html. In 2014 “Costs Associated with CNG Fueling Infrastructure Report” and webinar were provided to Clean Cities stakeholders. http://www.afdc.energy.gov/uploads/publication/cng_infrastructure_costs.pdf “NGVs: Past & Prologue” webinar series was also a key activity for educating stakeholders about the natural gas vehicle industry both in the U.S. and globally. http://www.afdc.energy.gov/cleancities/webinars/uploads/document/document_url/6/ngv_policymaking.pdf
TOOLS
• AFDC Station Locator: http://www.afdc.energy.gov/locator/stations/ Data recently added to the Fueling Station Locator include Fill Type – the type of dispensing capability available at the station (e.g., fast-fill, time-fill); Vehicle Accessibility – the maximum vehicle size that can physically access the CNG fueling station (e.g., light-, medium-, heavy-duty vehicles); and Fill Pressure – dispensing pressure in psi available at the station (e.g., 2400, 3000, 3600). In FY15 plans are underway to add Flow Rate – in GGE/minute for public stations.
• AFLEET Tool: http://www.afdc.energy.gov/tools Stakeholders have asked for more vehicle types to be included in AFLEET, an Alternative Fuel Life-Cycle Environmental and Economic Transportation Tool. In FY 2015, bi-fuel CNG vehicles and natural gas infrastructure will be added.
• Vehicle and Infrastructure Cash-Flow Evaluation (VICE) Model: http://www.afdc.energy.gov/tools This model evaluates the return on investment and payback period for natural gas vehicles and fueling infrastructure. VICE 2 has added new features, such as being able to select a project type and decouple vehicle acquisition from infrastructure investment, provide a graphical picture of investment cash flow, and calculate simple and discounted payback.
• JOBS NG: http://www.afdc.energy.gov/tools This model estimates gross employment, earnings and economic output from the development and operation of CNG stations. JOBS NG uses input-output methodology to estimate changes in industry expenditures and calculates the ripple effects of those changes throughout the economy for a region of interest. In FY15, the economic impact of NG maintenance facilities and combined time/fast fill stations will be added.
• PREP Tool: http://www.afdc.energy.gov/tools The Petroleum Reduction Planning Tool helps a vehicle fleet reduce petroleum consumption and greenhouse gas (GHG) emissions. A comprehensive plan can be created for a fleet by using several savings methods.
New Clean Cities Activities by Niche Markets REGIONAL HAUL Dual-Fuel Technology Glider Program Opportunities: Clean Cities has been exploring market opportunities in the heavy-duty dual-fuel vehicle technology area. Initial research has pointed to glider-kits, which are brand new trucks and tractors with remanufactured powertrain components (Dorfman, 2014). Trucking fleets look to these vehicles as it is new equipment but offered at discounted prices and with legal pre-EGR engines. According to the Heavy-Duty Trucking Magazine, more than 3,900 gliders were sold in 2012, double from 2011. A Clean Cities strategy could be the development of a toolkit and webinar educating Clean Cities coalition about the differing technology approaches, and terminology, such as Outside Useful Life conversion technologies, Intermediate Life approvals, and glider programs. Marine, including in-land and intercostal waterways, Mining, and Rail Yards: The Heavy-Duty High Horsepower market is not a typical Clean Cities focus as these are off-road vehicles or vessels. Natural gas is beginning to be used in marine vessels, mining trucks and locomotives. However, significant throughput of CNG or LNG could be realized with off-road vehicles and on-road vehicles serving intermodal ports and with a range of vehicles fueling at these locations. As a first step, mapping capability could be used to identify intermodal ports and fleets in the vicinity that use natural gas. Coalitions could set-up workshops with fleets also in the vicinity but do not currently use natural gas. A toolkit could be developed to make the education process seamless. 12,000 miles of inland and intercostal waterways exist in the United States is an area to be explored. Corridors: Several corridors are beginning to form for NGVs, especially in the western part of the nation. A case study could be developed to analyze the opportunities, barriers, economics, etc. of various natural gas corridors and suggestions for next steps. This analysis could then be provided to coalitions to help develop new fleet customers and hubs. SHUTTLES Airport Vehicles: Targeting airports through national airport administrators/industry groups and then pairing Clean Cities coalitions to help identify specific local opportunities within the airports’ boundaries could set the stage for growth for this niche and other fleets in the area. While some coalitions have been able to introduce NGVs to their airports, the focus could be on smaller regional airports that have not been approached. A toolkit for coalitions to work
with management of untapped airports or airports with new management could be developed. Also, Clean Cities could (re)connect coalitions with the Federal Aviation Administration’s VALE program through a webinar, which would lead coalitions to working with their airports to help put together projects for funding. In the 1999-2002 time frame Clean Cities offered a series of airport-based workshops which were helpful in generating not only airport shuttle projects, but ground-side alternative fuel projects and neighboring fleet programs. If public access stations are operating at airports, non-airport fleets could be targeted as well. RENEWABLE NATURAL GAS RNG projects typically require high capital expenditure (capex), a lengthy development process, and multiple partners. Several Clean Cities coalitions have participated in such projects and their insights will be incorporated in the toolkit discussed above. Many of the barriers typical of RNG projects are common to other high capex projects (e.g., financing, risk). Food waste is a new area, however, and RNG project development using that waste will present new uncertainties and require the collaboration of groups not typically counted among Clean Cities’ stakeholders. Reaching out to groups involved in resource recovery and composting will be essential. Even coalitions unlikely to become directly involved in RNG project development should become knowledgeable about RNG and its potential, particularly as it now qualifies as a cellulosic biofuel under the RFS (and can generate RINS) and efforts are underway in some states to consider the establishment of a renewable gas standard, a possibility that would provide a major boost to RNG project development. UTILITIES National Governors Association (NGA) Partnership: Clean Cities has successfully worked with the NGA and staffs of state energy offices to build community readiness for electric-drive vehicles. In FY15, the focus will turn to natural gas vehicles with a goal of advancing the 22 state MOU adopted by Governors to stimulate the production and purchase of OEM natural gas vehicles. States need the assistance from Clean Cities to determine if public available infrastructure is available from local government entities or mandated fleets such as utilities, to drive demand by state fleets. NREL’s Fleet-Dash can be used to help with this analysis of state fleets. Policy issues, such as weights and measures and the taxation of LNG, incentive programs, taxation of new vehicles, certification of conversion and maintenance shops and technicians, natural gas vehicle inspection programs, rate recovery issues, would help the greater market and could be addressed at a workshop with state officials, technical experts, and Clean Cities coordinators.
Overarching Clean Cities Strategies Toolkits: As mentioned in the current list of Clean Cities activities, toolkits are being developed for several niche markets to streamline the process for coordinators as they reach out to these identified market segments. Based on ARRA data, in 2013 an LNG regional haul case study was developed examining 2011 LNG trucks that replaced older diesel trucks. For this niche market one of the lessons learned was to provide training for first responders, and as part of the training the attendees were given state maps with the routes where these vehicles would be traveling and the location of the stations. They were given quick reference cards developed jointly by the truck
manufacturer and fuel provider. These guides assisted first responders and drivers in identifying the key safety features of the truck in a two–page overview. Quick reference cards could be developed for this particular toolkit, along with Frequently Asked Questions, primer on key terms, how to identify these candidate fleets, PowerPoint presentations, and links to other technical and marketing material that have been developed for this market segment. Cement mixers and school buses are the feature of the FY15 case study series and will be the basis of the toolkits. Paratransit and Utility Service vehicles kits would be next in line for development. But, all of these niche market segments will be more robust as Clean Cities attends and presents at relevant industry conferences and provides the opportunity of new audiences to meet the network of Clean Cities coordinators and the technical assistance available to them. Innovative Financing for Infrastructure and Vehicles: For Clean Cities, the Center for Climate and Energy Solutions (C2ES) has analyzed various financing mechanisms available to coalitions and industry, including leasing to allow buyers to avoid high upfront costs and allow consumers and some government agencies to benefit from incentives since the dealer will capture these reductions and offer a lower price. Performance contracting has been used in the U.S. and in other countries as a way to finance the higher upfront costs of NGVs or new fueling infrastructure. In both cases, the investment can be repaid through future operational and fuel cost savings. C2ES also found that “Green Banks”, quasi-public or public financing institutions can leverage limited public dollars to attract significantly more private capital for investment. They can provide a variety of services including direct loans, contract standardization, and credit enhancements (C2ES, 2013). A pilot project could be developed helping a coalition approach a local lender to establish revolving loan programs or Green Bank. AFV Trials: When contemplating conversion to AFVs, fleet operators generally acquire a handful of vehicles and deploy them alongside conventional vehicles to evaluate their performance in actual driving conditions. Such trials can require complex contracting both for vehicles and fuel, which can be especially difficult for small fleet operators. Clean Cities could assist in this process by establishing local partnerships and web-based support to connect fleets with vehicle producers/distributers willing to loan vehicles (and perhaps fueling infrastructure) to permit them to undertake such trials.
References AFDC, 2015a, “Clean Cities Alternative Fuel and Advanced Vehicle Inventory,” http://www.afdc.energy.gov/data/10581/ (accessed 1/25/15).
AFDC, 2015b, “Federal and State Laws and Incentives,” http://www.afdc.energy.gov/laws/ (accessed 1/25/15).
AFDC, 2015c, “Natural Gas Fueling Stations,” http://www.afdc.energy.gov/fuels/natural_gas_stations.html (accessed 1/2/15).
AFLEET Tool, 2013, “Alternative Fuel Life-Cycle Environmental and Economic Transportation (AFLEET) Tool,” https://greet.es.anl.gov/afleet (accessed 1/25/15).
American School Bus Council, 2015, “Environmental Benefits”, http://www.americanschoolbuscouncil.org/issues/environmental-benefits (accessed 1/25/15).
APTA, 2014, “2014 Public Transportation Fact Book,”
http://www.apta.com/resources/statistics/Documents/FactBook/2014-APTA-Fact-Book.pdf.
Bates, M., 2014. “First Westport, Now Cummins: Uncertainty for One Natural Gas Engine,” http://www.ngtnews.com/e107_plugins/content/content.php?content.9408#.VLReYCvF96A (accessed 1/25/15).
Boyce, 2013, “What’s New in OEM HD Engine and Truck Platforms,” North American NGV Conference & Expo, http://www.ngvamerica.org/conference/2013/presentations/1-2BoyceCumminsWestport.pdf (accessed 1/25/15).
Burnham, A., 2015, “Alternative Fuel and Conventional Vehicle Air Pollutant Emissions,” Clean Cities Webinar, http://www.afdc.energy.gov/cleancities/webinars/#/past (accessed 2/5/15).
CALSTART, 2013, “Key Performance Parameters for Drayage Trucks Operating at the Ports of Los Angeles and Long Beach,” http://www.calstart.org/Libraries/I-710_Project/Key_Performance_Parameters_for_Drayage_Trucks_Operating_at_the_Ports_of_Los_Angeles_and_Long_Beach.sflb.ashx.
Conway, K., 2012, “North American Port Analysis: Beyond Post-Panamax Basics to Logistics,” http://www.cre.org/memberdata/pdfs/north_american_port_analysis.pdf (accessed 1/25/15).
EIA, 2014, “Annual Energy Outlook 2014, Market Trends: Natural Gas,” http://www.eia.gov/forecasts/aeo/mt_naturalgas.cfm (accessed 1/25/15).
EIA, 2015, “Alternative Fuel Vehicle Data: User and Fuel Data,” http://www.eia.gov/renewable/afv/users.cfm?fs=a&ufueltype=cng%2clng (accessed 1/25/15).
EPA, 2015, “Certified Clean Alternative Fuel Conversion Systems,” http://www.epa.gov/otaq/consumer/fuels/altfuels/documents/certified-conversions.xls (accessed 1/25/15).
GNA, 2013, “Moving California Forward: Zero and Low-Emission Goods Movement Pathways,” http://www.ucsusa.org/sites/default/files/legacy/assets/documents/clean_vehicles/Moving-California-Forward-Report.PDF (accessed 1/25/15).
Federal Highway Administration, 2012, “Highway Statistics 2012,” http://www.fhwa.dot.gov/policyinformation/statistics/2012/ (accessed 1/25/15).
FTA, 2015, “Clean Fuels Grant Program (5308),” http://www.fta.dot.gov/grants/13094_3560.html (accessed 1/25/15).
Laughlin, M. and A. Burnham, 2013, “Case Study – Liquefied Natural Gas,” http://www.afdc.energy.gov/uploads/publication/lng_case_study_8_2013.pdf (accessed 1/25/15).
Laughlin, M. and A. Burnham, 2014a, “Case Study – Compressed Natural Gas Refuse Fleets,” http://www.afdc.energy.gov/uploads/publication/casestudy_cng_refuse_feb2014.pdf (accessed 1/25/15).
Laughlin, M. and A. Burnham, 2014b, “Case Study – Propane School Bus Fleets,” http://www.afdc.energy.gov/uploads/publication/case-study-propane-school-bus-fleets.pdf (accessed 1/25/15).
Navigant Research, 2014, “Natural Gas Vehicles: Natural Gas Passenger Cars, Light Duty Trucks and Vans, Medium/Heavy Duty Trucks and Buses, and Commercial Vehicles: Global Market Analysis and Forecasts.”
NCFRP, 2011, “Truck Drayage Productivity Guide,” http://onlinepubs.trb.org/onlinepubs/ncfrp/ncfrp_rpt_011.pdf (accessed 1/25/15).
NGVAmerica (NGVA), 2014, “For Fleets,” https://www.ngvamerica.org/vehicles/for-fleets/ (accessed 1/25/15).
NGVA, 2015, U.S. “NGV Infrastructure Analysis,” Jan. 2015.
NRMCA, 2014, “National Ready Mixed Concrete Association, Fleet Benchmarking and Costs Survey,” http://www.nxtbook.com/naylor/NRCQ/NRCQ0314/index.php?startid=OC3 (accessed 1/25/15).
Piellisch, R., 2014a. “Cummins Westport ISB6.7G Update,” http://www.fleetsandfuels.com/fuels/ngvs/2014/01/cummins-westport-6-7-liter-update/ (accessed 1/25/15).
Piellisch, R., 2014b. “Volvo Throttles Back on Alt Fuels,” http://www.fleetsandfuels.com/fuels/ngvs/2014/10/volvo-throttles-back-on-alt-fuels/ (accessed 1/25/15).
Schroeder, A., 2015 (forthcoming), “2015 Natural Gas Vehicle Research Roadmap.”
VIUS, 2002, “Vehicle In-Use Survey,” https://www.census.gov/svsd/www/vius/2002.html (accessed 1/25/15).
Voegele, E., 2015. “EPA: 2014 Cellulosic RIN Generation Tops 33 Million,” Biomass Magazine, Jan. 15, http://www.biomassmagazine.com/articles/11438/epa-2014-cellulosic-rin-generation-tops-33-million) (accessed 2/20/15).
Yepsen, R., 2015, “Residential Food Waste Collection in the U.S.,” BioCycle, Jan., 56(1):53-63.