statsgo data use information united states agriculture ... · pdf filestatsgo data use...
TRANSCRIPT

STATSGO data use information
State Soil Geographic(STATSG0) Data BaseData use information
United StatesDepartment ofAgriculture
NaturalResourcesConservationService
NationalSoil SurveyCenter
MiscellaneousPublicationNumber 1492

STATSGO data use information
For additional copies of this publication contact:National Cartography and GIS CenterU.S. Department of Agriculture, Natural Resources Conservation ServiceP.O. Box 6567Fort Worth, Texas 76115–0567
Phone (817) 334–5559 FAX (817) 334–5469
The United States Department of Agriculture (USDA) prohibits discrimination in itsprograms on the basis of race, color, national origin, sex, religion, age, disability,political beliefs, and marital or familial status. (Not all prohibited bases apply to allprograms.) Persons with disabilities who require alternative means forcommunication of program information (braille, large print, audiotape, etc.) shouldcontact the USDA Office of Communications at (202) 720-5881 (voice) or(202) 720-7808 (TDD).
To file a complaint, write the Secretary of Agriculture, U.S. Department ofAgriculture, Washington, DC 20250, or call (202) 720-7327 (voice) or(202) 720-1127 (TDD). USDA is an equal employment opportunity employer.
Trade names mentioned are for specific information and do not constitute aguarantee or warranty of the product by the Department of Agriculture or anendorsement by the Department over other products not mentioned.
Issued August 1991, Slightly revised May 1993, Revised December 1994. Converted to .PDF September 1995

STATSGO data use information
Introduction .................................................................................... 1Soil geographic data bases ................................................................... 1Using soil maps................................................................................... 2
Use of STATSGO data...................................................................... 4STATSGO interpretive maps ............................................................... 4Using STATSGO data with other data .................................................. 4Analysis of STATSGO data .................................................................. 5STATSGO map development............................................................... 7Conclusion ....................................................................................... 13
Data collection ...............................................................................14Specifications used for compiling STATSGO ....................................... 14Procedures used for digitizing STATSGO ............................................ 15Quality control .................................................................................. 16
Data structure ................................................................................19Projection information ....................................................................... 19Spatial data distribution formats .......................................................... 19Attribute data distribution formats ....................................................... 27Attribute (tabular) data ....................................................................... 28
Data voids ......................................................................................30
Map hard copy production...............................................................31
User support ..................................................................................32
Distribution ....................................................................................34Source ............................................................................................. 34Format ............................................................................................. 34Media............................................................................................... 34Ordering information ......................................................................... 34
References .....................................................................................35
Appendixes ....................................................................................37
Contents

STATSGO data use information
FiguresFigure 1 STATSGO map unit ............................................................. 5Figure 2 STATSGO table relationships ................................................ 6Figure 3 STATSGO attribute relational data base schema ................... 29
ExamplesExample 1 Layer table attributes and weighted averages ...................... 7Example 2 Comp table attributes and sums of weighted averages ......... 9Example 3 Available water capacity categories .................................. 10Example 4 Comp table attributes and category codes ........................ 11Example 5 Mapunit table attributes and sums of comppcts ................. 12Example 6 Legend classes............................................................... 12Example 7 Category presents and legend class codes ........................ 13Example 8 Example of Digital Line Graph file ................................... 20Example 9 Attribute file .................................................................. 23Example 10 ARC/INFO export file .................................................... 24
TablesTable 1 Soil feature labels ................................................................ 15Table 2 Acreages and polygon statistics ............................................ 17Table 3 Projection parameters .......................................................... 19
Contents continued
STATSGO data use information
The U.S. Department of Agriculture’s (USDA) Natural Resources Conservation Service(NRCS), formerly the Soil Conservation Service (SCS), leads the National CooperativeSoil Survey (NCSS) and is responsible for collecting, storing, maintaining, and distributingsoil survey information for privately owned lands in the United States.
The NRCS established three soil geographic data bases representing kinds of soil maps.The maps are produced from different intensities and scales of mapping. Each data basehas a common link to an attribute data file for each map unit component. The SoilInterpretations Record data base provides the attribute data for each geographic database.
The three soil geographic data bases are the Soil Survey Geographic (SSURGO)data base, the State Soil Geographic (STATSGO) data base, and the National SoilGeographic (NATSGO) data base. Components of map units in each data base aregenerally phases of soil series that enable the most precise interpretation. Interpretationsare displayed differently for each geographic data base to be consistent with differinglevels of detail. The Soil Interpretations Record data base contains physical and chemicalsoil properties for approximately 18,000 soil series recognized in the United States.
The SSURGO data base provides the most detailed level of information and wasdesigned primarily for farm and ranch, landowner/user, township, county, or parishnatural resource planning and management. Using the soil attributes, this data baseserves as an excellent source for determining erodible areas and developing erosioncontrol practices, reviewing site development proposals and land use potential, makingland use assessments, and identifying potential wetlands and sand and gravel aquiferareas.
Using NCSS mapping standards, soil maps in the SSURGO data base are made usingfield methods. Surveyors observe soils along delineation boundaries and determine mapunit composition by field traverses and transects. Aerial photographs are interpreted andused as the field map base. Maps are made at scales ranging from 1:12,000 to1:63,360. Typically scales are 1:15,840, 1:20,000, or 1:24,000. The maps, along withcomprehensive descriptions, produce an attribute and spatial data base for NCSSpublications.
Line segments (vectors) are digitized in accordance with specifications and standardsestablished by the NRCS for duplicating the original soil survey map. The mapping basesare normally orthophotoquads, and digitizing is performed by NRCS, by contractors, orby cooperating Federal, State, and local governments. Data for the SSURGO data baseare collected and archived in 7.5 minute topographic quadrangle units and distributed asa complete coverage for a soil survey area usually consisting of 10 or more quadrangleunits. The adjoining 7.5 minute units are matched within the survey areas.
The STATSGO data base was designed primarily for regional, multistate, river basin,State, and multicounty resource planning, management, and monitoring. STATSGO
Soil geographicdata bases
Introduction

STATSGO data use information
data are not detailed enough to make interpretations at a county level.
Soil maps for STATSGO are compiled by generalizing more detailed (SSURGO) soilsurvey maps. Where more detailed soil survey maps are not available, data on geology,topography, vegetation, and climate are assembled, together with Land Remote SensingSatellite (LANDSAT) images. Soils of like areas are studied, and the probableclassification and extent of the soils are determined.
Map unit composition for a STATSGO map is determined by transecting or samplingareas on the more detailed maps and expanding the data statistically to characterize thewhole map unit.
Using the United States Geological Survey’s (USGS) 1:250,000 scale, 1- by 2-degreequadrangle series as a map base, the soil data are digitized by line segment (vector)method to comply with national guidelines and standards.
Data for the STATSGO data base are collected in 1- by 2-degree topographicquadrangle units and merged and distributed as statewide coverages. Features are edgematched between states. The map unit composition and the proportionate extent of themap unit components also match between states.
The NATSGO data base is used primarily for national and regional resource appraisal,planning, and monitoring. The boundaries of the major land resource areas (MLRA) andregions were used to form the NATSGO data base [6]. The MLRA boundaries weredeveloped primarily from State general soil maps.
Map unit composition for NATSGO was determined by sampling done as part of the1982 National Resources Inventory [7]. Sample data were expanded for the MLRA’s,with sample design being statistically significant to State parts of the MLRA’s.
The NATSGO map was compiled on an NRCS-adapted version of the 1970 Bureau ofCensus automated State and county map data base and it was digitized from the USGS1:5,000,000 scale U.S. base map.
This document describes the STATSGO data, which provide national coverage at a scaleof 1:250,000, except for Alaska, which is at a scale of 1:2,000,000.
A soil map in a soil survey is a representation of soil patterns in a landscape. The scaleof the map and the complexity of the soil patterns determine what can be shown on thesoil map. In designing soil surveys, the projected uses of the survey and the complexity ofthe soil patterns largely determine the scale of the soil map [4].
When using soil maps, remember that scale, accuracy, and detail are not synonymous.Scale is the relationship between corresponding distance on a map and the actualdistance on the ground. Accuracy is the degree or precision with which map information
Using soil maps

STATSGO data use information
is obtained, measured, and recorded, and detail is the amount of information shown.
Map scale, accuracy, and detail are interrelated. A large-scale map is not necessarilymore accurate or more detailed than a small-scale map; however, it generally showsmore detail than a small-scale map. Soil maps are made by using field investigationmethods. The accuracy of the maps is determined by many factors, including thecomplexity of the soils, design of the soil map units, intensity of field observations anddata collection, and skills of the mapper.
A soil map at 1:250,000 scale should not be used to locate soils for intensive land uses,such as determining suitability for house lots. It is useful for understanding the soilresources and for planning broad use in a State or region. A soil map at 1:20,000 scaleis useful in understanding and planning the soil resources of fields, farms, andcommunities, but it is not useful for planning small (less than 1 acre) research plots. Inmany places the pattern of soils is very complex, and in some places soils gradeimperceptibly to others. Because of this, soil delineations, even on large-scale maps, arenot homogeneous or pure; thus, onsite investigations are needed to determine, forexample, the suitability of a plot for a septic tank installation when using a soil map atscale of 1:20,000.
The common practice of enlarging soil maps does not result in more detailed or accuratemaps. Soil survey maps enlarged to 1:12,000 scale from 1:20,000 scale are no moreaccurate or detailed than the original 1:20,000 map.
Many times the information on soil maps is transferred to other base maps at differentscales, which diminishes the new map’s accuracy, especially if the base map is notplanimetrically correct.
Soil interpretive maps for specific uses are commonly made from the soil maps. Thesekinds of maps are single purpose and have the same credibility and limitations as the soilmaps from which they are made.
Recognizing the different kinds of soil maps, knowing their merits and limitations, and

STATSGO data use information
understanding the relationship of map scale, accuracy, and detail are important.
In a detailed SSURGO soil map, each map unit is usually represented by a single soilcomponent, typically a soil series phase [5]. Some SSURGO map units may have up tothree named components. An interpretive map is normally made by classifying each unitaccording to the set of soil properties for a single component. In contrast, each map uniton a STATSGO map contains up to 21 components for which there are attribute data,but there is no visible distinction as to the location of these components within thedelineation. Thus, to present information on an attribute, a series of maps must be usedto portray the more complex set of available information.
The legend for STATSGO interpretive maps commonly shows the percentage of themap unit that meets a criterion or criteria. Caution must be used in evaluating thestatistics presented in such a legend. Percentage ranges given represent all delineationsin that class and do not represent an individual STATSGO delineation. Percentages donot statistically represent a subset of the delineation such as a county portion. They alsodo not represent the areas of the soil components that satisfy the criterion. However, thearea of each map unit component is recorded in the data base and can be used toproduce a table, even though the components cannot be displayed directly on the map.
When STATSGO data are overlayed with other data, such as land use data, caution mustbe used in generating statistics on the co-occurrence of the land use data with the soildata. The composition of the STATSGO map unit can be characterized independentlyfor the land use and for the soil component, but there are no data on their jointoccurrence at a more detailed level. Analysis of the overlayed data should be on a mappolygon basis. It is incorrect to assign land use attributes to the soil components bymultiplying the proportions of soil components by the proportions of land uses.Additional political, watershed, or other boundaries may be intersected with the soil data.Although the composition of each political and watershed unit may be described in termsof the STATSGO map units, information is not available to assign the components tothe boundary units with full accuracy. As with the land use categories, the analysis shouldbe restricted to the classified components.
Visual orientation can be provided by using additional data files. For STATSGOinterpretative maps and for many other natural resource interpretive maps, a shadedrelief background provides visual reference of the topography that is easily understood.An example is the shaded relief background image from USGS Digital Elevation Modeldata, which is formatted in 1:250,000 scale, 1- by 2-degree quadrangles [2]. Other datatypes, such as USGS Digital Line Graph transportation and hydrography layers, helporient a reader to a map [8]. If transportation or hydrography data need to beincorporated into an analysis, it may be desirable to create a buffer zone around thelinear feature and then use an overlay operation to intersect the resulting corridor areawith the interpreted soil map.
Complex models can be constructed using the soil attribute data in conjunction withother data sources. The model output can be displayed in map form using a geographic
STATSGOinterpretive maps
Use of STATSGO data
Using STATSGOdata with other
data

STATSGO data use information
information system. Examples include soil erosion, soil leaching potential, and land usesuitability models. Calculations are typically made on the basis of each component soilphase. For example, in an erosion model, the slope and erodibility (kfactor) are extractedfor each soil phase. The results of the calculation for each component can then bedisplayed in map form using the percentage composition techniques discussed earlier [1].
In STATSGO, each map unit can have multiple components and each component canhave multiple layers (fig. 1). Therefore, the analysis must begin at the lowest level in theschema and work back to the highest level. The order from the bottom to the top islayer, comp (component), and mapunit (map unit) tables (fig. 2). The layer table is relatedto the comp table by muid (map unit identifier) and seqnum (sequential number), which isthe component number. The comp table is related to the mapunit table by muid, and themapunit table is related to the map data by muid. Other tables such as compyld(component yield), interp (interpretation), plantcom (plant community), rsprod (range siteproductivity), taxclass (taxonomic class), windbrk (windbreak), wlhabit (wildlife habitat),and woodmgt (woodland management) are on the same level with comp and relate to thecomp table with muid and seqnum. Refer to figure 3 for the STATSGO attributerelational data base schema.
Figure 1. STATSGO map unit
PA0015/
Components 1/
1 • 21
Components 2/
properties 1 2 3 • 60
Layer(s) 3/
1 2 • 6
Layer 4/
properties 1 2 3 • 28
1STATSGO map units consist of 1 to 21 components.2For each component, there are 60 soil properties and interpretations in 84 different data elements (component tables), for example, flooding.3For each component, there are 1 to 6 soil layers.4For each layer, there are 28 soil properties; for example, percent clay.5A map unit identifier created by concatenation of the two-character State FIPS code and a three-digit Arabic
Analysis ofSTATSGO data

STATSGO data use information
number. It uniquely identifies a map unit within a State.
The comp table can be considered as the hub through which all analyses pass (fig. 2).This is necessary to acquire the comppct (component percent) of each map unit thatmeets a criterion or criteria.
Because there are several layers in the layer table for each component in the comp table,a decision must be made as to how the data should be handled. Methods includeselecting for the presence or absence of a property, selecting a specific layer, oraggregating the data by calculating a weighted average or the sum of the weightedaverage.
An example for selecting for the presence of a property is locating all map unitcomponents that have a pH of less than 4.5 and aggregating the component percents bymap units. An example of selecting a specific layer is selecting the surface layer fororganic matter content and averaging the low and high values. A weighted average canbe calculated for clay. The low and high values can be averaged and multiplied by thelayer thickness and then divided by the total soil thickness. The sum of the weightedaverage can be calculated for available water capacity. The low and high values can beaveraged, multiplied by the layer thickness, and then summed. These methods reduce amany-to-one relationship to a one-to-one relationship.
Figure 2. STATSGO table relationships
MAPUNIT (muid)
Spatial Data
LAYER
CODES
INTERP FOREST WOODLAND PLANTCOM WINDBRK WOODMGT COMPYLD WLHABIT RSPROD
YLDUNITS
(muid, seqnum)
(max-6)
(clascode) TAXCLASS
(max-21)
COMP
CODES
(cropname)
(plantsym)
PLANTNM

STATSGO data use information
An example of layer data aggregation and map development for two map units in theDelaware STATSGO data base follows. The many-to-one relationships between the layerand the comp (component) tables are reduced to one-to-one relationships by calculatingthe sums of the weighted averages for the available water capacity. The attributesrequired for this example are in the mapunit, comp, and layer tables (fig. 3). Analysisbegins at the layer table which is at the lowest level in the data base schema. The resultsof the data aggregation are moved to the comp table. The comppcts (componentpercents) are aggregated by map units to reduce the many-to-one relationships that existsbetween the comp and the mapunit tables.
(1) Calculate weighted averages
The column wtavg in example 1 was added to selected layer table attributes to hold theweighted averages of the available water capacity calculated as follows:
wtavg laydeph laydeplawcl awch= − × +
( )( )
2
The wtavg is the total inches of available water in each soil layer (horizon). The laydepland laydeph are the beginning and ending depths of the soil layer (horizon) measuredfrom the soil surface. The awcl and awch are the low and high values for the range in theavailable water capacity for each soil layer.
Example 1. Layer table attributes and weighted averages
muid seqnum layernum laydepl laydeph awcl awch wtavg–––– –––––– –––––––– ––––––– ––––––– –––– –––– –––––DE001 1 1 0 40 0.04 0.09 2.6DE001 1 2 40 60 0.16 0.20 3.6DE001 2 1 0 40 0.04 0.09 2.6DE001 2 2 40 60 0.16 0.20 3.6DE001 3 1 0 16 0.04 0.09 1.04DE001 3 2 16 30 0.04 0.09 0.91DE001 3 3 30 72 0.04 0.10 2.1DE001 4 1 0 24 0.04 0.10 1.68DE001 4 2 24 36 0.10 0.16 1.56DE001 4 3 36 80 0.00 0.05 0.6DE001 5 1 0 11 0.15 0.20 1.925DE001 5 2 11 27 0.15 0.18 2.64DE001 5 3 27 60 0.06 0.16 3.63DE001 6 1 0 11 0.08 0.16 1.32DE001 6 2 11 29 0.06 0.16 1.98DE001 6 3 29 60 0.06 0.16 3.41DE001 7 1 0 17 0.06 0.10 1.36
STATSGO mapdevelopment

STATSGO data use information
DE001 7 2 17 37 0.10 0.15 2.5DE001 7 3 37 60 0.04 0.10 1.61DE001 8 1 0 39 0.06 0.11 3.315Example 1. Layer table attributes and weighted averages—Continued
muid seqnum layernum laydepl laydeph awcl awch wtavg–––– –––––– –––––––– ––––––– ––––––– –––– –––– –––––DE001 8 2 39 47 0.06 0.08 0.56DE001 8 3 47 60 0.11 0.17 1.82DE001 9 2 0 30 0.10 0.20 4.5DE001 9 2 30 34 0.02 0.07 0.18DE001 9 3 34 60 0.06 0.12 2.34DE001 10 1 0 20 0.10 0.18 2.8DE001 10 2 20 38 0.14 0.20 3.06DE001 10 3 38 60 0.06 0.20 2.86DE002 1 1 0 40 0.04 0.09 2.6DE002 1 2 40 60 0.16 0.20 3.6DE002 2 1 0 40 0.04 0.09 2.6DE002 2 2 40 60 0.16 0.20 3.6DE002 3 1 0 10 0.10 0.20 1.5DE002 3 2 10 28 0.10 0.15 2.25DE002 3 3 28 40 0.06 0.10 0.96DE002 3 4 40 60 0.06 0.18 2.4DE002 4 1 0 10 0.10 0.20 1.5DE002 4 2 10 28 0.10 0.15 2.25DE002 4 3 28 40 0.06 0.10 0.96DE002 4 4 40 60 0.06 0.18 2.4DE002 5 1 0 11 0.08 0.16 1.32DE002 5 2 11 29 0.06 0.16 1.98DE002 5 3 29 60 0.06 0.16 3.41DE002 6 1 0 14 0.10 0.15 1.75DE002 6 2 14 32 0.12 0.16 2.52DE002 6 3 32 60 0.03 0.06 1.26DE002 7 1 0 10 0.10 0.16 1.3DE002 7 2 10 36 0.12 0.19 4.03DE002 7 3 36 60 0.14 0.20 4.08

STATSGO data use information
DE002 8 1 0 11 0.15 0.20 1.925DE002 8 2 11 27 0.15 0.18 2.64DE002 8 3 27 60 0.06 0.16 3.63
(2) Calculate the sums of weighted averages
The weighted averages of the available water for the soil layers are summed by soilcomponents into the comp table in example 2. The comp and the layer tables are relatedby muid and seqnum. The summation of the weighted averages (sum_wtavg) is the totalinches of water available in soil profiles and is computed as follows:
sum_wtavg = ∑ wtavg
Example 2. Comp table attributes and sums of weighted averages
muid seqnum comppct sum_wtavg–––– –––––– ––––––– –––––––––DE001 1 42 6.2DE001 2 4 6.2DE001 3 2 4.05DE001 4 12 3.84DE001 5 10 8.195DE001 6 9 6.71DE001 7 7 5.47DE001 8 5 5.695DE001 9 6 7.02DE001 10 3 8.72DE002 1 11 6.2DE002 2 5 6.2DE002 3 18 7.11DE002 4 12 7.11DE002 5 17 6.71

STATSGO data use information
DE002 6 14 5.53DE002 7 12 9.41DE002 8 11 8.195
(3) Define available water capacity categories
Multiple maps, categories, are required to display the results of analyses of complexSTATSGO data. The series of maps normally have legends that display the percent ofthe map unit that meets a criterion or criteria. Example 3 shows the available watercapacity categories commonly used by NRCS [3]. In this example, five maps could begenerated. Category codes based on the sums of the weighted averages are assigned.
Example 3. Available water capacity categories
Category Category Available water capacity code label (inches)
1 very low 0 to 3 inches2 low 3 to 6 inches3 moderate 6 to 9 inches4 high 9 to 12 inches5 very high >12 inches

STATSGO data use information
(4) Assign category codes
Category codes defined in example 3 are assigned to components beginning with 1 forvery low and ending with 5 for very high available water capacity. The category codesare in cat_code in example 4.
Example 4. Comp table attributes and category codes
muid seqnum comppct sum_wtavg cat_code–––– –––––– ––––––– ––––––––– ––––––––DE001 1 2 6.2 3DE001 2 4 6.2 3DE001 3 2 4.05 2DE001 4 12 3.84 2DE001 5 10 8.195 3DE001 6 9 6.71 3DE001 7 7 5.47 2DE001 8 5 5.695 2DE001 9 6 7.02 3DE001 10 3 8.72 3DE002 1 11 6.2 3DE002 2 5 6.2 3DE002 3 18 7.11 3DE002 4 12 7.11 3DE002 5 17 6.71 3DE002 6 14 5.53 2DE002 7 12 9.41 4

STATSGO data use information
DE002 8 11 8.195 3
(5) Aggregate the sums of component percents
Aggregate the sums of the component percents by muid into the mapunit table (example5) to reduce the many-to-one relationships that exist between the mapunit and comptables. With STATSGO data, it is impossible to display all of the results of the analyseson one map, so a series of maps is generated, one for each category. Because fivecategories have been defined for available water capacity, up to five maps may begenerated. The comp table is related to the mapunit table by muid, and the sum of thecomppcts will be calculated from the comp table into pct1, pct2, pct3, pct4, and pct5 inthe mapunit table. Pct1 corresponds to category 1, and pct5 corresponds to category 5.
Example 5. Mapunit table attributes and sums of comppcts
muid pct1 pct2 pct3 pct4 pct5–––– –––– –––– –––– –––– ––––DE001 0 26 74 0 0DE002 0 14 74 12 0
(6) Define legend classes
The legend for STATSGO maps is commonly in terms of percent of the map unit thatmeets a criterion or criteria. Four legend classes are defined in example 6. A class codeis assigned to each of the four classes, beginning with 1 for 0 to 25 percent and endingwith 4 for 76 to 100 percent. Water, if present, is assigned a class code of 5.
Example 6. Legend classes
Legend class code Legend classes
1 0 to 25 percent2 26 to 50 percent

STATSGO data use information
3 51 to 75 percent4 76 to 100 percent
Legend class codes are assigned for pct1 through pct5 in map1 through map5 inexample 7. In this example, 0 percent is included in legend class 1. However, 0 percentcould be separated into a legend class of criteria not met. The legend class codes can belinked to the map data by muid and to a color lookup table for polygon shading on eachmap.
Example 7. Category percents and legend class codes
muid pct1 pct2 pct3 pct4 pct5 map1 map2 map3 map4 map5–––– –––– –––– –––– –––– –––– –––– –––– –––– –––– ––––DE001 0 26 74 0 0 1 2 3 1 1DE002 0 14 74 12 0 1 1 3 1 1
This brief description concerns how one attribute at the layer table level is handled. Eventhough the logic is the same, the process becomes more complicated when several
Conclusion

STATSGO data use information
attributes from different tables are being evaluated. An example would be pesticideleaching potential that involves organic matter and surface layer thickness from the layertable and hydrologic groups from the comp table.
Compilation proceduresDraft soil map unit lines using available references such as soil survey maps, publishedand unpublished; county general soil maps; State general soil maps; State major landresource area (MLRA) maps; and LANDSAT images.
Draft soil map unit lines and symbols in red pencil on a mylar overlay that is punchregistered to fit the mylar USGS 1:250,000 topographic quadrangle. Do not transfer theUSGS topographic quadrangle neatline to the overlay as it will be added during thedigitizing process.
Maintain soil map unit line quality to facilitate scanning by:• Periodically sharpening the pencil to maintain consistent line widths and density• Closing all gaps or skips in lines• Closing all delineations• Using a dark red pencil that is easily scanned
Complete a 100 percent edit on all compiled mylar overlays before digitizing.
Map unit delineationsApproximate minimum area delineated is 625 hectares (1,544 acres), which isrepresented on a map of 1:250,000 scale by an area appropriately 1 cm by 1 cm (0.4inch by 0.4 inch). Linear delineations should not be less than 0.5 cm (0.2 inch) in width.The number of delineations per 1:250,000 quadrangle should range from 100 to 200,but a range of up to 400 is allowed.
Map unit delineations must join at State boundaries and composition of map units mustbe coordinated across State boundaries, not only in the identity, but also in the relativeextent of each component. All component phase criteria are to join across Stateboundaries.
ComponentsMap units will be a combination of associated phases of soil series. The informationabout map units includes reliable estimates of the components and the percentage andmethod by which the composition is determined. Composition is determined bytransecting representative segments of map units in published or unpublished soil surveysand documenting component composition or by using acreage data in the map unit usefile. Transects may be observed in the field; however, it is more likely that they will belocated and examined on soil survey field sheets or in published soil surveys. A suggestedprocedure consists of four steps.
1. Plot transects on the general soil map so that they afford complete and representativecoverage of the respective map unit. Plot transects on published soil survey atlassheets or unpublished soil survey field sheets so that they cut across the more detailed
Data collection
Specificationsused for
compilingSTATSGO
Map units

STATSGO data use information
delineations that make up the corresponding map unit on the general soil map. Basedon the judgment of the soil scientist, they should be located to intersect delineations ofsoils most representative of the map unit when subsequently plotted on the publishedatlas sheets or field sheets for measuring. Generally, transects are located at rightangles to drainage patterns, include the complete range in elevation, and representthe typical landscape. Transects also include and represent uniform space across thedelineated map unit. All map units are to be sampled by transects. The number oftransects being used are proportional to the relative size, number, and complexity ofthe delineations. NRCS State staffs will submit their verification procedures to theirNational Technical Center with the compiled maps for review.
2. Measure and record the length of the segments of each map unit along the transectcrossing the detailed soil map on the atlas or field sheets.
3. Combine data on segment lengths for all delineations of each map unit. Using routinecorrelation procedures, determine which map components from the atlas or fieldsheets can be combined and make combinations so that not more than 21 phases ofsoil series or comparable detailed units are identified as components of the map uniton the general soil map.
4. Determine the percentage of the general soil map unit occupied by each componentby the percentage of the total length of the transects crossing the area of the generalsoil map unit.
Features to be digitized
The following map features are digitized:• Line features - State boundaries• Area features - soil and water (shoreline) boundaries
Note: Do not digitize the map neatline.
Line features are not labeled in the STATSGO data. Soil and water polygons and areasbeyond the data limits and within the quadrangle are labeled. Feature labels forSTATSGO data are in table 1.
Table 1. Soil feature labels
Type Description Feature labels
Line Soil boundary —Line Water boundary —Line Map neatline —Line State boundary —Point Map unit identifier PA001
Procedures usedfor digitizing
STATSGO

STATSGO data use information
Point Water PAWPoint Area beyond data NODATA
and within quadrangle
The following standards and specifications apply to digitizing STATSGO data from1:250,000 scale USGS topographic quadrangles.
Soil and water boundariesDigitize all soil and water boundaries within a 0.01-inch line width following the centerline of the digitizing source. Represent each soil boundary with no greater number ofcoordinate pairs than is necessary to maintain the 0.01-inch accuracy limit.
Digitize islands (polygons that do not connect to or intersect with another soil or waterboundary) as a continuous line segment with only a beginning and ending node. Connectbeginning and ending points of each digitized line at a common intersecting point withanother soil boundary, water boundary, State boundary, or the map neatline.
State boundariesState boundaries are the limit of the survey and must meet the same 0.01-inch accuracystandard as soil and water boundaries. The State boundary is considered as part of soiland water delineations.
Map neatlineThe map neatline is considered as part of soil and water boundaries and forms themaximum extent of the digital data set. Construct the map neatline as four separate lineboundary segments. The beginning and ending point of each neatline will be identical tothe four corner coordinate values of the 1– by 2–degree quadrangle. These values mustbe explicitly entered and not digitized. Enter all 7.5 minute tic marks for geographiccontrol. Soil boundaries intersecting the map neatline must have a common point ofintersection and must not extend beyond or fall short of the map neatline.
Map unit identifiersThe map unit identifiers will consist of the alpha state FIPS code followed by a three-character Arabic number and will be identical to those shown on the original soil map,for example, PA001. Position the label point for the map unit identifier at the centroidof the soil area. If the centroid falls outside of the soil area, move the label point for themap unit identifier into the soil area.
Soil areas missing a map unit identifier should be labeled XXX until the symbol isdetermined. Areas outside the limit of the soil survey boundary but within the neatline areto be labeled NODATA. Water areas are to be labeled with the alpha state FIPS codefollowed by the letter W, for example, PAW.
Data capture
Labeling
Quality control

STATSGO data use information
Edge matchingThe soil boundaries ending at all four edges of each quadrangle should be computerjoined to any adjoining map sheets to achieve an exact match. However, if this is notpossible due to system limitations, match the soil boundaries on the adjoiningquadrangles within 0.01-inch, center line to center line. Check the adjoining map sheetsbefore digitizing and revise, if necessary, to ensure that lines and boundaries match.StatisticsDevelop acreage calculations and a total polygon count by map unit for each soil mapdata set on each 1:250,000 quadrangle. Print a computer generated hard copy of thestatistics for each soil map data set. A sample printout with acreage and polygonstatistics is in table 2. Sort the records by map unit identifier, water, and NODATA.Show the acreages to the nearest acre.
Table 2. Acreages and polygon statistics
PA001 27,081PA002 2,371PA003 289,688NODATA 3,067PAW 532
Total Acres –––––––Total Polygons –––
Calculate the total acreage within the map neatline, including the areas outside the limitof the soil survey that are labeled NODATA, and summarize the acreage.
State editA complete and detailed edit of the digitizing work is required. The state soil scientist isresponsible for ensuring that the digital soil data match the digitizing source. Thedigitized soil data must be carefully checked against the source maps to ensure that alldata are correctly and completely digitized.
Check plotsGenerate a check plot for each digitized soil map data set at the same scale and mapprojection as the original soil map sheet. The check plots are to accurately represent thedata on the magnetic tape data sets.
• Generate the check plots with either ball pen (standard point) or wet ink, using a0.01-inch line width on mylar material. Plot all data within 0.005 inch of itscoordinate location in the data base.
• Plot map unit identifiers as a line of single stroke characters, height and width of0.10 inch. The map unit identifiers should duplicate the sequence of the source maps.The digital origin points for the map unit identifiers will not appear on the check plots.Plot soil boundaries, neatlines, State boundaries, and map unit identifiers in black. Plotwater boundaries and water area names in blue. Soil symbols that are unidentifiable

STATSGO data use information
and labeled as XXX are plotted in red.
• Label the check plot with the appropriate data set name and plotting scale at somepoint beyond the data set limits.
• Check plots are to be free of dirt, smudges, scratches, and other defects.National Technical Center reviewThe National Technical Center GIS specialist is responsible for:• Resolving discrepencies among states• Checking map unit composition within and among states• Maintaining consistency among states
National Cartography and GIS Center preliminary reviewA preliminary edit is required after the first two adjoining soil map sheets are digitized.Forward the following materials to the NRCS National Cartography and GIS Center:• Check plots• Digital data sets on magnetic tape• Summary acreage calculation with a total polygon count for each map sheet• Original source materials
STATSGO data use information
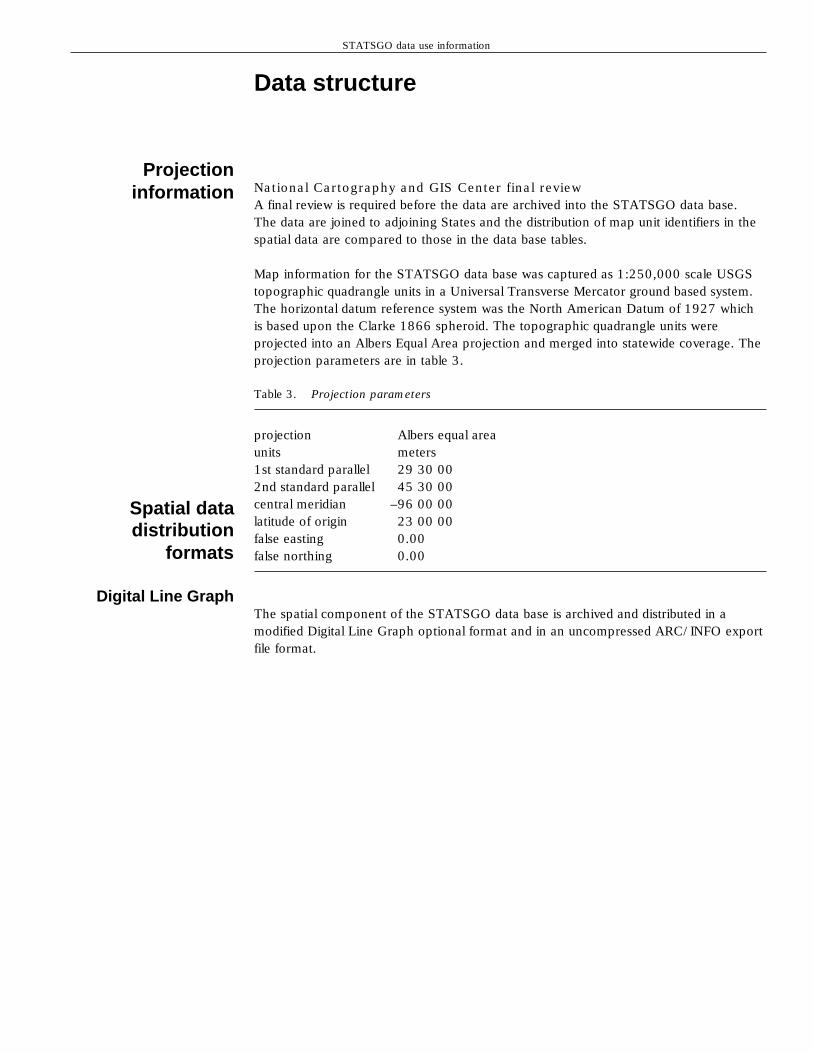
National Cartography and GIS Center final reviewA final review is required before the data are archived into the STATSGO data base.The data are joined to adjoining States and the distribution of map unit identifiers in thespatial data are compared to those in the data base tables.
Map information for the STATSGO data base was captured as 1:250,000 scale USGStopographic quadrangle units in a Universal Transverse Mercator ground based system.The horizontal datum reference system was the North American Datum of 1927 whichis based upon the Clarke 1866 spheroid. The topographic quadrangle units wereprojected into an Albers Equal Area projection and merged into statewide coverage. Theprojection parameters are in table 3.
Table 3. Projection parameters
projection Albers equal areaunits meters1st standard parallel 29 30 002nd standard parallel 45 30 00central meridian –96 00 00latitude of origin 23 00 00false easting 0.00false northing 0.00
The spatial component of the STATSGO data base is archived and distributed in amodified Digital Line Graph optional format and in an uncompressed ARC/INFO exportfile format.
Data structure
Projectioninformation
Spatial datadistribution
formats
Digital Line Graph

STATSGO data use information
An example of a modified Digital Line Graph optional format file is shown in example 8. The Digital Line Graphcontains header records and data records consisting of node identification records, area identification records, and lineidentification records. The area identification records in the Digital Line Graph contain major and minor code pairs.
Example 8. Digital Line Graph file
ESRI DLG DATA - CHARACTER FORMAT - 05-08-92 VERSIONPENNSYLVANIA 1991 250000USDA/NRCS STATSGO DATA 3 3 0 2 0.63500127000D+01 4 0 4 1 0 0 0.000000000000000D+00 0.000000000000000D+00 0.293000000000000D+06 0.453000000000000D+06 -0.960000000000000D+06 0.230000000000000D+06 0.000000000000000D+00 0.000000000000000D+00 0.000000000000000D+00 0.000000000000000D+00 0.000000000000000D+00 0.000000000000000D+00 0.000000000000000D+00 0.000000000000000D+00 0.000000000000000D+000.10000000000D+01 0.00000000000D+00 0.00000000000D+00 0.00000000000D+00SW 32.000000 -84.000000 1196917.29 1863172.95NW 36.000000 -84.000000 1131189.23 2306107.79NE 36.000000 -78.000000 1768136.86 2428214.30SE 32.000000 -78.000000 1870874.93 1992374.49SOILS 0 2380 2380 010 1288 1288 010 3416 3416 1N 1 1679039.38 2293269.75 3 0 0 2921 2920 -9N 2 1684550.75 2294351.25 2 0 0 -2923 -2920N 3 1673456.00 2292043.75 3 0 0 2922 -2921 -1...(printout continues)...A 1 1131188.23 1863171.95 0 243 0 1 0 0 -2920 2921 2922 -2924 2927 2928 2929 -2930 2931 2932 2936 -2937 -2951 -2952 -2956 -2958 -2962 -2963 -2964 2965 2966 2967 -2968 -2969 -2970 2973 2974 -2975 -2976 -2979 -2980 -2984 -2994 -2997 -3003 -3004 -3009 -3011 -3015 -3016 -3018 -3020 -3021 -3022 -3023 -3024 -3025 -3026 -3027 -3029 -3030 -3031 -3032 -3033 3019 3017 2978 -3005 -3013 -3035 -3058 -3062 -3071 -3080 -3133 -3138 -3141 -3142 -3145 -3159 -3162 -3164 -3165 -3166 -3200 -3242 -3249 -3272 -3275 3323 -3328 -3338 -3350 3409 3413 -3416 3414 3411 3410 3408 3407 3406 3405 3403 3402 3400 -3398 -3390 -3388 3386 3385 -3384 -3382 -3379 -3374 -3371 3365 3362 3358 3353 3351 3345 3340 3334 3331 3327 3325 3324 3322 3321

STATSGO data use information
3320 3319 3318 3317 3316 3315 3314 3312 3311 3310 3309 3307 3306 3305 3304 3303 3302 3301 3299 3297 -3295 3293 -3292 -3291 -3289 -3286 -3284 -3282 3279 -3276 3274 3270 3266 3264 3235 3233 3231 3228 3226 3225 3223 3222 3213 3207 -3179 -3184 -3186 -3185 3137 3134 3132 3116 3114 3110 3088 3083 3081 3078 3075 3072Example 8. Digital Line Graph file—Continued
3069 3055 3052 3049 3048 3046 3045 3037 3028 3014 3012 30103008 3007 3006 3000 2996 3002 2998 2999 3001 2995 2993 29922991 2990 2989 2988 2985 2986 2987 2983 2982 2981 2977 29722971 2961 2960 2959 2957 2954 2955 2953 2950 2949 2947 29482946 2940 2939 2942 2938 2941 2943 2945 2944 2935 2934 29332925 2926 2923
0 0A 2 1686811.12 2289302.00 0 19 0 1 0 0
9 2920 -2923 -10 -2945 -13 -2941 -2938 -2942 -2939 -2940 -2946 -2948 -2947 -2949 -2950 -2953 26 29
900 26A 3 1680287.00 2289372.75 0 7 0 1 0 1 1 -2921 -9 -12 11 0 6
900 25A 4 1669851.25 2289142.50 0 4 0 1 0 0
-1 -4 3 -2922900 98
.
.
.(printout continues)...L 1 4 3 4 3 6 0 01673728.38 2290495.25 1673642.25 2290578.50 1673541.38 2290727.251673402.12 2291346.00 1673356.50 2291848.50 1673456.00 2292043.75
L 2 10 11 8 9 38 001661458.00 2289424.75 1661462.12 2289406.50 1661698.62 2289254.751662381.88 2289066.50 1662679.88 2288791.50 1662834.75 2288552.751663154.62 2288180.25 1663538.75 2287822.25 1663836.75 2287547.001663920.25 2287326.25 1663956.88 2287163.50 1663929.25 2286986.501663716.62 2286733.00 1663316.75 2286711.50 1663006.00 2286743.501662680.38 2286841.50 1662544.75 2286845.00 1662290.75 2286924.751662155.12 2286928.25 1661829.62 2287025.75 1661422.50 2287036.501660743.88 2287055.00 1660704.50 2287080.25 1660215.88 2287004.001659410.75 2286685.50 1659168.62 2286562.75 1659143.88 2286522.501658669.88 2286381.50 1658284.75 2286294.75 1657692.38 2286229.751657009.38 2286417.50 1656683.88 2286515.00 1656462.00 2286601.751656171.25 2286844.50 1655836.62 2287282.25 1655642.25 2287546.25

STATSGO data use information
1655447.88 2287810.00 1655252.75 2288078.00L 3 16 5 7 4 25 0 01668350.50 2285622.25 1668388.12 2285904.50 1668386.38 2286211.751668389.12 2286349.25 1668414.00 2286389.00 1668362.62 2286617.001668178.38 2286986.00 1668124.25 2287076.50 1668008.75 2287290.25
Example 8. Digital Line Graph file—Continued
1667969.38 2287315.25 1667950.12 2287550.75 1667898.88 2287778.751667748.38 2287847.50 1667215.75 2287966.50 1667026.00 2288060.501666900.38 2288169.00 1666752.75 2288375.50 1666521.75 2288802.501666421.00 2288950.75 1666266.00 2289189.50 1666035.00 2289616.751665988.12 2289674.75 1665793.88 2289938.75 1665417.00 2290264.251665418.75 2290287.50
.
.
.(printout continues)..

STATSGO data use information
Digital Line Graphattribute file
.L 3416 2366 2365 1 1279 3 0 01320186.62 1964287.88 1309551.62 1962560.88 1309214.90
1964436.36
Map unit identifiers (e.g., PA001) are not carried within the modified Digital Line Graphfile; however, they are made available in a companion attribute file. The attribute filelinks the minor codes in the Digital Line Graph files to the feature labels. Similar mapunit identifiers in the map sets will have the same minor code, so the conversion file is auniversal conversion legend. Example 9 shows the format and contents of an attributefile. The columns are space delimited and the columns are left justified. The first columncorresponds to the minor code in the Digital Line Graph. The second column is the mapunit identifier, which is the muid element in the data base tables.
Example 9. Attribute file
0 UNIV1 PA0012 PA0023 PA0034 PA0046 PA006...(printout continues)...98 PA10099 PA101100 PAW

STATSGO data use information
101 PA103102 PA104103 PA105104 PA106_________________________________________________________________
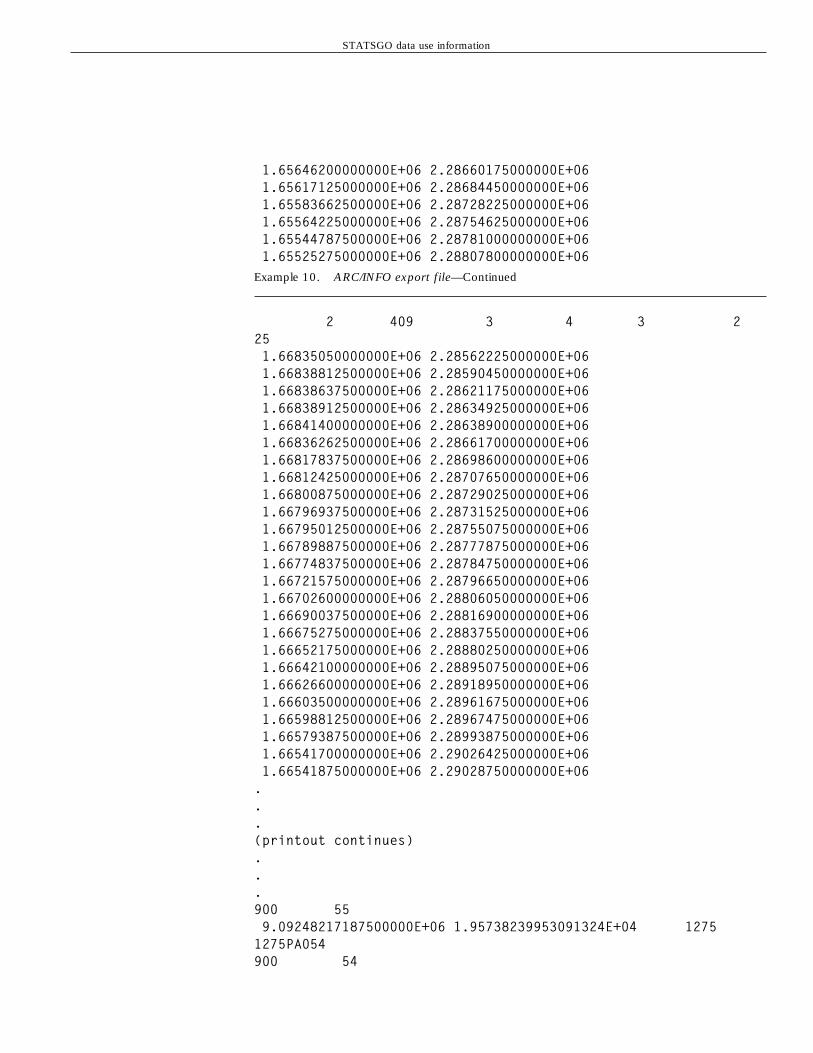
An example of an uncompressed ESRI ARC/INFO export file is shown in example 10.The map unit identifier is carried in the export file.
Example 10. ARC/INFO export file
EXP 0 /DATA_SGIS1/EXPORT/TEMP/PENNSYLVANIA.E00ARC 3
1 415 1 2 4 538 1.66145800000000E+06 2.28942475000000E+061.66146212500000E+06 2.28940650000000E+061.66169862500000E+06 2.28925475000000E+061.66238187500000E+06 2.28906650000000E+061.66267987500000E+06 2.28879150000000E+061.66283475000000E+06 2.28855275000000E+061.66315462500000E+06 2.28818025000000E+061.66353875000000E+06 2.28782225000000E+061.66383675000000E+06 2.28754700000000E+061.66392025000000E+06 2.28732625000000E+061.66395687500000E+06 2.28716350000000E+061.66392925000000E+06 2.28698650000000E+061.66371662500000E+06 2.28673300000000E+061.66331675000000E+06 2.28671150000000E+061.66300600000000E+06 2.28674350000000E+061.66268037500000E+06 2.28684150000000E+061.66254475000000E+06 2.28684500000000E+061.66229075000000E+06 2.28692475000000E+061.66215512500000E+06 2.28692825000000E+061.66182962500000E+06 2.28702575000000E+061.66142250000000E+06 2.28703650000000E+061.66074387500000E+06 2.28705500000000E+061.66070450000000E+06 2.28708025000000E+061.66021587500000E+06 2.28700400000000E+061.65941075000000E+06 2.28668550000000E+061.65916862500000E+06 2.28656275000000E+061.65914387500000E+06 2.28652250000000E+061.65866987500000E+06 2.28638150000000E+061.65828475000000E+06 2.28629475000000E+061.65769237500000E+06 2.28622975000000E+061.65700937500000E+06 2.28641750000000E+061.65668387500000E+06 2.28651500000000E+06
ARC/INFO export
STATSGO data use information
1.65646200000000E+06 2.28660175000000E+061.65617125000000E+06 2.28684450000000E+061.65583662500000E+06 2.28728225000000E+061.65564225000000E+06 2.28754625000000E+061.65544787500000E+06 2.28781000000000E+061.65525275000000E+06 2.28807800000000E+06
Example 10. ARC/INFO export file—Continued
2 409 3 4 3 2251.66835050000000E+06 2.28562225000000E+061.66838812500000E+06 2.28590450000000E+061.66838637500000E+06 2.28621175000000E+061.66838912500000E+06 2.28634925000000E+061.66841400000000E+06 2.28638900000000E+061.66836262500000E+06 2.28661700000000E+061.66817837500000E+06 2.28698600000000E+061.66812425000000E+06 2.28707650000000E+061.66800875000000E+06 2.28729025000000E+061.66796937500000E+06 2.28731525000000E+061.66795012500000E+06 2.28755075000000E+061.66789887500000E+06 2.28777875000000E+061.66774837500000E+06 2.28784750000000E+061.66721575000000E+06 2.28796650000000E+061.66702600000000E+06 2.28806050000000E+061.66690037500000E+06 2.28816900000000E+061.66675275000000E+06 2.28837550000000E+061.66652175000000E+06 2.28880250000000E+061.66642100000000E+06 2.28895075000000E+061.66626600000000E+06 2.28918950000000E+061.66603500000000E+06 2.28961675000000E+061.66598812500000E+06 2.28967475000000E+061.66579387500000E+06 2.28993875000000E+061.66541700000000E+06 2.29026425000000E+061.66541875000000E+06 2.29028750000000E+06...(printout continues)...900 559.09248217187500000E+06 1.95738239953091324E+04 12751275PA054900 54

STATSGO data use information
3.42588714296875000E+07 3.51416440596391767E+04 12761278PA052900 528.92557403125000000E+06 1.46329345386831810E+04 12771279PA043900 43Example 10. ARC/INFO export file—Continued
1.79475905468750000E+06 5.62948103835544134E+03 12781280PA055900 553.25968743195953369E+07 6.36109159277651052E+04 12791281PA041900 411.28652600781250000E+06 5.12377500485368091E+03 12801283PA040900 401.01487028125000000E+06 5.43340858518251116E+03 12811284PA040900 403.09885935909710693E+09 1.19718178573947051E+06 12821137PA040900 403.34124028589425087E+07 5.53501553408423060E+04 12831272PA041900 411.08174580271874070E+07 2.55930252448080100E+04 12841282PA041900 41PENN.TIC XX 3 3 20 25IDTIC 4-1 14-1 5-1 50-1 -1 -1-11-XTIC 8-1 54-1 18 5 60-1 -1 -1-12-YTIC 8-1 134-1 18 5 60-1 -1 -1-13-
1 1.87087493353809579E+06 1.99237448876657616E+06 4 1.76813686135980324E+06 2.42821430020608567E+06
2 1.19691728670086781E+06 1.86317295168879256E+06 3 1.13118922952925996E+06 2.30610779476504587E+06 5 1.70344261104499944E+06 1.95476180387122929E+06 6 1.53525585357473581E+06 1.92068085182895791E+06 7 1.36638914909168426E+06 1.89014672669817694E+06 8 1.60989899314310472E+06 2.39266709529891144E+06 9 1.45094811933275824E+06 2.36045768006974086E+06 10 1.29135463742738101E+06 2.33160031969503872E+06 11 1.84516310240168893E+06 2.10145031038418133E+06

STATSGO data use information
12 1.68003183783905394E+06 2.06435454459725786E+06 13 1.51415650665920344E+06 2.03074197430951707E+06 14 1.34761057312261965E+06 2.00062748613852821E+06 15 1.18046779849178740E+06 1.97402441744185332E+06
16 1.81946363089675712E+06 2.21047369944842812E+06 17 1.65663231815013057E+06 2.17389460428783204E+06
Example 10. ARC/INFO export file—Continued
18 1.49306730216218880E+06 2.14075019060434680E+06 19 1.32884102398160798E+06 2.11105513767440896E+06 20 1.16402621752241836E+06 2.08482259709257912E+06 21 1.79378519370816555E+06 2.31940785584290326E+06 22 1.63325195032972936E+06 2.28334500842782203E+06
23 1.47199535860373732E+06 2.25066836817518249E+06 24 1.31008683720453177E+06 2.22139240718999412E+06 25 1.14759809353854344E+06 2.19553009145585541E+06
EOIEOS
Prelude tableVentureCom’s Prelude tables are simple ASCII text files. The first two lines of a table arecalled the header lines. The first line contains the names of each column, and the secondline contains at least one dash underneath each column name. Tabs separate the columnnames and the dashes. A newline character is at the end of each of these lines. Eachsubsequent line (row) is also delimited by a newline character and forms a record in thetable. A row consists of tab-separated fields (columns). Each row has the same number ofcolumns as the table header. If a column is empty, two consecutive tabs indicate that thecolumn is present.
ARC/INFO export
Attribute datadistribution
formats

STATSGO data use information
The INFO data file structures for the export files are in appendix A. The data baseschema for the export files are similar to the schema for the Prelude tables describedabove except for changes in the layer table. The texture, unified, and aashto elements inthe Prelude table contain multiple values, three in texture and four each in unified andaashto. These values from these three elements were split into texture1, texture2,texture3, aashto1, aashto2, aashto3, aashto4, unified1, unified2, unified3, and unified4elements in the INFO layer table to facilitate queries.The attribute information for the spatial data is provided in relational tables that aredownloaded from the Soil Interpretations Record data base. The Soil InterpretationsRecord data contain estimated and derived data on the physical and chemical soilproperties and soil interpretations for engineering, water management, recreation,agronomic, woodland, range, and wildlife uses of the soil.
The soil data elements are defined in appendix B, and the soil data codes are defined inappendix C. The column types, lengths, precision value, and low and high range valuesfor the soil data elements are listed in appendix D.
The Soil Interpretations Record data for STATSGO consist of the following tables:• codes (data base codes) stores information on all codes used in the data base• comp ( soil component) stores soil component information• compyld (component crop yield) stores crop yield information for soil
components• forest (forest understory) stores information for plant cover as forest understory for
soil components• interp (interpretation) stores interpretive ratings (both limitation ratings and
suitability ratings) for soil components• layer (soil layer) stores characteristics of soil layers for soil components• mapunit (map units) stores information that applies to all components of a soil
map unit• plantcom (plant composition) stores plant symbols and percent of plant
composition associated for soil components• plantnm (plant name) stores the common and scientific names for plants listed in
the data base• rsprod (range site production) stores range site productivity information for soil
components• taxclass (taxonomic classification) stores the taxonomic classification for soil
components• windbrk (windbreak) stores information on recommended windbreak species for
soil components• wlhabit (wildlife habitat) stores wildlife habitat information for soil components• woodland (woodland) stores information on common indicator trees for soil
components• woodmgt (woodland management) stores woodland management information on
Attribute (tabular)data

STATSGO data use information
Figure 3. STATSGO attribute relational data base schema
interp
stssaid muid
seqnum grpcode rating restct1 restct2 restct3
compyld
stssaid muid
seqnum
cropname nirryld irryld
forest
stssaid muid
seqnum
plantsym
plantcov
woodland
stssaid muid
seqnum
suitcode plantsym
sitind woodprod
woodmgt
stssaid muid
seqnum ordsym wderosn wdequip wdseed wdwind wdplant
plantcom stssaid muid
seqnum
plantsym plantpct
windbrk
stssaid muid
seqnum
plantsym
wndbrkht
wlhabit
stssaid muid
seqnum wlgrain wlgrass wlherb wlhard wlconif wlshrub wlwetplt wlshlwat wlopen wlwood wlwet wlrange
rsprod
stssaid muid
seqnum rsid rsname prodfav prodnorm produnfv
layer
stssaid muid
seqnum s5id layernum layerid laydepl laydeph texture kfact kffact tfact weg inch10l inch10h inch3l inch3h no4l no4h no10l no10h no40l no40h no200l no200h clayl clayh lll llh pil pih unified aashto aashind awcl awch bdl bdh oml omh phl phh salinl salinh sarl sarh cecl cech caco3l caco3h gypsuml gysumh perml permh shrinksw
comp
stssaid muid musym compname seqnum
s5id comppct slopel slopeh surftex otherph compkind compacre clascode
anflood anflodur anflobeg anfloend gsflood gsflodur gsflobeg gsfloend wtdepl wtdeph wtkind wtbeg wtend pnddepl pnddeph pnddur pndbeg pndend rockdepl rockdeph rockhard pandepl pandeph panhard subinitl subinith subtotl subtoth hydgrp frostact drainage hydric corcon corsteel clnirr clirr sclnirr sclirr primfml
Component Tables
Layer Table
taxclass
clascode
class order suborder grtgroup subgroup partsize minalogy reaction soiltemp otherfam
yldunits cropname yldunits
plantnm
plantsym sciname comname
Lookup Tables
mapunit
stssaid ssaid musym muid muname mukind mlra primfml muacres
Map Unit Table

STATSGO data use information
Data voids
soil components• yldunits (yield units) stores crop names and the units used to measure yield
The STATSGO attribute relational data base schema is shown in figure 3. The attributesthat link the data base tables are shown in bold italic. Appendix A contains all of the dataelements in the schema. However, not all elements are populated with data in the tables.

STATSGO data use information
Map hard copy production
Also, not all tables are relevant for all states.Attribute data for some data elements may be incomplete or missing for certain portionsof the United States. For example, data were not available for forest and rangeproductivity for some STATSGO map units on U.S. Department of Agriculture's ForestService lands in some Western States. In instances where data are unavailable, a maskshould be used to exclude the area from analysis.

STATSGO data use information
Maps that use NRCS STATSGO data must show the source and date. The maps shouldalso contain the following notation:
The soil information used for this map was Natural Resources ConservationService 199_ STATSGO data. STATSGO was compiled at 1:250,000 anddesigned to be used primarily for regional, multistate, State, and river basinresource planning, management and monitoring.
The user should be knowledgeable of soils data. If you need assistance, contact an NRCSsoil scientist for help. The following is a listing of NRCS State soil scientist addresses andtelephone numbers:
665 Opelika Rd.P.O. Box 311Auburn, AL 36830(205) 887-4540
949 East 36th AvenueAnchorage, AK 99508-4302(907) 271-2424
Federal Office Bldg.Rm. 5404700 West Capitol Ave.Little Rock, AR 72201(501) 324-5410
Suite 200201 E. Indianola Ave.Phoenix, AZ 85012(602) 280–8836
2121-C Second StreetDavis, CA 95616(916) 757-8203
655 Parfet Street, Rm. E200CLakewood, CO 80215-5517(303) 236-2910
16 Professional Park Rd.Storrs, CT 06268-1299(203) 487-4047
1203 College Park DriveDover, DE 19901-7377
User support
(302) 678-4179
Federal Bldg., Room 248401 S.E. 1st Ave.Gainesville, FL 32601(904) 377-1092
Federal Bldg., Box 13355 East Hancock Ave.Athens, GA 30601(506) 546-2278
Pacific Basin OfficeSuite 602, CGIC Bldg.414 W. Soledad Ave.Agana, Guam 96910(700) 550–7490
300 Ala Moana Blvd.Room 4316P. O. Box 50004Honolulu, HI 96850(808) 541-2602
3244 Elder StreetRoom 124Boise, ID 83705(208) 334-1348
1902 Fox DriveChampaign, IL 61820(217) 398-5286
6013 Lakeside Blvd.Indianapolis, IN 46278(317) 290-3203
693 Federal Bldg.210 Walnut StreetDes Moines, IA 50309(515) 284-4353
760 South Broadway
Salina, KS 67401(913) 823-4558
771 Corporate DriveLexington, KY 40503(606) 224-7358
3737 Government StreetAlexandria, LA 71302(318) 473-7757
451 West StreetAmherst, MA 01002(413) 253-4370
Busch’s Frontage RoadAnnapolis, MD 21401(410) 757-2872
5 Godfrey DriveOrono, ME 04473(207) 866-7245
Room 1011405 S. Harrison RoadEast Lansing, MI 48823-5202(517) 337-6680, Ext. 1205
375 Jackson St., Room 600St. Paul, MN 55101-1854(612) 290-3682
Federal Bldg, Suite 1321100 West Capitol StreetJackson, MS 39269(601) 965-4341
601 Business Loop 80 WestColumbia, MO 65203(314) 876-0907
Federal Bldg., Room 44310 East Babcock StreetBozeman, MT 59715-4704

STATSGO data use information
(406) 587-6818
4405 Bland Rd.Suite 205Raleigh, NC 27609(919) 790-2905
200 E. Rosser AvenueBismarck, ND 58502-1458(701) 250-4435
Federal Building, Room 152100 Centennial Mall NorthLincoln, NE 68508-3866(402) 437-5322
Federal BuildingDurham, NH 03824(603) 868-7581
1370 Hamilton StreetSomerset, NJ 08873(908) 246-4110, Ext. 170
517 Gold Avenue, SWRoom 3301Albuquerque, NM 87102(505) 766-3277
5301 Longley LaneReno, NV 89511(702) 784-5875
James M. Hanley Fed. Bldg.Room 171100 S. Clinton StreetSyracuse, NY 13260-7248(315) 423-5510
200 North High StreetColumbus, OH 43215(614) 469-6914
USDA AgriculturalCenter Bldg.Stillwater, OK 74074
(405) 624-4448
Federal Bldg, Room 16401220 S.W. Third AvenuePortland, OR 97204(503) 326-2794
One Credit Union PlaceSuite 340Harrisburg, PA 17710-2993(717) 782-3889
150 Carlos A. Chardon Ave.Hato Rey, PR 00918-7013(809) 766-5206
60 Quaker LaneWest Warwick, RI 02886(401) 828-1300
1835 Assembly StreetRoom 950Strom Thurmond Fed.l Bldg.Columbia, SC 29201(803) 253-3896
Federal Building200 4th Street S.W.Huron, SD 57350-2475(603) 353-1810
675 Estes Kefauver,Fed. Bldg.-USCH801 BroadwayNashville, TN 37203(615) 736-5476
W. R. Poage Federal Bldg.101 S. Main StreetTemple, TX 76501-7682(817) 774-1261
Wallace F. BennettFederal Bldg., Room 4402125 So. State StreetSalt Lake City, UT 84138
(801) 524-5064
Federal Building, Rm. 9201400 North 8th StreetRichmond, VA 23240-9999(804) 287-1646
69 Union StreetWinooski, VT 05404(802) 951-6795
Rock Pointe Tower IISuite 450W. 316 Boone AvenueSpokane, WA 99201-2348(509) 353-2339
6515 Watts Road, Suite 200Madison, WI 53719-2726(608) 264-5589
75 High Street, Room 301Morgantown, WV 26505

STATSGO data use information
(304) 291-4484
Federal Office Bldg.100 East B Street, Rm. 3124Casper, WY 82601(307) 261-5208
The State Soil Geographic (STATSGO) data base is archived and distributed from theNRCS National Cartography and GIS Center in Fort Worth, Texas. Information requestsmay be directed to the following address:
National Cartography and GIS CenterU.S. Department of AgricultureNatural Resources Conservation Service501 Felix Street, Building 23Fort Worth, TX 76115-3495
orP.O. Box 6567Fort Worth, TX 76115-0567
Phone (817) 334-5559FAX (817) 334-5469
Order requests are to be directed to:Phone (800) 672-5559FAX (817) 334-5469
The STATSGO spatial data are available in modified USGS Digital Line Graph (DLG-3)optional and ARC/INFO export file formats which are described in the section, Datastructure. The spatial data are also available in GRASS, Version 4.13 format and inARC/INFO, Version 7 coverages.
The STATSGO attribute data are available in ASCII table or ARC/INFO export formatsthat are described in the section, Data structure. The attribute data are also available inINFO table format when ordering ARC/INFO coverages.
The NRCS National Cartography and GIS Center operates a Geographic ResourceAnalysis Support System (GRASS) Geographic Information System (GIS) and an ARC/INFO GIS. GRASS. Other software formats may be made available by mutualagreement.
The STATSGO spatial and attribute data are distributed as one data set as a state-widecoverage. CD-ROMs have data for the 48 conterminous States, Hawaii, and Puerto Rico.
The distribution medium for STATSGO data is normally CD-ROM. However, data canalso be provided on 8mm or 1/4 cartridge tapes. Please call the National Cartographyand GIS Center for pricing and data format information.
Before ordering STATSGO data, the user needs to identify the State(s) of interest.Additional information and costs may be obtained from the National Cartography andGIS Center.
Distribution
Source
Format
OrderingInformation
Media

STATSGO data use information
References
The STATSGO data are periodically updated, data files are dated, and users areresponsible for obtaining the latest version.
[1] Bliss, N.B., and W.U. Reybold. 1989. Small-scale digital soil maps for interpretingnatural resources. J. Soil and Water Cons. Jan.-Feb., pp. 30-34.
[2] Elissal, A.A., and V.M. Caruso. 1983. Digital elevation models. Circ. 895-B. U.S.Geol. Surv., Reston, VA.
[3] U.S. Department of Agriculture. 1993. National Soil Survey Handbook,Title 430–VI. Soil Surv. Staff, Soil Conserv. Serv.,
[4] U.S. Department of Agriculture. 1993. Soil Survey Manual. Soil Surv. Staff, U.S.Dep. Agric. Handb. 18.
[5] U.S. Department of Agriculture. 1975. Soil Taxonomy: A basic system of soilclassification for making and interpreting soil surveys. Soil Conserv. Serv.,U.S. Dep. Agric. Handb. 436.
[6] U.S. Department of Agriculture. 1981. Land resource regions and major landresource areas of the United States. U.S. Dep. Agric. Handb. 296.
[7] U.S. Department of Agriculture and Iowa State University Statistical Laboratory.1987. Basic Statistics 1982 National Resources Inventory. Statistical BulletinNo. 756.
[8] U.S. Geological Survey. 1987. Digital line graphs from 1:2,000,000-scale maps.Data Users Guide 3. Reston, VA.

STATSGO data use information
Appendix A: INFO datafile structures
Appendix B: Definition of soil data elements
Appendix C: Definition of soil data codes
Appendix D: Value table
Appendixes

STATSGO data use information
Appendix A: INFO datafile structures
DATAFILE NAME: COMP (292) 8/14/1991 53 ITEMS: STARTING IN POSITION 1COL ITEM NAME WDTH OPUT TYP N.DEC ALTERNATE NAME1 STSSAID 5 5 C -6 MUID 7 7 C -13 SEQNUM 2 2 I -15 MUSYM 5 5 C -20 COMPNAME 30 30 C -50 S5ID 6 6 C -56 COMPPCT 3 3 I -59 SLOPEL 2 2 I -61 SLOPEH 2 2 I -63 SURFTEX 8 8 C -71 OTHERPH 40 40 C -111 COMPKIND 1 1 C -112 COMPACRE 6 6 I -118 CLASCODE 20 20 C -138 ANFLOOD 5 5 C -143 ANFLODUR 12 12 C -155 ANFLOBEG 3 3 C -158 ANFLOEND 3 3 C -161 GSFLOOD 5 5 C -166 GSFLODUR 12 12 C -178 GSFLOBEG 3 3 C -181 GSFLOEND 3 3 C -184 WTDEPL 4 4 N 1188 WTDEPH 4 4 N 1192 WTKIND 5 5 C -197 WTBEG 3 3 C -200 WTEND 3 3 C -203 PNDDEPL 4 4 N 1207 PNDDEPH 4 4 N 1211 PNDDUR 10 10 C -217 PNDBEG 3 3 C -220 PNDEND 3 3 C -223 ROCKDEPL 2 2 I -225 ROCKDEPH 2 2 I -227 ROCKHARD 4 4 C -231 PANDEPL 2 2 I -233 PANDEPH 2 2 I -235 PANHARD 5 5 C -240 SUBINITL 2 2 I -242 SUBINITH 2 2 I -244 SUBTOTL 2 2 I -246 SUBTOTH 2 2 I -248 HYDGRP 3 3 C -251 FROSTACT 8 8 C -259 DRAINAGE 5 5 C -264 HYDRIC 1 1 C -265 CORCON 8 8 C -273 CORSTEEL 8 8 C -

STATSGO data use information
281 CLNIRR 1 1 C -282 CLIRR 1 1 C -283 SCLNIRR 2 2 C -285 SCLIRR 2 2 C -287 PRIMFML 2 2 C -
DATAFILE NAME: COMPYLD (60) 8/14/1991 6 ITEMS: STARTING IN POSITION 1COL ITEM NAME WDTH OPUT TYP N.DEC ALTERNATE NAME1 STSSAID 5 5 C -6 MUID 7 7 C -13 SEQNUM 2 2 I -15 CROPNAME 30 30 C -45 NIRRYLD 8 8 N 153 IRRYLD 8 8 N 1
DATAFILE NAME: FOREST (24) 8/14/1991 5 ITEMS: STARTING IN POSITION 1COL ITEM NAME WDTH OPUT TYP N.DEC ALTERNATE NAME1 STSSAID 5 5 C -6 MUID 7 7 C -13 SEQNUM 2 2 I -15 PLANTSYM 7 7 C -22 PLANTCOV 3 3 I -
DATAFILE NAME: INTERP (24) 8/14/1991 8 ITEMS: STARTING IN POSITION 1COL ITEM NAME WDTH OPUT TYP N.DEC ALTERNATE NAME1 SSTSSAID 5 5 C -6 MUID 7 7 C -13 SEQNUM 2 2 I -15 GRPCODE 2 2 C -17 RATING 2 2 C -19 RESTCT1 2 2 C -21 RESTCT2 2 2 C -23 RESTCT3 2 2 C -
DATAFILE NAME: LAYER (240) 12/14/1991 63 ITEMS: STARTING IN POSITION 1COL ITEM NAME WDTH OPUT TYP N.DEC ALTERNATE NAME1 STSSAID 5 5 C -6 MUID 7 7 C -13 SEQNUM 2 2 I -15 S5ID 6 6 C -21 LAYERNUM 1 1 I -22 LAYERID 2 2 I -24 LAYDEPL 2 2 I -26 LAYDEPH 2 2 I -28 TEXTURE1 8 8 C -36 TEXTURE2 8 8 C -44 TEXTURE3 8 8 C -52 KFACT 4 4 N 256 KFFACT 4 4 N 2

STATSGO data use information
60 TFACT 3 3 C -63 WEG 2 2 C -65 INCH10L 2 2 I -67 INCH10H 2 2 I -69 INCH3L 2 2 I -71 INCH3H 2 2 I -73 NO4L 3 3 I -76 NO4H 3 3 I -79 NO10L 3 3 I -82 NO10H 3 3 I -85 NO40L 3 3 I -88 NO40H 3 3 I -91 NO200L 3 3 I -93 NO200H 3 3 I -96 CLAYL 2 2 I -98 CLAYH 2 2 I -100 LLL 3 3 I -103 LLH 3 3 I -106 PIL 3 3 I -109 PIH 3 3 I -112 UNIFIED1 5 5 C -117 UNIFIED2 5 5 C -122 UNIFIED3 5 5 C -127 UNIFIED4 5 5 C -132 AASHTO1 5 5 C -137 AASHTO2 5 5 C -142 AASHTO3 5 5 C -147 AASHTO4 5 5 C -152 AASHIND 4 4 N 1156 AWCL 4 4 N 2160 AWCH 4 4 N 2164 BDL 4 4 N 2168 BDH 4 4 N 2172 OML 4 4 N 1176 OMH 4 4 N 1180 PHL 4 4 N 1184 PHH 4 4 N 1188 SALINL 2 2 I -190 SALINH 2 2 I -192 SARL 5 5 N 1196 SARH 5 5 N 1200 CECL 5 5 N 1204 CECH 5 5 N 1209 CACO3L 2 2 I -211 CACO3H 2 2 I -213 GYPSUML 2 2 I -215 GYPSUMH 2 2 I -217 PERML 5 5 N 2222 PERMH 5 5 N 2227 SHRINKSW 10 10 C -
DATAFILE NAME: MAPUNIT (142) 8/14/1991 9 ITEMS: STARTING IN POSITION 1COL ITEM NAME WDTH OPUT TYP N.DEC ALTERNATE NAME1 STSSAID 5 5 C -6 SSAID 3 3 C -

STATSGO data use information
9 MUSYM 5 5 C -14 MUID 7 7 C -21 MUNAME 109 109 C -130 MUKIND 1 1 C -131 MLRA 4 4 C -135 PRIMFML 2 2 C -137 MUACRES 6 6 I -
DATAFILE NAME: PLANTCOM (24) 8/14/1991 5 ITEMS: STARTING IN POSITION 1COL ITEM NAME WDTH OPUT TYP N.DEC ALTERNATE NAME1 STSSAID 5 5 C -6 MUID 7 7 C -13 SEQNUM 2 2 I -15 PLANTSYM 7 7 C -22 PLANTPCT 3 3 C -
DATAFILE NAME: PLANTNM (98) 8/14/1991 3 ITEMS: STARTING IN POSITION 1COL ITEM NAME WDTH OPUT TYP N.DEC ALTERNATE NAME1 PLANTSYM 7 7 C -8 SCINAME 60 60 C -68 COMNAME 31 31 C -
DATAFILE NAME: RSPROD (88) 8/14/1991 8 ITEMS: STARTING IN POSITION 1COL ITEM NAME WDTH OPUT TYP N.DEC ALTERNATE NAME1 STSSAID 5 5 C -6 MUID 7 7 C -13 SEQNUM 2 2 I -15 RSID 8 8 C -23 RSNAME 51 51 C -74 PRODFAV 5 5 I -79 PRODNORM 5 5 I -84 PRODUNFV 5 5 I -
DATAFILE NAME: TAXCLASS (164) 8/14/1991 11 ITEMS: STARTING IN POSITION 1COL ITEM NAME WDTH OPUT TYP N.DEC ALTERNATE NAME1 CLASCODE 20 20 C -21 CLASS 120 120 C -141 ORDER 1 1 C -142 SUBORDER 3 3 C -145 GRTGROUP 5 5 C -150 SUBGROUP 4 4 C -154 PARTSIZE 3 3 C -157 MINALOGY 2 2 C -159 REACTION 2 2 C -161 SOILTEMP 2 2 C -163 OTHERFAM 2 2 C -

STATSGO data use information
DATAFILE NAME: WINDBRK (24) 8/14/1991 5 ITEMS: STARTING IN POSITION 1COL ITEM NAME WDTH OPUT TYP N.DEC ALTERNATE NAME1 STSSAID 5 5 C -6 MUID 7 7 C -13 SEQNUM 2 2 I -15 PLANTSYM 7 7 C -22 WNDBRKHT 3 3 I -
DATAFILE NAME: WLHABIT (122) 8/14/1991 15 ITEMS: STARTING IN POSITION 1COL ITEM NAME WDTH OPUT TYP N.DEC ALTERNATE NAME1 STSSAID 5 5 C -6 MUID 7 7 C -13 SEQNUM 2 2 I -15 WLGRAIN 9 9 C -24 WLGRASS 9 9 C -33 WLHERB 9 9 C -42 WLHARD 9 9 C -51 WLCONIF 9 9 C -60 WLSHRUB 9 9 C -69 WLWETPLT 9 9 C -78 WLSHLWAT 9 9 C -87 WLOPEN 9 9 C -96 WLWOOD 9 9 C -105 WLWET 9 9 C -114 RLRANGE 9 9 C -
DATAFILE NAME: WOODLAND (28) 8/14/1991 7 ITEMS: STARTING IN POSITION 1COL ITEM NAME WDTH OPUT TYP N.DEC ALTERNATE NAME1 STSSAID 5 5 C -6 MUID 7 7 C -13 SEQNUM 2 2 I -15 SUITCODE 2 2 C -17 PLANTSYM 7 7 C -24 SITIND 3 3 I -27 WOODPROD 2 2 I -
DATAFILE NAME: WOODMGT (58) 8/14/1991 9 ITEMS: STARTING IN POSITION 1COL ITEM NAME WDTH OPUT TYP N.DEC ALTERNATE NAME1 STSSAID 5 5 C -6 MUID 7 7 C -13 SEQNUM 2 2 I -15 ORDSYM 3 3 C -18 WDEROSN 8 8 C -26 WDEQUIP 8 8 C -34 WDSEED 8 8 C -42 WDWIND 8 8 C -50 WDPLANT 9 9 C -

STATSGO data use information
DATAFILE NAME: YLDUNITS 40) 8/14/1991 2 ITEMS: STARTING IN POSITION 1COL ITEM NAME WDTH OPUT TYP N.DEC ALTERNATE NAME1 CROPNAME 31 31 C -32 YLDUNITS 9 9 C -

STATSGO data use information

STATSGO data use information
Appendix B: Definition of soil data elements
Element Tables Long name Description––––––– –––––– –––––––––––––––––––– –––––––––––––––––––––––––––––––––––––––––––––––aashind layer AASHTO Group Index AASHTO (American Assoc. of State Highway
and Transportation Officials) group index. Amodification to AASHTO group classificationof a soil.
aashto layer AASHTO Group AASHTO (American Assoc. of State HighwayClassification and Transportation Officials) group
classification. A code for AASHTO groupclassification for a soil.
anflobeg comp Annual Flooding Month Month in which annual flooding (floodingBegin likely to occur during the year) begins in a
normal year.
anflodur comp Flood Duration Class The duration of annual flooding in a normal year.
anfloend comp Annual Flooding Month Month in which annual flooding (floodingEnd likely to occur during the year) ends in a
normal year.
anflood comp Annual Flooding Frequency Descriptive term used to describe the frequencyof annual flooding (flooding likely to occur during theyear) that is likely to occur. Frequent (FREQ) - > 50%chance of flooding; Occasional (OCCAS) - 5-50%chance of flooding; Rare (RARE) - 0-5% chance offlooding.
awch layer Available Water Capacity Maximum value for the range of availablewater capacity for the soil layer or horizon,expressed as inches/inch.
awcl layer Available Water Capacity Minimum value for the range of availablewater capacity for the soil layer or horizon,expressed as inches/inch.
bdh layer Bulk Density Maximum value for the range in moist bulkdensity of the soil layer or horizon, expressedas grams per cubic centimeter.
bd llayer Bulk Density Minimum value for the range in moist bulkdensity of the soil layer or horizon, expressedas grams per cubic centimeter.
caco3h layer Carbonate as CaCO3 Maximum value for the range of calciumcarbonate (CaCO3) in the soil layer orhorizon, expressed as a percent.

STATSGO data use information
Element Tables Long name Description––––––– –––––– –––––––––––––––––––– –––––––––––––––––––––––––––––––––––––––––––––––caco3l layer Carbonate as CaCO3 Minimum value for the range of calcium
carbonate (CaCO3) in the soil layer orhorizon, expressed as a percent.
cech layer Cation Exchange Capacity Maximum value for the range in cationexchange capacity for the soil layer or horizon.
cecl layer Cation Exchange Capacity Minimum value for the range in cationexchange capacity for the soil layer or horizon.
clascode comp Taxonomic Classification Code for the taxonomic classification for thetaxclass code soil. Definition of codes are in the taxclass table.
class taxclass Taxonomic Classification The taxonomic classification (name) of the soil.
clayh layer Clay Maximum value for the range in clay contentof the soil layer or horizon, expressed as apercentage of the material less than 2 mm in size.
clayl layer Clay Minimum value for the range in clay contentof the soil layer or horizon, expressed as apercentage of the material less than 2 mm in size.
clirr comp Irrigated Capability Class Irrigated Capability Class. A rating of thesoil for irrigated agricultural use. Thenumber indicates progressively greaterlimitations and narrower choices for use.
clnirr comp Nonirrigated Capability Class A rating of the soil for nonirrigated agricultural use.The number indicates progressively greaterlimitations and narrower choices for use.
code codes Data base code A listing of codes used in the specified data base.
codedesc codes Code Description or Narrative description or explanation ofMeaning codes used in the data base.
codename codes Code Name The long name (unabbreviated) for the code.
col element Column Name Column name used in data base.tbleltvalrange
comname plantnm Plant Common Name The common name for the plant most widelyused by the state.
compacre comp Component Acres The acreage of the component of a soilmap unit. Component acres are normalized to 100percent to exclude inclusions. The sum of all thecomponent acres for a map unit will equal 100percent.
compkind comp Kind of Component Code identifying the kind of component of themap unit. Example: Series (S); Family (F);Variant (V); Taxadjunct (T); Taxon abovefamily (G); Miscellaneous area (M).

STATSGO data use information
Element Tables Long name Description––––––– –––––– –––––––––––––––––––– –––––––––––––––––––––––––––––––––––––––––––––––compname comp Component Name The name of the component (series, taxonomic
unit or miscellaneous area) of the map unit.
comppct comp Component Percent The percentage of the component of the map unit.
corcon comp Corrosion - Concrete An interpretation rating of the susceptibility ofconcrete to corrosion when in contact with the soil.
corsteel comp Corrosion - Uncoated Steel An interpretation rating of the susceptibilityof uncoated steel to corrosion when in contactwith the soil.
cropname compyld Crop Name The common name for the crop for which ayldunits yield is given.
domid codes Domain ID A code identifying the domain for the dataelement element. Domain contains the broad
definition and codes used for all dataelements within its domain.
drainage comp Soil Drainage Class Code identifying the natural drainage condition of thesoil and refers to the frequency and duration of periodswhen the soil is free of saturation. Example: WellDrained (W); Excessive (E); Moderately Well (MW);Poorly (P); Somewhat Excessively (SE); SomewhatPoorly (SP).
eldesc element Element Description The characteristics or properties that define ordescribe an element.
ellable element Element Label - long name The long name assigned to an element.
frostact comp Potential Frost Action An interpretation rating of the susceptibilityof the soil to frost heaving.
grpcode interp Interpretative Group Code Code identifying the interpretative group orcategory for the interpretation specified.Examples of interpretative groups are septictank absorption fields and shallow excavations.
grtgroup taxclass Great Group Code for the taxonomic GREAT GROUP category.
gsflobeg comp Growing Season Flooding Month in which growing season (season forBegins common field crops in the area) flooding
begins in a normal year.
gsflodur comp Growing Season The duration of flooding during the growingDuration season (season for common field crops in the area).
gsfloend comp Growing Season Flooding Month in which growing season (season forEnds common field crops in the area) flooding ends in a
normal year.
gsflood comp Growing Season Flooding Descriptive term describing the frequency ofFrequency flooding during the growing season (season for the
common field crops in the area). Frequent (FREQ);Occasional (OCCAS); Rare (RARE).

STATSGO data use information
Element Tables Long name Description––––––– –––––– –––––––––––––––––––– –––––––––––––––––––––––––––––––––––––––––––––––gypsumh layer Gypsum Maximum value for the range in sulfates
reported as gypsum (CaSO4) in the soil layeror horizon, expressed as a percent.
gypsuml layer Gypsum Minimum value for the range in sulfatesreported as gypsum (CaSO4) in the soil layeror horizon, expressed as a percent.
hydgrp comp Hydrologic Group The hydrologic group for the soil. Example:A, A/D.
hydric comp Hydric Soil Rating The symbol (Y/N) identifying hydric soils.
inch10h layer Weight Percent Greater The maximum value for the range in percentthan 10 inches by weight of the rock fragments greater than
10 inches size in the soil layer or horizon.
inch10l layer Weight Percent Greater The minimum value for the range in percentthan 10 inches by weight of the rock fragments greater than
10 inches size in the soil layer or horizon.
inch3h layer Weight Percent 3 to 10 The maximum value for the range in percentinches by weight of the rock fragments 3 to 10
inches size in the soil layer or horizon.
inch3l layer Weight Percent 3 to 10 The minimum value for the range in percentinches by weight of the rock fragments 3 to 10
inches size in the soil layer or horizon.
irryld compyld Irrigated Crop Yield The expected yield of the specific crop withirrigation. Defined as the yield expected inan average year under a high level of management.
kfact layer Soil Erodibility Factor, An erodibility factor which is adjusted for theincludes rock fragments effect of rock fragments.
kffact layer Soil Erodibility Factor, An erodibility factor which quantifies therock fragments free susceptibility of soil particles to detachment
and movement by water. This factor is usedin the Universal Soil Loss Equation tocalculate soil loss by water.
laydeph layer Layer Depth The depth to the lower boundary of the soillayer or horizon, expressed in inches.
laydepl layer Layer Depth Depth to the upper boundary of the soillayer or horizon, expressed in inches.
layerid layer Layer Identification A convention to identify the original layers on theNumber SOI-5 record. Example: layerid 11 for the first
surface of a multisurface record, 12 for the secondsurface layer, 2 thru 9 for subsurface layers.
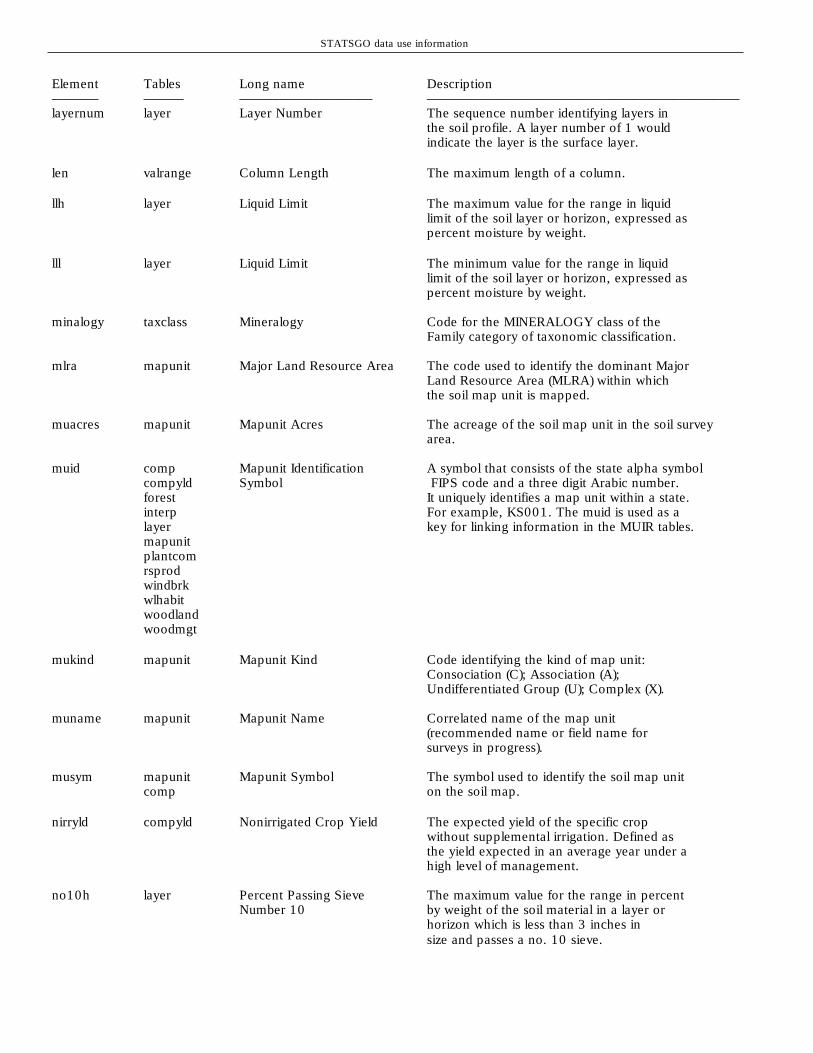
STATSGO data use information
Element Tables Long name Description––––––– –––––– –––––––––––––––––––– –––––––––––––––––––––––––––––––––––––––––––––––layernum layer Layer Number The sequence number identifying layers in
the soil profile. A layer number of 1 wouldindicate the layer is the surface layer.
len valrange Column Length The maximum length of a column.
llh layer Liquid Limit The maximum value for the range in liquidlimit of the soil layer or horizon, expressed aspercent moisture by weight.
lll layer Liquid Limit The minimum value for the range in liquidlimit of the soil layer or horizon, expressed aspercent moisture by weight.
minalogy taxclass Mineralogy Code for the MINERALOGY class of theFamily category of taxonomic classification.
mlra mapunit Major Land Resource Area The code used to identify the dominant MajorLand Resource Area (MLRA) within whichthe soil map unit is mapped.
muacres mapunit Mapunit Acres The acreage of the soil map unit in the soil surveyarea.
muid comp Mapunit Identification A symbol that consists of the state alpha symbolcompyld Symbol FIPS code and a three digit Arabic number.forest It uniquely identifies a map unit within a state.interp For example, KS001. The muid is used as alayer key for linking information in the MUIR tables.mapunitplantcomrsprodwindbrkwlhabitwoodlandwoodmgt
mukind mapunit Mapunit Kind Code identifying the kind of map unit:Consociation (C); Association (A);Undifferentiated Group (U); Complex (X).
muname mapunit Mapunit Name Correlated name of the map unit(recommended name or field name forsurveys in progress).
musym mapunit Mapunit Symbol The symbol used to identify the soil map unitcomp on the soil map.
nirryld compyld Nonirrigated Crop Yield The expected yield of the specific cropwithout supplemental irrigation. Defined asthe yield expected in an average year under ahigh level of management.
no10h layer Percent Passing Sieve The maximum value for the range in percentNumber 10 by weight of the soil material in a layer or
horizon which is less than 3 inches insize and passes a no. 10 sieve.

STATSGO data use information
Element Tables Long name Description
––––––– –––––– –––––––––––––––––––– –––––––––––––––––––––––––––––––––––––––––––––––
no10l layer Percent Passing Sieve The minimum value for the range in percent
Number 10 by weight of the soil material in a layer or horizon
which is less than three inches in size and passes a no.
10 sieve.
no200h layer Percent Passing Sieve The maximum value for the range in percent
Number 200 by weight of the soil material in a layer or
horizon which is less than 3 inches in
size and passes a no. 200 sieve.
no200l layer Percent Passing Sieve The minimum value for the range in percent
Number 200 by weight of the soil material in a layer or
horizon which is less than 3 inches in
size and passes a no. 200 sieve.
no40h layer Percent Passing Sieve The maximum value for the range in percent
Number 40 by weight of the soil material in a layer or
horizon which is less than 3 inches in
size and passes a no. 40 sieve.
no40l layer Percent Passing Sieve The minimum value for the range in percent
Number 40 by weight of the soil material in a layer or
horizon which is less than 3 inches in
size and passes a no. 40 sieve.
no4h layer Percent Passing Sieve The maximum value for the range in percent
Number 4 by weight of the soil material in a layer or
horizon which is less than 3 inches in
size and passes a no. 4 sieve.
no4l layer Percent Passing Sieve The minimum value for the range in percent
Number 4 by weight of the soil material in a layer or
horizon which is less than 3 inches in
size and passes a no. 4 sieve.
omh layer Organic Matter The maximum value for the range in organic
matter content of the soil layer or horizon,
expressed in percent by weight.
oml layer Organic Matter The minimum value for the range in organic
matter content of the soil layer or horizon,
expressed in percent by weight.
order taxclass Order Code for the taxonomic ORDER category of
the record.

STATSGO data use information
Element Tables Long name Description
––––––– –––––– –––––––––––––––––––– –––––––––––––––––––––––––––––––––––––––––––––––
ordsym woodmgt Ordination Symbol The ordination symbol is the class and subclass part of
the woodland suitability group. The first element in
ordination symbol is the productivity class. This is a
number that denotes potential productivity in cubicmeters of wood per hectare per year for an indicatortree (1 m3/ha is equal to 14.3 ft3/ac.). The secondpart of the ordination is the subclass, a capital lettersymbol which indicates certain soil or physiographiccharacteristics that contribute to important hazards orlimitations in management. Example: W - Excessivewetness. Subclasses are listed in ranked order.
otherfam taxclass Other Family This field consists of OTHER FAMILY codesfor soil depth class, slope class, consistenceclass, classes of coatings and classes of cracksof the Family category of taxonomicclassification.
otherph comp Class-Determining Phase Class-determining phase criteria, other thanCriteria slope and texture, recorded on the SOI-6 and
used to select appropriate interpretation andrating from the SOI-5 Record.
pandeph comp Depth to Cemented Pan Maximum value for the range in depth to theupper boundary of a cemented pan, expressedin inches.
pandepl comp Depth to Cemented Pan Minimum value for the range in depth to theupper boundary of a cemented pan, expressedin inches.
panhard comp Cemented Pan Thickness The degree of induration and thickness of thecemented pan. A pan is rated as “THICK” ifit is more than 3 inches thick and continuallyindurated or more than 18 inches thick anddiscontinuous or fractured. Pans not meetingthese criteria are rated THIN.
partsize taxclass Particle Size Code for the PARTICLE-SIZE class of theFamily category of taxonomic classification.
permh layer Permeability Rate The maximum value for the range inpermeability rate for the soil layer or horizon,expressed as inches/hour.
perml layer Permeability Rate The minimum value for the range inpermeability rate for the soil layer or horizon,expressed as inches/hour.
phh layer Soil Reaction (pH) The maximum value for the range in soilreaction (pH) for the soil layer or horizon.
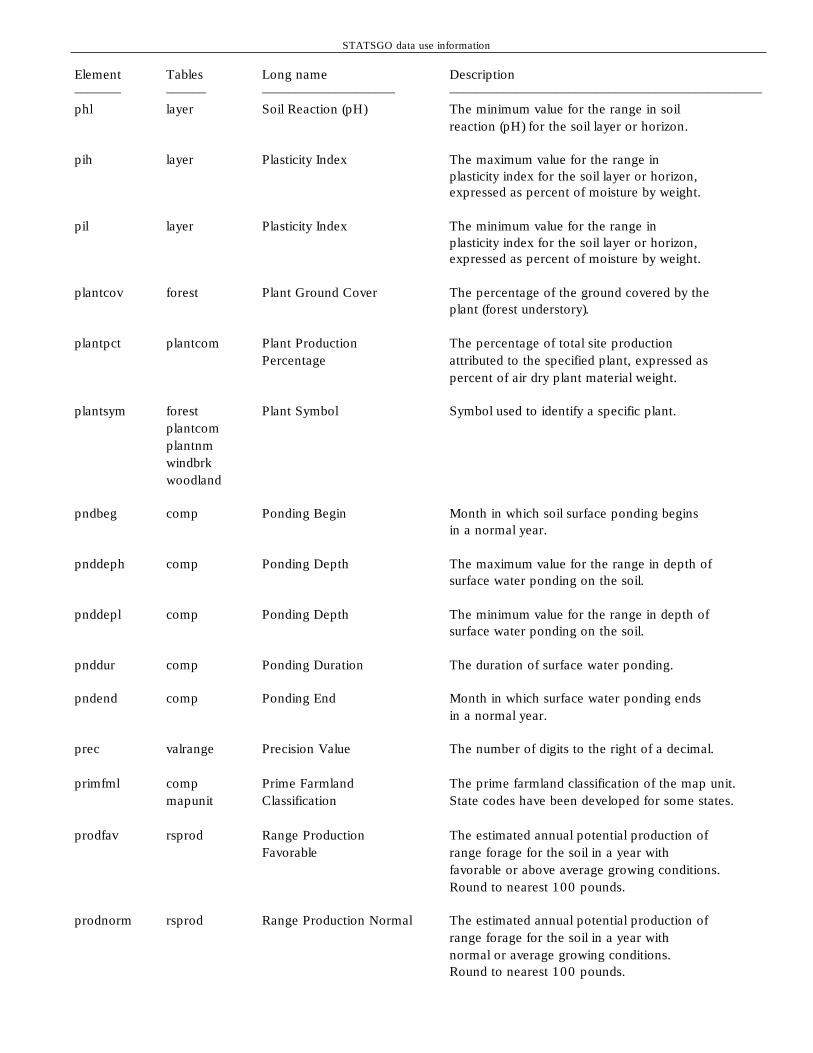
STATSGO data use information
Element Tables Long name Description––––––– –––––– –––––––––––––––––––– –––––––––––––––––––––––––––––––––––––––––––––––phl layer Soil Reaction (pH) The minimum value for the range in soil
reaction (pH) for the soil layer or horizon.
pih layer Plasticity Index The maximum value for the range inplasticity index for the soil layer or horizon,expressed as percent of moisture by weight.
pil layer Plasticity Index The minimum value for the range inplasticity index for the soil layer or horizon,expressed as percent of moisture by weight.
plantcov forest Plant Ground Cover The percentage of the ground covered by theplant (forest understory).
plantpct plantcom Plant Production The percentage of total site productionPercentage attributed to the specified plant, expressed as
percent of air dry plant material weight.
plantsym forest Plant Symbol Symbol used to identify a specific plant.plantcomplantnmwindbrkwoodland
pndbeg comp Ponding Begin Month in which soil surface ponding beginsin a normal year.
pnddeph comp Ponding Depth The maximum value for the range in depth ofsurface water ponding on the soil.
pnddepl comp Ponding Depth The minimum value for the range in depth ofsurface water ponding on the soil.
pnddur comp Ponding Duration The duration of surface water ponding.
pndend comp Ponding End Month in which surface water ponding endsin a normal year.
prec valrange Precision Value The number of digits to the right of a decimal.
primfml comp Prime Farmland The prime farmland classification of the map unit.mapunit Classification State codes have been developed for some states.
prodfav rsprod Range Production The estimated annual potential production ofFavorable range forage for the soil in a year with
favorable or above average growing conditions.Round to nearest 100 pounds.
prodnorm rsprod Range Production Normal The estimated annual potential production ofrange forage for the soil in a year withnormal or average growing conditions.Round to nearest 100 pounds.

STATSGO data use information
Element Tables Long name Description––––––– –––––– –––––––––––––––––––– –––––––––––––––––––––––––––––––––––––––––––––––produnfv rsprod Range Production The estimated annual potential production of
Unfavorable range forage for the soil in a year withunfavorable or below average growingconditions. Round to nearest 100 pounds.
rangeh valrange High Range The maximum value for the range in values of anelement.
rangel valrange Low Range The minimum value for the range in values of anelement.
rating interp Soil Interpretative Rating Rating of soil for specified use. Suitabilityratings are good, fair, and poor. Limitationratings are slight, moderate, and severe.
reaction taxclass Reaction Code for the REACTION class of the Familycategory of taxonomic classification.
restct1 interp Rating Limitation Restrictive feature code, 1st.Restrictions
restct2 interp Rating Limitation Restrictive feature code, 2nd.Restrictions
restct3 interp Rating Limitation Restrictive feature code, 3rd.Restrictions
rockdeph comp Depth to Bedrock The maximum value for the range in depth tobedrock, expressed in inches.
rockdepl comp Depth to Bedrock The minimum value for the range in depth tobedrock, expressed in inches.
rockhard comp bedrock hardness The degree of hardness of the underlyingrock. Rated as: HARD - Excavation requiresblasting or special equipment or SOFT -Excavation can be made with trenching machines,backhoes, or small rippers.
rsid rsprod Range Site Identification Code used to identify the NRCS range site.
rsname rsprod Range Site Name Name for the NRCS range site.
s5id comp Soil Interpretations Record The Soil Interpretations Record (SOI-5)layer Number identification number assigned to the
particular SOI-5. Example: CO0034.
salinh layer Salinity The maximum value for the range in soilsalinity of the soil layer or horizon measuredas electrical conductivity of the soil in asaturated paste. Values are expressed in mmhos/cm.
salinl layer Salinity The minimum value for the range in soilsalinity of the soil layer or horizon measuredas electrical conductivity of the soil in asaturated paste. Values are expressed in mmhos/cm.
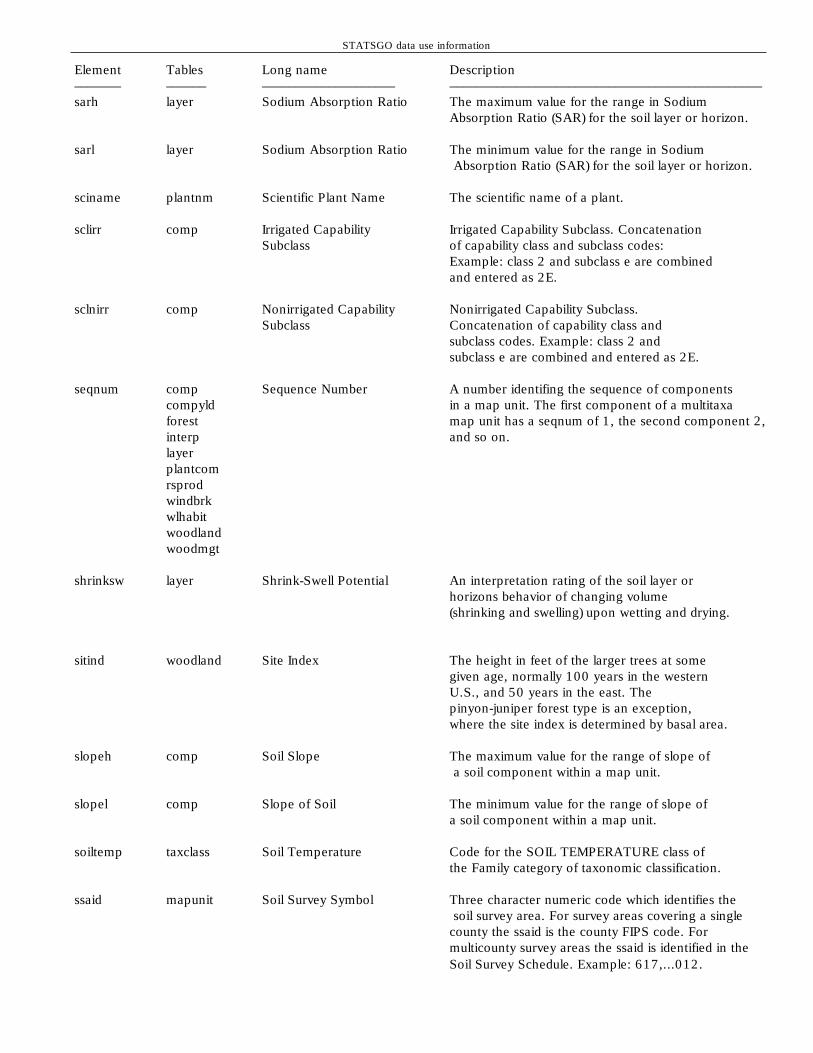
STATSGO data use information
Element Tables Long name Description––––––– –––––– –––––––––––––––––––– –––––––––––––––––––––––––––––––––––––––––––––––sarh layer Sodium Absorption Ratio The maximum value for the range in Sodium
Absorption Ratio (SAR) for the soil layer or horizon.
sarl layer Sodium Absorption Ratio The minimum value for the range in SodiumAbsorption Ratio (SAR) for the soil layer or horizon.
sciname plantnm Scientific Plant Name The scientific name of a plant.
sclirr comp Irrigated Capability Irrigated Capability Subclass. ConcatenationSubclass of capability class and subclass codes:
Example: class 2 and subclass e are combinedand entered as 2E.
sclnirr comp Nonirrigated Capability Nonirrigated Capability Subclass.Subclass Concatenation of capability class and
subclass codes. Example: class 2 andsubclass e are combined and entered as 2E.
seqnum comp Sequence Number A number identifing the sequence of componentscompyld in a map unit. The first component of a multitaxaforest map unit has a seqnum of 1, the second component 2,interp and so on.layerplantcomrsprodwindbrkwlhabitwoodlandwoodmgt
shrinksw layer Shrink-Swell Potential An interpretation rating of the soil layer orhorizons behavior of changing volume(shrinking and swelling) upon wetting and drying.
sitind woodland Site Index The height in feet of the larger trees at somegiven age, normally 100 years in the westernU.S., and 50 years in the east. Thepinyon-juniper forest type is an exception,where the site index is determined by basal area.
slopeh comp Soil Slope The maximum value for the range of slope ofa soil component within a map unit.
slopel comp Slope of Soil The minimum value for the range of slope ofa soil component within a map unit.
soiltemp taxclass Soil Temperature Code for the SOIL TEMPERATURE class ofthe Family category of taxonomic classification.
ssaid mapunit Soil Survey Symbol Three character numeric code which identifies the soil survey area. For survey areas covering a singlecounty the ssaid is the county FIPS code. Formulticounty survey areas the ssaid is identified in theSoil Survey Schedule. Example: 617,...012.

STATSGO data use information
Element Tables Long name Description––––––– –––––– –––––––––––––––––––– –––––––––––––––––––––––––––––––––––––––––––––––stssaid comp State Soil Survey Area ID A concatenation of FIPS alpha code for a
compyld state and the soil survey area symbol (ssaid).forest Example: CO017.interplayermapunitplantcomrsprodwindbrkwlhabitwoodlandwoodmgt
subgroup taxclass Subgroup Code for the taxonomic SUBGROUP categoryof the record.
subinith comp Initial Subsidence Maximum value for the range in initialsubsidence that can be expected whendrained, expressed in inches (organic soils only).
subinitl comp Initial Subsidence Minimum value for the range in initial subsidence thatcan be expected when drained, expressed in inches(organic soils only).
suborder taxclass Suborder Code for the taxonomic SUBORDER categoryof the record.
subtoth comp Total Subsidence Maximum value for the range in total subsidence thatcan be expected when drained, expressed in inches(organic soils only).
subtotl comp Total Subsidence Minimum value for the range in total subsidence thatcan be expected when drained, expressed in inches(organic soils only).
suitcode woodland Woodland Tree Suitability Code indicating if the tree is common to the site;Existing (E), or a tree which could be planted as a treecrop; Potential (P). Trees which are both existing andhave a potential for planting are giving a dual code(EP).
surftex comp Surface Soil Texture Code for the USDA texture for the surface layer orhorizon. Example: Loam (L); Sandy loam (SL). Alsoincludes terms used to modify texture and terms usedin lieu of texture.
table table Table Name Data dictionary - Identifies the short nameelement used to identify the table in the data base.tbleltvalrange
texture layer Soil Texture Class Code for the USDA texture for the specifiedlayer or horizon of the soil. Example: SandyLoam (SL); Loam (L). Also includes terms used tomodify texture and terms used in lieu of texture.

STATSGO data use information
Element Tables Long name Description––––––– –––––– –––––––––––––––––––– –––––––––––––––––––––––––––––––––––––––––––––––tfact layer T Factor Soil loss tolerance factor. The maximum rate
of soil erosion that will permit a high level ofcrop production.
unified layer Unified Soil Classification The Unified soil classification. Anengineering classification of soils.
wdequip woodmgt Woodland Equipment Woodland limitation rating for the use ofequipment, year round or seasonal.
wderosn woodmgt Woodland Erosion Woodland limitation rating identifying theprobability that damage may occur as aresult of site preparation and followingcutting operations where soil is exposed.
wdplant woodmgt Woodland Plant Woodland limitation rating for the likelihoodCompetition of the invasion or growth of undesirable
species when openings are made in the canopy.
wdseed woodmgt Woodland Seeding Woodland limitation rating identifying theMortality probability of death of naturally occurring or
planted tree seedlings as influenced by kindsof soil or topographic conditions.
wdwind woodmgt Woodland Windthrow Woodland limitation rating identifying theHazard windthrow hazard. Windthrow is the
likelihood of trees being uprooted by wind asa result of insufficient depth of the soil togive adequate root anchorage.
weg layer Wind Erodibility Group The wind erodibility group (weg) assigned tothe soil layer or horizon.
wei layer Wind erodibility index The wind erodibility index assigned to thesoil layer or horizon.
wlconif wlhabit Wildlife Habitat Element Suitability of the soil to produce the wildlife(coniferous trees) habitat element coniferous trees.
wlgrain wlhabit Wildlife Habitat Element Suitability of the soil to produce the wildlife(grain) habitat element grain.
wlgrass wlhabit Wildlife Habitat Element Suitability of the soil to produce the wildlife(grass) habitat element grass.
wlhard wlhabit Wildlife Habitat Element Suitability of the soil to produce the wildlife(hardwood trees) habitat element hardwood trees.
wlherb wlhabit Wildlife Habitat Element Suitability of the soil to produce the wildlife(herbaceous plants) habitat element herbaceous plants.
wlopen wlhabit Wildlife Habitat Potential Suitability of the soil to produce the habitat(openland) requirements for openland wildlife.
wlrange wlhabit Wildlife Habitat Potential Suitability of the soil to produce the habitat(rangeland) requirements for rangeland wildlife.

STATSGO data use information
Element Tables Long name Description––––––– –––––– –––––––––––––––––––– –––––––––––––––––––––––––––––––––––––––––––––––wlshlwat wlhabit Wildlife Habitat Element Suitability of the soil to produce the habitat
(shallow water) element shallow water.
wlshrub wlhabit Wildlife Habitat Element Suitability of the soil to produce the wildlife(shrubs) habitat element shrubs.
wlwet wlhabit Wildlife Habitat Potential Suitability of the soil to produce the habitat(wetland) requirements for wetland wildlife.
wlwetplt wlhabit Wildlife Habitat Element Suitability of the soil to produce the wildlife(wetland plants) habitat element wetland plants.
wlwood wlhabit Wildlife Habitat Potential Suitability of the soil to produce the habitat(woodland) requirements for woodland wildlife.
wndbrkht windbrk Windbreak Tree Height Windbreak tree height in feet at age in 20 years.
woodprod woodland Production Class Production class information for a specifictree measured in cubic meters per hectareper year (1 m3/ha = 14.3 ft.3/ac.).
wtbeg comp Water Table Begins Month in which seasonal water table occursat the depth specified in a normal year.
wtdeph comp Water Table Depth Maximum value for the range in depth to theseasonally high water table during themonths specified.
wtdepl comp Water Table Depth Minimum value for the range in depth to theseasonally high water table during themonths specified.
wtend comp Water Table Ends Month in which seasonal water tablesubsides below the depth specified in anormal year.
wtkind comp Water Table Kind The type of water table: Apparent (APPAR);Artesian (ARTES); Perched (PERCH).
yldunits yldunits Yield Units The units used to record the yield for thespecified crop.

STATSGO data use information
Appendix C: Definition of soil data codes
Element Code Code Name Code Description————— ———— ———————————— –––––––––––––––––––––––––––––––––––––––––––––––aashto A-1 Group Classification A-1 Granular materials (35% or less passing
No. 200), Stone Fragments, Gravel and Sand.
aashto A-1-A Group Classification A-1-A
aashto A-1-B Group Classification A-1-B
aashto A-2 Group Classification A-2 Granular materials (35% or less passingNo. 200), Silty, or Clayey Gravel and Sand.
aashto A-2-4 Group Classification A-2-4
aashto A-2-5 Group Classification A-2-5
aashto A-2-6 Group Classification A-2-6
aashto A-2-7 Group Classification A-2-7
aashto A-3 Group Classification A-3 Granular materials (35% or less passingNo. 200), Fine Sand.
aashto A-4 Group Classification A-4 Silt-Clay Materials (more than 35%passing No. 200), Silty Soils.
aashto A-5 Group Classification A-5 Silt-Clay Materials (more than 35%passing No. 200), Silty Soils.
aashto A-6 Group Classification A-6 Silt-Clay Materials (more than 35%passing No. 200), Clayey Soils.
aashto A-7 Group Classification A-7 Silt-Clay Materials (more than 35%passing No. 200), Clayey Soils.
aashto A-7-5 Group Classification A-7-5
aashto A-7-6 Group Classification A-7-6
aashto A-8 Group Classification A-8
cl 1 Capability Class - I Soils in Class I have few limitations thatrestrict their use.
cl 2 Capability Class - II Soils in Class II have some limitationsthat reduce the choice of plants or require moderateconservation practices.
cl 3 Capability Class - III Soils in Class III have severe limitations thatreduce the choice of plants or require specialconservation practices, or both.

STATSGO data use information
Element Code Code Name Code Description————— ———— ———————————— –––––––––––––––––––––––––––––––––––––––––––––––cl 4 Capability Class - IV Soils in Class IV have very severe limitations that
restrict the choice of plants, require very carefulmanagement, or both.
cl 5 CapabilityClass - V Soils in Class V have little or no erosion hazard buthave other limitations impractical remove that limittheir use.
cl 6 CapabilityClass - VI Soils in Class VI have severe limitations that makethem generally unsuited to cultivation and limit theiruse largely to pasture, etc.
cl 7 CapabilityClass - VII Soils in Class VII have very severe limitations thatmake them unsuited to cultivation and that restricttheir use to grazing, etc.
cl 8 CapabilityClass - VIII Soils (and landforms) in Class VIII have limitations thatpreclude their use for commercial plant productionand restrict their use.
compkind F Familycompkind G Taxon above familycompkind M Miscellaneous areacompkind S Seriescompkind T Taxadjunctcompkind V Variant
drainage E Excessively Soils have very high and high hydraulic conductivityand low water holding capacity. Depth to water table ismore than 6 feet.
drainage MW Moderately well Soils have a layer of low hydraulic conductivity, wetstate high in the profile. Depth to water table is3 to 6 feet.
drainage P Poorly Soils may have a saturated zone, a layer of lowhydraulic conductivity, or seepage. Depth to watertable is less than 1 foot.
drainage SE Somewhat excessively Soils have high hydraulic conductivity and low waterholding capacity. Depth to water table is more than6 feet.
drainage SP Somewhat poorly Soils commonly have a layer with low hydraulicconductivity, wet state high in profile, etc. Depth towater table is 1 to 3 feet.
drainage VP Very poorly Soils are wet to the surface most of the time.Depth to water table is less than 1 foot, or is ponded.
drainage W Well Soils have intermediate water holding capacity.Depth to water table is more than 6 feet.
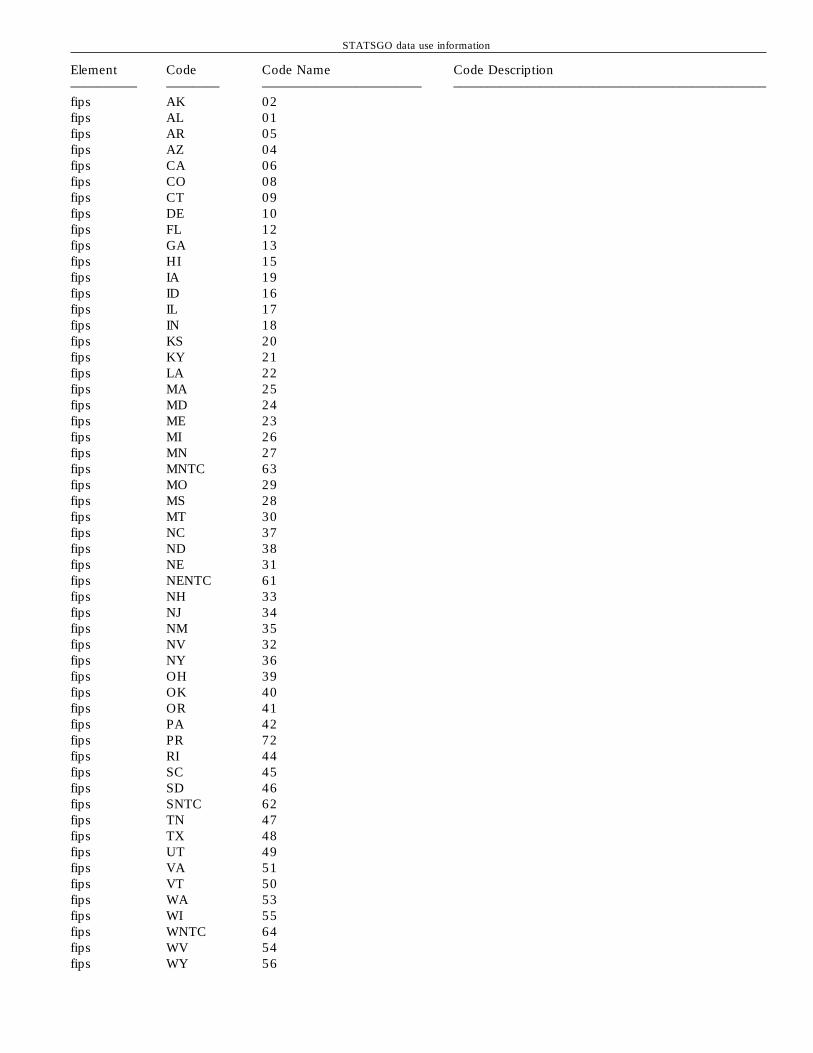
STATSGO data use information
Element Code Code Name Code Description————— ———— ———————————— –––––––––––––––––––––––––––––––––––––––––––––––fips AK 02fips AL 01fips AR 05fips AZ 04fips CA 06fips CO 08fips CT 09fips DE 10fips FL 12fips GA 13fips HI 15fips IA 19fips ID 16fips IL 17fips IN 18fips KS 20fips KY 21fips LA 22fips MA 25fips MD 24fips ME 23fips MI 26fips MN 27fips MNTC 63fips MO 29fips MS 28fips MT 30fips NC 37fips ND 38fips NE 31fips NENTC 61fips NH 33fips NJ 34fips NM 35fips NV 32fips NY 36fips OH 39fips OK 40fips OR 41fips PA 42fips PR 72fips RI 44fips SC 45fips SD 46fips SNTC 62fips TN 47fips TX 48fips UT 49fips VA 51fips VT 50fips WA 53fips WI 55fips WNTC 64fips WV 54fips WY 56

STATSGO data use information
Element Code Code Name Code Description————— ———— ———————————— –––––––––––––––––––––––––––––––––––––––––––––––flodur BRIEF Brief Flood Duration Class - Brief — Average
duration of inundation per flood is 2 to 7 days.
flodur LONG Long Flood Duration Class - Long — Averageduration of inundation per flood is 7 days to 1 month.
flodur VERY Very brief Flood Duration Class - Very brief —BRIEF Average duration of inundation per flood
is less than 2 days.
flodur VERY Very long Flood Duration Class - Very long —LONG Average duration of inundation per flood
is more than 1 month.
flofreq COMM Common Frequency Class - Common — Is OCCAS/FREQ
flofreq FREQ Frequent Frequency Class - Frequent — Flooding is likely to occur often,more than 50 percent chance of flooding in any year(at least 50 times in 100 years).
flofreq NONE None Frequency Class - None — Flooding is not likely to occur.
flofreq OCCAS Occasional Frequency Class - Occasional — Flooding is expectedinfrequently, 5 to 50 percent chance of flooding inany year (5 to 50 times in 100 years).
flofreq RARE Rare Frequency Class - Rare — Flooding unlikely but possible, 0 to 5percent chance of flooding in any year (0 to 5 times in100 years).
flood FREQ Frequent Frequency Class - Frequent (Hydric Only) — Flooding is likely tooccur often, more than 50 percent chance of floodingin any year (at least 50 times in 100 years).
flood NONE None Frequency Class - None (Hydric Only) — Flooding is not likelyto occur.
flood OCCAS Occasional Flooding is expected infrequently, 5 to 50 percentchance of flooding in any year (5 to 50 times in100 years).
flood RARE Rare Frequency Class - Rare (Hydric Only) — Floodingunlikely but possible, 0 to 5 percent chance of floodingin any year (0 to 5 times in 100 years).
frostact HIGH High
frostact LOW Low
frostact MODERATE Moderate

STATSGO data use information
Element Code Code Name Code Description————— ———— ———————————— –––––––––––––––––––––––––––––––––––––––––––––––grpcode — Null value indicatorgrpcode 1 Septic tank absorption
fieldsgrpcode 10 Local roads and streetsgrpcode 11 Lawns, landscaping, and
golf fairwaysgrpcode 12 Roadfillgrpcode 13 Sandgrpcode 14 Gravelgrpcode 15 Topsoilgrpcode 16 Pond reservoir areagrpcode 17 Embankments, dikes,
and leveesgrpcode 18 Aquifer-fed excavated pondsgrpcode 19 Drainagegrpcode 2 Sewage lagoonsgrpcode 20 Irrigationgrpcode 21 Terraces and diversionsgrpcode 22 Grassed waterwaysgrpcode 23 Camp areasgrpcode 24 Picnic areasgrpcode 25 Playgroundsgrpcode 26 Paths and trailsgrpcode 3 Trench sanitary landfillgrpcode 4 Area sanitary landfillgrpcode 5 Daily cover for landfillgrpcode 6 Shallow excavationsgrpcode 7 Dwellings without basementsgrpcode 8 Dwellings with basementsgrpcode 9 Small commercial buildingsgrtgroup AAQAL Albaqualfsgrtgroup AAQDU Duraqualfsgrtgroup AAQEN Endoaqualfsgrtgroup AAQEP Epiaqualfsgrtgroup AAQFR Fragiaqualfsgrtgroup AAQGL Glossaqualfsgrtgroup AAQKA Kandiaqualfsgrtgroup AAQNA Natraqualfsgrtgroup AAQOC Ochraqualfsgrtgroup AAQPN Plinthaqualfsgrtgroup AAQTR Tropaqualfsgrtgroup AAQUM Umbraqualfsgrtgroup ABOCR Cryoboralfsgrtgroup ABOEU Eutroboralfsgrtgroup ABOFR Fragiboralfsgrtgroup ABOGL Glossoboralfsgrtgroup ABONA Natriboralfsgrtgroup ABOPA Paleboralfsgrtgroup AUDAG Agrudalfsgrtgroup AUDFE Ferrudalfsgrtgroup AUDFR Fragiudalfsgrtgroup AUDFS Fraglossudalfsgrtgroup AUDGL Glossudalfsgrtgroup AUDHA Hapludalfsgrtgroup AUDKA Kandiudalfs
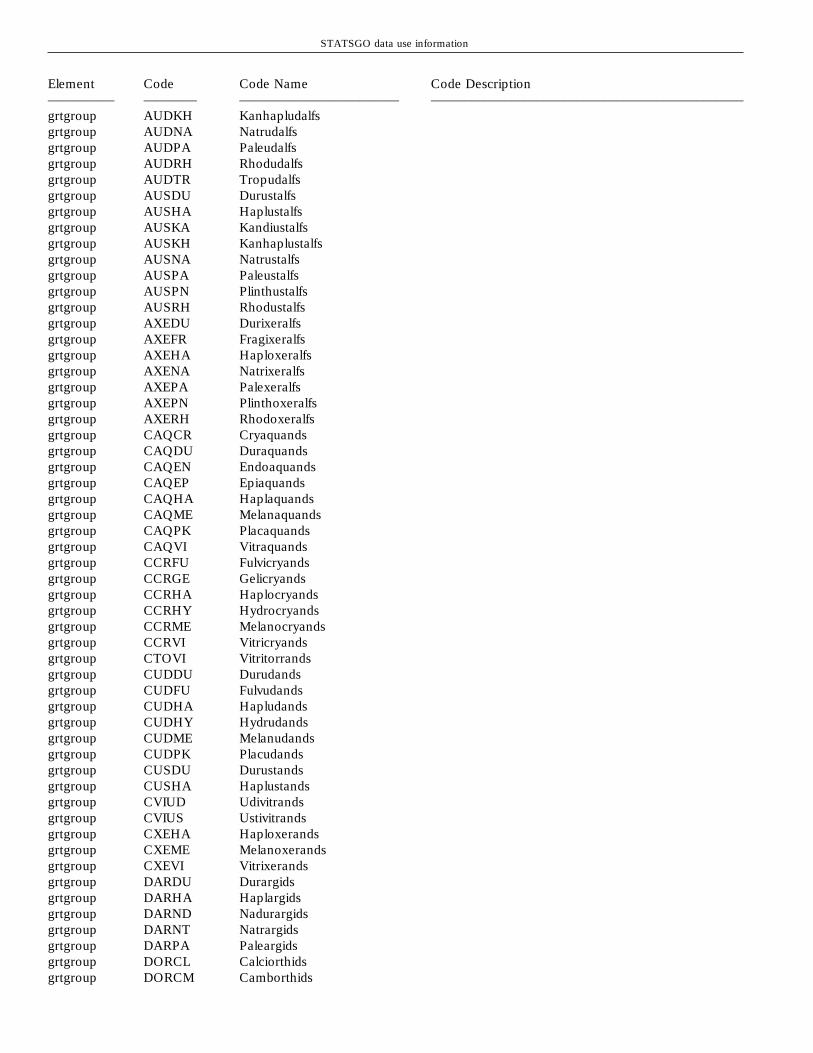
STATSGO data use information
Element Code Code Name Code Description————— ———— ———————————— –––––––––––––––––––––––––––––––––––––––––––––––grtgroup AUDKH Kanhapludalfsgrtgroup AUDNA Natrudalfsgrtgroup AUDPA Paleudalfsgrtgroup AUDRH Rhodudalfsgrtgroup AUDTR Tropudalfsgrtgroup AUSDU Durustalfsgrtgroup AUSHA Haplustalfsgrtgroup AUSKA Kandiustalfsgrtgroup AUSKH Kanhaplustalfsgrtgroup AUSNA Natrustalfsgrtgroup AUSPA Paleustalfsgrtgroup AUSPN Plinthustalfsgrtgroup AUSRH Rhodustalfsgrtgroup AXEDU Durixeralfsgrtgroup AXEFR Fragixeralfsgrtgroup AXEHA Haploxeralfsgrtgroup AXENA Natrixeralfsgrtgroup AXEPA Palexeralfsgrtgroup AXEPN Plinthoxeralfsgrtgroup AXERH Rhodoxeralfsgrtgroup CAQCR Cryaquandsgrtgroup CAQDU Duraquandsgrtgroup CAQEN Endoaquandsgrtgroup CAQEP Epiaquandsgrtgroup CAQHA Haplaquandsgrtgroup CAQME Melanaquandsgrtgroup CAQPK Placaquandsgrtgroup CAQVI Vitraquandsgrtgroup CCRFU Fulvicryandsgrtgroup CCRGE Gelicryandsgrtgroup CCRHA Haplocryandsgrtgroup CCRHY Hydrocryandsgrtgroup CCRME Melanocryandsgrtgroup CCRVI Vitricryandsgrtgroup CTOVI Vitritorrandsgrtgroup CUDDU Durudandsgrtgroup CUDFU Fulvudandsgrtgroup CUDHA Hapludandsgrtgroup CUDHY Hydrudandsgrtgroup CUDME Melanudandsgrtgroup CUDPK Placudandsgrtgroup CUSDU Durustandsgrtgroup CUSHA Haplustandsgrtgroup CVIUD Udivitrandsgrtgroup CVIUS Ustivitrandsgrtgroup CXEHA Haploxerandsgrtgroup CXEME Melanoxerandsgrtgroup CXEVI Vitrixerandsgrtgroup DARDU Durargidsgrtgroup DARHA Haplargidsgrtgroup DARND Nadurargidsgrtgroup DARNT Natrargidsgrtgroup DARPA Paleargidsgrtgroup DORCL Calciorthidsgrtgroup DORCM Camborthids

STATSGO data use information
Element Code Code Name Code Description————— ———— ———————————— –––––––––––––––––––––––––––––––––––––––––––––––grtgroup DORDU Durorthidsgrtgroup DORGY Gypsiorthidsgrtgroup DORPA Paleorthidsgrtgroup DORSA Salorthidsgrtgroup EAQCR Cryaquentsgrtgroup EAQEN Endoaquentsgrtgroup EAQEP Epiaquentsgrtgroup EAQFL Fluvaquentsgrtgroup EAQHA Haplaquentsgrtgroup EAQHY Hydraquentsgrtgroup EAQPS Psammaquentsgrtgroup EAQSU Sulfaquentsgrtgroup EAQTR Tropaquentsgrtgroup EARTO Torriarentsgrtgroup EARUD Udarentsgrtgroup EARUS Ustarentsgrtgroup EARXE Xerarentsgrtgroup EFLCR Cryofluventsgrtgroup EFLTO Torrifluventsgrtgroup EFLTR Tropofluventsgrtgroup EFLUD Udifluventsgrtgroup EFLUS Ustifluventsgrtgroup EFLXE Xerofluventsgrtgroup EORCR Cryorthentsgrtgroup EORTO Torriorthentsgrtgroup EORTR Troporthentsgrtgroup EORUD Udorthentsgrtgroup EORUS Ustorthentsgrtgroup EORXE Xerorthentsgrtgroup EPSCR Cryopsammentsgrtgroup EPSQU Quartzipsammentsgrtgroup EPSTO Torripsammentsgrtgroup EPSTR Tropopsammentsgrtgroup EPSUD Udipsammentsgrtgroup EPSUS Ustipsammentsgrtgroup EPSXE Xeropsammentsgrtgroup HFIBO Borofibristsgrtgroup HFICR Cryofibristsgrtgroup HFILU Luvifibristsgrtgroup HFIME Medifibristsgrtgroup HFISP Sphagnofibristsgrtgroup HFITR Tropofibristsgrtgroup HFOBO Borofolistsgrtgroup HFOCR Cryofolistsgrtgroup HFOME Medifolistsgrtgroup HFOTR Tropofolistsgrtgroup HHEBO Borohemistsgrtgroup HHECR Cryohemistsgrtgroup HHELU Luvihemistsgrtgroup HHEME Medihemistsgrtgroup HHESI Sulfihemistsgrtgroup HHESO Sulfohemistsgrtgroup HHETR Tropohemistsgrtgroup HSABO Borosapristsgrtgroup HSACR Cryosaprists

STATSGO data use information
Element Code Code Name Code Description————— ———— ———————————— –––––––––––––––––––––––––––––––––––––––––––––––grtgroup HSAME Medisapristsgrtgroup HSASI Sulfisapristsgrtgroup HSASO Sulfosapristsgrtgroup HSATR Troposapristsgrtgroup IANCR Cryandeptsgrtgroup IANDU Durandeptsgrtgroup IANDY Dystrandeptsgrtgroup IANEU Eutrandeptsgrtgroup IANHY Hydrandeptsgrtgroup IANPK Placandeptsgrtgroup IANVI Vitrandeptsgrtgroup IAQAN Andaqueptsgrtgroup IAQCR Cryaqueptsgrtgroup IAQEN Endoaqueptsgrtgroup IAQEP Epiaqueptsgrtgroup IAQFR Fragiaqueptsgrtgroup IAQHL Halaqueptsgrtgroup IAQHP Haplaqueptsgrtgroup IAQHU Humaqueptsgrtgroup IAQPK Placaqueptsgrtgroup IAQPN Plinthaqueptsgrtgroup IAQSU Sulfaqueptsgrtgroup IAQTR Tropaqueptsgrtgroup IOCCR Cryochreptsgrtgroup IOCDU Durochreptsgrtgroup IOCDY Dystrochreptsgrtgroup IOCEU Eutrochreptsgrtgroup IOCFR Fragiochreptsgrtgroup IOCSU Sulfochreptsgrtgroup IOCUS Ustochreptsgrtgroup IOCXE Xerochreptsgrtgroup IPLPL Plaggeptsgrtgroup ITRDY Dystropeptsgrtgroup ITREU Eutropeptsgrtgroup ITRHU Humitropeptsgrtgroup ITRSO Sombritropeptsgrtgroup ITRUS Ustropeptsgrtgroup IUMCR Cryumbreptsgrtgroup IUMFR Fragiumbreptsgrtgroup IUMHA Haplumbreptsgrtgroup IUMXE Xerumbreptsgrtgroup MALAR Argialbollsgrtgroup MALNA Natralbollsgrtgroup MAQAR Argiaquollsgrtgroup MAQCA Calciaquollsgrtgroup MAQCR Cryaquollsgrtgroup MAQDU Duraquollsgrtgroup MAQEN Endoaquollsgrtgroup MAQEP Epiaquollsgrtgroup MAQHA Haplaquollsgrtgroup MAQNA Natraquollsgrtgroup MBOAR Argiborollsgrtgroup MBOCA Calciborollsgrtgroup MBOCR Cryoborollsgrtgroup MBOHA Haploborolls

STATSGO data use information
Element Code Code Name Code Description————— ———— ———————————— –––––––––––––––––––––––––––––––––––––––––––––––grtgroup MBONA Natriborollsgrtgroup MBOPA Paleborollsgrtgroup MBOVE Vermiborollsgrtgroup MRERE Rendollsgrtgroup MUDAR Argiudollsgrtgroup MUDCA Calciudollsgrtgroup MUDHA Hapludollsgrtgroup MUDPA Paleudollsgrtgroup MUDVE Vermudollsgrtgroup MUSAR Argiustollsgrtgroup MUSCA Calciustollsgrtgroup MUSDU Durustollsgrtgroup MUSHA Haplustollsgrtgroup MUSNA Natrustollsgrtgroup MUSPA Paleustollsgrtgroup MUSVE Vermustollsgrtgroup MXEAR Argixerollsgrtgroup MXECA Calcixerollsgrtgroup MXEDU Durixerollsgrtgroup MXEHA Haploxerollsgrtgroup MXENA Natrixerollsgrtgroup MXEPA Palexerollsgrtgroup OAQAC Acraquoxgrtgroup OAQEU Eutraquoxgrtgroup OAQGI Gibbsiaquoxgrtgroup OAQHA Haplaquoxgrtgroup OAQOC Ochraquoxgrtgroup OAQPN Plinthaquoxgrtgroup OAQUM Umbraquoxgrtgroup OHUAC Acrohumoxgrtgroup OHUGI Gibbsihumoxgrtgroup OHUHA Haplohumoxgrtgroup OHUSO Sombrihumoxgrtgroup OORAC Acrorthoxgrtgroup OOREU Eutrorthoxgrtgroup OORGI Gibbsiorthoxgrtgroup OORHA Haplorthoxgrtgroup OORSO Sombriorthoxgrtgroup OORUM Umbriorthoxgrtgroup OPRAC Acroperoxgrtgroup OPREU Eutroperoxgrtgroup OPRHA Haploperoxgrtgroup OPRKA Kandiperoxgrtgroup OPRSO Sombriperoxgrtgroup OTOAC Acrotorroxgrtgroup OTOEU Eutrotorroxgrtgroup OTOHA Haplotorroxgrtgroup OTOTO Torroxgrtgroup OUDAC Acrudoxgrtgroup OUDEU Eutrudoxgrtgroup OUDHA Hapludoxgrtgroup OUDKA Kandiudoxgrtgroup OUDSO Sombriudoxgrtgroup OUSAC Acrustoxgrtgroup OUSEU Eutrustox

STATSGO data use information
Element Code Code Name Code Description————— ———— ———————————— –––––––––––––––––––––––––––––––––––––––––––––––grtgroup OUSHA Haplustoxgrtgroup OUSKA Kandiustoxgrtgroup OUSSO Sombriustoxgrtgroup SAQA2 Alaquodsgrtgroup SAQCR Cryaquodsgrtgroup SAQDU Duraquodsgrtgroup SAQEN Endoaquodsgrtgroup SAQEP Epiaquodsgrtgroup SAQFR Fragiaquodsgrtgroup SAQHA Haplaquodsgrtgroup SAQPK Placaquodsgrtgroup SAQSI Sideraquodsgrtgroup SAQTR Tropaquodsgrtgroup SCRDU Duricryodsgrtgroup SCRHA Haplocryodsgrtgroup SCRHU Humicryodsgrtgroup SCRPK Placocryodsgrtgroup SFEFE Ferrodsgrtgroup SHUCR Cryohumodsgrtgroup SHUDU Durihumodsgrtgroup SHUFR Fragihumodsgrtgroup SHUHA Haplohumodsgrtgroup SHUPK Placohumodsgrtgroup SHUTR Tropohumodsgrtgroup SORA2 Alorthodsgrtgroup SORCR Cryorthodsgrtgroup SORDU Durorthodsgrtgroup SORFR Fragiorthodsgrtgroup SORHA Haplorthodsgrtgroup SORPK Placorthodsgrtgroup SORTR Troporthodsgrtgroup UAQAL Albaquultsgrtgroup UAQEN Endoaquultsgrtgroup UAQEP Epiaquultsgrtgroup UAQFR Fragiaquultsgrtgroup UAQKA Kandiaquultsgrtgroup UAQKH Kanhaplaquultsgrtgroup UAQOC Ochraquultsgrtgroup UAQPA Paleaquultsgrtgroup UAQPN Plinthaquultsgrtgroup UAQTR Tropaquultsgrtgroup UAQUM Umbraquultsgrtgroup UHUHA Haplohumultsgrtgroup UHUKA Kandihumultsgrtgroup UHUKH Kanhaplohumultsgrtgroup UHUPA Palehumultsgrtgroup UHUPN Plinthohumultsgrtgroup UHUSO Sombrihumultsgrtgroup UHUTR Tropohumultsgrtgroup UUDFR Fragiudultsgrtgroup UUDHA Hapludultsgrtgroup UUDKA Kandiudultsgrtgroup UUDKH Kanhapludultsgrtgroup UUDPA Paleudultsgrtgroup UUDPN Plinthudults

STATSGO data use information
Element Code Code Name Code Description————— ———— ———————————— –––––––––––––––––––––––––––––––––––––––––––––––grtgroup UUDRH Rhodudultsgrtgroup UUDTR Tropudultsgrtgroup UUSHA Haplustultsgrtgroup UUSKA Kandiustultsgrtgroup UUSKH Kanhaplustultsgrtgroup UUSPA Paleustultsgrtgroup UUSPN Plinthustultsgrtgroup UUSRH Rhodustultsgrtgroup UXEHA Haploxerultsgrtgroup UXEPA Palexerultsgrtgroup VAQCA Calciaquertsgrtgroup VAQDU Duraquertsgrtgroup VAQDY Dystraquertsgrtgroup VAQEN Endoaquertsgrtgroup VAQEP Epiaquertsgrtgroup VAQNA Natraquertsgrtgroup VAQSA Salaquertsgrtgroup VCRHA Haplocryertsgrtgroup VCRHU Humicryertsgrtgroup VTOCA Calcitorrertsgrtgroup VTOGY Gypsitorrertsgrtgroup VTOHA Haplotorrertsgrtgroup VTOSA Salitorrertsgrtgroup VTOTO Torrertsgrtgroup VUDCH Chromudertsgrtgroup VUDDY Dystrudertsgrtgroup VUDHA Hapludertsgrtgroup VUDPE Pelludertsgrtgroup VUSCA Calciustertsgrtgroup VUSCH Chromustertsgrtgroup VUSDY Dystrustertsgrtgroup VUSGY Gypsiustertsgrtgroup VUSHA Haplustertsgrtgroup VUSPE Pellustertsgrtgroup VUSSA Salustertsgrtgroup VXECA Calcixerertsgrtgroup VXECH Chromoxerertsgrtgroup VXEDU Durixerertsgrtgroup VXEHA Haploxerertsgrtgroup VXEPE Pelloxererts
hydgrp A Hydrology Class - A High infiltration rates. Soils are deep,well drained to excessively drained sands and gravels.
hydgrp A/D Hydrology Class - A/D Drained/undrained hydrology class of soilsthat can be drained and are classified.
hydgrp B Hydrology Class - B Moderate infiltration rates. Deep andmoderately deep, moderately well and well drainedsoils with moderately coarse textures.
hydgrp B/D Hydrology Class - B/D Drained/undrained hydrologyclass of soils that can be drained and are classified.

STATSGO data use information
Element Code Code Name Code Description————— ———— ———————————— –––––––––––––––––––––––––––––––––––––––––––––––ydgrp C Hydrology Class - C Slow infiltration rates. Soils with layers
impeding downward movement of water, or soils withmoderately fine or fine textures.
hydgrp C/D Hydrology Class - C/D Drained/undrained hydrology class ofsoils that can be drained and classified.
hydgrp D Hydrology Class - D Very slow infiltration rates. Soils areclayey, have a high water table, or are shallow to animpervious layer.
hydric N No Soil does not meet the requirements for a hydric soil.
hydric U Unranked Soil has not been ranked with hydric criteria.
hydric Y Yes Soil meets the requirements for a hydric soil.
kfact .02kfact .05kfact .1kfact .10kfact .15kfact .17kfact .2kfact .20kfact .24kfact .28kfact .32kfact .37kfact .43kfact .49kfact .55kfact .64kfact 0.02kfact 0.05kfact 0.10kfact 0.15kfact 0.17kfact 0.20kfact 0.24kfact 0.28kfact 0.32kfact 0.37kfact 0.43kfact 0.49kfact 0.55kfact 0.64
minalogy 01 unclassifiedminalogy 02 not usedminalogy 03 alliticminalogy 04 calcareousminalogy 05 carbonaticminalogy 07 clasticminalogy 08 coprogenous

STATSGO data use information
Element Code Code Name Code Description————— ———— ———————————— –––––––––––––––––––––––––––––––––––––––––––––––minalogy 09 chloriticminalogy 10 diatomaceousminalogy 12 ferrihumicminalogy 14 ferriticminalogy 16 ferruginousminalogy 18 gibbsiticminalogy 20 glauconiticminalogy 22 gypsicminalogy 24 halloysiticminalogy 26 illiticminalogy 27 illitic (calcareous)minalogy 28 kaoliniticminalogy 30 marlyminalogy 32 micaceousminalogy 33 micaceous (calcareous)minalogy 34 mixedminalogy 35 mixed (calcareous)minalogy 37 montmorilloniticminalogy 38 montmorillonitic (calcareous)minalogy 40 oxidicminalogy 42 sepioliticminalogy 44 serpentiniticminalogy 46 siliceousminalogy 47 siliceous (calcareous)minalogy 48 sesquicminalogy 50 vermiculiticminalogy 51 vermiculitic (calcareous)
mlra 1 Northern Pacific CoastRange, foothills, and Valleys
mlra 10 Upper Snake River LavaPlains and Hills
mlra 100 Erie Fruit and Truck Area
mlra 101 Ontario Plain and FingerLakes Region
mlra 102A Rolling Till Prairie
mlra 102B Loess Upland and Till Plains
mlra 103 Central Iowa and MinnesotaTill Prairies
mlra 104 Eastern Iowa and MinnesotaTill Prairies
mlra 105 Northern Mississippi ValleyLoess Hills
mlra 106 Nebraska and KansasLoess-Drift Hills

STATSGO data use information
Element Code Code Name Code Description————— ———— ———————————— –––––––––––––––––––––––––––––––––––––––––––––––mlra 107 Iowa and Missouri Deep
Loess Hills
mlra 108 Illinois and Iowa Deep Loessand Drift
mlra 108A Illinois and Iowa Deep Loessand Drift, Eastern Part(proposed)
mlra 108B Illinois and Iowa Deep Loessand Drift, East Central Part(proposed)
mlra 108C Illinois and Iowa Deep Loessand Drift, West Central Part(proposed)
mlra 108D Illinois and Iowa Deep Loessand Drift, Western Part(proposed)
mlra 109 Iowa and Missouri HeavyTill Plain
mlra 10A Big and Little Wood RiverFootslopes and Plains(proposed)
mlra 11 Snake River Plains
mlra 110 Northern Illinois and IndianaHeavy Till Plain
mlra 111 Indiana and Ohio Till Plain
mlra 112 Cherokee Prairies
mlra 113 Central Claypan Areas
mlra 114 Southern Illinois and IndianaThin Loess and Till Plain
mlra 115 Central Mississippi ValleyWooded Slopes
mlra 115A Central Mississippi ValleyWooded Slopes, EasternPart (proposed)
mlra 115B Central Mississippi ValleyWooded Slopes, SouthernPart (proposed)

STATSGO data use information
Element Code Code Name Code Description————— ———— ———————————— –––––––––––––––––––––––––––––––––––––––––––––––mlra 115C Central Mississippi Valley
Wooded Slopes, NorthernPart (proposed)
mlra 116A Ozark Highlandmlra 116B Ozark Bordermlra 117 Boston Mountains
mlra 118 Arkansas Valley andRidges
mlra 118A Arkansas Valley and Ridges,Eastern Part (proposed)
mlra 118B Arkansas Valley and Ridges,Western Part (proposed)
mlra 119 Ouachita Mountains
mlra 11A Central Snake River Plains(proposed)
mlra 11B Upper Snake River Plains(proposed)
mlra 12 Lost River Valleys and Mountains
mlra 120 Kentucky and IndianaSandstone and Shale Hillsand Valleys
mlra 121 Kentucky Bluegrass
mlra 122 Highland Rim andPennyroyal
mlra 123 Nashville Basin
mlra 124 Western Allegheny Plateau
mlra 125 Cumberland Plateau andMountains
mlra 126 Central Allegheny Plateau
mlra 127 Eastern Allegheny Plateauand Mountains
mlra 128 Southern Appalachian Ridgesand Valleys
mlra 129 Sand Mountain
mlra 13 Eastern Idaho Plateaus

STATSGO data use information
Element Code Code Name Code Description————— ———— ———————————— –––––––––––––––––––––––––––––––––––––––––––––––mlra 130 Blue Ridge
mlra 131 Southern Mississippi ValleyAlluvium
mlra 133A Southern Coastal Plain
mlra 133B Western Coastal Plain
mlra 134 Southern Mississippi ValleySilty Uplands
mlra 135 Alabama, Mississippi, andArkansas Blackland Prairies
mlra 136 Southern Piedmont
mlra 137 Carolina and Georgia Sand Hills
mlra 138 North-Central Florida Ridge
mlra 139 Eastern Ohio Till Plain
mlra 14 Central California CoastalValleys
mlra 140 Glaciated Allegheny Plateauand Catskill Mountains
mlra 141 Tughill Plateau
mlra 142 St. Lawrence-ChamplainPlain
mlra 143 Northeastern Mountains
mlra 144A New England and EasternNew York Upland, Southern Part
mlra 144B New England and EasternNew York Upland, Northern Part
mlra 145 Connecticut Valley
mlra 146 Aroostock Area
mlra 147 Northern Appalachain Ridgesand Valleys
mlra 148 Northern Piedmont
mlra 149A Northern Coastal Plain
mlra 149B Long Island-Cape Cod CoastalLowland

STATSGO data use information
Element Code Code Name Code Description————— ———— ———————————— –––––––––––––––––––––––––––––––––––––––––––––––mlra 15 Central California Coast Range
mlra 150A Gulf Coast Prairies
mlra 150B Gulf Coast Saline Prairies
mlra 151 Gulf Coast Marsh
mlra 152A Eastern Gulf Coast Flatwoods
mlra 152B Western Gulf Coast Flatwoods
mlra 153A Atlantic Coast Flatwoods
mlra 153B Tidewater Area
mlra 153C Mid-Atlantic Coastal Plain
mlra 154 South-Central Florida Ridge
mlra 155 Southern Florida Flatwoods
mlra 156A Florida Everglades andAssociated Areas
mlra 156B Southern Florida Lowlands
mlra 157 Arid and Semiarid LowMountain Slopes
mlra 158 Semiarid and Subhumid LowMountain Slopes
mlra 159 Humid and Very Humid Lowand Intermediate Mountain Slopes
mlra 16 California Delta
mlra 160 Subhumid and HumidIntermediate and HighMountain Slopes
mlra 161 Lava Flows and RockOutcrops
mlra 162 Very Humid Areas on Eastand West Maui Mountains,Kohala Mountains, andMount Waialeale
mlra 163 Alluvial Fans and CoastalPlains
mlra 164 Rough Mountainous Lands

STATSGO data use information
Element Code Code Name Code Description————— ———— ———————————— –––––––––––––––––––––––––––––––––––––––––––––––mlra 165 Subhumid Intermediate
Mountain Slopes
mlra 166 Very Stony Land and RockLand
mlra 167 Humid Low and IntermediateMountain Slopes
mlra 168 Southeastern Alaska
mlra 169 South-Central AlaskaMountains
mlra 17 Sacramento and San JoaquinValleys
mlra 170 Cook Inlet-Susitna Lowland
mlra 171 Alaska Peninsula andSouthwestern Islands
mlra 172 Cooper River Plateau
mlra 173 Alaska Range
mlra 174 Interior Alaska Lowlands
mlra 175 Kuskokwim Highlands
mlra 176 Interior Alaska Highlands
mlra 177 Norton Sound Highlands
mlra 178 Western Alaska Coastal Plainsand Deltas
mlra 179 Bering Sea Islands
mlra 18 Sierra Nevada Foothills
mlra 180 Brooks Range
mlra 181 Arctic Foothills
mlra 182 Arctic Coastal Plains
mlra 19 Southern California CoastalPlain
mlra 190 Ponape (proposed) Pacific Basin Area
mlra 191 Kosrae (proposed) Pacific Basin Area
mlra 192 Marshall Islands (proposed) Pacific Basin Area

STATSGO data use information
Element Code Code Name Code Description————— ———— ———————————— –––––––––––––––––––––––––––––––––––––––––––––––mlra 193 Truk (proposed) Pacific Basin Area
mlra 194 Yap (proposed) Pacific Basin Area
mlra 195 Palau (proposed) Pacific Basin Area
mlra 196 Tutuila, Aunu’u (proposed) Pacific Basin Area
mlra 197 Tau (proposed) Pacific Basin Area
mlra 198 Ofu, Olosega (proposed) Pacific Basin Area
mlra 199 Northern Guam (proposed) Pacific Basin Area
mlra 2 Willamette and Puget SoundValleys
mlra 20 Southern California Mountains
mlra 200 Southern Guam (proposed) Pacific Basin Area
mlra 201 Saipan (proposed) Pacific Basin Area
mlra 202 Aguijan, Tinian (proposed) Pacific Basin Area
mlra 203 Rota (proposed) Pacific Basin Area
mlra 21 Klamath and Shasta Valleysand Basins
mlra 22 Sierra Nevada Range
mlra 23 Malheur High Plateau
mlra 24 Humboldt Area
mlra 25 Owyhee High Plateau
mlra 26 Carson Basin and Mountains
mlra 27 Fallon-Lovelock Area
mlra 270 Humid Mountains andValleys (proposed)
mlra 271 Semiarid Mountains andValleys (proposed)
mlra 272 Humid Coastal Plains(proposed)
mlra 273 Semiarid Coastal Plains(proposed)
mlra 28A Great Salt Lake Area

STATSGO data use information
Element Code Code Name Code Description————— ———— ———————————— –––––––––––––––––––––––––––––––––––––––––––––––mlra 28B Central Nevada Basin And
Range
mlra 29 Southern Nevada Basin andRange
mlra 3 Olympic and CascadeMountains
mlra 30 Sonoran Basin and Range
mlra 31 Imperial Valley
mlra 32 Northern IntermountainDesertic Basins
mlra 33 Semiarid RockyMountains
mlra 34 Central Desertic Basins,Mountains, and Plateaus
mlra 35 Colorado and Green RiverPlateaus
mlra 36 New Mexico and ArizonaPlateaus and Mesas
mlra 36A Western Mesas, Plateaus andBasins (proposed)
mlra 36B Western Plateaus and Plains(proposed)
mlra 37 San Juan River ValleyMesas and Plateaus
mlra 39 Arizona and New MexicoMountains
mlra 4 California Coastal RedwoodBelt
mlra 40 Central Arizona Basin andRange
mlra 41 Southeastern Arizona Basinand Range
mlra 42 Southern Desertic Basins,Plains, and Mountains
mlra 42A Southern Desert Rio GrandeCentral Basin (proposed)
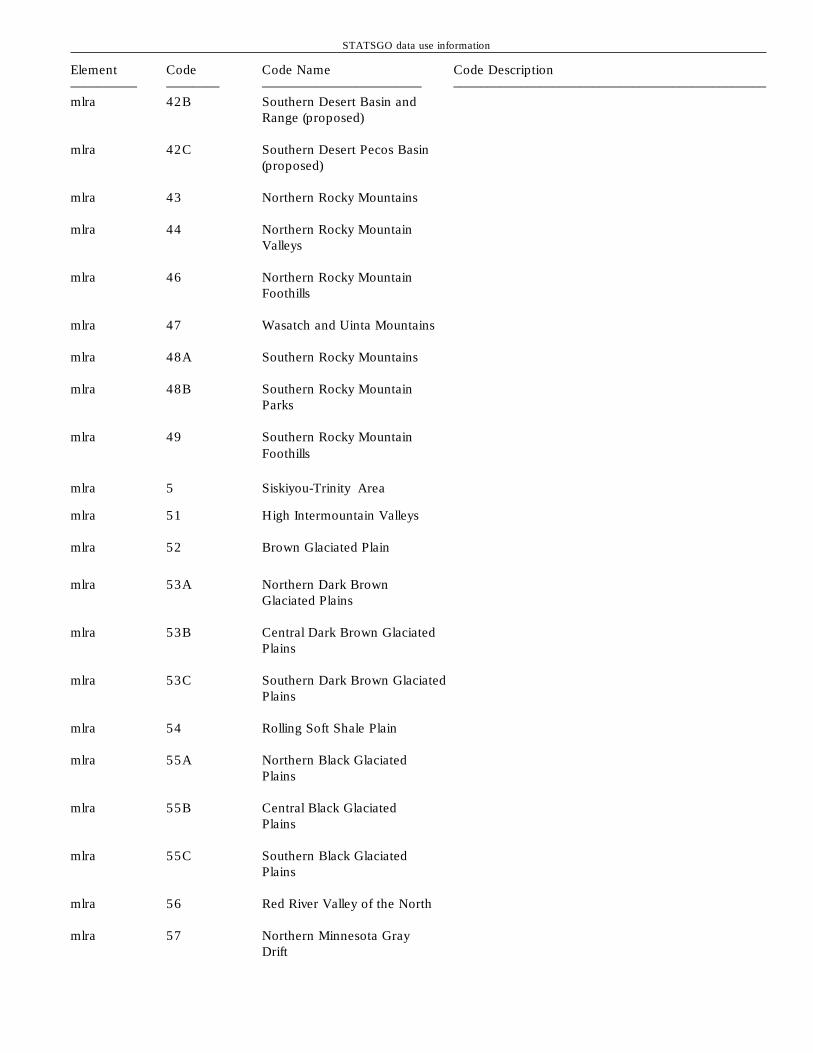
STATSGO data use information
Element Code Code Name Code Description————— ———— ———————————— –––––––––––––––––––––––––––––––––––––––––––––––mlra 42B Southern Desert Basin and
Range (proposed)
mlra 42C Southern Desert Pecos Basin(proposed)
mlra 43 Northern Rocky Mountains
mlra 44 Northern Rocky MountainValleys
mlra 46 Northern Rocky MountainFoothills
mlra 47 Wasatch and Uinta Mountains
mlra 48A Southern Rocky Mountains
mlra 48B Southern Rocky MountainParks
mlra 49 Southern Rocky MountainFoothills
mlra 5 Siskiyou-Trinity Area
mlra 51 High Intermountain Valleys
mlra 52 Brown Glaciated Plain
mlra 53A Northern Dark BrownGlaciated Plains
mlra 53B Central Dark Brown GlaciatedPlains
mlra 53C Southern Dark Brown GlaciatedPlains
mlra 54 Rolling Soft Shale Plain
mlra 55A Northern Black GlaciatedPlains
mlra 55B Central Black GlaciatedPlains
mlra 55C Southern Black GlaciatedPlains
mlra 56 Red River Valley of the North
mlra 57 Northern Minnesota GrayDrift

STATSGO data use information
Element Code Code Name Code Description————— ———— ———————————— –––––––––––––––––––––––––––––––––––––––––––––––mlra 58A Northern Rolling High Plains,
Northern Part
mlra 58B Northern Rolling High Plains,Southern Part
mlra 58C Northern Rolling High Plains,Northeastern Part
mlra 58D Northern Rolling High Plains,Eastern Part
mlra 6 Cascade Mountains, EasternSlope
mlra 60A Pierre Shale Plains andBadlands
mlra 60B Pierre Shale Plains, NorthernPart
mlra 61 Black Hills Foot Slopes
mlra 62 Black Hills
mlra 63A Northern Rolling PierreShale Plains
mlra 63B Southern Rolling PierreShale Plains
mlra 64 Mixed Sandy and SiltyTableland
mlra 65 Nebraska Sand Hills
mlra 66 Dakota-Nebraska ErodedTableland
mlra 67 Central High Plains
mlra 69 Upper Arkansas ValleyRolling Plains
mlra 7 Columbia Basin
mlra 70 Pecos-Canadian Plains andValleys
mlra 70A Canadian Plains and Valleys(proposed)
mlra 70B Upper Pecos Valley(proposed)

STATSGO data use information
Element Code Code Name Code Description————— ———— ———————————— –––––––––––––––––––––––––––––––––––––––––––––––mlra 70C Central New Mexico
Highlands (proposed)
mlra 70D Southern Desert Foothills(proposed)
mlra 70E Upper Pecos Canadian Breaksand Terraces (proposed)
mlra 71 Central Nebraska Loess Hills
mlra 72 Central High Tableland
mlra 73 Rolling Plains and Breaks
mlra 74 Central Kansas Sandstone Hills
mlra 75 Central Loess Plains
mlra 76 Bluestem Hills
mlra 77 Southern High Plains
mlra 77A Southern High Plains,Northern Part (proposed)
mlra 77B Southern High Plains,Northwestern Part (proposed)
mlra 77C Southern High Plains,Southern Part (proposed)
mlra 77D Southern High Plains,Southwestern Part (proposed)
mlra 77E Southern High Plains, Breaks(proposed)
mlra 78 Central Rolling Red Plains
mlra 78A Central Rolling Red Plains,Northern Part (proposed)
mlra 78B Central Rolling Red Plains,Western Part (proposed)
mlra 78C Central Rolling Red Plains,Eastern Part (proposed)
mlra 78D Rolling Limestone Prairie(proposed)
5mlra 79 Great Bend Sand Plains
mlra 8 Columbia Plateau

STATSGO data use information
Element Code Code Name Code Description————— ———— ———————————— –––––––––––––––––––––––––––––––––––––––––––––––mlra 80A Central Rolling Red Prairies
mlra 80B Texas North-Central Prairies
mlra 81 Edwards Plateau
mlra 81A Edwards Plateau, WesternPart (proposed)
mlra 81B Edwards Plateau, CentralPart (proposed)
mlra 81C Edwards Plateau, EasternPart (proposed)
mlra 81D Southern Edwards Plateau(proposed)
mlra 82 Texas Central Basin
mlra 82A Texas Central Basin(proposed)
mlra 82B Wichita Mountains (proposed)
mlra 83A Northern Rio Grande Plain
mlra 83B Western Rio Grande Plain
mlra 83C Central Rio Grande Plain
mlra 83D Lower Rio Grande Plain
mlra 84A Cross Timbers
mlra 84B West Cross Timbers
mlra 84C East Cross Timbers
mlra 85 Grand Prairie
mlra 85A Grand Prairie (proposed)
mlra 85B Arbuckle Mountains(proposed)
mlra 86 Texas Blackland Prairie
mlra 86A Texas Blackland Prairie,Northern Part (proposed)
mlra 86B Texas Blackland Prairie,Southern Part (proposed)
mlra 87 Texas Claypan Area

STATSGO data use information
Element Code Code Name Code Description————— ———— ———————————— –––––––––––––––––––––––––––––––––––––––––––––––mlra 87A Texas Claypan Area,
Southern Part (proposed)
mlra 87B Texas Claypan Area,Northern Part (proposed)
mlra 88 Northern Minnesota GlacialLake Basins
mlra 9 Palouse and Nez Perce Prairies
mlra 90 Central Wisconsin andMinnesota Thin Loessand Till
mlra 91 Wisconsin and MinnesotaSandy Outwash
mlra 92 Superior Lake Plain
mlra 93 Superior Stony and RockyLoamy Plains and Hills
mlra 94A Northern Michigan andWisconsin Sandy Drift
mlra 94B Michigan Eastern UpperPenninsula Sandy Drift
mlra 95A Northeastern Wisconsin DriftPlain
mlra 95B Southern Wisconsin andNorthern Illinois Drift Plain
mlra 96 Western Michigan andNortheastern Wisconsin FruitBelt
mlra 97 Southwestern Michigan Fruitand Truck Belt
mlra 98 Southern Michigan andNorthern Indiana Drift Plain
mlra 99 Erie-Huron Lake Plain

STATSGO data use information
Element Code Code Name Code Description————— ———— ———————————— –––––––––––––––––––––––––––––––––––––––––––––––month APR Apr Aprilmonth AUG Aug Augustmonth DEC Dec Decembermonth FEB Feb Februarymonth JAN Jan Januarymonth JUL Jul Julymonth JUN Jun Junemonth MAR Mar Marchmonth MAY May Maymonth NOV Nov Novembermonth OCT Oct Octobermonth SEP Sep September
mukind A Association Two or more soils with a repeatingpattern.
mukind C Consociation Seventy-five percent (75%) of map unitwithin range of taxon.
mukind U Undifferentiated Group Two or more soils that are not continuouslycoterminous.
mukind X Complex Two or more soils that cannot be mappedseperatey caused by map scale limitations.
noperm CE coprogenous earth Allowable textural code for which nopermeability is given.
noperm CEM cemented Allowable textural code for which nopermeability is given.
noperm CIND cinders Allowable textural code for which nopermeability is given.
noperm DE diotomaceous earth Allowable textural code for which nopermeability is given.
noperm FB fibric material Allowable textural code for which nopermeability is given.
noperm FRAG fragmental material Allowable textural code for which nopermeability is given.
noperm G gravel Allowable textural code for which nopermeability is given.
noperm GYP gypsiferous material Allowable textural code for which nopermeability is given.
noperm HM hemic material Allowable textural code for which nopermeability is given.
noperm ICE ice or frozen soil Allowable textural code for which nopermeability is given.

STATSGO data use information
Element Code Code Name Code Description————— ———— ———————————— –––––––––––––––––––––––––––––––––––––––––––––––noperm IND indurated Allowable textural code for which no
permeability is given.
noperm MARL marl Allowable textural code for which nopermeability is given.
noperm MPT mucky-peat Allowable textural code for which nopermeability is given.
noperm MUCK muck Allowable textural code for which nopermeability is given.
noperm PEAT peat Allowable textural code for which nopermeability is given.
noperm SG sand and gravel Allowable textural code for which nopermeability is given.
noperm SP sapric material Allowable textural code for which nopermeability is given.
noperm UNK unknown Allowable textural code for which nopermeability is given.
noperm UWB unweathered bedrock Allowable textural code for which nopermeability is given.
noperm VAR variable Allowable textural code for which nopermeability is given.
noperm WB weathered bedrock Allowable textural code for which nopermeability is given.
order A Alfisolsorder C Andisolsorder D Aridisolsorder E Entisolsorder H Histosolsorder I Inceptisolsorder M Mollisolsorder O Oxisolsorder S Spodosolsorder U Ultisolsorder V Vertisols
ordsym A no limitations or slightlimitation
ordsym C clayey soilsordsym D restricted rooting depthordsym F fragmental or skeletal soilsordsym N snow packordsym R relief or slope steepnessordsym S sandy soilsordsym T toxic substancesordsym W excessive wetnessordsym X stoniness or rockiness
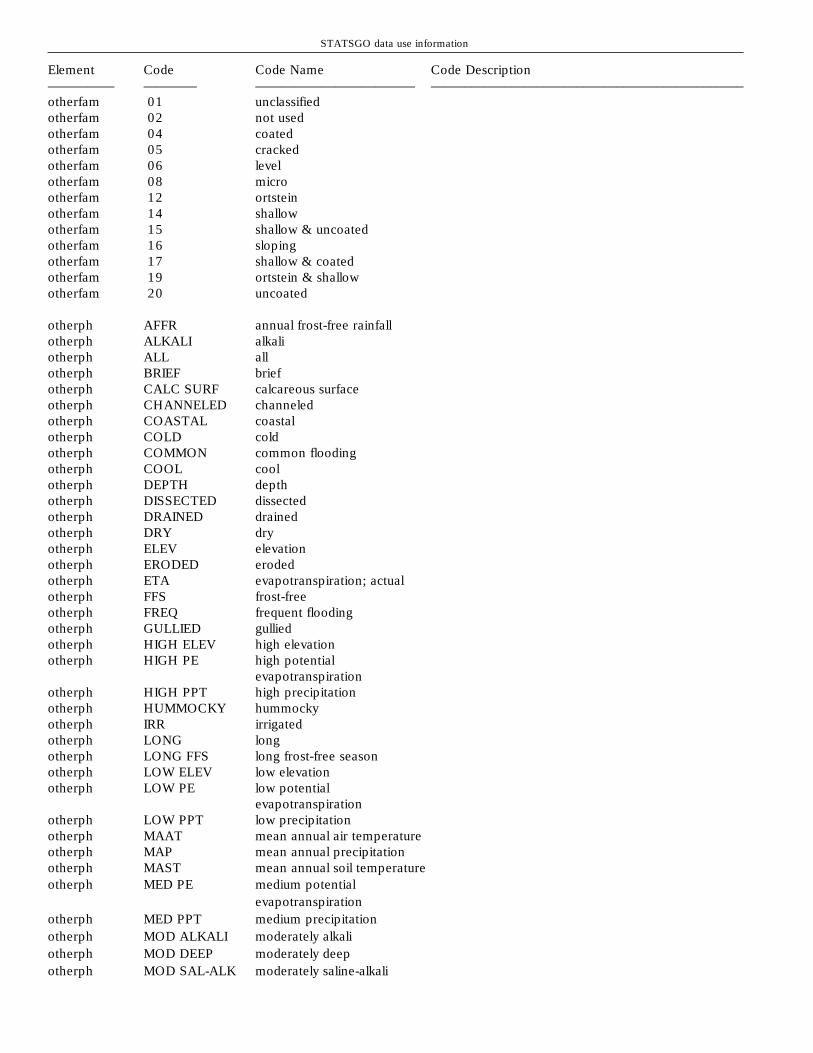
STATSGO data use information
Element Code Code Name Code Description————— ———— ———————————— –––––––––––––––––––––––––––––––––––––––––––––––otherfam 01 unclassifiedotherfam 02 not usedotherfam 04 coatedotherfam 05 crackedotherfam 06 levelotherfam 08 microotherfam 12 ortsteinotherfam 14 shallowotherfam 15 shallow & uncoatedotherfam 16 slopingotherfam 17 shallow & coatedotherfam 19 ortstein & shallowotherfam 20 uncoated
otherph AFFR annual frost-free rainfallotherph ALKALI alkaliotherph ALL allotherph BRIEF briefotherph CALC SURF calcareous surfaceotherph CHANNELED channeledotherph COASTAL coastalotherph COLD coldotherph COMMON common floodingotherph COOL coolotherph DEPTH depthotherph DISSECTED dissectedotherph DRAINED drainedotherph DRY dryotherph ELEV elevationotherph ERODED erodedotherph ETA evapotranspiration; actualotherph FFS frost-freeotherph FREQ frequent floodingotherph GULLIED gulliedotherph HIGH ELEV high elevationotherph HIGH PE high potential
evapotranspirationotherph HIGH PPT high precipitationotherph HUMMOCKY hummockyotherph IRR irrigatedotherph LONG longotherph LONG FFS long frost-free seasonotherph LOW ELEV low elevationotherph LOW PE low potential
evapotranspirationotherph LOW PPT low precipitationotherph MAAT mean annual air temperatureotherph MAP mean annual precipitationotherph MAST mean annual soil temperatureotherph MED PE medium potential
evapotranspirationotherph MED PPT medium precipitationotherph MOD ALKALI moderately alkaliotherph MOD DEEP moderately deepotherph MOD SAL-ALK moderately saline-alkali

STATSGO data use information
Element Code Code Name Code Description————— ———— ———————————— –––––––––––––––––––––––––––––––––––––––––––––––otherph MOD SALINE moderately salineotherph MOD TEMP moderate temperatureotherph MOD THICK moderately thickotherph MOD WELL DR moderately well drainedotherph MOIST moistotherph NIRR nonirrigatedotherph NONCALC SURF noncalcareous surfaceotherph NONE no floodingotherph NONERODED nonerodedotherph NONSALINE nonsalineotherph NORTH north or east aspectotherph OCCAS occasional floodingotherph OVERWASH overwashotherph PARTIALLY DR partially drainedotherph PE precipitation effectivityotherph PONDED pondedotherph POORLY DR poorly drainedotherph RANGELAND rangelandotherph RARE rare floodingotherph ROCKY rockyotherph SAL-ALK saline-alkaliotherph SALINE salineotherph SER ER severely erodedotherph SHALLOW shallowotherph SHORT FFS short frost-free seasonotherph SLI ALKALI slight alkaliotherph SLI SAL-ALK slightly saline-alkaliotherph SLI SALINE slightly salineotherph SMD soil moisture deficitotherph SOUTH south or west aspectotherph STR ALKALI strongly alkaliotherph STR SAL strongly salineotherph STR SAL-ALK strongly saline-alkaliotherph SUBIRR subirrigatedotherph SW POORLY DR somewhat poorly drainedotherph THICK thick solumotherph THICK SURF thick surfaceotherph THIN SURF thin surfaceotherph UNDRAINED undrainedotherph UNDULATING undulatingotherph V BRIEF very briefotherph V COLD very coldotherph V Long very longotherph V POORLY DR very poorly drainedotherph V ROCKY very rockyotherph V SHALLOW very shallowotherph WARM warmotherph WELL DR well drainedotherph WET wetotherph WINTER PPT winter precipitationotherph WOODLAND woodland

STATSGO data use information
Element Code Code Name Code Description————— ———— ———————————— –––––––––––––––––––––––––––––––––––––––––––––––panhard THICK Thick Cemented Pan Class - Thick — Pan is
more than 3 inches if continuously indurated andmore than 18 inches if discontinous or fractured.
panhard THIN Thin Cemented Pan Class - Thin — Pan is lessthan 3 inches if continuously indurated and less than18 inches if discontinuous or fractured.
partsize 001 unclassifiedpartsize 002 not usedpartsize 003 cinderypartsize 004 cindery over sandy or
sandy-skeletalpartsize 005 ashypartsize 006 cindery over loamypartsize 007 ashy over pumiceous or
cinderypartsize 008 ashy over loamypartsize 009 ashy-skeletalpartsize 010 medialpartsize 011 medial-skeletalpartsize 012 medial over pumiceous or
cinderypartsize 013 ashy over loamy-skeletalpartsize 014 medial over clayeypartsize 015 cindery over medial-skeletalpartsize 016 medial over fragmentalpartsize 017 cindery over medialpartsize 018 medial over loamypartsize 019 ashy over medialpartsize 020 medial over loamy-skeletalpartsize 021 ashy over sandy or
sandy-skeletalpartsize 022 medial over sandy or
sandy-skeletalpartsize 024 medial over thixotropicpartsize 026 thixotropicpartsize 027 thixotropic-skeletalpartsize 028 thixotropic over fragmentalpartsize 030 thixotropic over sandy or
sandy-skeletalpartsize 032 thixotropic over loamy-skeletalpartsize 034 thixotropic over loamypartsize 036 fragmentalpartsize 044 sandy-skeletalpartsize 046 sandy-skeletal over loamypartsize 047 sandy-skeletal over clayeypartsize 050 loamy-skeletalpartsize 051 loamy-skeletal over fragmentalpartsize 052 loamy-skeletal over sandy or
sandy-skeletalpartsize 054 loamy-skeletal over clayeypartsize 055 loamy-skeletal or clayey-skeletalpartsize 056 clayey-skeletalpartsize 058 clayey-skeletal over sandy or
sandy-skeletal

STATSGO data use information
Element Code Code Name Code Description————— ———— ———————————— –––––––––––––––––––––––––––––––––––––––––––––––partsize 062 sandypartsize 063 sandy or sandy-skeletalpartsize 064 sandy over loamypartsize 066 sandy over clayeypartsize 068 loamypartsize 072 loamy over sandy or
sandy-skeletalpartsize 080 coarse-loamypartsize 082 coarse-loamy over fragmentalpartsize 084 coarse-loamy over sandy or
sandy-skeletalpartsize 086 coarse-loamy over clayeypartsize 088 coarse-siltypartsize 090 coarse-silty over fragmentalpartsize 092 coarse-silty over sandy or
sandy-skeletalpartsize 094 coarse-silty over clayeypartsize 096 fine-loamypartsize 097 loamy over pumiceous or
cinderypartsize 098 fine-loamy over fragmentalpartsize 100 fine-loamy over sandy or
sandy-skeletalpartsize 102 fine-loamy over clayeypartsize 104 ashy over clayeypartsize 106 fine-siltypartsize 108 fine-silty over fragmentalpartsize 110 fine-silty over sandy or
sandy-skeletalpartsize 112 fine-silty over clayeypartsize 114 clayeypartsize 116 clayey over fragmentalpartsize 118 clayey over sandy or
sandy-skeletalpartsize 120 clayey over loamy-skeletalpartsize 122 clayey over fine-siltypartsize 124 clayey over loamypartsize 126 finepartsize 134 very finepartsize 136 hydrouspartsize 138 hydrous-pumiceouspartsize 140 hydrous-skeletalpartsize 142 hydrous over clayeypartsize 144 hydrous over clayey-skeletalpartsize 146 hydrous over fragmentalpartsize 148 hydrous over loamypartsize 150 hydrous over loamy-skeletalpartsize 152 hydrous over sandy or
sandy-skeletalpartsize 153 ashy-pumiceouspartsize 154 ashy over medial-skeletalpartsize 155 medial-pumiceouspartsize 158 medial over ashypartsize 160 medial over clayey-skeletal

STATSGO data use information
Element Code Code Name Code Description————— ———— ———————————— –––––––––––––––––––––––––––––––––––––––––––––––partsize 162 medial over hydrouspartsize 163 pumiceouspartsize 164 pumiceous or ashy-pumiceous
over sandy or sandy-skeletal partsize 165 pumiceous or ashy-pumiceous
over loamypartsize 166 pumiceous or ashy-pumiceous
over medial-skeletalpartsize 167 pumiceous or ashy-pumiceous
over medialpartsize 169 ashy-skeletal over fragmental
or cindery
pnddur BRIEF brief Flood Duration Class - Brief (HydricOnly) — Average duration of inundation per flood is 2to 7 days.
pnddur LONG long Flood Duration Class - Long (HydricOnly) — Average duration of inundation per flood is 7days to 1 month.
pnddur VERY very brief Flood Duration Class - Very brief (HydricBRIEF Only) — Average duration of inundation
per flood is less than 2 days.
pnddur VERY very long Flood Duration Class - Very long (HydricLONG Only) — Average duration of inundation
per flood is more than 1 month.
primfml 0 not prime farmland Not Prime Farmland.primfml 1 all areas are prime farmland All areas are prime farmland.
primfml 2 where drained Only drained areas are prime farmland.
primfml 3 where protected from Only areas protected from flooding or notflooding or not frequently frequently flooded during the growingflooded during the growing season are prime farmland.season
primfml 4 where irrigated Only irrigated areas are prime farmland.
primfml 5 where drained and Only drained areas that are eitherprotected from flooding protected from flooding or not frequentlyor not frequently flooded flooded during the growing season areduring the growing season prime farmland.
primfml 6 where irrigated and drained Only irrigated areas that have beendrained are prime farmland.
primfml 7 where irrigated and Only irrigated areas that are eitherprotected from flooding or protected from flooding or not frequentlynot frequently flooded flooded during the growing season areduring the growing season prime farmland.

STATSGO data use information
Element Code Code Name Code Description————— ———— ———————————— –––––––––––––––––––––––––––––––––––––––––––––––primfml 8 when subsoiled (completely When subsoiled (completely remove root
remove root inhibiting soil inhibiting soil layer) are prime farmland.layer)
primfml 9 irrigated area that the Only irrigated area that the product of Iproduct of I (soil erodibility) (soil erodibility) and C (climate factor)and C (climate factor) does does not exceed 60 are prime farmland.not exceed 60
rating — Null value indicatorrating 1 Fairrating 10 Favorablerating 11 Limitationrating 2 Goodrating 3 Moderaterating 4 Poorrating 5 Severerating 6 Slightrating 7 Unsuitedrating 8 Probablerating 9 Improbable
reaction 01 unclassifiedreaction 02 not usedreaction 04 acidreaction 06 allicreaction 08 dysicreaction 10 euicreaction 12 nonacidreaction 14 noncalcareous
restct – null value indicatorrestct 1 area reclaimrestct 10 dustyrestct 11 erodes easilyrestct 12 excess sodiumrestct 13 excess humusrestct 14 excess limerestct 15 excess saltrestct 16 fast intakerestct 17 favorablerestct 18 floodingrestct 19 frost actionrestct 2 cemented panrestct 20 hard to packrestct 21 large stonesrestct 22 low strengthrestct 23 no waterrestct 24 not neededrestct 25 seepagerestct 26 percs slowlyrestct 27 pipingrestct 28 poor outletsrestct 3 complex sloperestct 30 rooting depth

STATSGO data use information
Element Code Code Name Code Description————— ———— ———————————— –––––––––––––––––––––––––––––––––––––––––––––––restct 31 shrink-swellrestct 32 sloperestct 33 slow intakerestct 34 slow refillrestct 35 small stonesrestct 36 thin layerrestct 37 too clayeyrestct 38 too sandyrestct 39 unstable fillrestct 4 compressiblerestct 40 wetnessrestct 41 excess finesrestct 42 soil blowingrestct 43 permafrostrestct 44 pittingrestct 45 salty waterrestct 46 subsidesrestct 47 too acidrestct 48 pondingrestct 49 excess sulfurrestct 5 corrosiverestct 50 poor filterrestct 51 dense layerrestct 52 fragilerestct 53 slippagerestct 54 variablerestct 55 excess gypsumrestct 56 too aridrestct 6 cutbanks caverestct 7 deep to waterrestct 8 depth to rockrestct 9 droughty
rockhard HARD Hard Hardness Class - Hard — Excavationrequires blasting or special equipment.
rockhard SOFT Soft Hardness Class - Soft — Excavation can be madewith trenching machines, backhoes, or small rippers.
scl 2Cscl 2Escl 2Sscl 2Wscl 3Cscl 3Escl 3Sscl 3Wscl 4Cscl 4Escl 4Sscl 4Wscl 5Cscl 5Escl 5Sscl 5Wscl 6C
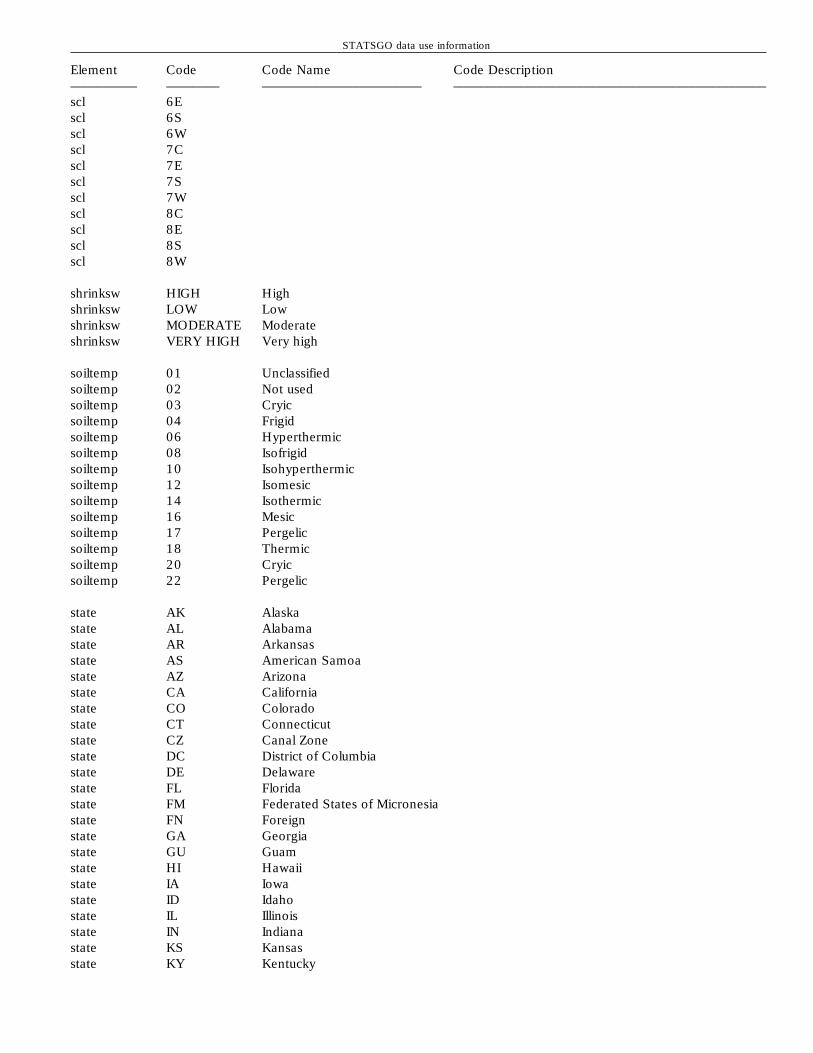
STATSGO data use information
Element Code Code Name Code Description————— ———— ———————————— –––––––––––––––––––––––––––––––––––––––––––––––scl 6Escl 6Sscl 6Wscl 7Cscl 7Escl 7Sscl 7Wscl 8Cscl 8Escl 8Sscl 8W
shrinksw HIGH Highshrinksw LOW Lowshrinksw MODERATE Moderateshrinksw VERY HIGH Very high
soiltemp 01 Unclassifiedsoiltemp 02 Not usedsoiltemp 03 Cryicsoiltemp 04 Frigidsoiltemp 06 Hyperthermicsoiltemp 08 Isofrigidsoiltemp 10 Isohyperthermicsoiltemp 12 Isomesicsoiltemp 14 Isothermicsoiltemp 16 Mesicsoiltemp 17 Pergelicsoiltemp 18 Thermicsoiltemp 20 Cryicsoiltemp 22 Pergelic
state AK Alaskastate AL Alabamastate AR Arkansasstate AS American Samoastate AZ Arizonastate CA Californiastate CO Coloradostate CT Connecticutstate CZ Canal Zonestate DC District of Columbiastate DE Delawarestate FL Floridastate FM Federated States of Micronesiastate FN Foreignstate GA Georgiastate GU Guamstate HI Hawaiistate IA Iowastate ID Idahostate IL Illinoisstate IN Indianastate KS Kansasstate KY Kentucky
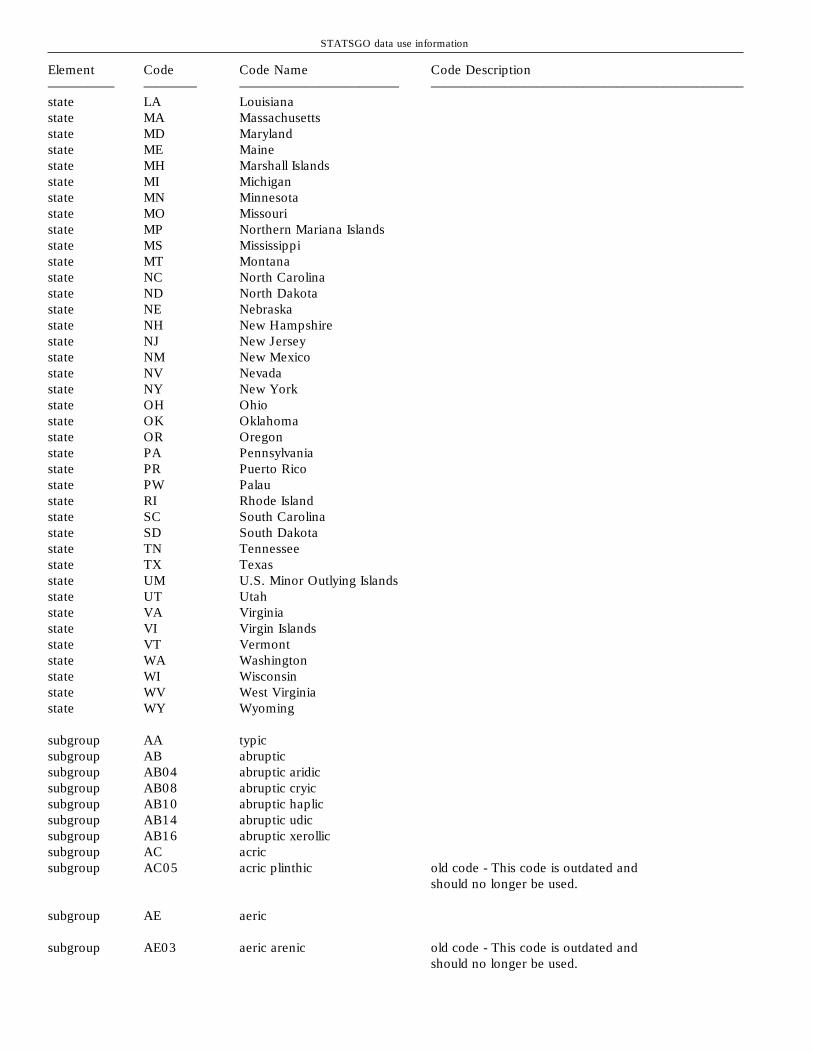
STATSGO data use information
Element Code Code Name Code Description————— ———— ———————————— –––––––––––––––––––––––––––––––––––––––––––––––state LA Louisianastate MA Massachusettsstate MD Marylandstate ME Mainestate MH Marshall Islandsstate MI Michiganstate MN Minnesotastate MO Missouristate MP Northern Mariana Islandsstate MS Mississippistate MT Montanastate NC North Carolinastate ND North Dakotastate NE Nebraskastate NH New Hampshirestate NJ New Jerseystate NM New Mexicostate NV Nevadastate NY New Yorkstate OH Ohiostate OK Oklahomastate OR Oregonstate PA Pennsylvaniastate PR Puerto Ricostate PW Palaustate RI Rhode Islandstate SC South Carolinastate SD South Dakotastate TN Tennesseestate TX Texasstate UM U.S. Minor Outlying Islandsstate UT Utahstate VA Virginiastate VI Virgin Islandsstate VT Vermontstate WA Washingtonstate WI Wisconsinstate WV West Virginiastate WY Wyoming
subgroup AA typicsubgroup AB abrupticsubgroup AB04 abruptic aridicsubgroup AB08 abruptic cryicsubgroup AB10 abruptic haplicsubgroup AB14 abruptic udicsubgroup AB16 abruptic xerollicsubgroup AC acricsubgroup AC05 acric plinthic old code - This code is outdated and
should no longer be used.
subgroup AE aeric
subgroup AE03 aeric arenic old code - This code is outdated andshould no longer be used.

STATSGO data use information
Element Code Code Name Code Description————— ———— ———————————— –––––––––––––––––––––––––––––––––––––––––––––––subgroup AE05 aeric grossarenic old code - This code is outdated and
should no longer be used.subgroup AE06 aeric humic
subgroup AE08 aeric mollic old code - This code is outdated andshould no longer be used.
subgroup AE09 aeric tropicsubgroup AE10 aeric umbricsubgroup AE12 aeric xeric old code - This code is outdated and
should no longer be used.subgroup AL albaquicsubgroup AL02 albaquulticsubgroup AL04 albicsubgroup AL08 albic glossicsubgroup AL09 albollicsubgroup AL10 alficsubgroup AL12 alfic arenicsubgroup AL13 alfic andeptic old code - This code is outdated and
should no longer be used.subgroup AL14 alfic humicsubgroup AL14 ruptic-alfic lithic old code - This code is outdated and
should no longer be used.subgroup AL16 alfic lithicsubgroup AL20 alicsubgroup AL22 alic aquicsubgroup AL24 alic pachicsubgroup AL26 alic thapticsubgroup AN andicsubgroup AN01 andeptic old code - This code is outdated and
should no longer be used.subgroup AN03 andaquic old code - This code is outdated and
should no longer be used.subgroup AN06 andic dystric old code - This code is outdated and
should no longer be used.subgroup AN08 andic epiaquic old code - This code is outdated and
should no longer be used.subgroup AN08 andic ombroaquicsubgroup AN11 andeptic glossoboric old code - This code is outdated and
should no longer be used.subgroup AN12 andic udic old code - This code is outdated and
should no longer be used.subgroup AN22 andic ustic old code - This code is outdated and
should no longer be used.subgroup AN24 andaqueptic old code - This code is outdated and
should no longer be used.subgroup AN25 anionicsubgroup AN26 anionic aquicsubgroup AN28 anthraquicsubgroup AN30 anthropicsubgroup AQ aqualficsubgroup AQ01 aquandicsubgroup AQ02 aquenticsubgroup AQ04 aquepticsubgroup AQ06 aquicsubgroup AQ07 aquic anionic old code - This code is outdated and
should no longer be used.

STATSGO data use information
Element Code Code Name Code Description————— ———— ———————————— –––––––––––––––––––––––––––––––––––––––––––––––subgroup AQ08 aquic arenicsubgroup AQ14 aquic duricsubgroup AQ16 aquic durorthidicsubgroup AQ18 aquic dystricsubgroup AQ24 aquic haplicsubgroup AQ26 aquic lithicsubgroup AQ28 aquic petroferricsubgroup AQ31 aquic psammentic old code - This code is outdated and
should no longer be used.subgroup AQ32 aquodicsubgroup AQ34 aquollicsubgroup AQ36 aquulticsubgroup AQ38 aquerticsubgroup AR arenicsubgroup AR02 arenic aridicsubgroup AR03 arenic orthoxic old code - This code is outdated and
should no longer be used.subgroup AR04 arenic plinthaquicsubgroup AR06 arenic plinthicsubgroup AR08 arenic rhodicsubgroup AR10 arenic ulticsubgroup AR14 arenic umbricsubgroup AR16 arenic ustalficsubgroup AR18 arenic ustollicsubgroup AR22 argiaquicsubgroup AR24 argiaquic xericsubgroup AR26 argicsubgroup AR27 argixerollic old code - This code is outdated and
should no longer be used.subgroup AR28 argic lithicsubgroup AR30 argic pachicsubgroup AR32 argic verticsubgroup AR33 argidic old code - This code is outdated and
should no longer be used.subgroup AR34 aridicsubgroup AR36 aridic calcicsubgroup AR42 aridic duricsubgroup AR50 aridic pachic old code - This code is outdated and
should no longer be used.subgroup AR52 aridic petrocalcicsubgroup AR54 argic usticsubgroup AX acrudoxicsubgroup AX02 acrudoxic hydricsubgroup AX03 acrudoxic plinthicsubgroup AX04 acrudoxic thapticsubgroup AX06 acrudoxic ulticsubgroup AX08 acrudoxic vitricsubgroup AX10 acraquoxicsubgroup AX12 acrustoxicsubgroup BO boralficsubgroup BO02 boralfic lithicsubgroup BO04 boralfic udicsubgroup BO06 borollicsubgroup BO08 borollic glossic

STATSGO data use information
Element Code Code Name Code Description————— ———— ———————————— –––––––––––––––––––––––––––––––––––––––––––––––subgroup BO10 borollic lithicsubgroup BO12 borollic verticsubgroup CA calcicsubgroup CA04 calcic pachicsubgroup CA05 calcic udicsubgroup CA06 calciorthidicsubgroup CA10 calcixerollicsubgroup CA20 cambicsubgroup CH chromicsubgroup CH04 chromic udicsubgroup CH06 chromudic old code - This code is outdated and
should no longer be used.subgroup CR cryicsubgroup CR10 cryic lithicsubgroup CR14 cryic pachicsubgroup CU cumulicsubgroup CU02 cumulic udicsubgroup CU04 cumulic ulticsubgroup DU durargidicsubgroup DU02 duricsubgroup DU04 duric histicsubgroup DU08 durixerollicsubgroup DU10 durixerollic lithicsubgroup DU11 durochreptic old code - This code is outdated and
should no longer be used.subgroup DU12 durorthidicsubgroup DU14 durorthidic xericsubgroup DY02 dystricsubgroup DY03 dystric enticsubgroup DY04 dystric fluventicsubgroup DY06 dystric lithicsubgroup DY08 dystropeptic old code - This code is outdated and
should no longer be used.subgroup DY09 dystric vitricsubgroup EN enticsubgroup EN02 entic lithicsubgroup EN04 entic udicsubgroup EN04 ruptic-entic lithic old code - This code is outdated and
should no longer be used.subgroup EN06 entic ulticsubgroup EP epiaquic old code - This code is outdated and
should no longer be used.subgroup EP10 epiaquic orthoxic old code - This code is outdated and
should no longer be used.subgroup EU eutricsubgroup EU02 eutrochrepticsubgroup EU04 eutropepticsubgroup EU06 eutric hydricsubgroup EU08 eutric pachicsubgroup EU10 eutric thapticsubgroup EU12 eutric vitricsubgroup FE ferrudalficsubgroup FI fibricsubgroup FI02 fibric terricsubgroup FL02 fluvaquentic

STATSGO data use information
Element Code Code Name Code Description————— ———— ———————————— –––––––––––––––––––––––––––––––––––––––––––––––subgroup FL06 fluventicsubgroup FL12 fluventic umbricsubgroup FR10 fragiaquicsubgroup FR18 fragicsubgroup GL02 glossaquicsubgroup GL04 glossicsubgroup GL10 glossic udicsubgroup GL12 glossic ustollicsubgroup GL14 glossoboralfic old code - This code is outdated and
should no longer be used.subgroup GL16 glossoboricsubgroup GR grossarenicsubgroup GR01 grossarenic enticsubgroup GR04 grossarenic plinthicsubgroup GY gypsicsubgroup HA haplaquodic old code - This code is outdated and
should no longer be used.subgroup HA01 haplaquic old code - This code is outdated and
should no longer be used.subgroup HA02 haplicsubgroup HA04 halicsubgroup HA07 haploxerollicsubgroup HA09 hapludicsubgroup HA12 hapludollic old code - This code is outdated and
should no longer be used.subgroup HA16 haplustollicsubgroup HE hemicsubgroup HE02 hemic terricsubgroup HI histicsubgroup HI02 histic lithicsubgroup HI06 histic pergelicsubgroup HU humicsubgroup HU02 humic lithic old code - This code is outdated and
should no longer be used.subgroup HU05 humic pergelicsubgroup HU06 humoxic old code - This code is outdated and
should no longer be used.subgroup HU10 humaquepticsubgroup HU15 humic rhodicsubgroup HU20 humic xanthicsubgroup HU22 humic xericsubgroup HY hydricsubgroup HY02 hydric lithicsubgroup HY04 hydric pachicsubgroup HY06 hydric thapticsubgroup HY10 hydraquenticsubgroup IN incepticsubgroup KA kandicsubgroup KA02 kandiudalficsubgroup KA04 kandiustalficsubgroup KH kanhaplicsubgroup LE lepticsubgroup LE04 leptic udicsubgroup LI limnicsubgroup LI02 lithic

STATSGO data use information
Element Code Code Name Code Description————— ———— ———————————— –––––––––––––––––––––––––––––––––––––––––––––––subgroup LI04 lithic mollicsubgroup LI05 lithic petrocalcicsubgroup LI06 lithic ruptic-alficsubgroup LI07 lithic ruptic-argicsubgroup LI08 lithic ruptic-entic old code - This code is outdated and
should no longer be used.subgroup LI08 lithic ruptic-entic xerollicsubgroup LI09 lithic ruptic-enticsubgroup LI10 lithic udic old code - This code is outdated and
should no longer be used.subgroup LI11 lithic ruptic-xerorthenticsubgroup LI12 lithic ulticsubgroup LI13 lithic ruptic-ulticsubgroup LI14 lithic umbric old code - This code is outdated and
should no longer be used.subgroup LI15 lithic ruptic-xerochrepticsubgroup LI16 lithic usticsubgroup LI18 lithic ustollicsubgroup LI20 lithic vertic old code - This code is outdated and
should no longer be used.subgroup LI22 lithic xericsubgroup LI24 lithic xerollicsubgroup MO mollicsubgroup NA06 natricsubgroup OC ochrepticsubgroup OM ombroaquicsubgroup OR orthidicsubgroup OR01 orthic old code - This code is outdated and
should no longer be used.subgroup OR02 orthoxic old code - This code is outdated and
should no longer be used.subgroup OX oxicsubgroup OX02 oxyaquicsubgroup PA pachicsubgroup PA02 pachic udicsubgroup PA04 pachic ulticsubgroup PA06 pachic vitricsubgroup PA08 paleustollic old code - This code is outdated and
should no longer be used.subgroup PA10 palexerollic old code - This code is outdated and
should no longer be used.subgroup PA20 paralithic vertic old code - This code is outdated and
should no longer be used.subgroup PE pergelicsubgroup PE01 pergelic ruptic-histicsubgroup PE02 pergelic sideric old code - This code is outdated and
should no longer be used.subgroup PE04 petrocalcicsubgroup PE06 petrocalcic ustalficsubgroup PE08 petrocalcic ustollicsubgroup PE14 petrocalcic xerollicsubgroup PE16 petroferricsubgroup PE20 petrogypsicsubgroup PK placicsubgroup PK10 plaggeptic

STATSGO data use information
Element Code Code Name Code Description————— ———— ———————————— –––––––––––––––––––––––––––––––––––––––––––––––subgroup PK12 plaggic old code - This code is outdated and
should no longer be used.subgroup PL plinthaquicsubgroup PL04 plinthicsubgroup PL06 plinthudicsubgroup PS psammaquenticsubgroup PS02 psammenticsubgroup QU quartzipsammenticsubgroup RE rendollicsubgroup RH rhodicsubgroup RU02 ruptic-alficsubgroup RU09 ruptic-lithicsubgroup RU11 ruptic-lithic-enticsubgroup RU15 ruptic-lithic-xerochrepticsubgroup RU17 ruptic-ulticsubgroup RU19 ruptic-verticsubgroup SA salorthidicsubgroup SA02 sapricsubgroup SA04 sapric terricsubgroup SI sideric old code - This code is outdated and
should no longer be used.subgroup SO sombricsubgroup SO02 sodicsubgroup SO04 sombrihumic old code - This code is outdated and
should no longer be used.subgroup SP sphagnicsubgroup SP02 sphagnic terricsubgroup SP04 spodicsubgroup SU sulficsubgroup SU02 sulfaquepticsubgroup TE terricsubgroup TH thapticsubgroup TH04 thapto-histicsubgroup TH06 thapto-histic tropicsubgroup TO torrerticsubgroup TO02 torrifluventicsubgroup TO04 torriorthenticsubgroup TO06 torripsammenticsubgroup TO10 torroxicsubgroup TR tropaquodic old code - This code is outdated and
should no longer be used.subgroup TR02 tropeptic old code - This code is outdated and
should no longer be used.subgroup TR04 tropicsubgroup U15 humic rhodic old code - This code is outdated and
should no longer be used.subgroup UD uderticsubgroup UD01 udalfic old code - This code is outdated and
should no longer be used.subgroup UD02 udicsubgroup UD03 udollicsubgroup UD05 udorthenticsubgroup UD07 udandicsubgroup UD08 udifluventicsubgroup UD10 udoxicsubgroup UL ultic

STATSGO data use information
Element Code Code Name Code Description————— ———— ———————————— –––––––––––––––––––––––––––––––––––––––––––––––subgroup UL02 ultic vitric old code - This code is outdated and
should no longer be used.subgroup UM umbrepticsubgroup UM02 umbricsubgroup US ustalficsubgroup US01 ustandicsubgroup US02 usterticsubgroup US04 usticsubgroup US05 ustivitrandicsubgroup US06 ustochrepticsubgroup US08 ustollicsubgroup US12 ustoxicsubgroup VE vermicsubgroup VE02 verticsubgroup VI vitricsubgroup VI02 vitrandicsubgroup VI04 vitrustandic old code - This code is outdated and
should no longer be used.subgroup VI06 vitritorrandicsubgroup VI08 vitrixerandicsubgroup XA xanthicsubgroup XE xeralficsubgroup XE02 xererticsubgroup XE04 xericsubgroup XE08 xerollicsubgroup XE10 xerochreptic
suborder AAQ Aqualfssuborder ABO Boralfssuborder AUD Udalfssuborder AUS Ustalfssuborder AXE Xeralfssuborder CAQ Aquandssuborder CCR Cryandssuborder CTO Torrandssuborder CUD Udandssuborder CUS Ustandssuborder CVI Vitrandssuborder CXE Xerandssuborder DAR Argidssuborder DOR Orthidssuborder EAQ Aquentssuborder EAR Arentssuborder EFL Fluventssuborder EOR Orthentssuborder EPS Psammentssuborder HFI Fibristssuborder HFO Folistssuborder HHE Hemistssuborder HSA Sapristssuborder IAN Andeptssuborder IAQ Aqueptssuborder IOC Ochreptssuborder IPL Plaggeptssuborder ITR Tropeptssuborder IUM Umbrepts

STATSGO data use information
Element Code Code Name Code Description————— ———— ———————————— –––––––––––––––––––––––––––––––––––––––––––––––suborder MAL Albollssuborder MAQ Aquollssuborder MBO Borollssuborder MRE Rendollssuborder MUD Udollssuborder MUS Ustollssuborder MXE Xerollssuborder OAQ Aquoxsuborder OHU Humoxsuborder OOR Orthoxsuborder OPR Peroxsuborder OTO Torroxsuborder OUD Udoxsuborder OUS Ustoxsuborder SAQ Aquodssuborder SCR Cryodssuborder SFE Ferrodssuborder SHU Humodssuborder SOR Orthodssuborder UAQ Aquultssuborder UHU Humultssuborder UUD Udultssuborder UUS Ustultssuborder UXE Xerultssuborder VAQ Aquertssuborder VCR Cryertssuborder VTO Torrertssuborder VUD Udertssuborder VUS Ustertssuborder VXE Xererts
suitcode E Existing Plant exists (is common) on the site.
suitcode EP Existing Potential Plant exists (is commom) on the site andhas potential for planting on the site as a tree crop.
suitcode P Potential Plant has potential as a species forplanting on the site as a tree crop.
texture APUM ashy-pumiceoustexture ASHY ashytexture ASK ashy-skeletaltexture BM bouldery muckytexture BVM very bouldery muckytexture BXM extremely bouldery muckytexture BY boulderytexture BYV very boulderytexture BYX extremely boulderytexture C claytexture CAM angular cobbly muckytexture CB cobblytexture CBA angular cobblytexture CBV very cobblytexture CBX extremely cobblytexture CE coprogenous earthtexture CEM cemented

STATSGO data use information
Element Code Code Name Code Description————— ———— ———————————— –––––––––––––––––––––––––––––––––––––––––––––––texture CIND cinderstexture CL clay loamtexture CM cobbly muckytexture CN channerytexture CNDY cinderytexture CNV very channerytexture CNX extremely channerytexture COS coarse sandtexture COSL coarse sandy loamtexture CR chertytexture CRC coarse chertytexture CRV very chertytexture CRX extremely chertytexture CVM very cobbly muckytexture CXM extremely cobbly muckytexture DE diatomaceous earthtexture FB fibric materialtexture FL flaggytexture FLV very flaggytexture FLX extremely flaggytexture FRAG fragmental materialtexture FS fine sandtexture FSL fine sandy loamtexture G graveltexture GCM coarse gravelly muckytexture GFM fine gravelly muckytexture GM gravelly muckytexture GR gravellytexture GRC coarse gravellytexture GRF fine gravellytexture GRV very gravellytexture GRX extremely gravellytexture GVM very gravelly muckytexture GXM extremely gravelly muckytexture GYP gypsiferous materialtexture HM hemic materialtexture HPUM hydrous-pumiceoustexture HSK hydrous-skeletaltexture HYDR hydroustexture ICE ice or frozen soiltexture IND induratedtexture L loamtexture LCOS loamy coarse sandtexture LFS loamy fine sandtexture LS loamy sandtexture LVFS loamy very fine sandtexture MARL marltexture MEDL medialtexture MK muckytexture MPT mucky-peattexture MPUM medial-pumiceoustexture MSK medial-skeletaltexture MUCK mucktexture PEAT peattexture PT peaty
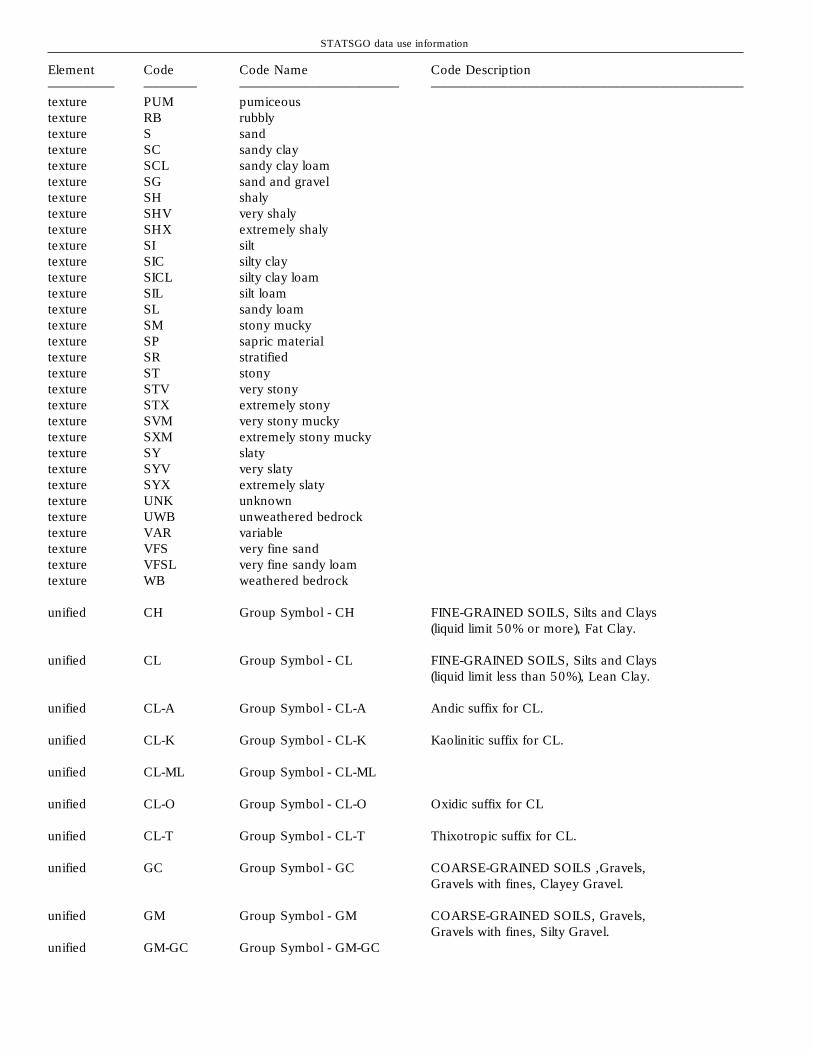
STATSGO data use information
Element Code Code Name Code Description————— ———— ———————————— –––––––––––––––––––––––––––––––––––––––––––––––texture PUM pumiceoustexture RB rubblytexture S sandtexture SC sandy claytexture SCL sandy clay loamtexture SG sand and graveltexture SH shalytexture SHV very shalytexture SHX extremely shalytexture SI silttexture SIC silty claytexture SICL silty clay loamtexture SIL silt loamtexture SL sandy loamtexture SM stony muckytexture SP sapric materialtexture SR stratifiedtexture ST stonytexture STV very stonytexture STX extremely stonytexture SVM very stony muckytexture SXM extremely stony muckytexture SY slatytexture SYV very slatytexture SYX extremely slatytexture UNK unknowntexture UWB unweathered bedrocktexture VAR variabletexture VFS very fine sandtexture VFSL very fine sandy loamtexture WB weathered bedrock
unified CH Group Symbol - CH FINE-GRAINED SOILS, Silts and Clays(liquid limit 50% or more), Fat Clay.
unified CL Group Symbol - CL FINE-GRAINED SOILS, Silts and Clays(liquid limit less than 50%), Lean Clay.
unified CL-A Group Symbol - CL-A Andic suffix for CL.
unified CL-K Group Symbol - CL-K Kaolinitic suffix for CL.
unified CL-ML Group Symbol - CL-ML
unified CL-O Group Symbol - CL-O Oxidic suffix for CL
unified CL-T Group Symbol - CL-T Thixotropic suffix for CL.
unified GC Group Symbol - GC COARSE-GRAINED SOILS ,Gravels,Gravels with fines, Clayey Gravel.
unified GM Group Symbol - GM COARSE-GRAINED SOILS, Gravels,Gravels with fines, Silty Gravel.
unified GM-GC Group Symbol - GM-GC

STATSGO data use information
Element Code Code Name Code Description————— ———— ———————————— –––––––––––––––––––––––––––––––––––––––––––––––unified GP Group Symbol - GP COARSE-GRAINED SOILS, Gravels,
Clean gravels, Poorly Graded Gravel.
unified GP-GC Group Symbol - GP-GC
unified GP-GM Group Symbol - GP-GM
unified GW Group Symbol - GW COARSE-GRAINED SOIILS, Gravels,Clean Gravels, Well-graded gravel.
unified GW-GC Group Symbol - GW-GC
unified GW-GM Group Symbol - GW-GM
unified MH Group Symbol - MH FINE-GRAINED SOILS, Silts and Clays(liquid limit 50% or more), Elastic silt.
unified MH-A Group Symbol - MH-A Andic suffix for MH.
unified MH-K Group Symbol - MH-K Kaolinitic suffix for MH.
unified MH-O Group Symbol - MH-O Oxidic suffix for MH.
unified MH-T Group Symbol - MH-T Thixotropic suffix for MH.
unified ML Group Symbol - ML FINE-GRAINED SOILS, Silts and Clays(liquid limit less than 50%), Silt.
unified ML-A Group Symbol - ML-A Andic suffix for ML.
unified ML-K Group Symbol - ML-K Kaolinitic suffix for ML.
unified ML-O Group Symbol - ML-O Oxidic suffix for ML.
unified ML-T Group Symbol - ML-T Thixotropic suffix for ML.
unified OH Group Symbol - OH FINE-GRAINED SOILS, Silts and Clays(liquid limit 50% or more), Organic Clayor Organic Silt.
unified OH-T Group Symbol - OH-T Thixotropic suffix for OH.
unified OL Group Symbol - OL FINE-GRAINED SOILS, Silts and Clays(liquid limit less than 50%), Organic Clayor Organic Silt.
unified PT Group Symbol - PT Highly organic soils, Peat.
unified SC Group Symbol - SC COARSE-GRAINED SOILS, Sands, Sandswith fines, Clayey sand.
unified SC-SM Group Symbol - SC-SM
unified SM Group Symbol - SM COARSE-GRAINED SOILS, Sands, Sandswith fines, Silty Sand.

STATSGO data use information
Element Code Code Name Code Description————— ———— ———————————— –––––––––––––––––––––––––––––––––––––––––––––––unified SM-SC Group Symbol - SM-SC
unified SP Group Symbol - SP COARSE-GRAINED SOILS, Sands, CleanSands, Poorly graded sand.
unified SP-SC Group Symbol - SP-SC
unified SP-SM Group Symbol - SP-SM
unified SW Group Symbol - SW COARSE-GRAINED SOILS, Sands, CleanSands, Well-graded sand.
unified SW-SC Group Symbol - SW-SC
unified SW-SM Group Symbol - SW-SM
unitkind FAMILY familyunitkind FAMPHS family phaseunitkind GRTGRP great groupunitkind MISC miscellaneousunitkind SERIES seriesunitkind SUBGRP subgroupunitkind SUBORD suborderunitkind VAR variant
weg 1 Wind Erodibility Group 1 Surface texture - VFS,FS,S,COS. Percentaggregates - 1, Wind erodibility index 310 t/a/y.
weg 2 Wind Erodibility Group 2 Surface texture - LVFS,LFS,LCOS,Sapricmaterial. Percent aggregates - 10, Winderodibility index - 134 t/a/y.
weg 3 Wind Erodibility Group 3 Surface texture - VFSL,FSL,SL,COSL.Percent aggregates - 25, Wind erodibilityindex - 86 t/a/y.
weg 4 Wind Erodibility Group 4 Surface Texture - C,SIC,noncalcareousCL,SICL(>35% CLAY). Percentaggregates - 25, Wind erodibility index 86 t/a/y.
weg 4L Wind Erodibility Group 4L Surface texture - calcareousL/SIL/CL,SICL. Percent aggregates - 25,Wind Erodibility index - 86 t/a/y.
weg 5 Wind Erodibility Group 5 Surface textue - noncalcareousL/SIL(<20% CLAY),SCL,SC. Percentaggregates - 40, Wind erodibility index 56 t/a/y.
weg 6 Wind Erodibility Group 6 Surface texture - noncalcareousL/SIL(>20% CLAY),CL(<35% CLAY).Percent aggregates - 45, Wind erodibilityindex - 48 t/a/y.

STATSGO data use information
Element Code Code Name Code Description————— ———— ———————————— –––––––––––––––––––––––––––––––––––––––––––––––weg 7 Wind Erodibility Group 7 Surface texture - SI,noncalcareous SICL(<35% CLAY).
Percent aggregates 50, Wind erodibility index -38 t/a/y.
weg 8 Wind Erodibility Group 8 Erosion not a problem.
wei 0wei 134wei 160wei 180wei 220wei 250wei 310wei 38wei 48wei 56wei 86
wtkind APPAR Apparent Apparent water table — Water stands in afreshly dug hole.
wtkind ARTES Artesian Artesian water table — Water with anhydrostatic head below an impermeable layer.
wtkind PERCH Perched Perched water table — Water standingabove an unsaturated zone.

STATSGO data use information
Appendix D: Value table
Column Column Precision Low HighTable Element type length value range range––––– ––––––– ––––––– –––––– –––––––– –––––– ––––––layer aashind float 3 0 0 120layer aashto char 25comp anflobeg char 3comp anflodur char 11comp anfloend char 3comp anflood char 5layer awch float 1 2 0 0.7layer awcl float 1 2 0 0.7layer bdh float 1 2 0.05 2.35layer bdl float 1 2 0.05 2.35layer caco3h int 3 0 0 110layer caco3l int 3 0 0 110layer cech float 3 1 0 400layer cecl float 3 1 0 400comp clascode char 20taxclass clascode char 20taxclass class char 120layer clayh int 3 0 0 100layer clayl int 3 0 0 100comp clirr char 1comp clnirr char 1plantnm comname char 35comp compacre int 6 0 0 999999comp compkind char 1comp compname char 35comp comppct int 3 0 1 100comp corcon char 8comp corsteel char 8compyld cropname char 30yldunits cropname char 30comp drainage char 5comp frostact char 8interp grpcode char 2taxclass grtgroup char 5comp gsflobeg char 3comp gsflodur char 11comp gsfloend char 3comp gsflood char 5layer gypsumh int 2 0 0 99layer gypsuml int 2 0 0 99comp hydgrp char 3comp hydric char 1layer inch10h int 2 0 0 99layer inch10l int 2 0 0 99layer inch3h int 2 0 0 99layer inch3l int 2 0 0 99compyld irryld float 4 2 0 9999.99layer kfact float 0 2

STATSGO data use information
Column Column Precision Low HighTable Element type length value range range––––– ––––––– ––––––– –––––– –––––––– –––––– ––––––layer kffact float 0 2layer laydeph int 2 0 0 99layer laydepl int 2 0 0 99layer layerid int 3 0layer layernum int 2 0layer llh int 3 0 0 999layer lll int 3 0 0 999taxclass minalogy char 2mapunit mlra char 4mapunit muacres int 6 0 0 999999comp muid char 8compyld muid char 8forest muid char 8interp muid char 8layer muid char 8mapunit muid char 8plantcom muid char 8rsprod muid char 8windbrk muid char 8wlhabit muid char 8woodland muid char 8woodmgt muid char 8mapunit mukind char 1mapunit muname char 130comp musym char 5mapunit musym char 5compyld nirryld float 4 2 0 9999.99layer no10h int 3 0 0 100layer no10l int 3 0 0 100layer no200h int 3 0 0 100layer no200l int 3 0 0 100layer no40h int 3 0 0 100layer no40l int 3 0 0 100layer no4h int 3 0 0 100layer no4l int 3 0 0 100layer omh float 3 1 0 100layer oml float 3 1 0 100taxclass order char 1woodmgt ordsym char 3 0 50taxclass otherfam char 2comp otherph char 40comp pandeph int 2 0 0 72comp pandepl int 2 0 0 72comp panhard char 5taxclass partsize char 3layer permh float 2 2 0 63layer perml float 2 2 0 63layer phh float 2 1 2 11layer phl float 2 1 2 11layer pih int 2 0 0 130layer pil int 2 0 0 130forest plantcov int 3 0 0 100plantcom plantpct int 3 0 0 100forest plantsym char 8

STATSGO data use information
Column Column Precision Low HighTable Element type length value range range––––– ––––––– ––––––– –––––– –––––––– –––––– ––––––plantcom plantsym char 8plantnm plantsym char 8windbrk plantsym char 8woodland plantsym char 8comp pndbeg char 3comp pnddeph float 2 1 -6 6comp pnddepl float 2 1 -6 6comp pnddur char 11comp pndend char 3mapunit primfml char 1rsprod prodfav int 5 0 0 20000rsprod prodnorm int 5 0 0 20000rsprod produnfv int 5 0 0 20000interp rating char 2taxclass reaction char 2interp restct1 char 2interp restct2 char 2interp restct3 char 2comp rockdeph int 2 0 0 99comp rockdepl int 2 0 0 99comp rockhard char 5rsprod rsid char 10rsprod rsname char 100comp s5id char 6layer s5id char 6layer salinh int 3 0 0 999layer salinl int 3 0 0 999layer sarh float 3 0 0 999layer sarl float 3 0 0 999plantnm sciname char 45comp sclirr char 2comp sclnirr char 2comp seqnum int 1 0compyld seqnum int 1 0forest seqnum int 1 0interp seqnum int 1 0layer seqnum int 1 0plantcom seqnum int 1 0rsprod seqnum int 1 0windbrk seqnum int 1 0wlhabit seqnum int 1 0woodland seqnum int 1 0woodmgt seqnum int 1 0layer shrinksw char 9woodland sitind int 3 0 15 250comp slopeh int 3 0 0 999comp slopel int 3 0 0 999taxclass soiltemp char 2mapunit ssaid char 3 1 999comp stssaid char 5compyld stssaid char 5forest stssaid char 5interp stssaid char 5layer stssaid char 5

STATSGO data use information
Column Column Precision Low HighTable Element type length ralue range range––––– ––––––– ––––––– –––––– –––––––– –––––– ––––––mapunit stssaid char 5plantcom stssaid char 5rsprod stssaid char 5windbrk stssaid char 5wlhabit stssaid char 5woodland stssaid char 5woodmgt stssaid char 5taxclass subgroup char 4comp subinith int 2 0 0 99comp subinitl int 2 0 0 99taxclass suborder char 3comp subtoth int 2 0 0 99comp subtotl int 2 0 0 99woodland suitcode char 2comp surftex char 8layer texture char 26layer tfact int 1 0 1 5layer unified char 20woodmgt wdequip char 8woodmgt wderosn char 8woodmgt wdplant char 8woodmgt wdseed char 8woodmgt wdwind char 8layer weg char 2layer wei int 3 0wlhabit wlconif char 9wlhabit wlgrain char 9wlhabit wlgrass char 9wlhabit wlhard char 9wlhabit wlherb char 9wlhabit wlopen char 9wlhabit wlrange char 9wlhabit wlshlwat char 9wlhabit wlshrub char 9wlhabit wlwet char 9wlhabit wlwetplt char 9wlhabit wlwood char 9windbrk wndbrkht int 2 0 1 99woodland woodprod int 2 0 0 50comp wtbeg char 3comp wtdeph float 2 1 -6 6comp wtdepl float 2 1 -6 6comp wtend char 3comp wtkind char 5yldunits yldunits char 9