statistics interval estimation. statistics in practice food lion is one of the largest supermarket...
Post on 19-Dec-2015
216 views
TRANSCRIPT
Statistics
Interval Estimation

STATISTICS in PRACTICE
Food Lion is one of the largest supermarket chains in the USA.
Food Lion establishes a LIFO (Last in First Out) index for each of seven inventory pools: Grocery, Paper/Household,
Pet Supplies, Health & Beauty Aids, Dairy, Cigarette/Tobacco, and Beer/Wine.

STATISTICS in PRACTICE Using a 95% confidence level, Food Lion computed a margin of error of .006 for the sample estimate of LIFO index. The interval from 1.009 to 1.021 provided a 95% confidence interval estimate of the population LIFO index. This level of precision was judged to be
very good.

Interval Estimation
Population Mean: s Known Population Mean: s Unknown Determining the Sample Size Population Proportion

A point estimator cannot be expected to provide the exact value of the population parameter. An interval estimate can be computed by adding and subtracting a margin of error to the point estimate.
Point Estimate +/- Margin of Error
The purpose of an interval estimate is to provide information about how close the point estimate is to the value of the parameter.
Margin of Error and the Interval Estimate

The general form of an interval estimate of a population mean is
Margin of Errorx
Margin of Error and the Interval Estimate

Interval Estimation of a Population Mean: s Known
In order to develop an interval estimate of a population mean, the margin of error must be computed using either:
the population standard deviation s , or
the sample standard deviation s s is rarely known exactly, but often a good
estimate can be obtained based on historical data or other information.
We refer to such cases as the s known case.
There is a 1 - probability that the value of a sample mean will provide a margin of error of or less.
Interval Estimation of a Population Mean: s Known
xZ σα/2

/2/2 /2/21 - of all values1 - of all valuesx
Sampling distribution of
Sampling distribution of x
x
z x /2z x /2
Interval Estimation of a Population Mean: s Known
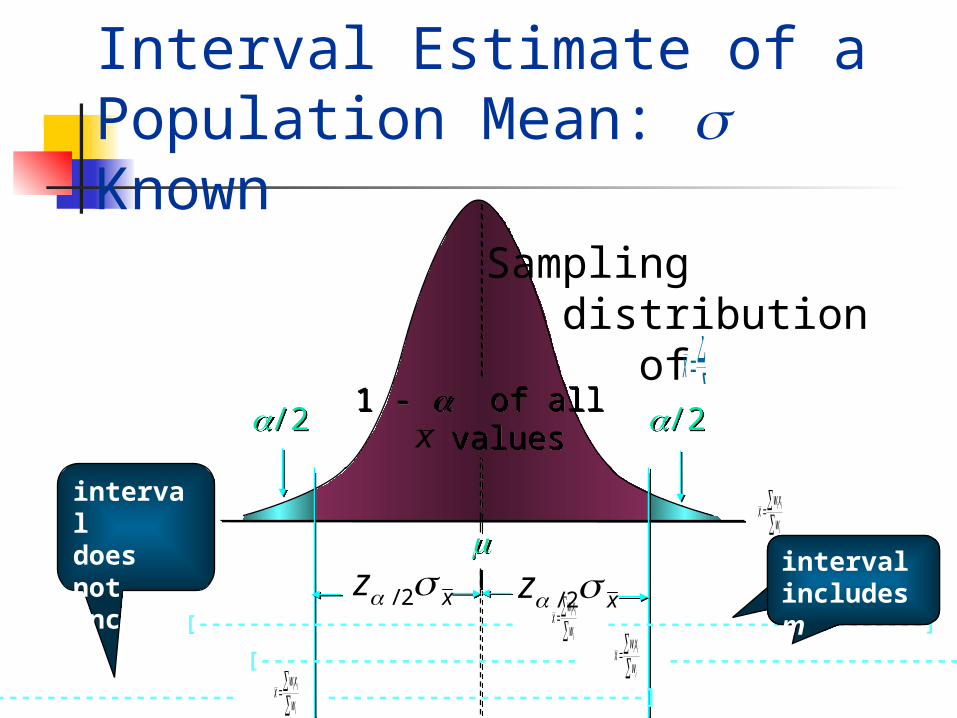
/2/2 /2/21 - of all values1 - of all valuesx
Sampling distribution of
[------------------------- -------------------------]
[------------------------- -------------------------]
[------------------------- -------------------------]
intervaldoes notinclude m interval
includes mintervalincludes m
Interval Estimate of a Population Mean: s Known
xz 2/ xz 2/
i i
i
wxx
w
i i
i
wxx
w
i i
i
wxx
w
i i
i
wxx
w
i i
i
wxx
w

Interval Estimate of a Population Mean: s Known
Interval Estimate of m x zn
/2
where: is the sample mean1 - is the confidence coefficientz/2 is the z value providing an area of
/2 in the upper tail of the standard normal probability distribution s is the population standard deviation n is the sample size
i i
i
wxx
w

Confidence Levels Values of for the Most Commonly
Used Confidence Levels.2/z
Interval Estimate of a Population Mean: s Known
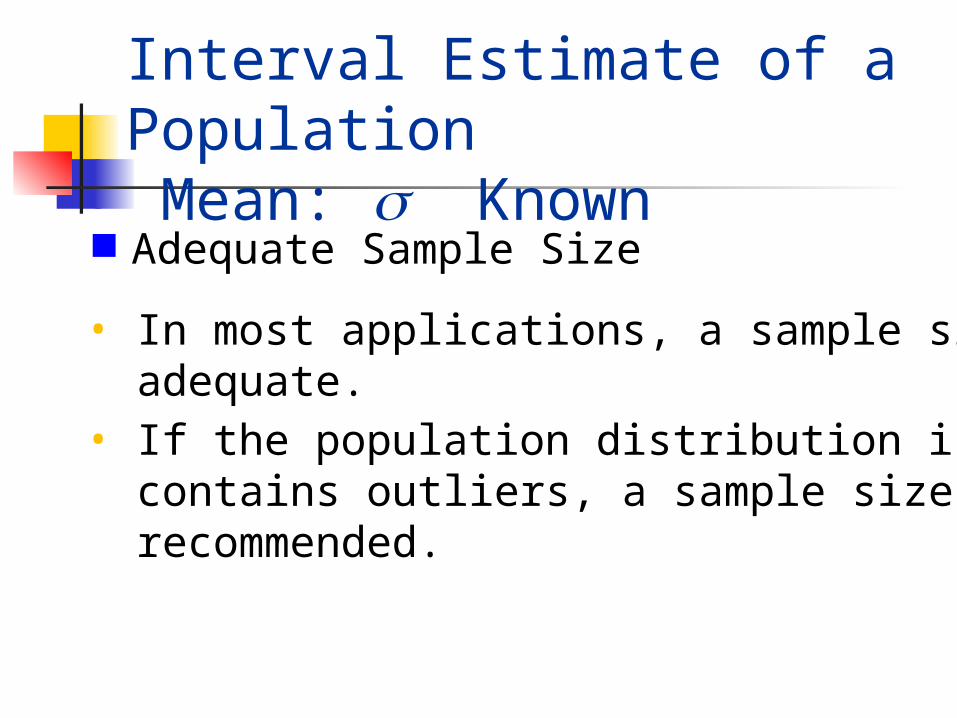
Adequate Sample Size
• In most applications, a sample size of n = 30 is adequate.• If the population distribution is highly skewed or contains outliers, a sample size of 50 or more is recommended.
Adequate Sample Size (continued)
If the population is believed to be at least approximately normal, a sample size of less than 15 can be used.
If the population is not normally distributed but is roughly symmetric, a sample size as small as 15 will suffice.
Interval Estimate of a Population Mean: s Known

S
D
Interval Estimate of Population Mean: Known
Example: Discount Sounds
Discount Sounds has 260 retail outlets throughout the United States. The firmis evaluating a potential location for anew outlet, based in part, on the meanannual income of the individuals inthe marketing area of the new location.

S
D
Interval Estimate of Population Mean: Known
Example: Discount Sounds
A sample of size n = 36 was taken;the sample mean income is $31,100. Thepopulation is not believed to be highly skewed.
The population standard deviation is estimated to be $4,500, and the confidence coefficient to be used in the interval estimate is .95.

95% of the sample means that can be observed
are within + 1.96 of the population mean . x
The margin of error is:
/ 2
4,5001.96 1,470
36z
n
Thus, at 95% confidence, the margin of error is $1,470.
SDInterval Estimate of Population
Mean: Known

Interval estimate of is:
Interval Estimate of Population Mean: Known
SD
We are 95% confident that the interval contains
the population mean.
$31,100 + $1,470or$29,630 to $32,570

Interval Estimation of a Population Mean: s Unknown
If an estimate of the population standard deviation s cannot be developed prior to sampling, we use the sample standard deviation s to estimate s .
This is the s unknown case. In this case, the interval estimate for m is
based on the t distribution. (We’ll assume for now that the population is
normally distributed.)
The t distribution is a family of similar probability distributions.
t Distribution
A specific t distribution depends on a parameter known as the degrees of freedom. Degrees of freedom refer to the number of independent pieces of information that go into the computation of s.
t Distribution
A t distribution with more degrees of freedom has less dispersion. As the number of degrees of freedom increases, the difference between the t distribution and the standard normal probability distribution becomes smaller and smaller.

t Distribution
Standardnormaldistribution
t distribution(20 degreesof freedom)t distribution(10 degrees of freedom)0
z, t

t Distribution Table
For Areas in the Upper Tail

For more than 100 degrees of freedom, the standard normal z value provides a good approximation to the t value. The standard normal z values can be found in the infinite degrees ( ) row of the t distribution table.
t Distribution

Degrees Area in Upper Tail
of Freedom .20 .10 .05 .025 .01 .005
. . . . . . .
50 .849 1.299 1.676 2.009 2.403 2.678
60 .848 1.296 1.671 2.000 2.390 2.660
80 .846 1.292 1.664 1.990 2.374 2.639
100 .845 1.290 1.660 1.984 2.364 2.626
.842 1.282 1.645 1.960 2.326 2.576
Standard normalz values
t Distribution

Interval Estimate
x tsn
/2
where: 1 - = the confidence coefficient
= the t value providing an area of in the upper tail of a t distribution with n - 1 degrees of freedom s = the sample standard deviation
Interval Estimation of a Population Mean:s Unknown
/2 t/2
A reporter for a student newspaper
is writing an article on the cost
of off-campus housing.
A sample of 16 efficiency apartments within ahalf-mile of campus resulted in a sample mean
of $650 per month and a sample standard deviation of $55.
Interval Estimation of a Population Mean: s Unknown
Example: Apartment Rents

At 95% confidence, = .05, and /2 = .025.
In the t distribution table we see that t.025 = 2.131.
t.025 is based on n - 1 = 16 - 1 = 15 degrees
of freedom.
Interval Estimation of a Population Mean: s Unknown
Degrees Area in Upper Tail
of Freedom .20 .100 .050 .025 .010 .005
15 .866 1.341 1.753 2.131 2.602 2.947
16 .865 1.337 1.746 2.120 2.583 2.921
17 .863 1.333 1.740 2.110 2.567 2.898
18 .862 1.330 1.734 2.101 2.520 2.878
19 .861 1.328 1.729 2.093 2.539 2.861
. . . . . . .
Interval Estimation of a Population Mean: s Unknown

x tsn
.025
We are 95% confident that the mean rent per monthfor the population of efficiency apartments within ahalf-mile of campus is between $620.70 and $679.30.
Interval Estimate
55650 2.131 650 29.30
16
Interval Estimation of a Population Mean: s Unknown
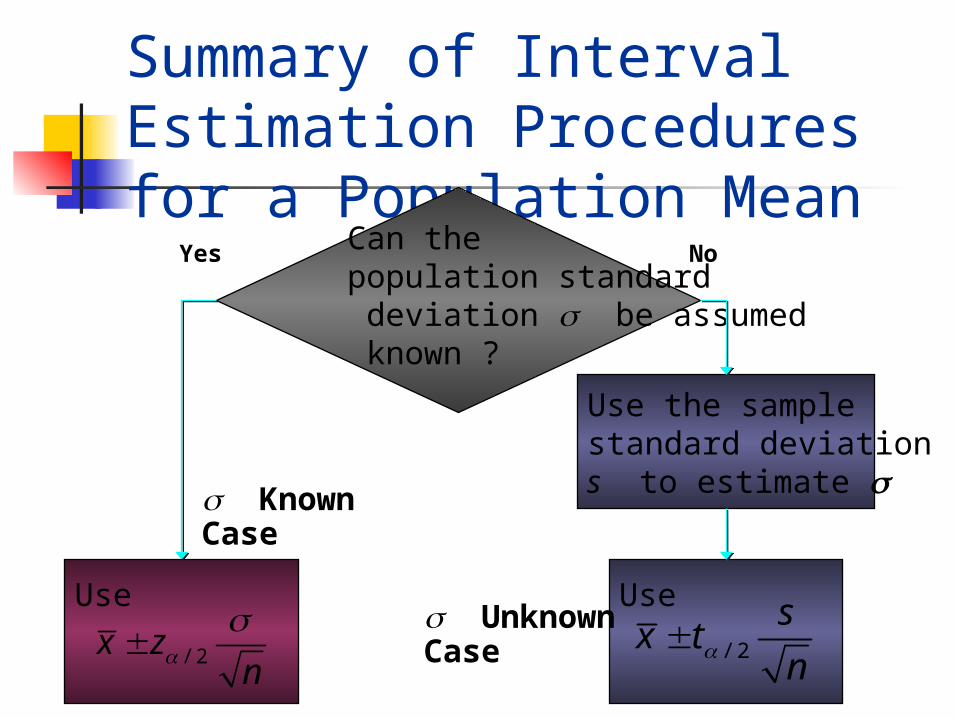
Summary of Interval Estimation Procedures for a Population Mean
Can thepopulation standard deviation s be assumed known ?
Use the samplestandard deviations to estimate s
Use
Yes No
/ 2
sx t
nUse
/ 2x zn
s KnownCase
s UnknownCase
Let E = the desired margin of error.
E is the amount added to and subtracted from the point estimate to obtain an interval estimate.
Sample Size for an Interval Estimate of a Population Mean

Sample Size for an Interval Estimate of a Population Mean
E zn
/2
nz
E
( )/ 22 2
2
Margin of Error
Necessary Sample Size (rounding up to the next integer value)

Sample Size for an Interval Estimateof a Population Mean
Necessary Sample Size, if is Unknown 1. Use the estimate of the population standard deviation computed of previous studies as
the planning value for .2. Use a pilot study to select a preliminary sample. The sample standard deviation from
the preliminary sample can be used as the planning value for .

Sample Size for an Interval Estimateof a Population Mean
3. Use judgment or a “best guess” for the value of .
For example, the range divided by 4 is often suggested as a rough approximation of the standard deviation and thus an acceptable planning value for .
Recall that Discount Sounds is evaluating a potential location for a new retail outlet, based in part, on the mean annual income of the individuals
inthe marketing area of the new location.
Suppose that Discount Sounds’ management team wants an estimate of the population mean such that there is a .95 probability that the sampling
error is $500 or less. How large a sample size is needed
to meet the required precision?
Sample Size for an Interval Estimateof a Population Mean
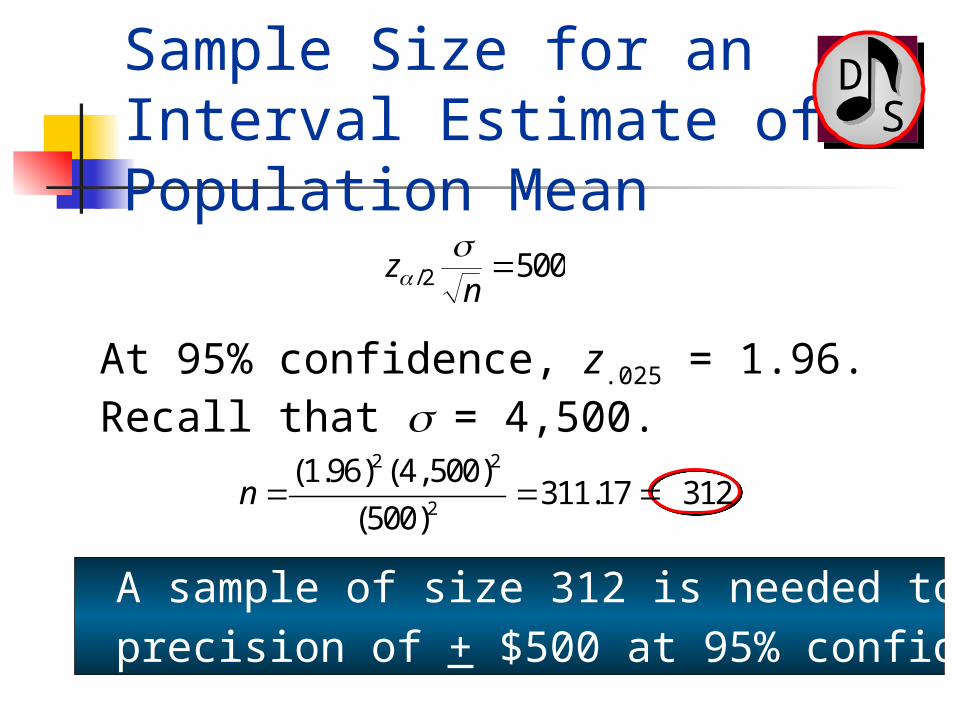
At 95% confidence, z.025 = 1.96. Recall that = 4,500.
zn
/2 500
2 2
2
(1.96) (4,500)311.17 312
(500)n
Sample Size for an Interval Estimate of a Population Mean
SD
A sample of size 312 is needed to reach a desired
precision of + $500 at 95% confidence.

The general form of an interval estimate of a population proportion is
Margin of Errorp
Interval Estimationof a Population Proportion

Interval Estimationof a Population Proportion
The sampling distribution of plays a key role in computing the margin of error for this interval estimate.
p
The sampling distribution of can be approximated by a normal distribution whenever np > 5 and n(1 – p) > 5.
p

/2/2 /2/2
Interval Estimationof a Population Proportion
Normal Approximation of Sampling Distribution
of p Samplingdistribution of
Samplingdistribution of p
(1 )p
p p
n
ppp
/ 2 pz / 2 pz
1 - of all values1 - of all valuesp

where: is the confidence coefficient
is the z value providing an area of
in the upper tail of the standard
normal probability distribution
is the sample proportion
where: is the confidence coefficient
is the z value providing an area of
in the upper tail of the standard
normal probability distribution
is the sample proportion
Interval Estimationof a Population Proportion
Interval Estimate
p zp p
n
/( )
21
α/2
α1
p
α/2Z

Political Science, Inc. (PSI)specializes in voter polls andsurveys designed to keeppolitical office seekers
informed of their position in a race.
Using telephone surveys, PSI interviewers ask registered voters who they would vote for if the election were held that day.
Interval Estimationof a Population Proportion
Example: Political Science, Inc.
In a current election campaign, PSI has just found that 220registered voters, out of 500contacted, favor a particular
candidate.PSI wants to develop a 95%
confidence interval estimate for the proportion of the population of registered voters that favor the candidate.
Interval Estimationof a Population Proportion
Example: Political Science, Inc.
p zp p
n
/
( )2
1
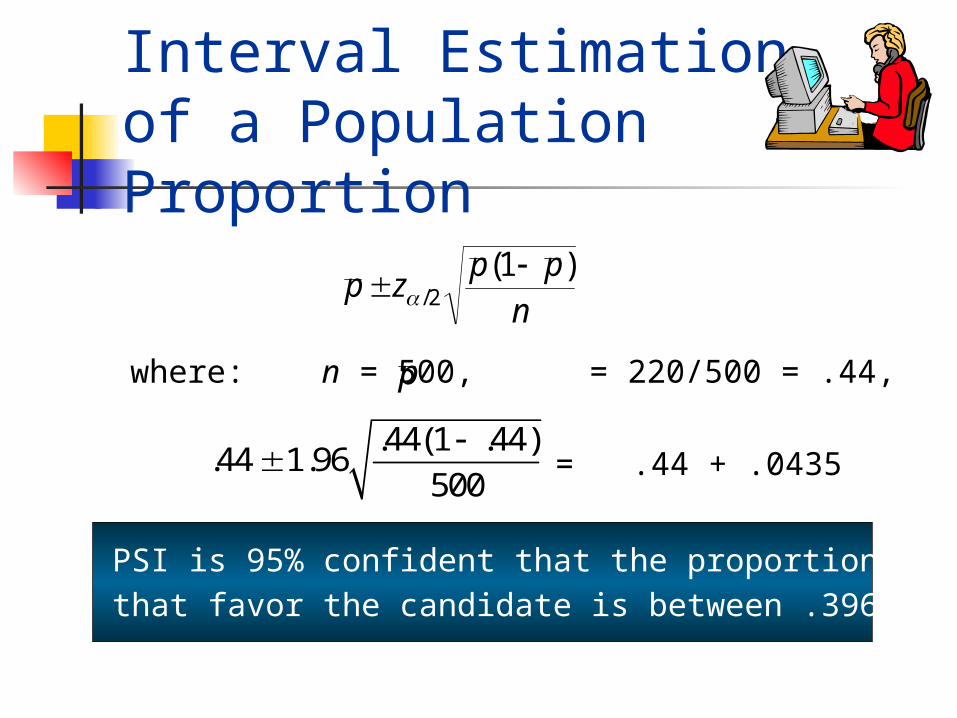
where: n = 500, = 220/500 = .44, z/2 = 1.96p
Interval Estimationof a Population Proportion
PSI is 95% confident that the proportion of all voters
that favor the candidate is between .3965 and .4835.
.44(1 .44).44 1.96
500
= .44 + .0435

Solving for the necessary sample size, we get
Margin of Error
Sample Size for an Interval Estimate of a Population Proportion
/ 2
(1 )p pE z
n
2/ 2
2
( ) (1 )z p pn
E
However, will not be known until after we have selected the sample. We will use the planning value
p* for .
p
p
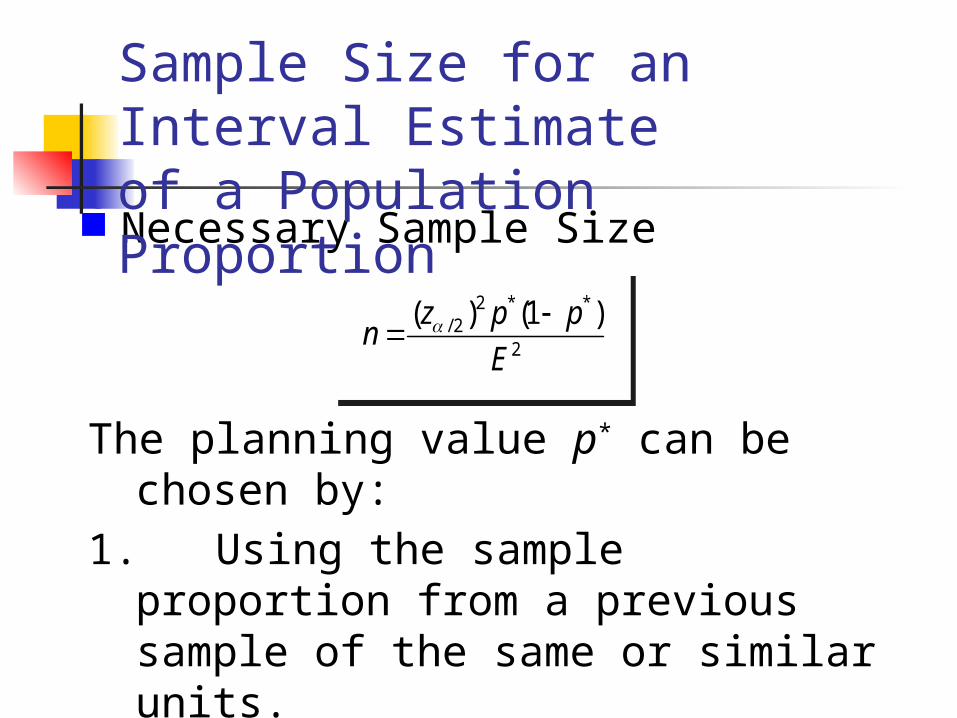
The planning value p* can be chosen by:
1. Using the sample proportion from a previous sample of the same or similar units.
2 * */ 2
2
( ) (1 )z p pn
E
Necessary Sample Size
Sample Size for an Interval Estimateof a Population Proportion
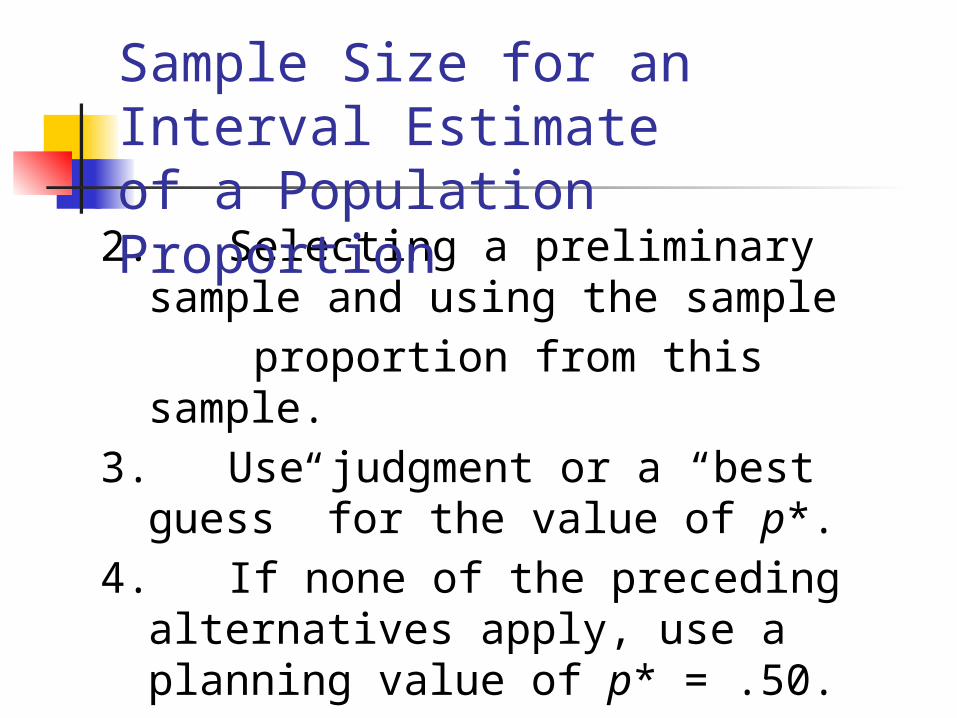
2. Selecting a preliminary sample and using the sample
proportion from this sample.
3. Use judgment or a “best guess” for the value of p*.
4. If none of the preceding alternatives apply, use a planning value of p* = .50.
Sample Size for an Interval Estimateof a Population Proportion
Sample Size for an Interval Estimateof a Population Proportion
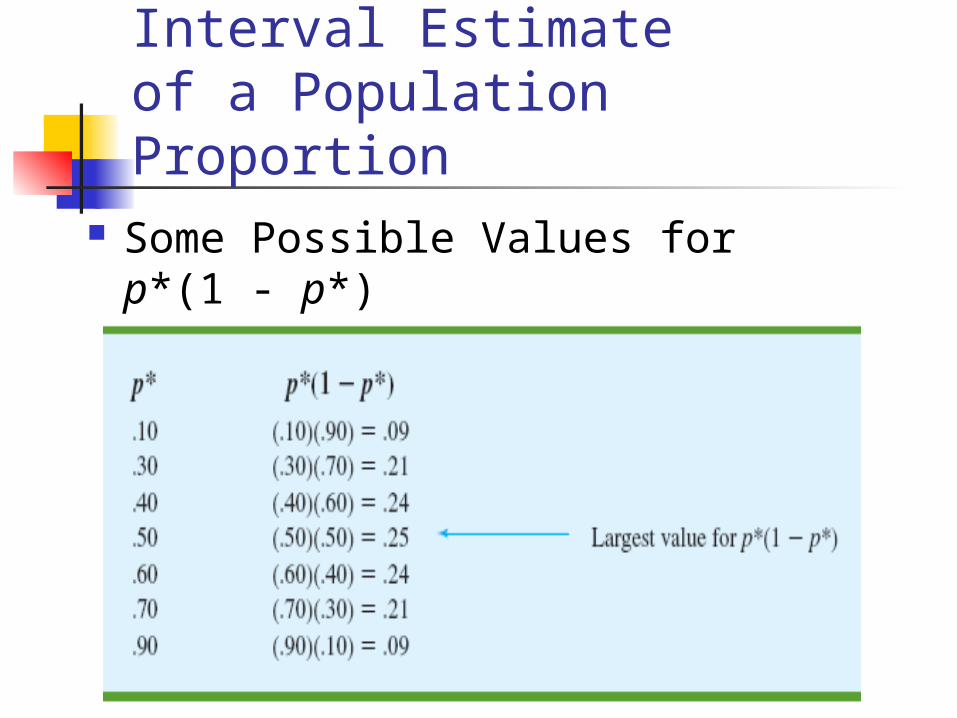
Some Possible Values for p*(1 - p*)
Suppose that PSI would like a .99 probability that the sample proportion is within + .03 of the population proportion.
How large a sample size is needed to meet the required precision? (A previous sample of similar units yielded .44 for the sample proportion.)
Sample Size for an Interval Estimate of a Population Proportion

At 99% confidence, z.005 = 2.576. Recall that = .44.
p
2 2/ 2
2 2
( ) (1 ) (2.576) (.44)(.56) 1817
(.03)
z p pn
E
A sample of size 1817 is needed to reach a desired precision of + .03 at 99% confidence.
/ 2
(1 ).03
p pz
n
Sample Size for an Interval Estimate of a Population Proportion

Note: We used .44 as the best estimate of p in the preceding expression. If no information is available about p, then .5 is often assumed because it provides the highest possible sample size. If we had used p = .5, the recommended n would have been 1843.
Sample Size for an Interval Estimate of a Population Proportion