statistics in psychology using r and spss (rasch/statistics in psychology using r and spss) ||...
TRANSCRIPT

P1: OTA/XYZ P2: ABCJWST094-c01 JWST094-Rasch September 22, 2011 11:59 Printer Name: Yet to Come
1
Concept of the book
In this chapter, the structure of the book and accordingly the didactic concept are presentedto the reader. Moreover, we outline an example that will be used in several chapters in orderto demonstrate the analytical methods described there.
In six sections this book conveys the methods of the scientific discipline of ‘statistics’ that arerelevant for studies in psychology:
I. Introduction (Chapters 1 to 4)
II. Descriptive statistics (Chapter 5)
III. Inferential statistics for a single character (Chapters 6 to 10)
IV. Descriptive and inferential statistics for two characters (Chapter 11)
V. Inferential statistics for more than two characters (Chapters 12 and 13)
VI. Theory building statistical procedures (Chapters 14 and 15).
Chapter 1 explains the concept underlying our presentation of the methods. Furthermorean empirical example that will be used as an illustration in various parts of the book isprovided.
Chapter 2 will demonstrate that quantifying and measuring in psychology is not onlypossible but also very useful. In addition we would like to give the reader an understandingof the strategy of gaining knowledge in psychology as a science; the approach however issimilar to other scientific fields, which is why this book can be used in other fields too.
In Chapter 3 we will address the issue that empirical research is performed in severalsteps. For all scientific questions that are supposed to be answered by the study (as diverseas they might be regarding contents), exact planning, careful collecting of data, and adequateanalysis are always needed.
Statistics in Psychology Using R and SPSS, First Edition. Dieter Rasch, Klaus D. Kubinger and Takuya Yanagida.© 2011 John Wiley & Sons, Ltd. Published 2011 by John Wiley & Sons, Ltd.

P1: OTA/XYZ P2: ABCJWST094-c01 JWST094-Rasch September 22, 2011 11:59 Printer Name: Yet to Come
4 CONCEPT OF THE BOOK
Within this context we wish the reader to realize that a study does not always have toinclude all the people that the research question is directed at. Out of practical reasons, mostof the time only part of the group of interest can be examined; this part is usually calledsample, whereas the group of interest is called the population. Chance plays an importantrole here. It will be shown that we have to make probability statements for the results of thestatistical analysis; the probability calculus used for this is only valid for events for whoseoccurrence (or non-occurrence) chance is responsible. For example, a certain event might bethat a specific person is part of the study in question. We will treat this topic in Chapter 4, aswell as in Chapter 7. Since ‘chance’ often has a different meaning in everyday use as opposedto its general meaning in statistics and therefore in this book, we will point out at this earlystage that a random event is not necessarily a rare or unanticipated event.
Finally, if data concerning one or more person(s) or character(s) that are of interesthave been gathered within the framework of the study, they have to be processed statisti-cally. The data in their totality are too unmanageable to be able to draw conclusions fromthem that are relevant for answering the scientific question. Therefore, special methods ofdata compression are necessary. We will deal with this issue in Chapter 5. The decisionof which one of these methods is applicable or most appropriate is substantially basedon the type of data: for example, whether they have been derived from physical measure-ments or whether they can only express greater/less than and equal to relations. In thelatter case it is important to use methods that have been specially developed for this typeof data.
Mathematical-statistical concepts are needed, especially for the generalization of studyresults; these will be introduced in Chapter 6. For readers who are unpracticed in the use offormulas, this chapter is surely difficult, although we try to formulate as simply as possible.
If the generalization of the study results is the aim, then a prerequisite for the use ofappropriate methods is that the collected samples are random samples; information on thistopic can be found in Chapter 7.
In Chapter 8 an introduction to statistical inference, in particular the principle of hypothesistesting, will be given. Because of the fact that random samples are used, it is necessary to takerandom deviations of the sample data from the population into account. Through hypothesesthat have been formulated before data collection we try to find out as to what extent thesedeviations are systematic or can/must be traced back to chance. The aim is to either accept orreject a hypothesis based on the empirical data.
Chapter 9 pursues a similar objective, but this time the focus is on two populations thatare compared with each other.
The implied separation between planning, data collection, and analysis is true for theclassic procedure for empirical studies. In this book, however, we also want to promotea sequential approach. Thereby the gradual collection of data is constantly interrupted byan analysis. This leads to a process that looks like this: observe–analyze–observe–analyze. . .; this goes on until a predetermined level of precision is reached. This procedure is alsodescribed in Chapters 8 and 9.
Special methods are needed in studies that examine a certain character of the researchunit (which in psychology often is a person or a group of persons) not only under constantconditions but also under varying conditions or when the study includes more than two popu-lations. In Chapter 10 we cover situations where there are three or more different conditionsor two or three treatment factors, with at least two values of each (treatment or factor levels).

P1: OTA/XYZ P2: ABCJWST094-c01 JWST094-Rasch September 22, 2011 11:59 Printer Name: Yet to Come
CONCEPT OF THE BOOK 5
In psychological research hardly ever is only one character used. If more than one characterper person is observed, then a certain connection between them may exist; we refer here tostatistical relationships. If these relationships are of interest, then the statistical methodsdescribed primarily in Chapter 11 are needed.
If there really are relationships between several characters – or if there is reason to thinkso – then one needs very special methods for comparing several populations. Chapters 12 and13 describe these.
Finally Chapters 14 and 15 give an introduction into theory-building techniques thatestablish or test models regarding content.
The appendix of the book is split into three parts: Part A lists the data of Example 1.1which will be illustrated below, and in part B one can find tables, helpful for some analyses;often it is faster and more convenient to look up a value than to calculate it with the helpof some software. Appendix C contains a summary of the symbols and abbreviations. Acomplete list of references and a subject index are given at the end of the book.
SummaryWe assume that empirical studies always yield data regarding at least one character. Optimally,planning takes place prior to any study. Data are used to answer a specific question. Statisticsas a scientific discipline provides the methods needed for this.
The diverse statistical methods that are recommended in this book and which can be used foranswering the research questions posed by psychology as a science are often only practicablewhen using a computer. Therefore we refer to two software packages in this book. Theprogram package R is both freely accessible and very efficient; that is why we continuouslyuse R here. However, since in psychology the program package IBM SPSS Statistics is stillpreferred for statistical analyses most of the time, it will also be illustrated using the examples.The appropriate use of such packages is not trivial; that is why the necessary procedures willbe demonstrated by the use of numerical examples. The reader can recalculate everything andpractice their use.
The program package R can be used for the planning of a study, for the statistical analysisof the data and for graphical presentation. It is an adaptation of the programming language Sthat has been developed since 1976 by John Chambers and colleagues in the Bell Laboratories(belonging to Alcatel-Lucent). The functionality of R can be enhanced through freely availablepackages by everybody and at will, and also special statistical methods and some proceduresof C and Fortran can be implemented. Packages that already exist are being made availablein standardized archives (repositories). The most well-known archive to be mentioned hereis CRAN (Comprehensive R Archive Network), a server network that is serviced by the RDevelopment Core Team. With the distribution of R, the number of R packages has increasedexponentially: whereas there were 110 packages available on CRAN in June 2001, therewere 2496 in September 2010. R is available, free, for Windows, Linux and Apple. With fewexceptions, there are implementations for all statistical methods in R. With the means of therecently built package OPDOE (see Rasch, Pilz, Verdooren & Gebhardt, 2011), it is possible,for the first time, to statistically plan studies or to calculate the optimal number of examinationobjects and also to successively collect and analyze data in R.
The program package R is available for free at http://cran.r-project.org/ for the operat-ing systems Linux, MacOS X and Windows. The installation under Microsoft Windows is

P1: OTA/XYZ P2: ABCJWST094-c01 JWST094-Rasch September 22, 2011 11:59 Printer Name: Yet to Come
6 CONCEPT OF THE BOOK
initiated via the link ‘Windows’, from where the link ‘base’, which leads to the installationwebsite, must be chosen. The setup file can be downloaded under ‘Download R 2.X.X forWindows’ (where X stands for the current version number). After executing this file, one islead through the installation by a setup assistant. For the uses described in this book all thestandard settings can be applied. SPSS as a commercial product must be acquired by purchase;normally universities offer inexpensive licenses for students. More on R can be found underwww.r-project.org, and on SPSS under www.spss.com. In order not to unnecessarily pro-long the explanation of the operational sequence in R or SPSS, we always assume thatthe respective program package, as well as the file that will be used, are already at handand open.
In R the input window opens after starting the program; the prompt is in red: ‘>’. Herecommands can be entered and run by pressing the enter button. The output is displayedin blue right below the command line. If the command is incomplete, a red ‘+’ will ap-pear in the next line in order to complete the command or to cancel the current commandinput by pressing the Esc button. An instruction sequence is displayed as in the followingexample:
> cbind(sub1_t1.tab, sub1_t1.per, sub1_t1.cum)
or also as
> cbind(sub1_t1.tab,+ sub1_t1.per,+ sub1_t1.cum)
or also as
> cbind(sub1_t1.tab,+ sub1_t1.per,+ sub1_t1.cum)
A special working environment in R is the Workspace. Several (calculation-) objects thathave been created in the current session with R can be saved in there. These objects includeresults of calculations (single scores, tables, etc.) and also data sets. A workspace can beloaded with the sequence
File - Load Workspace. . .
For all the examples presented in this book the reader can download the Workspace‘RaKuYa.RData’ from the website www.wiley.com/go/statisticsinpsychology.
Since there are more data sets in our Workspace, the scores of single researchunits/persons have to be accessed by specifying the data set with a ‘$’; for example:Example_1.1$native_language. A useful alternative for the access is the

P1: OTA/XYZ P2: ABCJWST094-c01 JWST094-Rasch September 22, 2011 11:59 Printer Name: Yet to Come
CONCEPT OF THE BOOK 7
command attach(), which makes the desired data set generally available; for example:attach(Example_1.1). To minimize repetition, in the instruction sequences giventhroughout the book, we assume that the attach() command has already been run andtherefore the relevant data set is active. For some examples we need special R packages; theymust be installed once via the menu Packages - Install Package(s). . . and thenloaded for every session in R with the command library(). The installation of packagesis done via the menu
Packages - Install Package(s). . .
In SPSS the desired data frame can be opened via File – Open – Data. . . after starting theprogram. Then we write the instruction sequence as in SPSS handbooks; for example likethis
AnalyzeDescriptive Statistics
Frequencies. . .
For all examples in the book the reader can find the data in the SPSS folder 'RaKuYa' on thewebsite www.wiley.com/go/statisticsinpsychology.
For figures that are shown as the results of the calculations for the examples, we use eitherthe one from SPSS or the one from R. Only if the graphs differ between R and SPSS will wepresent both.
It is the concept of this textbook to present illustrative examples with content – that can berecalculated – from almost all subject areas concerning the planning and statistical analysisof psychological studies. A lot of the methods described in this book will be demonstratedusing one single data set in order to not have to explain too many psychological problems.This will be introduced in Example 1.1.
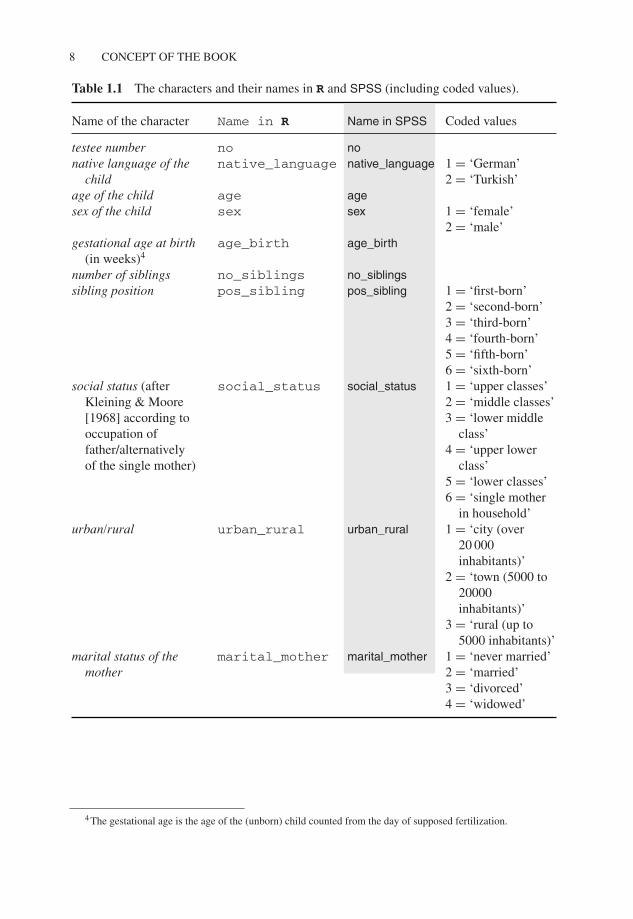
Example 1.1 The goal is to test the fairness of a popular natural-language intelligence testbattery with reference to children with Turkish native language1,2 (see Kubinger, 2009a3).
The following characters were observed per child (see Table 1.1 and the data sheet in AppendixA; then see, for R, the respective data structure in Figure 1.1, and for SPSS the screen shotshown in Figure 1.2).
1 Fairness is a specific quality criterion of psychological assessment methods (tests). A psychological test meetsthe requirement of fairness if the resulting test scores don’t lead to a systematic discrimination of specific testees: forexample because of sex, ethnic, or socio-cultural affiliation; see Kubinger, 2009b).
2 The data originally applied to German-speaking countries; however, there was no socio-political difference whenthe data in the following analyses were interpreted as relating to English-speaking countries and some ethnic-minoritygroups.
3 Due to copyright reasons the original data had to be slightly modified; therefore no deductions regarding contentcan be drawn from the data found in the data sheet in the appendix.
P1: OTA/XYZ P2: ABCJWST094-c01 JWST094-Rasch September 22, 2011 11:59 Printer Name: Yet to Come
8 CONCEPT OF THE BOOK
Table 1.1 The characters and their names in R and SPSS (including coded values).
Name of the character Name in R Name in SPSS Coded values
testee number no nonative language of the
childnative_language native_language 1 = ‘German’
2 = ‘Turkish’age of the child age agesex of the child sex sex 1 = ‘female’
2 = ‘male’gestational age at birth
(in weeks)4age_birth age_birth
number of siblings no_siblings no_siblingssibling position pos_sibling pos_sibling 1 = ‘first-born’
2 = ‘second-born’3 = ‘third-born’4 = ‘fourth-born’5 = ‘fifth-born’6 = ‘sixth-born’
social status (afterKleining & Moore[1968] according tooccupation offather/alternativelyof the single mother)
social_status social_status 1 = ‘upper classes’2 = ‘middle classes’3 = ‘lower middle
class’4 = ‘upper lower
class’5 = ‘lower classes’6 = ‘single mother
in household’urban/rural urban_rural urban_rural 1 = ‘city (over
20 000inhabitants)’
2 = ‘town (5000 to20000inhabitants)’
3 = ‘rural (up to5000 inhabitants)’
marital status of themother
marital_mother marital_mother 1 = ‘never married’2 = ‘married’3 = ‘divorced’4 = ‘widowed’
4 The gestational age is the age of the (unborn) child counted from the day of supposed fertilization.

P1: OTA/XYZ P2: ABCJWST094-c01 JWST094-Rasch September 22, 2011 11:59 Printer Name: Yet to Come
CONCEPT OF THE BOOK 9
Table 1.1 (Continued)
Name of the character Name in R Name in SPSS Coded values
test setting test_set test_set 1 = ‘Germanspeaking child’
2 = ‘Turkishspeaking childtested in Germanat first test date’
3 = ‘Turkishspeaking childtested in Turkishat first test date’
Everyday Knowledge, 1sttest date (T-Scores)5
sub1_t1 sub1_t1
Applied Computing, 1sttest date (T-Scores)
sub3_t1 sub3_t1
Social and MaterialSequencing, 1st testdate (T-Scores)
sub4_t1 sub4_t1
ImmediatelyReproducing –numerical, 1st testdate (T-Scores)
sub5_t1 sub5_t1
Coding and Associating,1st test date(T-Scores)
sub7_t1 sub7_t1
Everyday Knowledge,2nd test date(T-Scores)
sub1_t2 sub1_t2
Applied Computing, 2ndtest date (T-Scores)
sub3_t2 sub3_t2
Social and MaterialSequencing, 2nd testdate (T-Scores)
sub4_t2 sub4_t2
ImmediatelyReproducing –numerical, 2nd testdate (T-Scores)
sub5_t2 sub5_t2
Coding and Associating,2nd test date(T-Scores)
sub7_t2 sub7_t2
5 Test scores are generally standardized to a certain scale; T-Scores are a very common method of standardization.

P1: OTA/XYZ P2: ABCJWST094-c01 JWST094-Rasch September 22, 2011 11:59 Printer Name: Yet to Come
10 CONCEPT OF THE BOOK
Figure 1.1 Representation of the data structure of Example 1.1 in R.
In order to illustrate some statistical procedures we need other examples regarding content, butthe data for these examples will not be found in Appendix A due to space limitations; howeverthey are provided in the aforementioned Workspace and SPSS folders respectively. For therecalculation of the examples as well as for later calculations with the reader’s own data, wewill also provide the R instruction sequences, so that they don’t have to be typed out. Theycan be found on the website www.Wiley.com. For beginners in R these are simply listed inorder in a PDF file; for those readers already experienced in the use of R they are in a syntaxeditor for R; that is, Tinn-R (www.sciviews.org/Tinn-R/).

P1: OTA/XYZ P2: ABCJWST094-c01 JWST094-Rasch September 22, 2011 11:59 Printer Name: Yet to Come
REFERENCES 11
Figure 1.2 Part of the data view of Example 1.1 in SPSS.
References
Kleining, G. & Moore, H. (1968). Soziale Selbsteinstufung (SSE): Ein Instrument zur Messung sozialerSchichten [Social Self-esteem (SEE): An Instrumnet for Measuring the Social Status]. KolnerZeitschrift fur Soziologie und Sozialpsychologie, 20, 502–552.
Kubinger, K. D. (2009a). Adaptives Intelligenz Diagnostikum - Version 2.2 (AID 2) samt AID 2-Turkisch[Adaptive Intelligence Diagnosticum, AID 2-Turkey Included]. Gottingen: Beltz.
Kubinger, K. D. (2009b). Psychologische Diagnostik – Theorie und Praxis psychologischen Diagnos-tizierens (2nd edn) [Psychological Assessment – Theory and Practice of Psychological Consulting].Gottingen: Hogrefe.
Rasch, D., Pilz, J., Verdooren, R. L., & Gebhardt, A. (2011). Optimal Experimental Design with R. BocaRaton: Chapman & Hall/CRC.