statistics day 4 displaying categorical data. do now act question act #9,10,13,14
TRANSCRIPT

Statistics Day 4
Displaying Categorical Data

Do Now
� Act question
ACT #9,10,13,14

Quick review
� Qualitative/Categorical vs Quantitative
� 1) Preferred TV show� 2) Number of tried cases� 3) Nationality� 4) Height� 5) Cost� 6) Race number
Categorical
Categorical
Quantitative
Quantitative
Quantitative
Categorical

Agenda
� ALL ABOUT DISPLAYING CATEGORICAL DATA� If you did your homework and read the
chapter, you will not be lost� Frequency tables and Relative Frequency� Bar charts� Pie Charts� Contingency Tables� Segmented Bar Charts

Different Categorical Displays
� Let’s take a look at our class data again…� Which of the variables are categorical?
�

Displaying Categorical Data
� How many students are Mexican? How did you determine this?
� Is there an easier way to present this data to get at the information quicker?

Frequency Tables� Frequency Table:� Showing the frequency (how many times) a
category is chosen
� Relative Frequency Table:� Showing the category’s frequency in percentage
(relative to the total)
� [Distribution: shows the variables and their frequencies (how the data is distributed)]
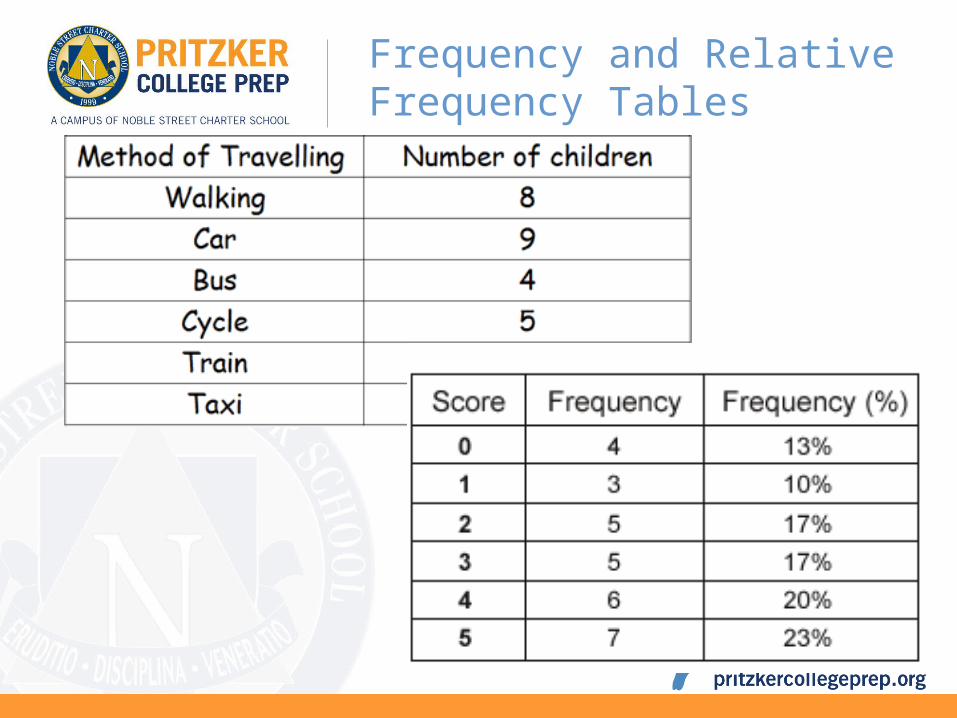
Frequency and Relative Frequency Tables

Contingency TablesStill measures frequency distribution or relative frequencyIt represents multiple categorical variables with the
total

Marginal Distribution
� Marginal distributions: the sum totals in the table• in a table with 2 variables• looking at the totals (in the margins) of a single variable

Conditional Distribution
� Conditional Distribution: shows the distribution for a sub-population that has a characteristic you are interested in
� (it’s selective information in the middle)

Importance of Relativity
1) What percent of the class is male?2) What percent of the class is conservative?3) What percent of males is conservative?4) What percent of all students in the class are males who are
conservatives?5) What percent of all females in the class are conservative? Liberal?
Moderate?6) What percent of all males in the class are conservative? Liberal?
Moderate?7) Are there more males or females who are liberal? Moderate?
Conservative? Does this represent the data?
Politics in Intro Stats
Liberal Moderate Conservative
Total
Female 35 36 6 77
Male 50 44 21 115
Total 85 80 27 192
BECAUSE THERE ARE NOT AN EVEN AMOUNT OF MALES to FEMALES, RELATIVE FREQUENCY IS
IMPORTANT

Independence
Independence: There is no association between the variables - they do not affect each other
How can we tell? Use the relative contingency table
Politics in Intro Stats
Liberal Moderate Conservative Total
Female 35 36 6 77
Male 50 44 21 115
Total 85 80 27 192
Is gender independent of political orientation? If I were to put the names in a hat and pull one out, would the persons gender affect the likelihood of the person being a certain orientation?

Bar Charts, Relative Frequency Bar Chart, and Pie Charts
� A way to graphically show frequency and relative frequency
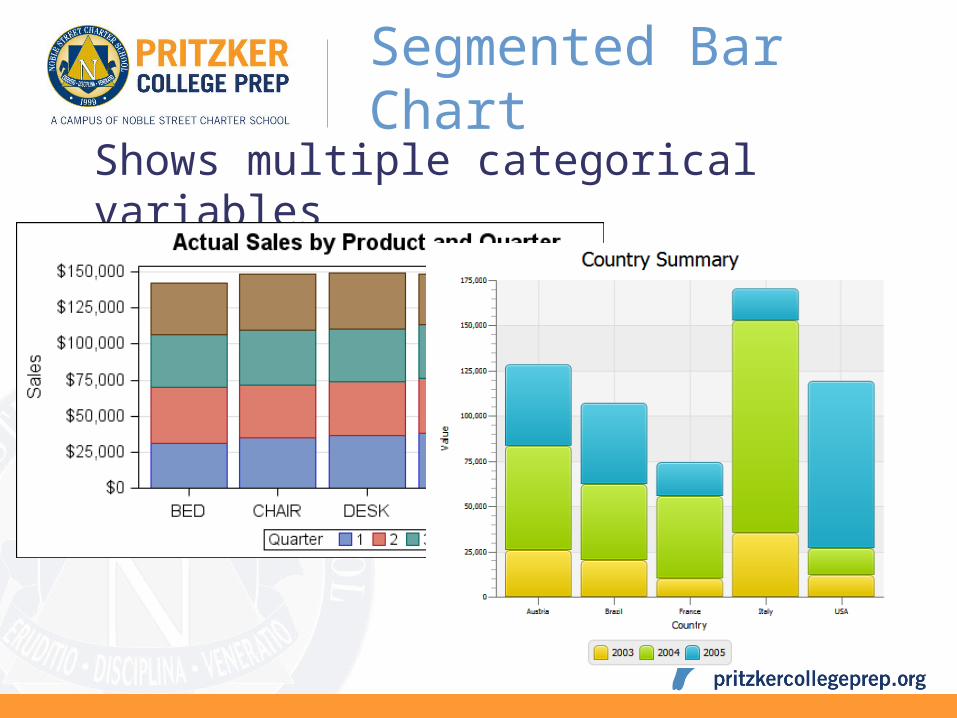
Segmented Bar Chart� Shows multiple categorical variables

Issues with Graphs
� Area Principle- be careful not to misrepresent
� -the area should be proportional

Issues with Graphs� Simpson’s Paradox: a misrepresentation of averages- when the
combined average shows a different trend than the individualized groups of data
� Teacher Test 1 Score Test 2 Score Total(%)
(Mr Selan) /50= /200=
(Ms Shein) /100= /20=

Activity
� A random sample of 16 Pritzker kids were surveyed on their likes and dislikes
• The data is provided• In pairs, decide on what you want to
compare/know/study about this sample• Create two different displays of the provided data
• Frequency/relative frequency tables• Pie charts• Bar charts• Contingency tables• Segmented Bar charts

Displaying Categorical DataAge Gender Sports Video Games Drawing Driving
14 M Y Y N N
15 F Y Y Y N
15 M Y Y N N
15 M N Y Y N
16 F N N N N
17 F N N Y Y
17 M Y N N Y
18 F Y N Y Y
18 F N N N N
18 M Y Y Y Y
17 M N Y N Y
17 M Y Y Y N
14 F Y Y Y N
14 F N N Y N

Activity
� Smoking and Education

Homework
� Ch.3 #5-9,14,19,20,23,27