statistics david kilgour
Post on 22-Dec-2015
217 views
TRANSCRIPT
Statistics
Statistics
David Kilgour
http://www.avyg86.dsl.pipex.com/research.htm

Statistics 2
Learning Objectives
Understand and be able to distinguish different meanings and uses of the word ‘statistics’;
Be able to describe the nature of statistics as a scientific discipline;
Be aware of the fact that statistics can be presented and used in misleading ways, unintentionally or even intentionally;
Appreciate the importance of statistics in science and in society in general;
Appreciate the need for statistics in a business and finance environment.

Statistics 3
Goals
After completing this note, you should be able to:
Explain key definitions: Population vs. Sample Primary vs. Secondary Data
Parameter vs. Statistic Descriptive vs. Inferential Statistics
Describe key data collection methods Describe different sampling methods
Probability Samples vs. Nonprobability Samples
Select a random sample using a random numbers table Identify types of data and levels of measurement Describe the different types of survey error
Statistics 4
Meaning of Statistics
The word ‘statistics’ has a few different (but related) meanings, and is used in different ways, depending on the context.
Most people have heard of statistics in the context of football, cricket or political opinion polls.

Statistics 5
What Is Statistics?
Why? 1. Collecting Data
e.g. Survey
2. Presenting Data e.g., Charts & Tables
3. Characterizing Data e.g., Average
Data Analysis
Decision-Making
© 1984-1994 T/Maker Co.

Statistics 6
Some Application Areas
Accounting Auditing Costing
Finance Financial Trends Forecasting
Management Describe Employees Quality Improvement
Marketing Consumer Preferences Marketing Mix Effects

Statistics 7
Statistical Methods
StatisticalMethods
DescriptiveStatistics
InferentialStatistics
Statistics 8
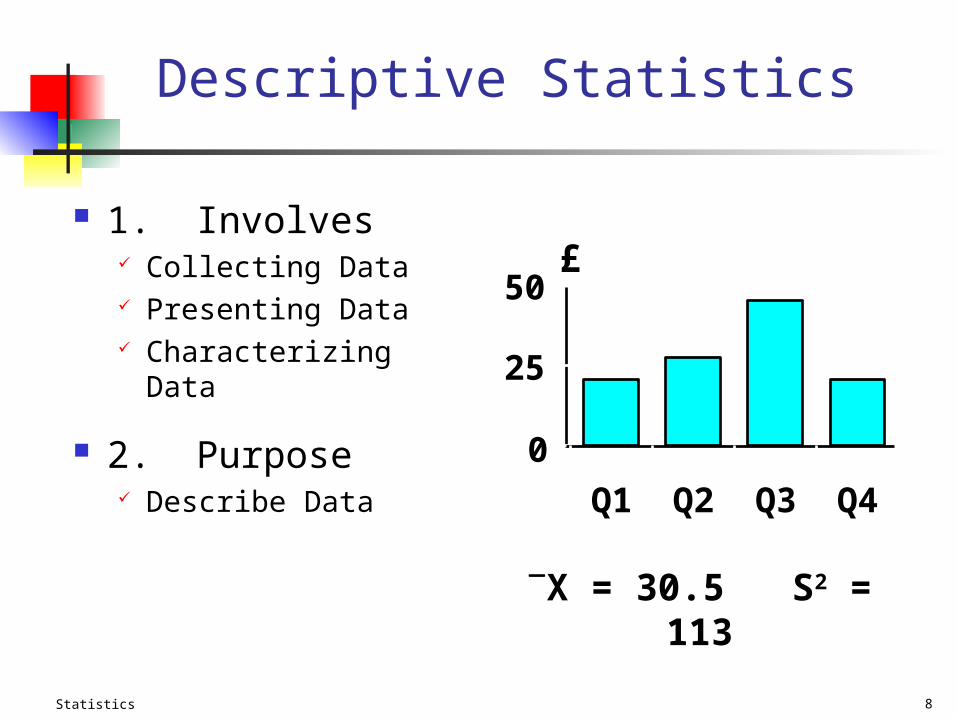
Descriptive Statistics
1. Involves Collecting Data Presenting Data Characterizing Data
2. Purpose Describe Data
X = 30.5 S2 = 113
0
25
50
Q1 Q2 Q3 Q4
£
Statistics 9
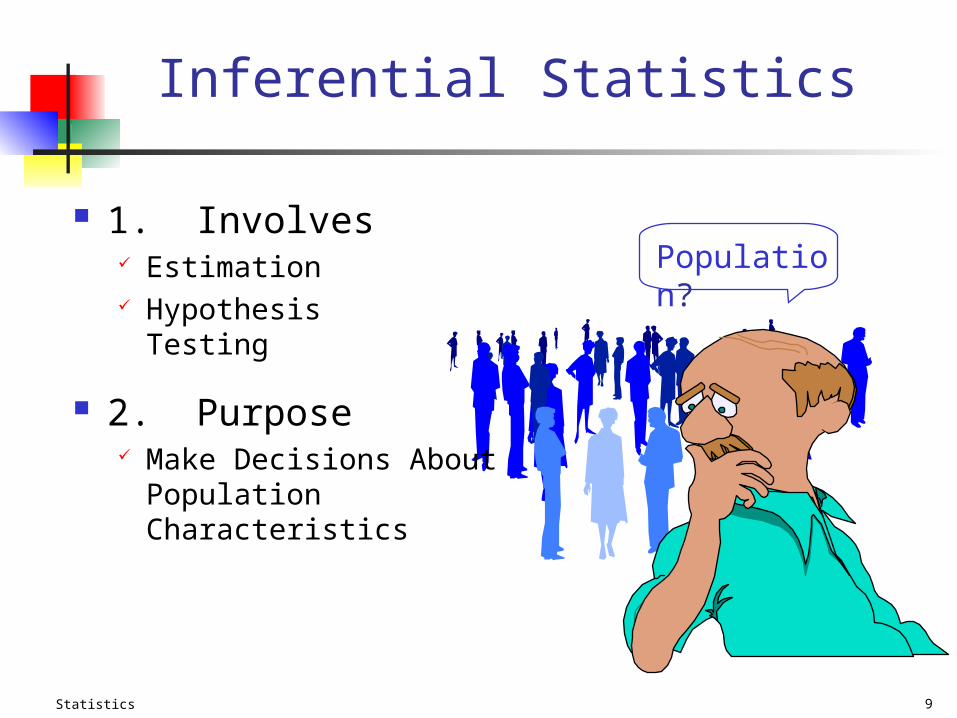
Inferential Statistics
1. Involves Estimation Hypothesis
Testing
2. Purpose Make Decisions About
Population Characteristics
Population?
Statistics 10
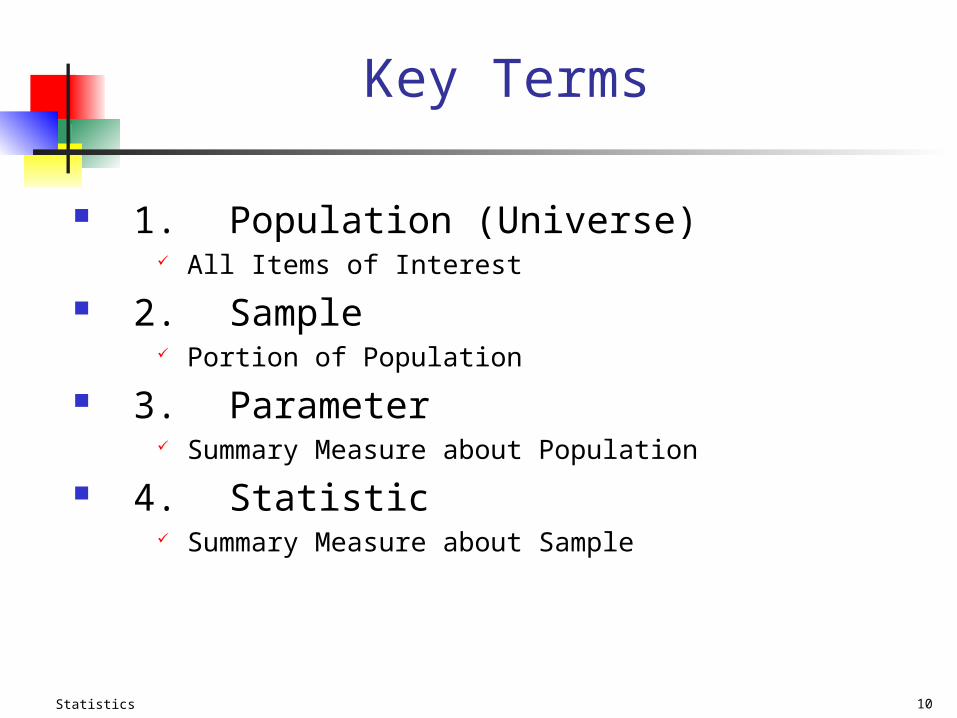
Key Terms
1. Population (Universe) All Items of Interest
2. Sample Portion of Population
3. Parameter Summary Measure about Population
4. Statistic Summary Measure about Sample

Statistics 11
Statistical Studies
StatisticalStudies
EnumerativeStudy
AnalyticalStudy

Statistics 12
Enumerative Study
1. Involves Decision Making about a Population Frame is Listing of All
Population Units e.g., Names in Telephone
Book
2. e.g., Political Poll
Statistics 13
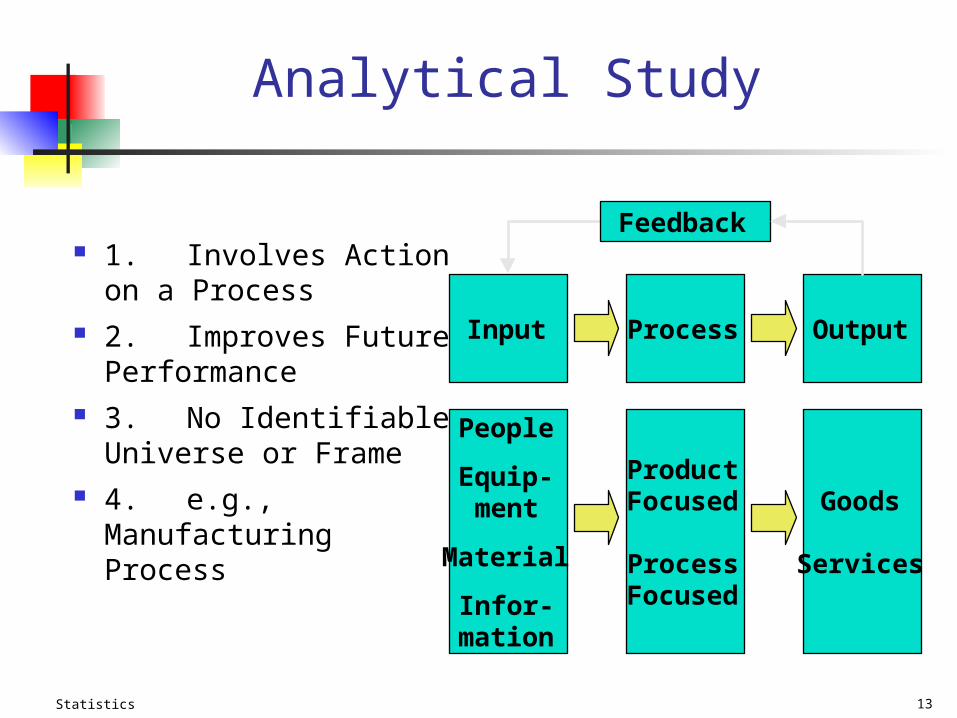
Analytical Study
1. Involves Action on a Process
2. Improves Future Performance
3. No Identifiable Universe or Frame
4. e.g., Manufacturing Process
Goods
Services
ProductFocused
ProcessFocused
People
Equip-ment
Material
Infor-mation
OutputProcessInput
Feedback
Statistics 14
StatisticalComputer Packages
1. Typical Software SAS SPSS MINITAB Excel Matlab
2. Need Statistical Understanding
Assumptions Limitations

Statistics 15
Thinking Challenge
Our market share far exceeds all competitors! - VP
30% 32% 34% 36%
Us
Y
X
Statistics 16
Why a Manager Needs to Know about Statistics
To know how to: properly present information
draw conclusions about populations based
on sample information
improve processes
obtain reliable forecasts
Statistics 17
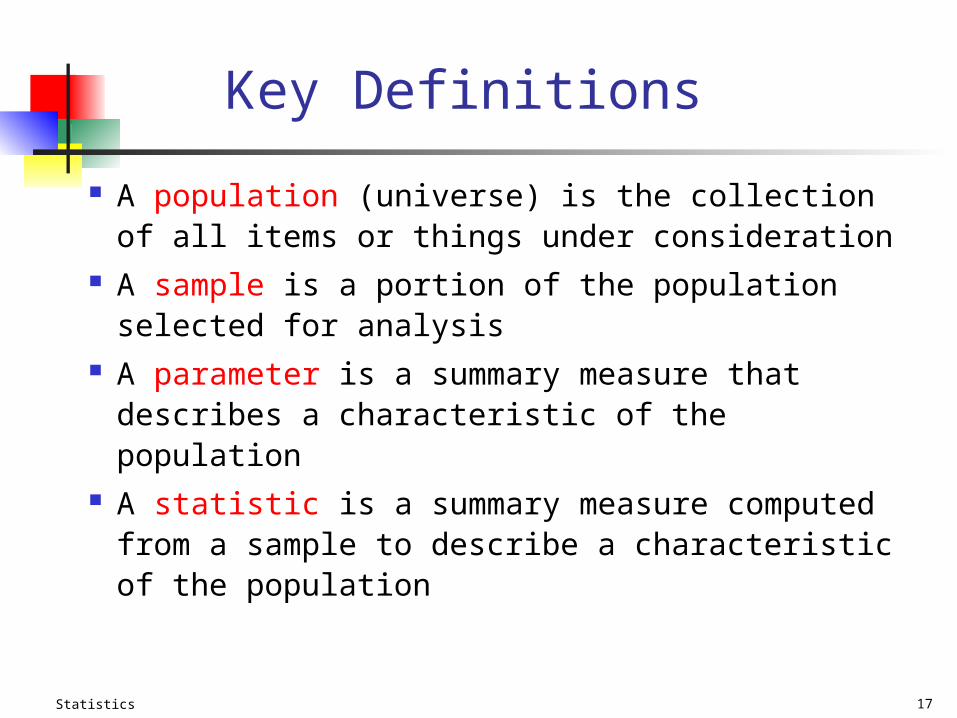
Key Definitions
A population (universe) is the collection of all items or things under consideration
A sample is a portion of the population selected for analysis
A parameter is a summary measure that describes a characteristic of the population
A statistic is a summary measure computed from a sample to describe a characteristic of the population

Statistics 18
Population vs. Sample
a b c d
ef gh i jk l m n
o p q rs t u v w
x y z
Population Sample
b c
g i n
o r u
y
Measures used to describe the population are called parameters
Measures computed from sample data are called statistics
Statistics 19
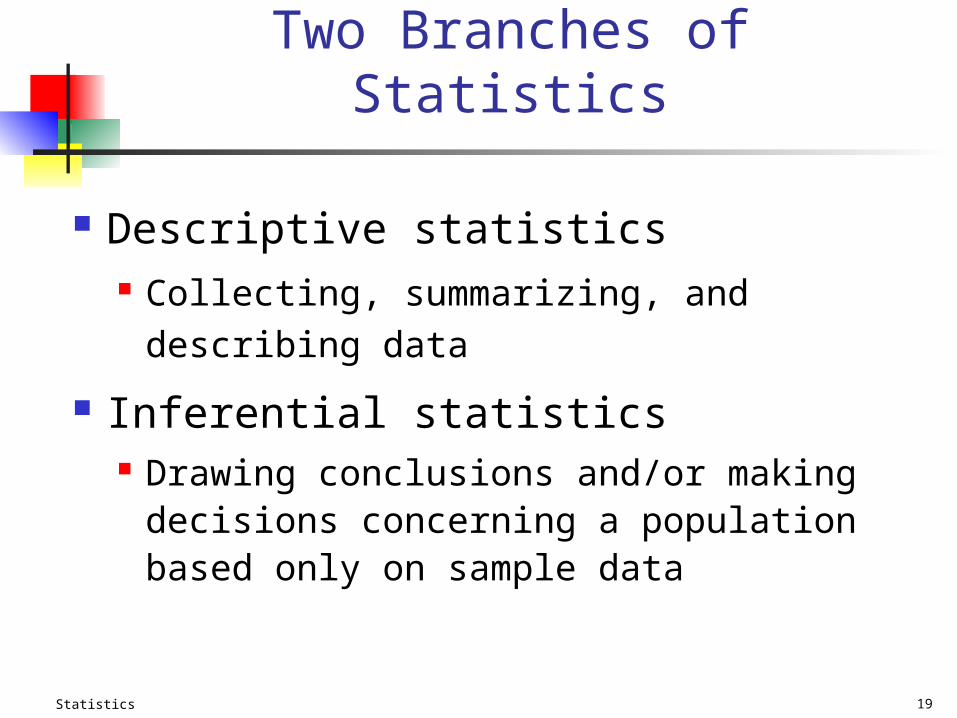
Two Branches of Statistics
Descriptive statistics Collecting, summarizing, and describing data
Inferential statistics Drawing conclusions and/or making decisions
concerning a population based only on sample data

Statistics 20
Descriptive Statistics
Collect data e.g., Survey
Present data e.g., Tables and graphs
Characterize data e.g., Sample mean =
iX
n
Statistics 21
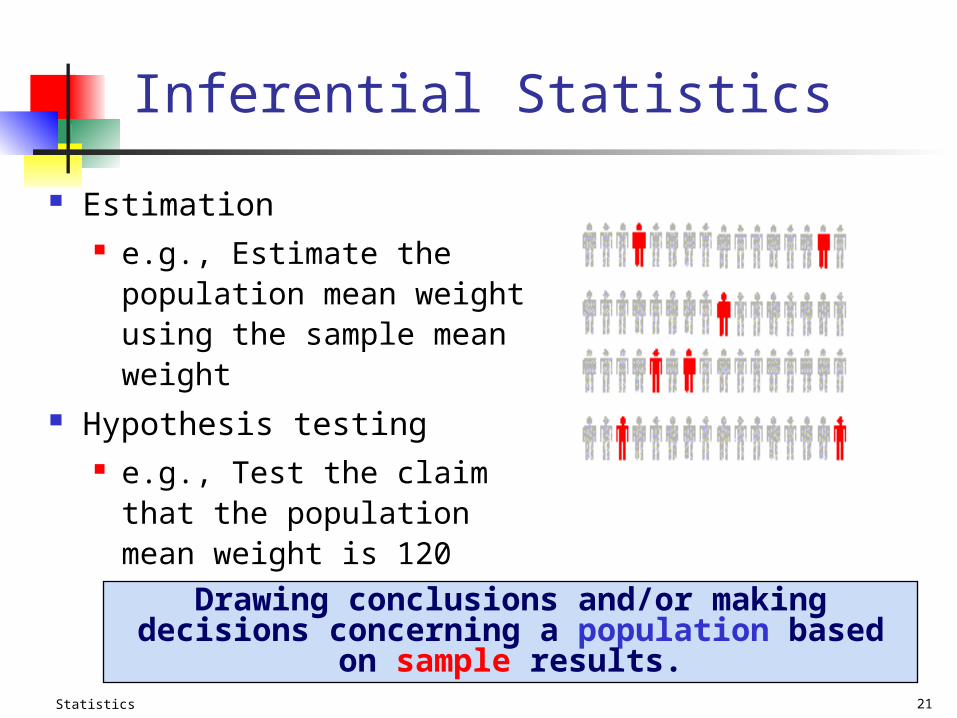
Inferential Statistics
Estimation e.g., Estimate the population
mean weight using the sample mean weight
Hypothesis testing e.g., Test the claim that the
population mean weight is 120 pounds
Drawing conclusions and/or making decisions concerning a population based on sample results.

Statistics 22
Why We Need Data
To provide input to survey To provide input to study To measure performance of service or
production process To evaluate conformance to standards To assist in formulating alternative courses of
action
Statistics 23
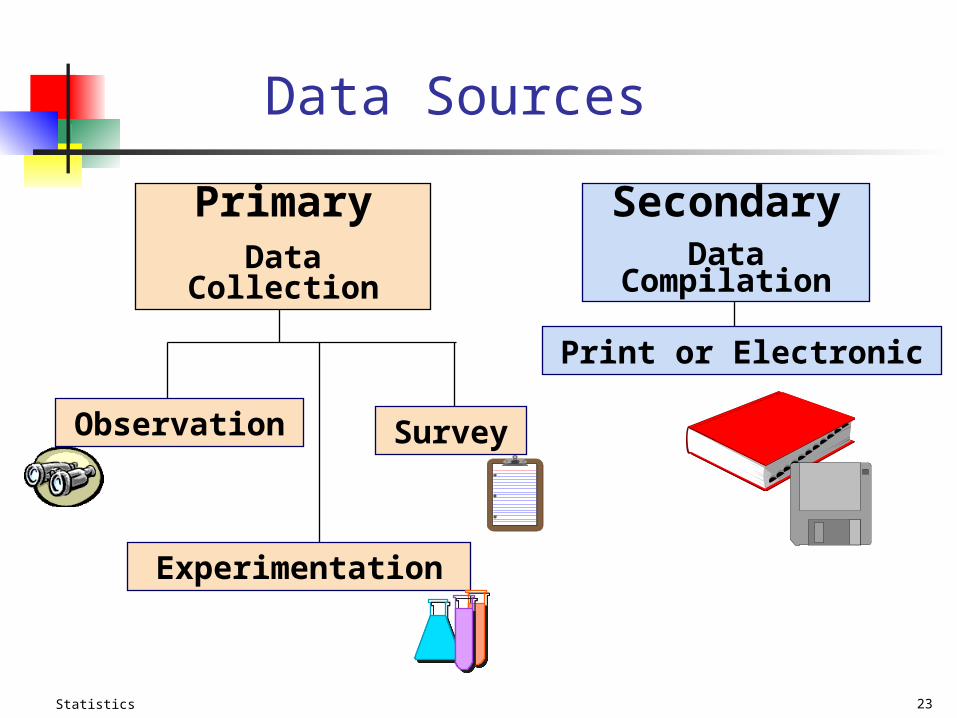
Data Sources
SecondaryData Compilation
Observation
Experimentation
Print or Electronic
Survey
PrimaryData Collection
Statistics 24
Reasons for Drawing a Sample
Less time consuming than a census Less costly to administer than a census Less cumbersome and more practical to
administer than a census of the targeted population
Statistics 25
Nonprobability Sample Items included are chosen without regard to
their probability of occurrence
Probability Sample Items in the sample are chosen on the basis
of known probabilities
Types of Samples Used
Statistics 26
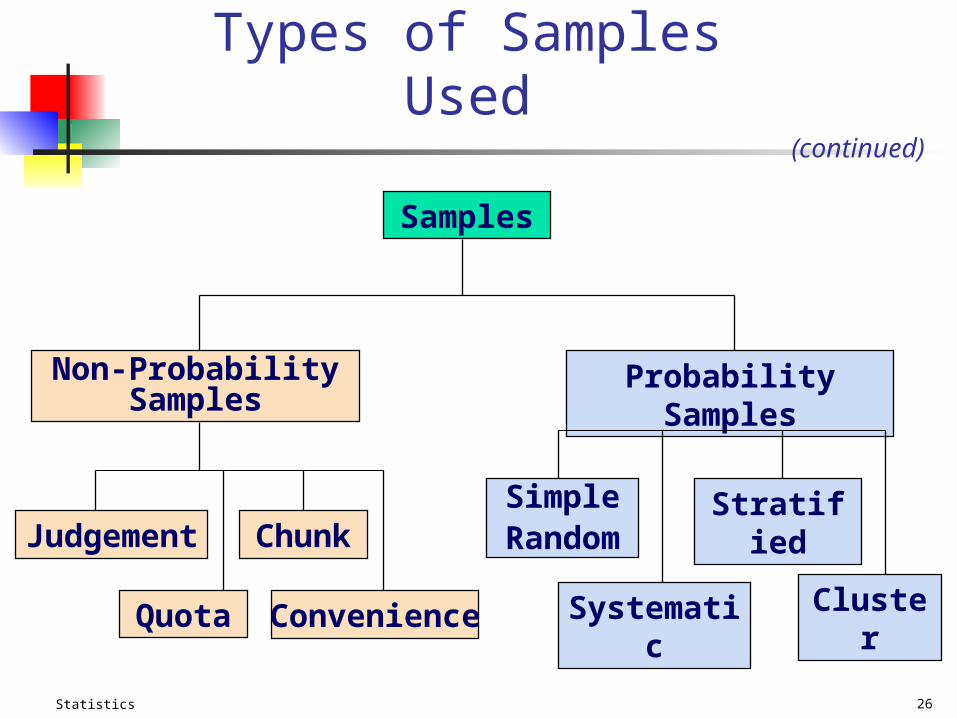
Types of Samples Used
Quota
Samples
Non-Probability Samples
Judgement Chunk
Probability Samples
Simple Random
Systematic
Stratified
ClusterConvenience
(continued)

Statistics 27
Probability Sampling
Items in the sample are chosen based on known probabilities
Probability Samples
Simple Random
Systematic Stratified Cluster
Statistics 28
Simple Random Samples
Every individual or item from the frame has an equal chance of being selected
Selection may be with replacement or without replacement
Samples obtained from table of random numbers or computer random number generators
Statistics 29
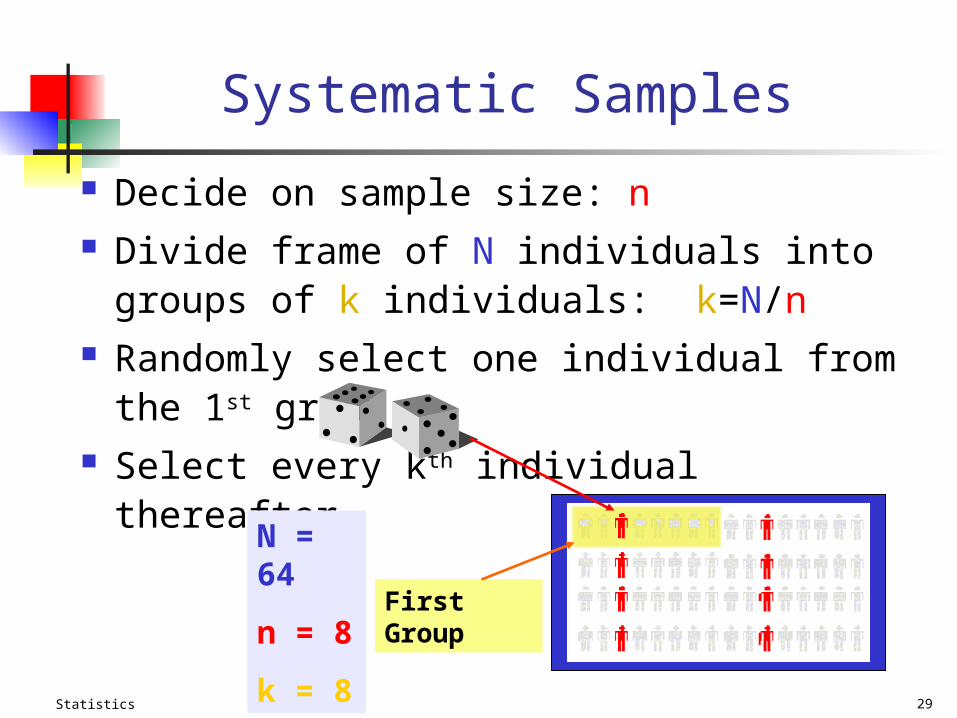
Decide on sample size: n Divide frame of N individuals into groups of k
individuals: k=N/n Randomly select one individual from the 1st
group Select every kth individual thereafter
Systematic Samples
N = 64
n = 8
k = 8
First Group
Statistics 30
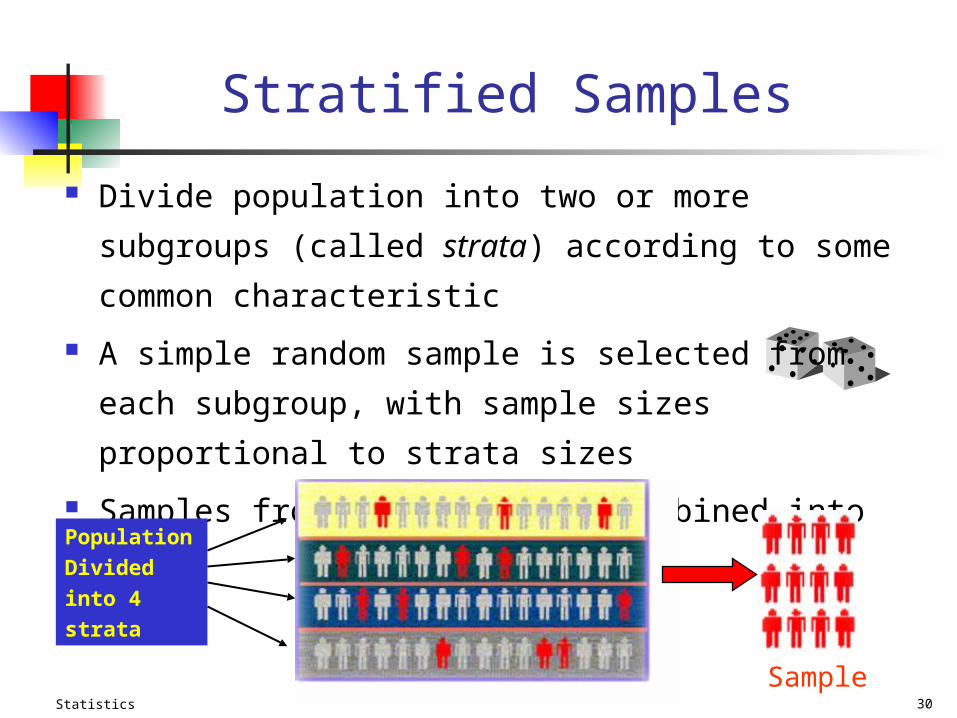
Stratified Samples
Divide population into two or more subgroups (called
strata) according to some common characteristic
A simple random sample is selected from each subgroup,
with sample sizes proportional to strata sizes
Samples from subgroups are combined into one
Population
Divided
into 4
strata
Sample

Statistics 31
Cluster Samples
Population is divided into several “clusters,” each representative of the population
A simple random sample of clusters is selected All items in the selected clusters can be used, or items can be
chosen from a cluster using another probability sampling technique
Population divided into 16 clusters. Randomly selected
clusters for sample

Statistics 32
Advantages and Disadvantages
Simple random sample and systematic sample Simple to use May not be a good representation of the population’s
underlying characteristics Stratified sample
Ensures representation of individuals across the entire population
Cluster sample More cost effective Less efficient (need larger sample to acquire the
same level of precision)
Statistics 33
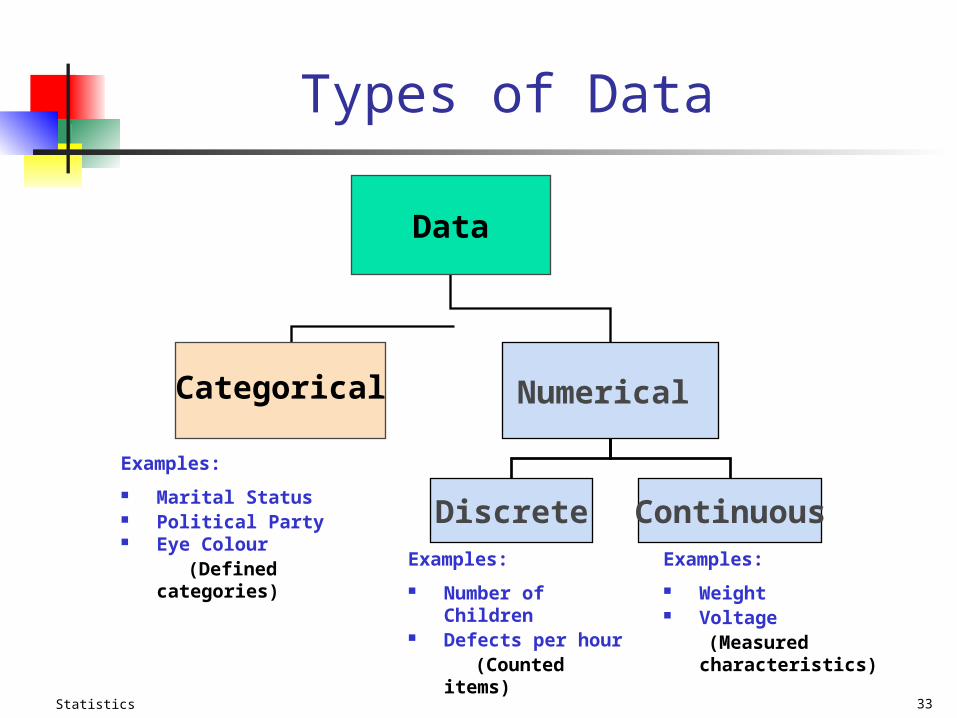
Types of Data
Data
Categorical Numerical
Discrete Continuous
Examples:
Marital Status Political Party Eye Colour (Defined categories) Examples:
Number of Children Defects per hour (Counted items)
Examples:
Weight Voltage (Measured characteristics)

Statistics 34
Levels of Measurementand Measurement Scales
Interval Data
Ordinal Data
Nominal Data
Highest Level
Strongest forms of measurement
Higher Level
Lowest Level
Weakest form of measurement
Categories (no ordering or direction)
Ordered Categories (rankings, order, or scaling)
Differences between measurements but no true zero
Ratio DataDifferences between measurements, true zero exists
Statistics 35
Evaluating Survey Worthiness
What is the purpose of the survey? Is the survey based on a probability sample? Coverage error – appropriate frame? No response error – follow up Measurement error – good questions elicit good
responses Sampling error – always exists
Statistics 36
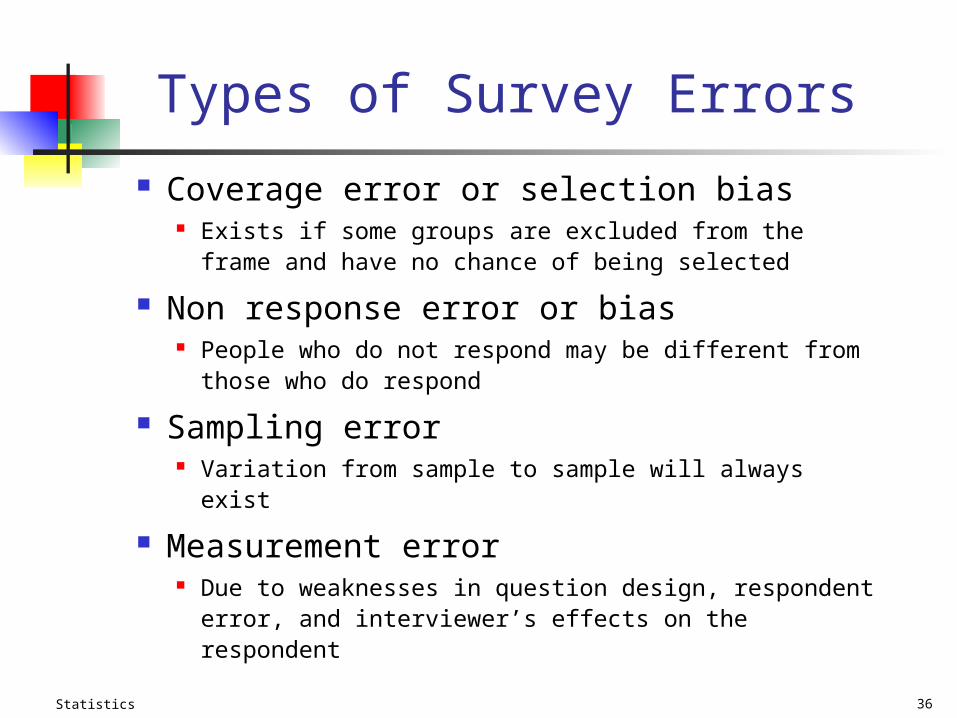
Types of Survey Errors
Coverage error or selection bias Exists if some groups are excluded from the frame and
have no chance of being selected
Non response error or bias People who do not respond may be different from those
who do respond
Sampling error Variation from sample to sample will always exist
Measurement error Due to weaknesses in question design, respondent
error, and interviewer’s effects on the respondent

Statistics 37
Types of Survey Errors
Coverage error
No response error
Sampling error
Measurement error
Excluded from frame
Follow up on no responses
Random differences from sample to sample
Bad or leading question
(continued)
Statistics 38
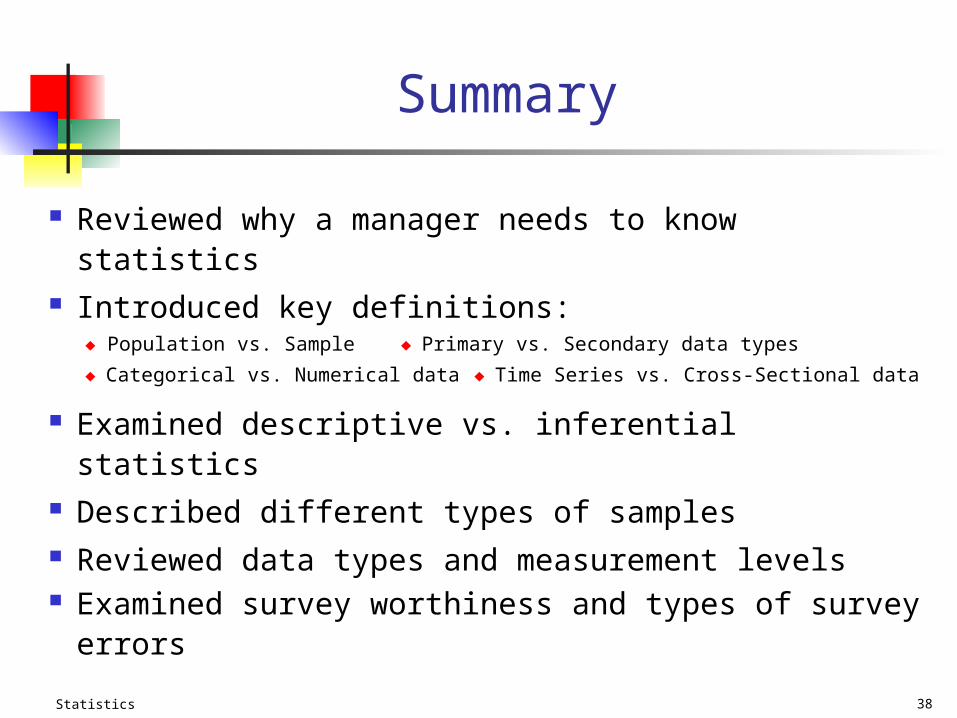
Summary
Reviewed why a manager needs to know statistics Introduced key definitions:
Population vs. Sample Primary vs. Secondary data types
Categorical vs. Numerical data Time Series vs. Cross-Sectional data
Examined descriptive vs. inferential statistics Described different types of samples Reviewed data types and measurement levels Examined survey worthiness and types of survey
errors