statistics
DESCRIPTION
Statistics. Natalia Rodriguez Research in Ecology. The Atlantic Sharp Nosed Shark. The Mean is the average. To find the mean you add up all the numbers and divide it by the total amount of numbers. Female sharks are much larger than males. I Sea Turtles!. - PowerPoint PPT PresentationTRANSCRIPT

StatisticsNatalia Rodriguez
Research in Ecology

The Atlantic Sharp Nosed Shark
Male
Female
920 930 940 950 960 970 980 990 1000
952
998
Average Length of Sharp-nose Sharks
Series1
Average Length of Sharks
Gend
er o
f Sha
rk
The Mean is the average. To find the mean you add up all the numbers and
divide it by the total amount of numbers. Female sharks are much larger than
males.
Males Females920 1160928 1160935 1160943 1160950 1160950 1160954 1160960 1160962 1160974 1160975 1160975 1160
116011601160116011601160116011601160116011601160116011601160

I Sea Turtles!
Blue Yellow Green Red Orange0
5
10
15
20
25
11
3
0
10
15
25 25 25 25 25
Number of Sea Turtle Hatch-lings in Beach Site A
Color Groups
Num
ber
of S
eaTu
rtle
s
Color Survived #Hatchlings
Blue 11 25
Yellow 3 25
Green 0 25
Red 10 25Orange 15 25
Very few sea turtles make it to the ocean each year. They face many dangers such as pollution, preadators (racoons, dogs, gulls…), misleading lights and poachers.
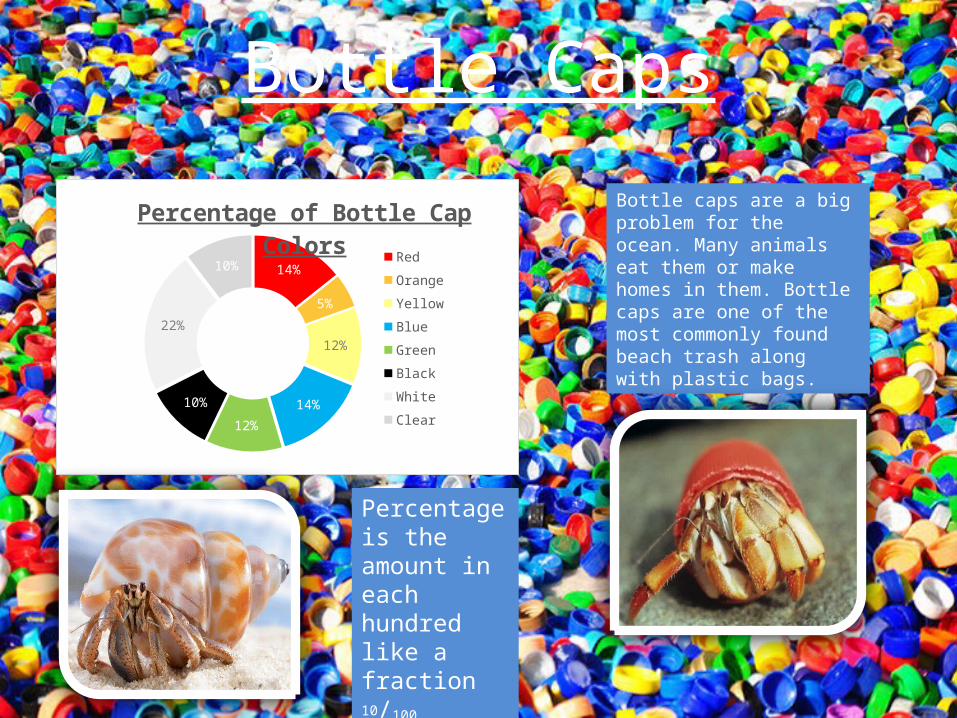
14%
5%
12%
14%
12%
10%
22%
10%
Percentage of Bottle Cap Colors
Red
Orange
Yellow
Blue
Green
Black
White
Clear
Bottle Caps
Bottle caps are a big problem for the ocean. Many animals eat them or make homes in them. Bottle caps are one of the most commonly found beach trash along with plastic bags.
Percentage is the amount in each hundred like a fraction 10/100.

Sea Cigars
"1-5" "6-10" "11-15" "16-20" "21-25" "26-30"0
2
4
6
8
10
12
0
34
12
5
1
Frequency Distribution of Sea Cigars By Size (cm)
Size Class (cm)
Freq
uenc
y
Red mangroves are more important than people think. Their prop roots provide a small ecosystem that protects small fish and other marine animals from predators. Animals that live here are snowy egret, white ibis, brown pelican, cormorants, mangrove cuckoos, herons, manatees, monkeys, turtles, red-tailed hawks, sea turtles, American alligators and crocodiles, and mangrove tree crabs…
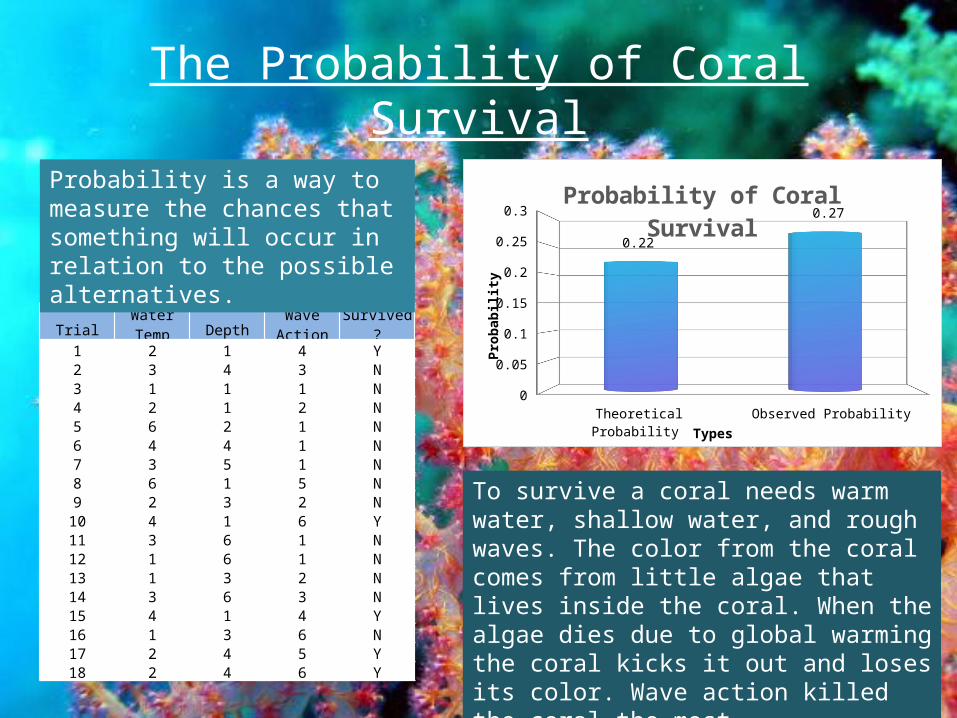
The Probability of Coral Survival
Theoretical Probability Observed Probability0
0.05
0.1
0.15
0.2
0.25
0.3
0.22
0.27Probability of Coral
Survival
Types
Prob
abili
tyTo survive a coral needs warm water, shallow water, and rough waves. The color from the coral comes from little algae that lives inside the coral. When the algae dies due to global warming the coral kicks it out and loses its color. Wave action killed the coral the most.
Trial Water Temp DepthWave Action Survived?
1 2 1 4 Y2 3 4 3 N3 1 1 1 N4 2 1 2 N5 6 2 1 N6 4 4 1 N7 3 5 1 N8 6 1 5 N9 2 3 2 N
10 4 1 6 Y11 3 6 1 N12 1 6 1 N13 1 3 2 N14 3 6 3 N15 4 1 4 Y16 1 3 6 N17 2 4 5 Y18 2 4 6 Y
Probability is a way to measure the chances that something will occur in relation to the possible alternatives.

Variance
• Variance is a way to show how far away your data is from the mean.
• Variance is calculated with this formula:
∑= sum X= the mean of data X= each data value n=the number of values
• Variance is also symbolized by the Greek letter sigma squared δ2

Standard Deviation
• Standard Deviation (δ) describes how spread out the data are.
• Standard deviation is the square root of the variance.
δ= • One standard deviation is considered the
numerical distance away from the mean in the positive or negative direction.
• We say plus or minus some number away from the mean.
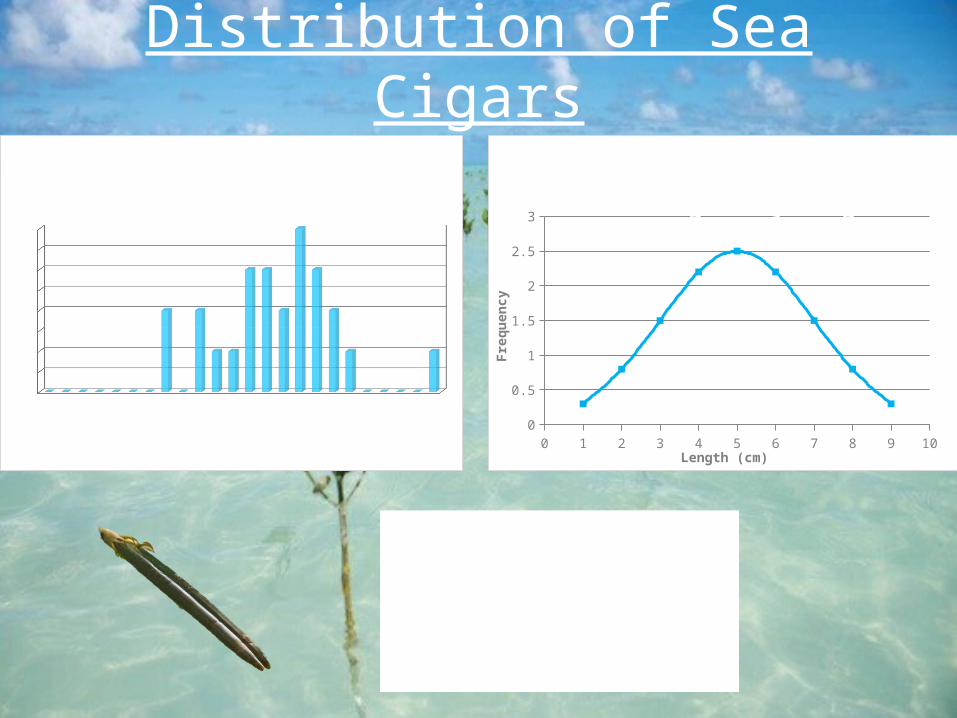
Distribution of Sea Cigars
0 1 2 3 4 5 6 7 8 9 100
0.5
1
1.5
2
2.5
3
Theoretical Distribution of Sea Cigars by Length
Length (cm)
Freq
uenc
y
1 2 3 4 5 6 7 8 9 10 11 12 13 14 15 16 17 18 19 20 21 22 23 240
0.5
1
1.5
2
2.5
3
3.5
4
Actual Distribution of Sea Cigars by Length
Length (cm)
Freq
uenc
y
A Theoretical Distribution Curve (TDC) is an ideal picture of a distribution based upon random sampling.

TTest With CaterpillarsT-Tests are used to test if there is a significant difference between the data. It’s calculated with this formula:
P
s of samples 1 and 2= pooled variance= number of objects in each group
IF the calculated t-statistic is larger than the one from the table, the null hypothesis is rejected.IF the calculated t-statistic is less than the one from the table you fail to reject the null hypothesis.
Control Treatment14 1413 1313 1513 1513 1513 14
14141515
P= 0.000545