statistics 200 - personal.psu.edupersonal.psu.edu/drh20/200/lectures/lecture19.pdf · quick review...
TRANSCRIPT

STATISTICS 200 Lecture #19 Tuesday, October 25, 2016 Textbook: Sections 12.3 to 12.4
• Frame a 2x2 test of independence as a test of difference of two proportions • Apply ideas of forming hypotheses, calculating test statistics, and calculating p-values. • Use Minitab to find probabilities for normal, binomial, and chi-square distributions
Objectives:

Quick review of odds vs. risk/probability I came across this quotation recently: “It will take several days for serious scientific polls to come in, but the betting markets respond in real time. PaddyPower, the Irish bookie, puts the odds on Clinton at 2/11, which implies an 85% chance that Clinton will win. U.K.-based William Hill is offering 1/6 odds on Clinton, implying that she has an 86% chance of winning.” How are these percents calculated? Ans: Odds of 2/11 give a probability of 2/13 (of losing), which is a winning probability of 11/13=84.6%.

Has Dog No Dog Total Female 89
56.7% 68 43.3%
157
Male 66 50.8%
64 49.2%
130
Total 155 132 287
Your class data
Recall this example: Are women more likely to have dogs?

Has Dog No Dog Total Female 89
56.7% 68 43.3%
157
Male 66 50.8%
64 49.2%
130
Total 155 132 287
Recall this example: Are women more likely to have dogs?
Let’s reframe this problem: Examine the difference between two independent proportions, that is, pf–pm. Is it zero? Let’s run a statistical hypothesis test.

Clicker Quiz #12
(A) pf � pm = 0
(B) pf � pm 6= 0
(C) p̂f � p̂m = 0
(D) p̂f � p̂m 6= 0
Which of the following is the correct null hypothesisregarding the di↵erence of proportions? Here, pf andpm are parameters; p̂f and p̂m are statistics.

Has Dog No Dog Total Female 89
56.7% 68 43.3%
157
Male 66 50.8%
64 49.2%
130
Total 155 132 287
Recall this example: Are women more likely to have dogs?
H0: pf–pm = 0 Ha: pf–pm ≠ 0
In this dataset, p̂f = 0.567, nf = 157; p̂m = 0.508, nm = 130.
Hypotheses: This is a two-sided alternative.
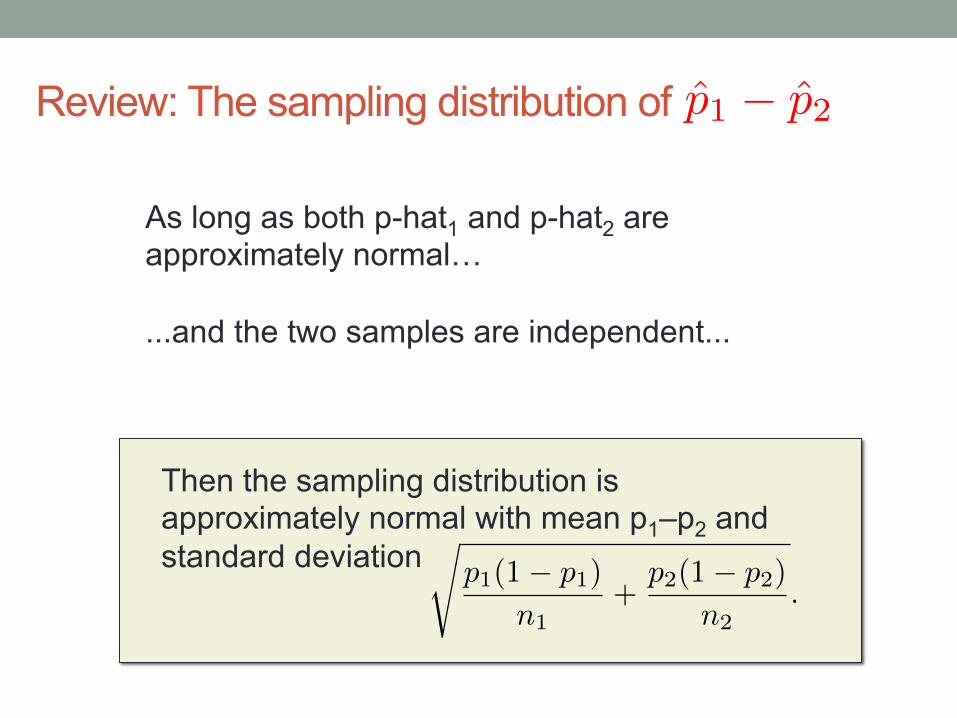
Review: The sampling distribution of
As long as both p-hat1 and p-hat2 are approximately normal… ...and the two samples are independent...
p̂1 � p̂2
Then the sampling distribution is approximately normal with mean p1–p2 and standard deviation
sp1(1� p1)
n1+
p2(1� p2)
n2.

Recall the general test statistic formula: sample estimate�mean under H0
std. dev. under H0
In our example, the parameter is pf–pm. Therefore:
• The sample estimate is • The mean under H0 is 0 • The std dev. under H0 is
0.567� 0.508 = 0.059r
p̂(1� p̂)
157+
p̂(1� p̂)
130Notice: Same value of p-hat in both fractions!
That value is the combined sample proportion:
89 + 66
157 + 130= 0.540

Recall the general test statistic formula: sample estimate�mean under H0
std. dev. under H0
In our example, the parameter is pf–pm. Therefore:
• The sample estimate is • The mean under H0 is 0 • The std dev. under H0 is
0.567� 0.508 = 0.059
r0.540⇥ 0.460
157+
0.540⇥ 0.460
130= 0.059
Conclusion: The test statistic is 0.059� 0
0.059= 1.00
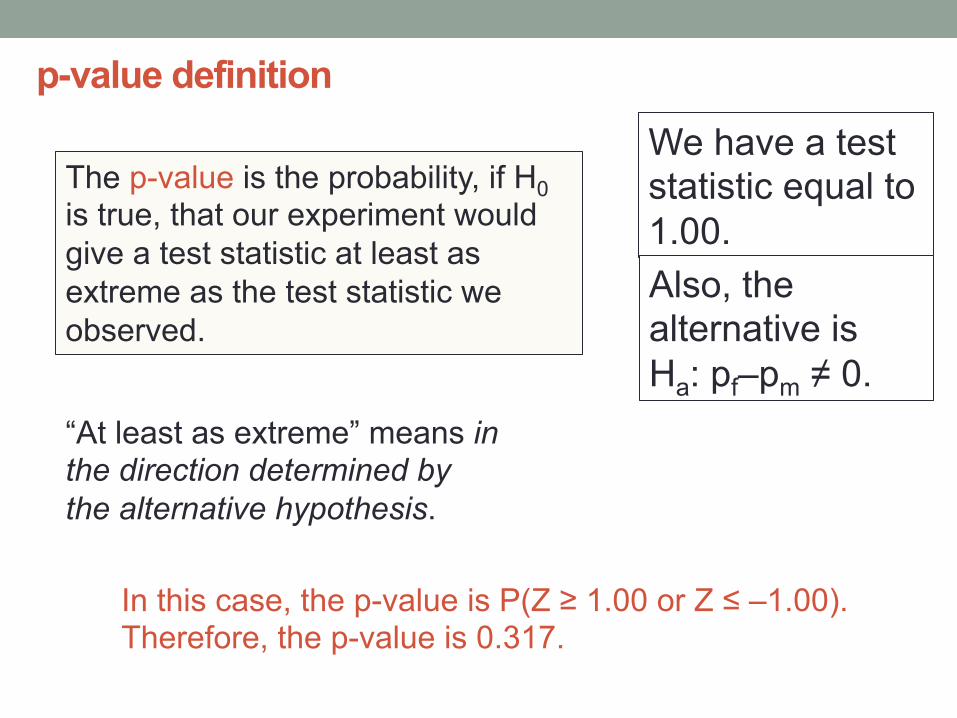
p-value definition We have a test
statistic equal to 1.00. Also, the alternative is Ha: pf–pm ≠ 0.
The p-value is the probability, if H0 is true, that our experiment would give a test statistic at least as extreme as the test statistic we observed.
“At least as extreme” means in the direction determined by the alternative hypothesis.
In this case, the p-value is P(Z ≥ 1.00 or Z ≤ –1.00). Therefore, the p-value is 0.317.

Recall result from Lecture 08 (Sept. 15): Are women more likely to have dogs?
Chi-square statistic: 1.003
P-value: 0.317
Has Dog No Dog Total Female 89
56.7% 68 43.3%
157
Male 66 50.8%
64 49.2%
130
Total 155 132 287
Note: There was a mistake in the Sept. 15 calculation!

Question from Midterm #2
Question 3. To investigate whether strong electromagnetic fields cause cancer, a group of 200 ratsis randomly split into two groups: The treatment group is exposed to a strong electromagneticfield for several hours a day, and the control group is not. The number of rats who developcancer is recorded for each group, and the results are given below:
Cancer?No Yes All
Mag field 70 30 100No mag field 80 20 100All 150 50 200
What is the risk of cancer in the control group?
(A) 3070
(B) 20100
(C) 30100
(D) 2080
(E) 70200
Question 4. Consider the events “A occurs” and “A does not occur” as well as 3 statements:
(I) The probabilities of these two events sum to 1.
(II) These two events are independent.
(III) These two events are mutually exclusive.
Which of the above statements is/are true?
(A) II only
(B) I and II only
(C) I and III only
(D) II and III only
(E) I, II, and III
Question 5. The main reason to use a matched-pair experimental design is to eliminate as manydi↵erences as possible between the treatment and control groups. Why is this a good idea?
(A) It limits bias caused by volunteer response.
(B) It makes experiments easier to manage by reducing potential conflicts among participants.
(C) It limits the potential impact of the placebo e↵ect.
(D) It limits the number of potential confounding variables.
Question 6. Suppose that I roll two fair 6-sided dice, one red die and one green die. These areregular dice, with the faces numbered 1 through 6. Which of the following is true regardingthe two events “roll a 5 on the red die” and “roll a 5 on the green die”?
(A) These two events are both independent and mutually exclusive.
(B) These two events are independent.
(C) These two events are mutually exclusive.
(D) These two events are neither independent nor mutually exclusive.
2
Correct Answer: C
Answered correctly by 72.1%
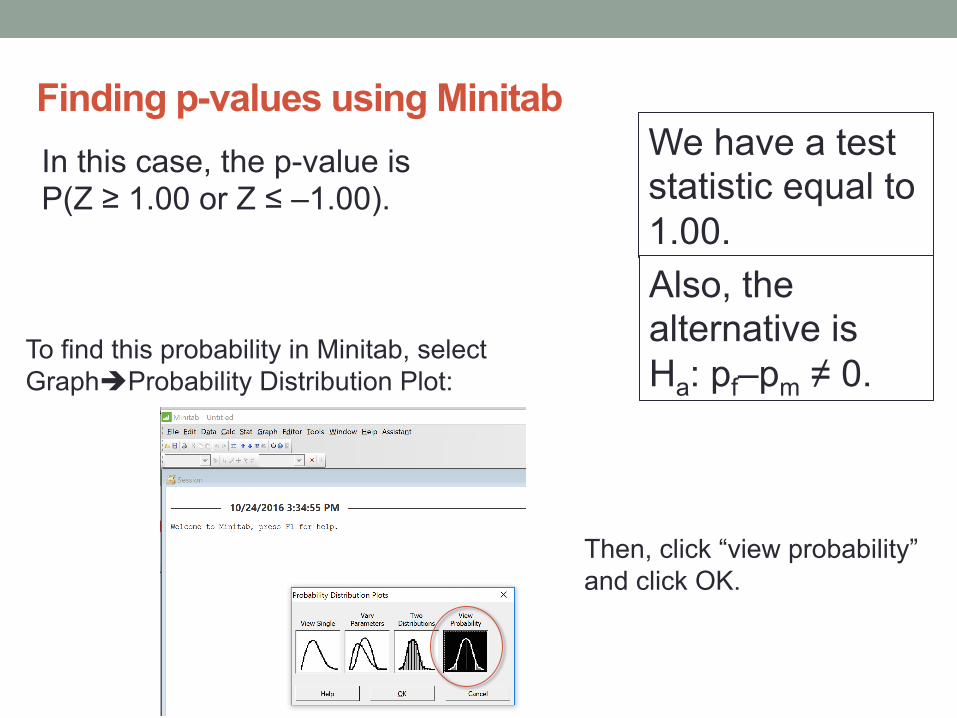
Finding p-values using Minitab We have a test statistic equal to 1.00. Also, the alternative is Ha: pf–pm ≠ 0.
In this case, the p-value is P(Z ≥ 1.00 or Z ≤ –1.00).
To find this probability in Minitab, select GraphèProbability Distribution Plot:
Then, click “view probability” and click OK.

Finding p-values using Minitab We have a test statistic equal to 1.00. Also, the alternative is Ha: pf–pm ≠ 0.
In this case, the p-value is P(Z ≥ 1.00 or Z ≤ –1.00).
Next, click “Shaded Area” and “Both Tails”.

Finding p-values using Minitab We have a test statistic equal to 1.00. Also, the alternative is Ha: pf–pm ≠ 0.
In this case, the p-value is P(Z ≥ 1.00 or Z ≤ –1.00).
Next, click “Shaded Area” and “Both Tails”.
Then, click to define shaded area by “X value” and type 1.00 for the value.

Finding p-values using Minitab We have a test statistic equal to 1.00. Also, the alternative is Ha: pf–pm ≠ 0.
In this case, the p-value is P(Z ≥ 1.00 or Z ≤ –1.00).
Here is the result:
You have to add the two probabilities together to get the p-value: 0.1587 + 0.1587 = 0.3164

Finding binomial probabilities using Minitab
Suppose that X is a binomial random variable with parameters 5 and 0.25. (Do you know what this means?)
Use Minitab to find the exact value of P(X ≥ 3).
Step 1: Select “Probability Distribution Plot” and enter the parameters.

Finding binomial probabilities using Minitab
Suppose that X is a binomial random variable with parameters 5 and 0.25. (Do you know what this means?)
Use Minitab to find the exact value of P(X > 2).
Step 2: Under “Shaded area”, select right tail and type 3. (Why not 2?)

Finding binomial probabilities using Minitab
Suppose that X is a binomial random variable with parameters 5 and 0.25. (Do you know what this means?)
Use Minitab to find the exact value of P(X > 2).
Step 3: The answer is shown below: 0.0135

Which midterm #3 date do you prefer? (A) Friday, Nov. 11 (B) Monday, Nov. 14 Keep these things in mind: • Nov. 14 is three weeks from yesterday. • Thanksgiving break begins on Monday, Nov. 21. • Starting Nov. 28, we have two weeks left of class
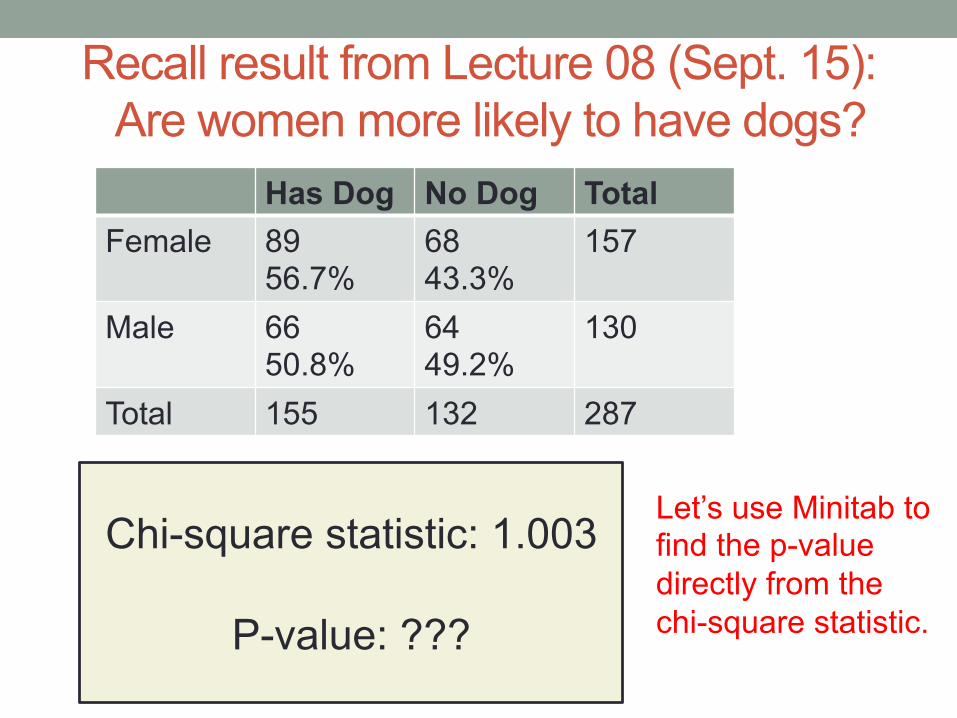
Recall result from Lecture 08 (Sept. 15): Are women more likely to have dogs?
Chi-square statistic: 1.003
P-value: ???
Has Dog No Dog Total Female 89
56.7% 68 43.3%
157
Male 66 50.8%
64 49.2%
130
Total 155 132 287
Let’s use Minitab to find the p-value directly from the chi-square statistic.

Finding chi-square probabilities using Minitab
We have a chi-square statistic of 1.003 for a 2x2 table.
Use Minitab to find the corresponding p-value for a test of independence (recall that the null says that the variables ARE independent).

Finding chi-square probabilities using Minitab
We have a chi-square statistic of 1.003 for a 2x2 table.
Use Minitab to find the corresponding p-value for a test of independence (recall that the null says that the variables ARE independent).
Step 1: Choose the chi-square distribution and enter 1 degree of freedom.

Finding chi-square probabilities using Minitab
We have a chi-square statistic of 1.003 for a 2x2 table.
Use Minitab to find the corresponding p-value for a test of independence (recall that the null says that the variables ARE independent).
Step 2: Enter the value of the statistic and be sure to click Right Tail (always for chi-square!)

Finding chi-square probabilities using Minitab
We have a chi-square statistic of 1.003 for a 2x2 table.
Use Minitab to find the corresponding p-value for a test of independence (recall that the null says that the variables ARE independent).
Step 3: The p-value is 0.3166, as shown in the plot below.

Why do we enter 1 “degree of freedom”?
Has Dog No Dog Total Female 89
68
157
Male 66
64
130
Total 155 132 287
Ans: Only one value is free to vary if we know the totals. The other values are then automatic and not free.
How many d.f. in a 2x3 table? How about a 3x3 table?

Question from Midterm #2 Question 19. In a randomized experiment involving a drug intended to treat cancer, suppose that
200 cancer patients were divided into two groups of 100 each. The new drug was given to onegroup, while the control group receieved the traditional cancer treatment. Over the next fiveyears, it was found that 25 of the patients receiving the experimental drug died, whereas 30of those receiving the traditional treatment died. In this sample, what is the odds of deathfor the group receiving the new experimental drug?
(A) 2575
(B) 2530
(C) 3070
(D) 25100
(E) 30100
Question 20. In a study involving miners, 100 miners with lung cancer and 100 miners withoutlung cancer were selected at random. These miners were given a survey to determine howmuch they had smoked over the course of the previous 20 years. As a result of this study,a statistically significant association between smoking and lung cancer in this population ofminers was established.
This study is an example of a
(A) volunteer response study.
(B) prospective case-control study.
(C) placebo-based observational study.
(D) retrospective case-control study.
(E) randomized experiment with blocking.
Question 21. Suppose that a sample of size 900 is selected from a population of size 10 millionand a sample proportion is calculated based upon some yes/no question asked of everyone inthe sample. If the sample proportion is reported along with a margin of error, what is themargin of error?
(A) 90010 million, or 0.009%.
(B) 1900 , or .0011%
(C)q
90010 million, or 0.95%.
(D) 900p10 million
, or 28.5%.
(E) 1p900
, or 3.3%
Question 22. Craps is a game involving rolling dice, and a game of craps eventually ends ineither a win or a loss. The probability of winning a game of craps is equal to .493. You decideyou are going to play craps repeatedly until you win a game. What is the probability thatyour first win occurs on the second game of craps?
(A) 0.507⇥ 0.493
(B) 0.493⇥ 0.493
(C) 0.493 + 0.507
(D) 0.493
(E) 0.507
6
Correct Answer: A
Answered correctly by 42.0%

Question from Midterm #2
Question 7. In the context of designing a statistical experiment, by “control” we mean that
(A) there must be a basis for making comparisons.
(B) we carefully control the observed outcomes of the experiment.
(C) there is a need to control the behavior of the subjects of the experiment.
(D) we carefully monitor the cost of performing the experiment.
(E) strict guidelines must be in place to determine who is eligible to be selected in a sample.
Question 8. To study the e↵ectiveness of vitamin C in preventing colds, a researcher recruited200 people. She randomly assigned 100 of them to take vitamin C and 100 of them to takenothing at all. What is the biggest problem with this study?
(A) The placebo e↵ect is a confounding variable that could explain any observed di↵erencesbetween the two groups.
(B) The treatment group and the control group are too similar to allow for inferences about theentire population of interest.
(C) Volunteer response will bias the results of any study of this nature.
(D) The inability to infer causation from a study of this nature will make any statistically signif-icant results inconclusive scientifically.
Question 9. Which of the following situations is most likely to lead to response bias?
(A) A sample of adult women is selected by speaking with the first 20 women who are visit aparticular clothing store.
(B) A sample of residents in a particular town is selected by contacting the first person listed oneach page of the local phone book.
(C) A sample of college students is asked by their professor about how frequently they cheat onexams.
(D) A census of a particular population is given a set of survey questions.
(E) Participants in a randomized experiment are given a placebo.
Question 10. Suppose that teenagers make up 23% of the population and senior citizens makeup 19% of the population. If we choose a person at random from the population, what is theprobability that the person chosen is either a teenager or a senior citizen?
(A) 0.23 + 0.19, or 0.42
(B) 0.23+0.192 , or 0.21
(C) 0.19
(D) 0.23
(E) 0.23⇥ 0.19, or 0.044
3
Correct Answer: A
Answered correctly by 47.4%

Question from Midterm #2
Question 3. To investigate whether strong electromagnetic fields cause cancer, a group of 200 ratsis randomly split into two groups: The treatment group is exposed to a strong electromagneticfield for several hours a day, and the control group is not. The number of rats who developcancer is recorded for each group, and the results are given below:
Cancer?No Yes All
Mag field 70 30 100No mag field 80 20 100All 150 50 200
What is the risk of cancer in the control group?
(A) 3070
(B) 20100
(C) 30100
(D) 2080
(E) 70200
Question 4. Consider the events “A occurs” and “A does not occur” as well as 3 statements:
(I) The probabilities of these two events sum to 1.
(II) These two events are independent.
(III) These two events are mutually exclusive.
Which of the above statements is/are true?
(A) II only
(B) I and II only
(C) I and III only
(D) II and III only
(E) I, II, and III
Question 5. The main reason to use a matched-pair experimental design is to eliminate as manydi↵erences as possible between the treatment and control groups. Why is this a good idea?
(A) It limits bias caused by volunteer response.
(B) It makes experiments easier to manage by reducing potential conflicts among participants.
(C) It limits the potential impact of the placebo e↵ect.
(D) It limits the number of potential confounding variables.
Question 6. Suppose that I roll two fair 6-sided dice, one red die and one green die. These areregular dice, with the faces numbered 1 through 6. Which of the following is true regardingthe two events “roll a 5 on the red die” and “roll a 5 on the green die”?
(A) These two events are both independent and mutually exclusive.
(B) These two events are independent.
(C) These two events are mutually exclusive.
(D) These two events are neither independent nor mutually exclusive.
2
Correct Answer: B
Answered correctly by 64.4%
Question from Midterm #2
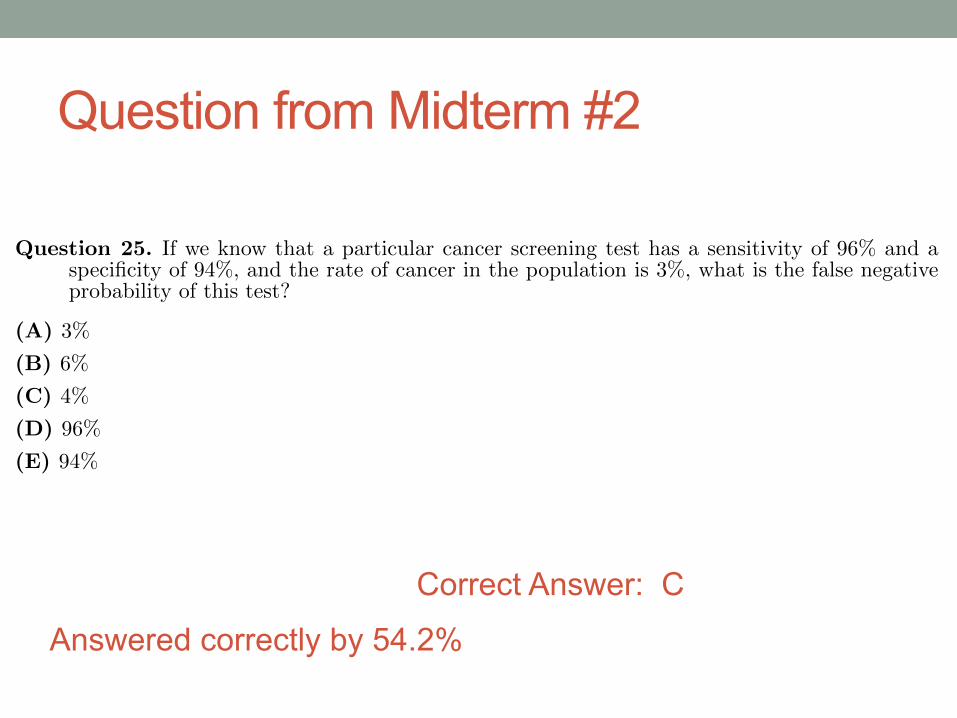
Correct Answer: C
Answered correctly by 54.2%
Question 23. Suppose we flip a fair coin six times in a row and record the six outcomes, in theorder they occur, using H for heads and T for tails. (“Fair” means that the probability ofheads is exactly 1
2 .) Below are two possible outcomes.
(I) We get the sequence HHHHHH
(II) We get the sequence HTTHTH
Which of the following statements is correct?
(A) Outcome (II) has a higher probability than outcome (I).
(B) Outcomes (I) and (II) have the same probability.
(C) It is impossible to tell in this case whether one outcome has a higher probability than theother.
(D) Outcome (I) has a higher probability than outcome (II).
Question 24. Suppose that a random sample of 400 Penn State students is selected and askedwhether or not they own season football tickets. Which of the following is the margin of errorfor a 95% confidence interval?
(A) 400
(B) 0.400, or 40%
(C) 1p400
, or 5%
(D) 1400 , or 0.25%
(E) It is impossible to say without knowing the size of the population.
Question 25. If we know that a particular cancer screening test has a sensitivity of 96% and aspecificity of 94%, and the rate of cancer in the population is 3%, what is the false negativeprobability of this test?
(A) 3%
(B) 6%
(C) 4%
(D) 96%
(E) 94%
7

If you understand today’s lecture… 12.60, 12.63, 12.65, 12.66
Objectives: • Frame a 2x2 test of independence as a test of difference of two proportions • Apply ideas of forming hypotheses, calculating test statistics, and calculating p-values. • Use Minitab to find probabilities for normal, binomial, and chi-square distributions