statistical training on the 2015 who vaccination coverage ... · statistical training on the 2015...
TRANSCRIPT

1
Statistical Training on the 2015 WHO Vaccination Coverage Survey Reference Manual
Summary Report Madrid, Spain | 19-23 September 2016

2
Executive Summary From 19 to 23 September 2016, 20 representatives of Ministries of Health, National Statistics Offices, both private and public organizations, from five regions of the World Health Organization (WHO) participated in a training facilitated by UNICEF, the United States Centers for Diseases Control and Prevention (CDC), and consultants held in Madrid, Spain. Training objectives were to: The objective of the training was to have participants:
1. Understand the recommendations from the WHO Vaccination Coverage Cluster Survey Reference Manual
2. Recognize the most common immunization indicators obtained from vaccination coverage surveys
3. Recognize the tasks in vaccination coverage survey planning which require statistician expertise
4. Make recommendations regarding sampling design and sample size in different settings
5. Determine appropriate adjustments to make when encountering challenges in the field
6. Calculate sampling weights and use them as well as the design features to conduct data analysis
7. Use “Vaccination Coverage Quality Indicators (VCQI)” or other analysis programs to analyse survey data
In 2015, the Expanded Programme on Immunization (EPI) released a working draft of a new WHO Vaccination Coverage Cluster Survey Reference Manual. This is the result of an extensive review and revision of coverage survey methods and materials aimed at improving survey precision, accuracy, and overall quality.
While the statistical methods outlined in the Survey Manual, particularly related to probability sampling, are commonly used on large households health surveys, such as Demography and Health Surveys (DHS) and UNICEF’s Multiple-Cluster Indicator Surveys (MICS), Immunization Programmes are less familiar with them and will likely lack the expertise needed to properly conduct the sampling and analyses recommended in the Survey Manual. To this end, a “Reform Grant” from the Bill & Melinda Gates Foundation (BMGF) was received test the concept of outsourcing survey data analyses to institutions with statistical expertise, in a manner that not only ensures technical quality, but also promotes capacity-building on survey statistics in countries where vaccination coverage surveys are to be implemented.
This training was one of the first activities aimed at preparing a cadre of statistics professionals who can be mentored to serve consultant or advising statisticians for vaccination coverage survey design and implementation using the 2015 working draft of the WHO Vaccination Coverage Cluster Survey Reference Manual.

3
Participants Regional Eric Diboulo, Centre de Recherche en Santé de Nouna, Burkina Faso
Fortune Themba Mhlanga, Health Management Information Systems, Ministry of Health, Swaziland
Alemayehu Worku Yalew, Addis Continental Institute of Public Health, Ethiopia
Djossaya Dove, National Institute of Statistics, Cameroon
Enkhbaatar Ichinnorov, National Statistical Office, Mongolia
Phan Chinda, National Institute of Statistics, Cambodia
Manithong Vonglokham, National Institute of Public Health, Laos
Naseer Ahmad, Pakistan Bureau of Statistics, Pakistan
Racha Said, Connecting Research to Development, Lebanon
Nahum Jn Baptiste, Epidemiology Unit, Ministry of Health Wellness, Human Services and Gender Relations, Saint Lucia
Nathalie El Omeiri, Comprehensive Family Immunization Unit, Pan American Health Organization (PAHO), USA
Alexandre Xavier Ywata de Carvalho, International Policy Centre for Inclusive Growth, Brazil
Kapil Prasad Timalsena, Planning and Monitoring Section, Child Health Division, Department of Health Services, Ministry of Health, Nepal
Lely Indrawati, National Institute of Health Research Development, Indonesia
Chutima Kumdee, Health Intervention and Technology Assessment Program (HIAT), Thailand
Roongnapa Khampang, HIAT, Thailand
Independent Consultants David Koffi
Augusto Llosa
Francisco Nogareda
Anthony Burton
Facilitators Mamadou Diallo, UNICEF
Denise Traicoff, US Centers for Disease Control and Prevention (CDC)
Kathleen Wannemuehler, CDC
David Brown, Brown Consulting
Dale Rhoda, BioStat Global Consulting
World Health Organization (WHO) Headquarters Carolina Danovaro
Marta Gacic-Dobo
Shellese Shemwell Carine Cruz

4
Highlights from Each Session All the material used in this training is available in a shared DropBox, available at https://www.dropbox.com/home/WHO%202016%20Vx%20Cvg%20Svy%20-%Stat%Training%20-%Madrid
Briefing on immunization and vaccine-preventable diseases
(Shellese Shemwell and Carolina Danovaro, WHO HQ) The training started with an optional introduction to immunization and vaccine-preventable diseases (VPDs) given that some of the participants were not familiar with immunization. The objectives of the session were to share with the participants a definition of VPDs, provide them with a brief history of successes in the fight against VPDs, describe how vaccination coverage relates to VPD control and elimination, describe some of the existing types of barriers to vaccination and explain the difference between lack of access (“left-outs”) to vaccination and loss to follow-up (“drop-outs”). It was then highlighted that monitoring progress toward immunization goals, which require high-quality and accurate data, is an important part of immunization programmes. Coverage is monitored through administrative routine systems and often validated using periodic vaccination coverage surveys. As skilled statisticians, and following this survey statistical training, the participants will be in a unique position to help improve the quality of survey data.
Welcome remarks
(Marta Gacic-Dobo, WHO HQ) Ms. Marta Gacic-Dobo, manager of the Strategic Information Group of the Expanded Programme on Immunization (EPI), at WHO welcomed the participants and set the expectations from the training. She highlighted the objectives of the training (see agenda, annex 1) and the expected terms of reference for statisticians supporting vaccination coverage surveys that use the new WHO Survey Manual (see TOR, annex 2).
Setting the stage
(David Brown, Consultant) Using interactive counting exercises, participants were introduced to the practical difficulties of counting people and measuring indicators. Then a presentation was given highlighting the importance of monitoring of immunization systems, with a focus on how vaccination coverage is measure. The limitations of administrative routine systems for monitoring coverage were described and the role of surveys introduced.

5
Presentation of the WHO vaccination coverage survey reference manual (Carolina Danovaro, WHO HQ) The WHO Vaccination Coverage Cluster Survey Reference Manual, published as a working draft in 2015, was introduced to the participants. The rationale to develop new guidance on vaccination coverage surveys aimed at improving survey accuracy and overall quality was presented. This new manual provides a methodology more aligned with well-accepted household cluster survey methods, and renews emphasis on taking steps to minimize bias and improve data quality; it also promotes better highlighting limitations to minimize unmet expectations or misuse of results; and emphasizes the use of results for action. Emphasis was given to seven aspects of the new Manual that are new in relation to previous WHO guidance on vaccination coverage surveys. Finally, an overview of the main seven aspects described in the Survey Reference Manual was given. These aspects are:
1. Defining the Survey Scope 2. Using probability sampling and weighted analyses 3. Improving vaccination status ascertainment 4. Providing guidance on digital data collection 5. Outlining clear steps to minimize bias and bolster data quality 6. Presenting innovative graphs to display the main results 7. Writing reports that are comprehensive and persuasive about survey quality
The following presentation focused on the role of vaccination coverage surveys and the three main types of such surveys:
1. Routine Immunization a. Usually among infants b. But other options exist (school-aged; adolescents)
2. Post-supplementary immunization activity (SIA)/ campaign a. Often following measles and measles/rubella campaigns
3. Tetanus among pregnant women
Key steps to vaccination coverage surveys (Denise Traicoff, CDC) Seventeen key steps of vaccination coverage surveys were presented. These 17 steps were grouped in four general phases: getting started, planning, implementing, and taking action. The 17 steps model was explained and those were statistician involvement is crucial were emphasized. The take home messages from this presentation were that a vaccination coverage survey is a long and complex project; it requires teamwork among many specialists; and that statisticians play an important role in several steps.

6
Survey vocabulary (Kathleen Wannemuehler, CDC) This session introduced key vocabulary and terms related to survey statistics and to vaccination coverage surveys. The objective of this session was to ensure that all participants, who come from different backgrounds, shared a common vocabulary. A list is available in annex 3.
Assessing survey objectives
This session focused on the three main survey objectives described in the 2015 WHO Vaccination Coverage Survey Reference Manual, namely:
1. Estimation 2. Classification 3. Testing for differences or [coverage] change
It also discussed the differences in the effective sample size required according to survey goal and the parameters needed to calculate sample size in those scenarios. Alpha and beta errors were discussed. Emphasis was made on the importance of sample size for precision, and the difference between precision and accuracy. Finally, drivers of effective sample size were discussed, mainly the number of strata (national, subnational, and district level), the desired precision, the expected coverage and the assumed design effect/ intra cluster correlation coefficient.

7
A case study using a fictional country Harmonia was employed for a group activity to help participants define the scope of a survey and potential compromises, if the initial design was not feasible.
Distinction between estimation & classification
(Dale Rhoda, Consultant) The WHO guidelines recommend using a cluster survey with a probability sample and an appropriately weighted analysis to address both estimation and classification questions (see sections 2.3, 6.5 & Annex N). It also recommends estimation followed by classification. This presentation focused on reviewing and strengthening the conceptual relationship between estimation and classification and on describing the inchworm plots, introduced in the Survey Manual. An overview of the workflow is as follows: (1) identification of goals and calculation of the sample size (n clusters per stratum, and visit NHH households each), (2) selection of the probability sample and recording information required to calculate weights, (3) data collection and analysis using weights and software that accounts for weights & structure of sample, (4) estimation using point estimate & 2-sided confidence interval (CI), and (5) classification using 1-sided CIs. Estimation requires the calculation of a point estimate and a 2-sided CI with limits defined by points where 2.5% of probability falls below and above. Previous WHO guidelines suggested symmetrical intervals, but those simplifications are no longer appropriate because coverage can be either very, very high or low, i.e., the 2-sided interval should not be symmetrical if the point estimate is near 0% or 100%. Confidence bounds were introduced: a 1-sided 95% lower confidence bound (LCB) where 5% of probability (or confidence) is to the left of LCB and 95% is to the right and a 1-sided 95% upper confidence bound (UCB) where 5% of confidence is to the right of UCB and 95% is to the left. Inchworm plots allow visualizing these three sets of 95% CIs.
8
If classification is the survey objective, in addition to the point estimate and the 2-sided CI, and the LCB and UCB are calculated. In general, estimation allows for two conclusions. The first conclusion is if LCB ≥ programmatic threshold, we might say we are 95% confident that coverage is ≥ the threshold, the alternative conclusion is if UCB ≤ programmatic threshold, we might say we are 95% confident that coverage is ≤ the threshold . It’s important to note that it is not possible to classify confidently when LCB < threshold < UCB.
Sample size calculations (Kathleen Wannemuehler, CDC) Participant were introduced and practiced how to calculate the effective sample sizes for estimation and for classification using Annex B from the WHO Vaccination Coverage Survey Reference Manual. The steps used were: Step 1: Calculate effective sample size (ESS) – The Manual recommends the Fleiss ESS formula Step 2: Calculate the design effect (DEFF) Step 3: Calculate the average number of households (HHs) to find one eligible subject (NHH) Step 4: Define the expected response rate (RR) Step 5: Define the number of strata where the survey will be conducted (strata)
First, second, and third stage sampling
(Kathleen Wannemuehler, CDC and Mamadou Diallo, UNICEF) This session had the objectives of introducing the notion of complex samples, reviewing the selection of primary sampling units, and contrasting between perfect vs. practical methods, having in mind that survey design should be a balance of efficiency with feasibility. Sampling theory was briefly introduced, and complex sampling methods (deviations from simple random sampling) used in surveys were presented. The use of strata and sample allocation methods (equal, proportional, Neyman and optimal) across each strata were presented. One stage vs. two or three stage cluster sampling were described and some practical examples given. The latter was to emphasize that will be always issues and that best local solutions should be investigated with the goal of remaining as unbiased as possible. Sampling of clusters (ideally enumeration areas), and the need to segment or join clusters, as well as map updating, HH listings and HH sampling were discussed. Sampling respondents, though not recommended in the WHO Vaccination Coverage Survey Reference Manual, was presented.

9
An important take home message was that thoroughly documenting the sampling procedures, i.e., selection methodology at each stage; different sample & population sizes; recommendation of replacement procedures; location of files and contact person or teams, just after selecting the sample, is key to conduct well the weighting.
Weighing
(Mamadou Diallo, UNICEF) This session was an introduction to sample weighting, building on annex J of the WHO Vaccination Coverage Survey Reference Manual; but it also presented in more detail the weighting steps and reviewed non-response and post-stratification adjustments. Participants had an opportunity to do some practical exercises and discuss how weight variations may reduce the precision of the estimates. In order to proceed with weighting, the selection process needs to be random and the probability of selection must be known. Two main sources of information needed for weighting are: 1) the sampling frames (stratification, MOS, listing), given that probability of selection needs to be calculated for each stage, and 2) data collected (updated MOS, HH/person response status). Weight variations should be minimized, or reduced to the extent that it is operationally manageable, to avoid losing precision. In the non-response adjustment, the redistribution of the weights of the non-respondents to the respondents within adjustment classes was presented. For post-stratification adjustment, the adjustment factor was discussed, as well as normalizing the final weight, if desired (similar to DHS normalized weights). Finally, as in sampling, the importance of documenting the weighting procedures was emphasized.
Data management: a broad perspective (David Brown and Dale Rhoda, Consultants) This session introduced important concepts related to data management (from Survey Manual Sections 3.1-5.5), such as the need to understand all the kinds of data involved in the survey project (stratum and cluster lists, household survey data forms, photos of vaccination cards and health centre records, PDF’s of completed survey forms, maps, and various databases) and make plans to: 1. Collect it 2. Check it 3. Store it 4. Query it 5. Back it up, and 6. Make it accessible
10
Data management is the development, implementation, and maintenance of plans, policies, and programmes that control, protect, and enhance the value of data. Data management should be considered early in the survey design process and all activities documented. The data manager, with support from statisticians and possibly other members of the support team, is responsible for designing the database and data entry software, which includes defining the range and logic checks. The data manager also writes code for daily data quality checks, writes programs to support supervisors, and independent monitors, simulates datasets, and writes analysis programs. After clusters are selected the data manger retains information for weights and obtains census data from the census office for stratum-level totals. During the data collection and entry phase, the data team manages paper forms, records from electronic data collection, and digital photos, thus careful organization is crucial. Data quality checks should be performed daily. Following data entry the data is analysed and the codebook must be updated. The final step is to share the data, addressing privacy considerations, and the relevant documentation. This session provided some practical examples of the importance and challenges of accurately capturing vaccination history from home-based records, and in same surveys, health facility-based records. In addition, it touched on the difficulties to obtain caregiver recall in the absence of a HBR. It also touched on survey questionnaires, with emphasis on their importance to serve as a tool with “good” questions, and good instructions, to accurately measure concept(s) of interest and organized in a manner that facilitates data collection. It warned against shortcuts and strongly advised on pre-testing survey questionnaires; pretesting provides an opportunity to assure that respondents perceive the questions as intended. The session also discussed obtaining consent before proceeding with interviews and measures to address participants’ privacy, as well as field-based data checks. The second part of this session discussed paper vs. electronic data collection. Using paper is inexpensive, the forms can be reviewed daily for quality checks, and serve as a reference during data cleaning phase. However, paper is susceptible to damage from the elements, there is no backup until the survey is copied or entered into a computer, lacks GPS validation, and increases the likelihood of transcription errors. Electronic data collection, if it works well, can have several benefits. It allows for automatic data checks, data entry is completed in the field and data can be available to supervisors almost immediately, allowing for near-real-time data quality checks. It is also easy to back up once uploaded to the server. A con of this method is that the electronic devices are susceptible to the elements and breakdown, programming errors can affect all records, and often entering dates correctly is a challenge. If paper data collection is used, an important step is data entry. When forms arrive from the field the stratum and cluster IDs must be verified. A designated team should enter data and each team member should have a unique ID that is recorded in the entry process. It is preferred that data entry occurs in a designated area unique to the data entry function and is supervised by an on-site supervisor. Double data entry should be considered for at least a random sample of the total records being entered. If conflicts arise refer to original forms

11
for verification. It is critical that the data is regularly backed-up. Finally, paper forms must be kept well organized and preferably scanned into PDF form upon completion. During data cleaning (Survey Reference Manual section 5.3), crude data are reviewed and inspected for errors that may have passed through the data entry validation checks. The distribution of each variable is examined to detect unexpected observations. Photographs of home and/or facility-based records (Survey Reference Manual section 3.4.5) provide an opportunity to validate date of vaccination info if there are questions in the data entry or data cleaning phases. Errors and subsequent resolutions, as well as any change to data values, should be made using software and not by editing values in the original dataset; all changes (and the reasons to make the change) are to be thoroughly documented. The data dictionary (or codebook) is an important survey document that allows having a common understanding of definitions or the expected meaning and acceptable representation of data for use within a defined context of data elements within a data set; ideally, it facilitates improved consistency of use of the data. Well-constructed data dictionaries allow data owners to share their data with others. The data dictionary should include the descriptive list of names, definitions, and attributes of data elements that have been included, i.e., a full dataset summary. The Dictionary is a dynamic document that must be updated as data collection requirements change, variables are phased out or introduced, or when variable definitions change. File documentation was also covered in this session as it is important if someone else needs to use the data from the survey. It is important to establish and document a system that has the 5 Cs: is Clear, Concise, Consistent, Correct, and Conformant. Household disposition tracking was presented in detail, given that this provides information needed to assess whether a survey sample may contain nonresponse error; to properly inform readers of the uncertainty of complex sample survey results which involves consideration (and reporting) of response and nonresponse; and to adjust for non-response when weighting. Finally, unique identification (Survey Reference Manual section 3.4.4), version control and data security & sharing were covered.
Q & A about precision and Bias
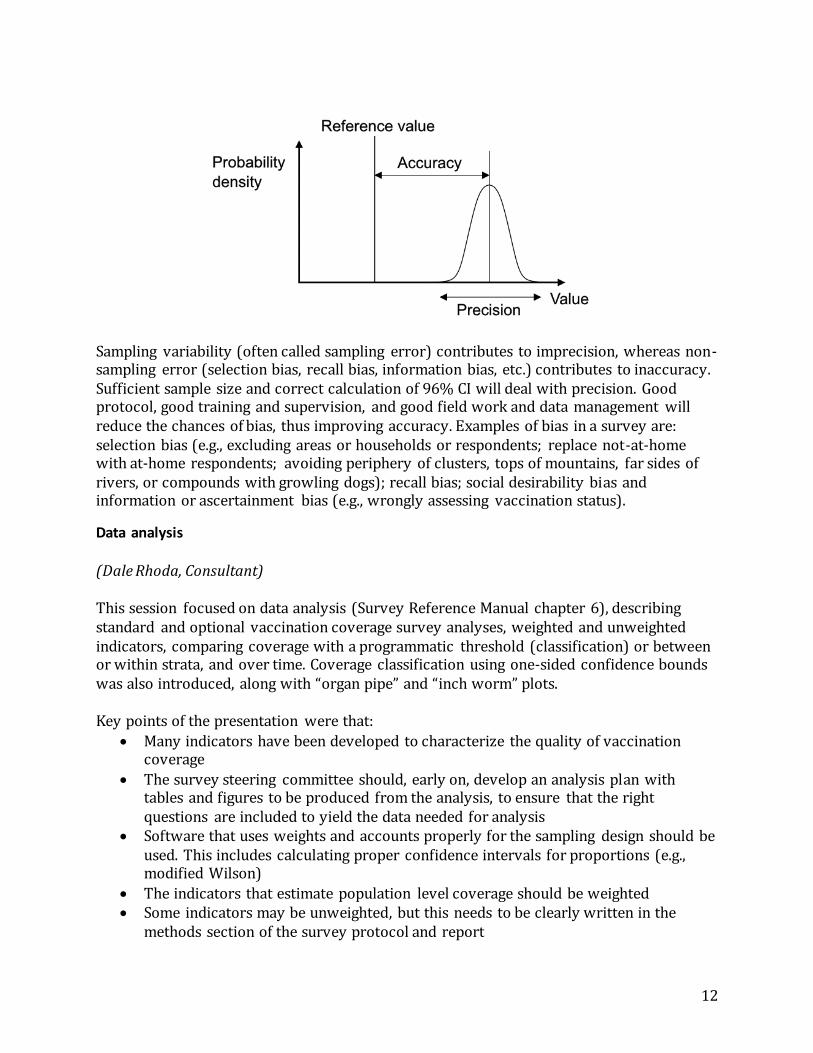
A question and answer (Q&A) session to discuss precision vs. bias was added. Accuracy and precision were discussed as illustrated by the figure below1
1 This is a modified version of an image from Wikipedia: "Accuracy and precision" by Pekaje at English Wikipedia –
Transferred from en.wikipedia to Commons. Licensed under GFDL via Wikimedia Commons – http://commons.wikimedia.org/wiki/File:Accuracy_and_precision.svg#/media/File:Accuracy_and_precision.svg
12
Sampling variability (often called sampling error) contributes to imprecision, whereas non-sampling error (selection bias, recall bias, information bias, etc.) contributes to inaccuracy. Sufficient sample size and correct calculation of 96% CI will deal with precision. Good protocol, good training and supervision, and good field work and data management will reduce the chances of bias, thus improving accuracy. Examples of bias in a survey are: selection bias (e.g., excluding areas or households or respondents; replace not-at-home with at-home respondents; avoiding periphery of clusters, tops of mountains, far sides of rivers, or compounds with growling dogs); recall bias; social desirability bias and information or ascertainment bias (e.g., wrongly assessing vaccination status).
Data analysis
(Dale Rhoda, Consultant) This session focused on data analysis (Survey Reference Manual chapter 6), describing standard and optional vaccination coverage survey analyses, weighted and unweighted indicators, comparing coverage with a programmatic threshold (classification) or between or within strata, and over time. Coverage classification using one-sided confidence bounds was also introduced, along with “organ pipe” and “inch worm” plots. Key points of the presentation were that:
Many indicators have been developed to characterize the quality of vaccination coverage
The survey steering committee should, early on, develop an analysis plan with tables and figures to be produced from the analysis, to ensure that the right questions are included to yield the data needed for analysis
Software that uses weights and accounts properly for the sampling design should be used. This includes calculating proper confidence intervals for proportions (e.g., modified Wilson)
The indicators that estimate population level coverage should be weighted Some indicators may be unweighted, but this needs to be clearly written in the
methods section of the survey protocol and report

13
Indicators should be clearly defined and described in the in the methods section of the survey protocol and report
The tool Vaccination Coverage Quality Indicators (VCQI) will be available to support survey analysis (see section below).
Vaccination Coverage Quality Indicators (VCQI)
(Dale Rhoda) While the statistical methods outlined in the new Survey Reference Manual are commonly used on large household health surveys, such as DHS and MICS, Immunization Programmes may be less familiar with them. To this end, WHO is preparing tools to facilitate the management, analysis, presentation and interpretation of survey data. One of these tools, “Vaccination Coverage Quality Indicators (VCQI)” is a set of Stata programs intended to be used by statisticians and epidemiologist to analyse survey data; and for programmers to add further modifications and additional analysis indicators. This three-part session explained the vision of the VCQI software, inputs and outputs, and had a hands-on exercise where participants run VCQI using an example dataset from an actual DHS. The vision for VCQI includes separating analysis code from survey details, defining formats for datasets and survey metadata, testing code with datasets and metadata from different surveys, and defining a process for new code. VCQI also makes code open source so that others can modify and contribute. Indicators clearly define inclusion and exclusion criteria, role of survey weights, numerators and denominators, and how to calculate them.

14
Currently, VCQI calculates indicators for:
Routine immunization (RI) surveys (18) Tetanus protection at birth surveys (TT) (1) Post-SIA coverage surveys (4)
Dataset description (3) Coverage differences (2)
The tool and user’s guide were made available to participants. Updated versions are being added to the training’s DropBox.
Survey reports
(Carolina Danovaro) An integral part of the “Taking Action” part of the 17 steps methods is the sharing of survey results. Participants were asked to propose items for a survey report and then presented with a suggested report outline to clearly include survey objectives, implementation, results and limitations. Reports should include an executive summary, historical background, survey methods, results section, discussion section, implications and recommendations, as well as annexes. The proposed outline is available in Annex 4.
What’s next?
(Carolina Danovaro, WHO HQ and Marta Gacic-Dobo, WHO HQ) Participants were awarded certificates for the completion of the training in a small ceremony. Then they were invited to stay in contact and share their experiences. In case of upcoming vaccination coverage surveys, or if secondary analysis of existing surveys such as MICS or DHS are proposed, facilitators from this training can serve as mentors to the participants. Similarly, participants with experience related to vaccination coverage surveys may also serve in a mentorship role to others. A group was created in WhatsApp Messenger to further facilitate these relationships. Additional conferences to focus on specific skillsets may be organized. Finally, participants were encouraged to join TechNet-21 where they can share experiences and take advantage of an existing Resource Library (Annex 5) that includes survey-related material. It can be viewed at http://www.technet-21.org/en/resources/vaccination-coverage-surveys
Assessment
At the conclusion of the workshop participants were asked to complete a retrospective self- assessment and an overall rating for the workshop experience. The retrospective self-assessment asked participants to rate their skill level of various tasks before the training and after the training. The overall rating, collecting feedback related to the overall organization and functionality of the workshop, was extremely positive (Annex 6).
15
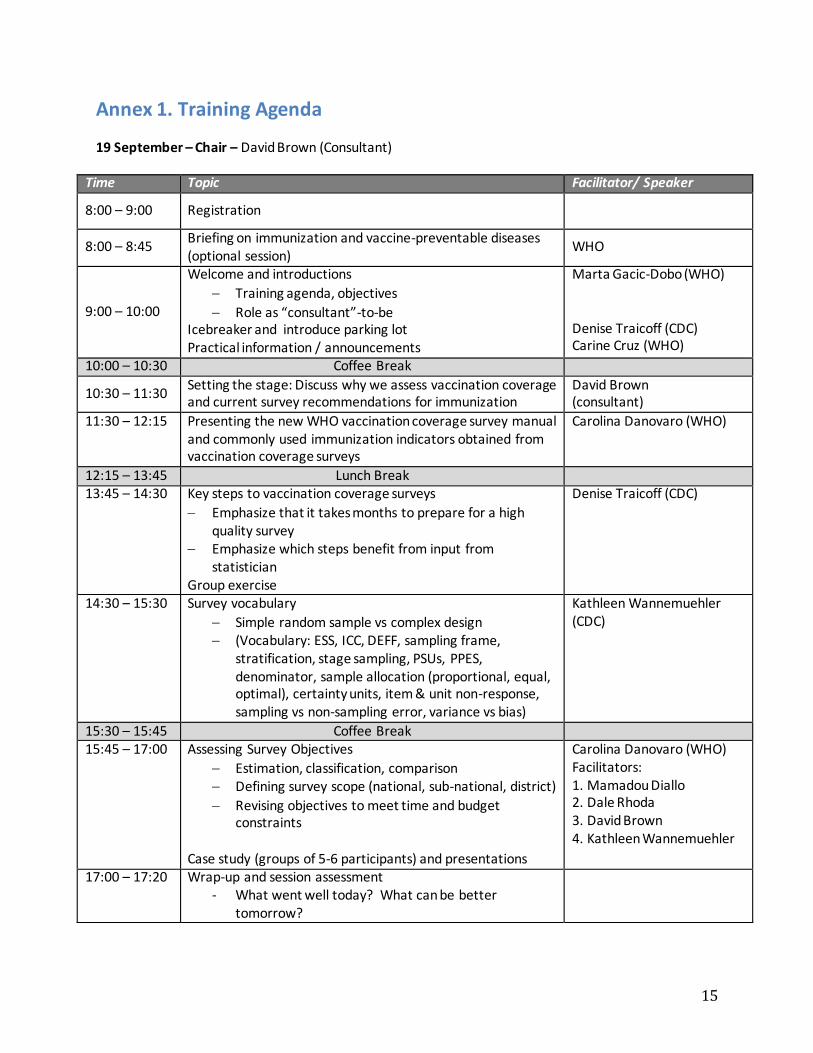
Annex 1. Training Agenda 19 September – Chair – David Brown (Consultant)
Time Topic Facilitator/ Speaker
8:00 – 9:00 Registration
8:00 – 8:45 Briefing on immunization and vaccine-preventable diseases (optional session)
WHO
9:00 – 10:00
Welcome and introductions
Training agenda, objectives
Role as “consultant”-to-be Icebreaker and introduce parking lot Practical information / announcements
Marta Gacic-Dobo (WHO) Denise Traicoff (CDC) Carine Cruz (WHO)
10:00 – 10:30 Coffee Break
10:30 – 11:30 Setting the stage: Discuss why we assess vaccination coverage and current survey recommendations for immunization
David Brown (consultant)
11:30 – 12:15
Presenting the new WHO vaccination coverage survey manual and commonly used immunization indicators obtained from vaccination coverage surveys
Carolina Danovaro (WHO)
12:15 – 13:45 Lunch Break 13:45 – 14:30 Key steps to vaccination coverage surveys
Emphasize that it takes months to prepare for a high quality survey
Emphasize which steps benefit from input from statistician
Group exercise
Denise Traicoff (CDC)
14:30 – 15:30 Survey vocabulary
Simple random sample vs complex design (Vocabulary: ESS, ICC, DEFF, sampling frame,
stratification, stage sampling, PSUs, PPES, denominator, sample allocation (proportional, equal, optimal), certainty units, item & unit non-response, sampling vs non-sampling error, variance vs bias)
Kathleen Wannemuehler (CDC)
15:30 – 15:45 Coffee Break 15:45 – 17:00
Assessing Survey Objectives
Estimation, classification, comparison Defining survey scope (national, sub-national, district)
Revising objectives to meet time and budget constraints
Case study (groups of 5-6 participants) and presentations
Carolina Danovaro (WHO) Facilitators: 1. Mamadou Diallo 2. Dale Rhoda 3. David Brown 4. Kathleen Wannemuehler
17:00 – 17:20 Wrap-up and session assessment - What went well today? What can be better
tomorrow?

16
20 September – Chair: Dale Rhoda (Consultant)
Time Topic Facilitator/ Speaker
8:30 – 9:00 Q&A from previous day David Brown 9:00 – 9:45
Distinction between estimation & classification Introducing additional detail about using one-sided estimation results to perform classification
Dale Rhoda (consultant) Mamadou Diallo (UNICEF) Facilitators
9:45 – 10:15 Sample size calculations using Annex B
Estimation, classification, comparison Inputs to the Annex B steps
Doing the calculations Strategies for compromise if sample size is too large
Dealing with field crises: clusters inaccessible; clusters too large or small; trade-offs for minimizing bias or hitting target sample size
Kathleen Wannemuehler
10:15 – 10:45 Coffee Break
10:45 – 12:30 Exercises First exercises linked to case study
Additional sample size scenarios
Kathleen Wannemuehler
12:30 – 14:00 Lunch Break 14:00 – 14:30 Sample size plenary & wrap-up
14:30 – 15:45
First Stage Sampling & Weighting (Primary Sampling Units - PSUs)
Identifying cluster sampling frames and their strengths/weaknesses
How to do probability proportional to estimated size (PPES) sampling
Allocating clusters: for sub-national estimation or proportional to population
Segmenting or joining
Replacement procedures (section 4.5 of the manual)
Kathleen Wannemuehler & Mamadou Diallo
15:45 – 16:00 Coffee Break 16:00 – 17:15 Second Stage Sampling & Weighting (Households (HHs) within
primary sampling units (PSUs))
Identifying cluster boundaries Selecting households
Kathleen Wannemuehler
17:15 – 17:30 Wrap-up and session assessment Denise Traicoff
17
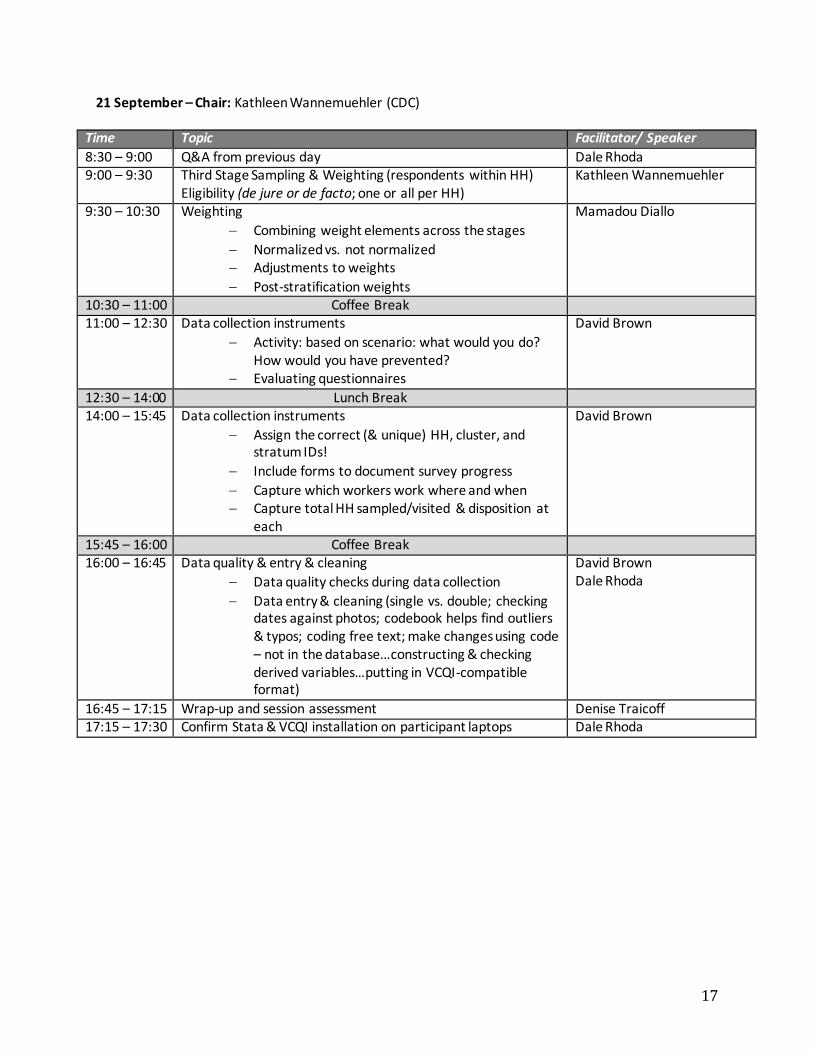
21 September – Chair: Kathleen Wannemuehler (CDC)
Time Topic Facilitator/ Speaker
8:30 – 9:00 Q&A from previous day Dale Rhoda 9:00 – 9:30 Third Stage Sampling & Weighting (respondents within HH)
Eligibility (de jure or de facto; one or all per HH) Kathleen Wannemuehler
9:30 – 10:30 Weighting
Combining weight elements across the stages
Normalized vs. not normalized Adjustments to weights
Post-stratification weights
Mamadou Diallo
10:30 – 11:00 Coffee Break 11:00 – 12:30
Data collection instruments
Activity: based on scenario: what would you do? How would you have prevented?
Evaluating questionnaires
David Brown
12:30 – 14:00 Lunch Break 14:00 – 15:45 Data collection instruments
Assign the correct (& unique) HH, cluster, and stratum IDs!
Include forms to document survey progress
Capture which workers work where and when Capture total HH sampled/visited & disposition at
each
David Brown
15:45 – 16:00 Coffee Break 16:00 – 16:45 Data quality & entry & cleaning
Data quality checks during data collection
Data entry & cleaning (single vs. double; checking dates against photos; codebook helps find outliers & typos; coding free text; make changes using code – not in the database…constructing & checking derived variables…putting in VCQI-compatible format)
David Brown Dale Rhoda
16:45 – 17:15 Wrap-up and session assessment Denise Traicoff 17:15 – 17:30 Confirm Stata & VCQI installation on participant laptops Dale Rhoda
18
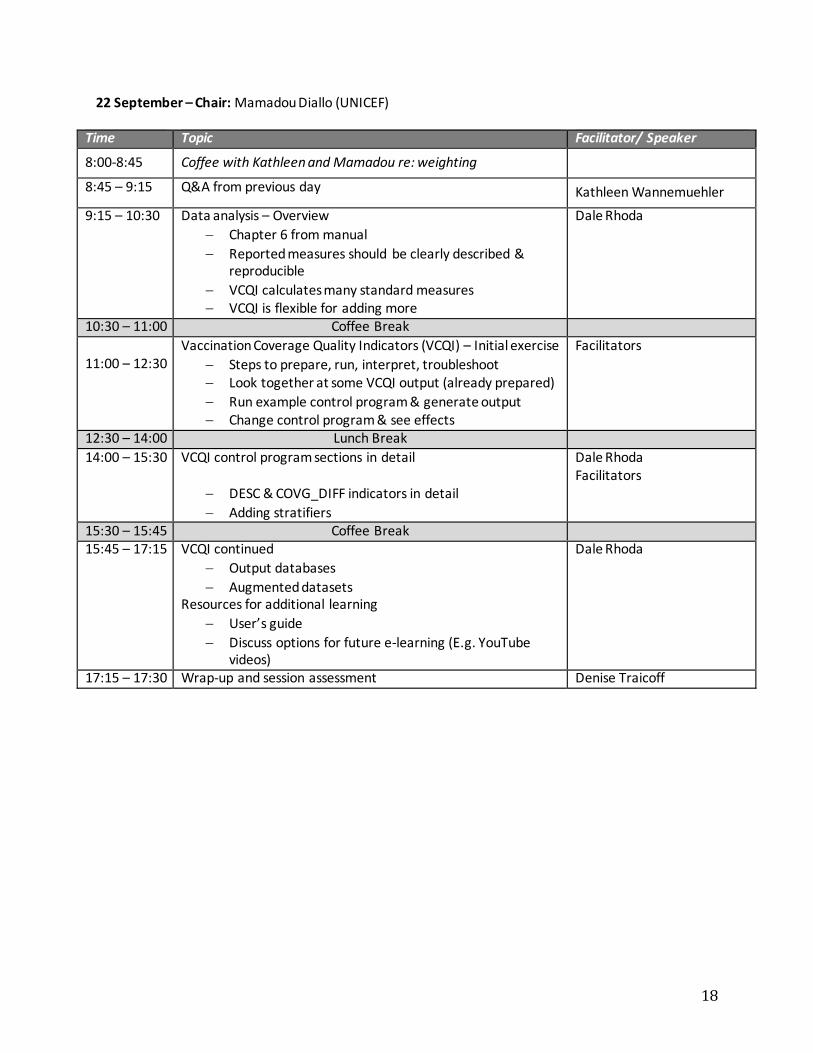
22 September – Chair: Mamadou Diallo (UNICEF)
Time Topic Facilitator/ Speaker
8:00-8:45 Coffee with Kathleen and Mamadou re: weighting
8:45 – 9:15 Q&A from previous day Kathleen Wannemuehler
9:15 – 10:30
Data analysis – Overview
Chapter 6 from manual
Reported measures should be clearly described & reproducible
VCQI calculates many standard measures VCQI is flexible for adding more
Dale Rhoda
10:30 – 11:00 Coffee Break
11:00 – 12:30
Vaccination Coverage Quality Indicators (VCQI) – Initial exercise
Steps to prepare, run, interpret, troubleshoot Look together at some VCQI output (already prepared)
Run example control program & generate output Change control program & see effects
Facilitators
12:30 – 14:00 Lunch Break
14:00 – 15:30 VCQI control program sections in detail
DESC & COVG_DIFF indicators in detail
Adding stratifiers
Dale Rhoda Facilitators
15:30 – 15:45 Coffee Break 15:45 – 17:15 VCQI continued
Output databases
Augmented datasets Resources for additional learning
User’s guide
Discuss options for future e-learning (E.g. YouTube videos)
Dale Rhoda
17:15 – 17:30 Wrap-up and session assessment Denise Traicoff

19
23 September – Chair: Marta Gacic-Dobo (WHO)
Time Topic Facilitator/ Speaker
8:45 – 9:30 Q&A from previous day Mamadou Diallo 9:30 – 10:30 Review Activity Denise Traicoff
Facilitators 10:30 – 11:00 Coffee Break
11:00 – 12:15
Survey reports
Inputs & assumptions for sample size Methods description
Results (tables & figures from VCQI) Strengths & limitations
List of possible biases & steps to minimize Publish observed DEFF & ICC, please!
Carolina Danovaro
12:15 – 13:45 Lunch Break
13:45 – 14:10 Distribution of Certificates and Group Picture 14:10 – 15:30
“What’s next?”
Mentoring and ongoing support Conclusions
Carolina Danovaro Marta Gacic-Dobo
15:30 – 16:00 Wrap-up and training assessment Denise Traicoff 16:00 End of Training

20
Annex 2. Terms of reference Vaccination Coverage Survey Statistics Consultants The 2015 WHO Vaccination Coverage Cluster Survey Reference Manual provides recommendations to improve the management, analysis, presentation and interpretation of survey data. The recommended sampling and statistical analyses in the Survey Manual are significantly more complex than in previous vaccination coverage survey recommendations. Statistics advisors are needed to provide technical assistance to country teams who plan and implement the Vaccination Coverage Survey. Assignments to specific country survey projects will be made as needs for technical assistance arise. The statistics advisors will be consultants or partner institutions and will serve as project statisticians for a vaccination coverage survey. Henceforth, this document will refer to these statisticians as ‘consultants’. Responsibilities In general it is expected that the consultants will have responsibilities to:
1. Participate in sampling decisions during protocol writing. Specifically, the consultant will advise on:
a. Calculation of sample size based on survey objectives and within the time constraints and financial means of the project
b. Determination of the appropriate sampling frame
c. Methods of sampling (e.g., primary sampling units (PSUs), segments, households, eligible respondents)
d. Advise on data collection forms (including those to keep track of households visited) 2. Advise coverage survey teams during implementation. Specifically, the consultant will advise on:
a. Calculation of the appropriate number of households per cluster
b. Identifying sources of bias and recommending methods to overcome them
c. Alternative strategies to maintain survey integrity when expected data collection becomes untenable
d. Strategies to deal with large clusters (e.g., sample with certainty, divide into smaller segments)
e. Appropriate database design, implementation and management
f. Best practices for data entry and cleaning with an awareness of logical checks and validation rules
3. Conduct survey data analysis (under the supervision of a statistician with experience in this type of survey)
4. Summarize data using charts, tables, and graphs to be included in the survey report
5. Provide hands-on training on data analysis and interpretation to Immunization and/or health staff in the country
6. Assist the overall survey effort to maintain a complete and timely documentation archive

21
Qualifications, Technical Competencies and Experience Requirements The ideal candidate:
Maintains an appropriate mixture of knowledge and experience in survey methods and/or applied (survey) statistics such that s/he feels comfortable explaining and discussing conceptual and practical aspects of survey sampling, data analysis and results presentation/interpretation
Has sufficient hands-on experience using one or more statistical software packages to analyse complex sample survey designs (e.g., Stata/SAS/R/SPSS/other program) that s/he can work independently with limited supervision
Has a demonstrated ability to communicate clearly and concisely both orally and in writing
Has working knowledge of English. In the future a variety of languages will be acceptable Expectations and Deliverables After completing the Statistical Training on the 2015 Vaccination Coverage Cluster Survey Reference manual, the Statistician will commit to being part of a pool of consultants that can be called upon to provide technical and advisory support to country teams who plan and implement a Vaccination Coverage Survey. During their first Vaccination Coverage Survey experience, the consultant will be supported directly by a statistician who is experienced in vaccination coverage surveys. This apprenticeship is expected to enable the consultant to take a lead role in providing technical and advisory support in additional Vaccination Coverage Surveys. Given World Health Organization appropriate advance notice, statistics consultants are expected to make arrangements to be available for two or more short trips to a survey site during survey planning and implementation. Financial support will be available for the consultant’s time and travel to the survey site. Expected deliverables include all or some of the following:
Develop a draft survey analytical plan and finalize it in collaboration with the country Immunization Program, and other relevant stakeholders, such as WHO
Support drafting a survey questionnaire according to best practices
Conduct and document data cleaning activities
Conduct and document agreed upon survey analyses
Share the analyses, including code books and code (e.g. Stata/SAS/R/SPSS/other program) used, with the national Immunization Program and WHO
Engage the National Immunization Program and/or other groups in the Ministry of Health in capacity-building activities around data analyses and results
Prepare a summary presentation of the main results
Prepare a detailed report with the results of all the analyses
Participate in the evaluation of the experience (interview and/or questionnaire and/or evaluation workshop)
22
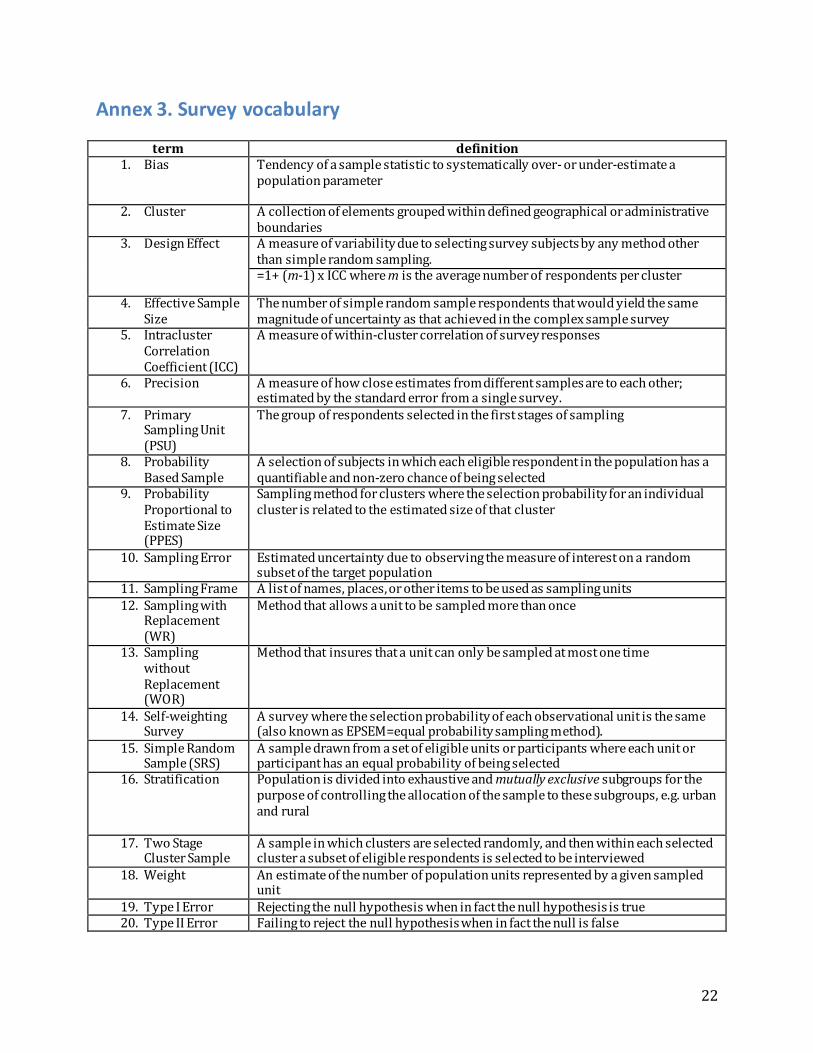
Annex 3. Survey vocabulary
term definition 1. Bias Tendency of a sample statistic to systematically over- or under-estimate a
population parameter
2. Cluster A collection of elements grouped within defined geographical or administrative boundaries
3. Design Effect A measure of variability due to selecting survey subjects by any method other than simple random sampling. =1+ (m-1) x ICC where m is the average number of respondents per cluster
4. Effective Sample Size
The number of simple random sample respondents that would yield the same magnitude of uncertainty as that achieved in the complex sample survey
5. Intracluster Correlation Coefficient (ICC)
A measure of within-cluster correlation of survey responses
6. Precision A measure of how close estimates from different samples are to each other; estimated by the standard error from a single survey.
7. Primary Sampling Unit (PSU)
The group of respondents selected in the first stages of sampling
8. Probability Based Sample
A selection of subjects in which each eligible respondent in the population has a quantifiable and non-zero chance of being selected
9. Probability Proportional to Estimate Size (PPES)
Sampling method for clusters where the selection probability for an individual cluster is related to the estimated size of that cluster
10. Sampling Error Estimated uncertainty due to observing the measure of interest on a random subset of the target population
11. Sampling Frame A list of names, places, or other items to be used as sampling units 12. Sampling with
Replacement (WR)
Method that allows a unit to be sampled more than once
13. Sampling without Replacement (WOR)
Method that insures that a unit can only be sampled at most one time
14. Self-weighting Survey
A survey where the selection probability of each observational unit is the same (also known as EPSEM=equal probability sampling method).
15. Simple Random Sample (SRS)
A sample drawn from a set of eligible units or participants where each unit or participant has an equal probability of being selected
16. Stratification Population is divided into exhaustive and mutually exclusive subgroups for the purpose of controlling the allocation of the sample to these subgroups, e.g. urban and rural
17. Two Stage Cluster Sample
A sample in which clusters are selected randomly, and then within each selected cluster a subset of eligible respondents is selected to be interviewed
18. Weight An estimate of the number of population units represented by a given sampled unit
19. Type I Error Rejecting the null hypothesis when in fact the null hypothesis is true 20. Type II Error Failing to reject the null hypothesis when in fact the null is false

23
Annex 4. Suggested Report Outline
1. High level executive summary 2. Historical background section
The EPI (include vaccination schedule(s) that cover all birth cohorts targeted by the survey) and health sector in “COUNTRY”.
If there have been recent changes in the national immunization programme—such as the introduction of new vaccines or changes in delivery strategy—or the health sector (e.g., introduction of universal health insurance), include in the historical overview.
Summary of recent administrative coverage data or disease outbreak description in the case of a post-SIA survey
Summary of previous vaccination coverage survey results
Justification to do this survey Survey objectives (primary, secondary)
3. Survey methods Sampling
i. Target population and exclusions for practical reasons ii. sampling frames
iii. sample size calculations iv. Selection methods at each stage v. Replacement methodology at each stage
Profile of implementing personnel Training and piloting Field work (data collection tools, pictures)
Ethical considerations Data management (overview of issues related to data collection, segmented
clusters with the necessary information, checking, storage and security, etc) Weighting
i. Overall base weight calculation ii. Weight adjustments (e.g. nonresponse)
Brief summary of the results in terms of sample sizes, response rates, etc. (unweighted or weighted depending on the tables)
i. Final number of clusters (initial, replaced, non-respondent, etc.) by stratum
ii. Final number of households (initial, replaced, non-respondent, etc.) by stratum
iii. Final number of children (initial, replaced, non-respondent, etc.) by stratum
Analyses done 4. Results section
Summary of available info on those not included in the analysis (e.g., refusals, partial completes)
Description of sample

24
o Summary of respondent background characteristics as appropriate o May want to put here issues about number of age-eligible children per HH
estimated vs what was observed in each strata/cluster
Main results (include tables; graphs such as inchworm plots, if relevant; maps; and highlight main findings as text)
o Vaccination cards given vs. seen and reasons (if collected) o Estimated coverage: crude, valid, zero dose o Drop-outs o Vaccination timeliness and simultaneity (as appropriate, eg. Penta3 together
with OPV3, IPV1 and PCV3) o Missed opportunities for vaccination o Reasons for no vaccination o Factors associated with no/incomplete vaccination o Highlight clusters with an “alarmingly low” (define) number of vaccinated
people (if any) 5. Discussion section, with strengths and limitations and implications of limitations
(eg. Likely bias towards lower/higher coverage)
In design (examples of limitations: sampling frame, maps, sampling size too big for SIA, training-related issues and what was done to reduce)
In implementation (examples of limitations: selection of eligible persons; data collection; boundaries and not being able to use the GIS features of tablets; any inaccessible areas that had to be excluded from the sampling frame inaccessible clusters at the time of visit; any difficulties extracting vaccination data from home-based records; low percentage of documented vaccination, especially for SIA)
6. Implications and recommendations
Main recommendations based on the results. Examples: o Clusters with an “alarmingly low” number of vaccinated people o Significant lower coverage some districts compared in the rest of the country o Drop-out o Low card distribution and/or availability, variety of cards? Forms not
separating different vaccines (for example, pentavalent together with OPV in the daily form)?
o Private vs public sector? 7. Annexes
All survey materials (including questionnaires, sketch maps for selected clusters, material related to selection of field staff including terms of reference, field staff training agendas and tools, Standard Operational Procedures (SOPs), letters of introduction from government to local leaders, final ethical review approval correspondence, etc.)

25
Annex 5. TechNet Resource Library The TechNet Resource Library (TRL) is an online repository of journal articles, documents, tools, websites, and other immunization resources. It includes about 1000 entries relating to Immunization Information Systems (IIS) and it includes a powerful search tool. Also, recently a new page with survey-related material is now available and can be viewed at http://www.technet-21.org/en/resources/vaccination-coverage-surveys. To visit the TRL you need to sign up to TechNet.
Go to the following link and register for Technet-21 (takes 2 minutes): http://www.technet-21.org/register-new-users
Once you are registered, you will receive administrator/moderator’s approval and will be ready to go.
Some of the key features within the TRL are:
Browse and search according to your information needs Add and share your own resources with a wide network of immunization
professionals Create collections of your favourite resources and share them with your colleagues
Annex 6. Workshop Evaluation Three methods were used to evaluate the training:
1. At the end of each day, staff facilitated an informal focus group, asking what went well and how to improve the following day.
2. At the end of the workshop Staff administered a survey with a handful of questions pertaining to the application of what participants learned, and their preferences for ongoing support
3. Staff administered a retrospective self-assessment, wherein participants responded to 19 statements, ranking their ability before and after the workshop.
Responses are described below.
1. End of day focus groups
Participants liked Participants suggested improvements
Balance of content More time for exercises Exercises Provide dictionary of symbols & formulas Positive Discussions More sharing of experiences Case study Some presentations are hard to see Mixture of lectures & discussions Stay on schedule

26
2. End of workshop survey
How able are you to put what you learned into practice on the job?
Number of Responses
I am not at all able to put the concepts into practice.
0
I have general awareness of the concepts taught, but I will need more training/practice/guidance/experience to do actual jobs tasks using the concepts taught.
4
I am able to work on actual job tasks, but I’ I’ll need more hands-on experience to be fully competent in using the concepts.
9
I am able to perform actual job tasks at a FULLY COMPETENT LEVEL using the concepts taught.
3
I am able to perform actual job tasks at an TASKS at an EXPERT LEVEL using the concepts taught.
3
How motivated will you be to use these skills?
Number of Responses
I will make this one of my highest priorities when I get back to my day-to-day job.
6
I will make this a high priority when I get back to my day-to-day job.
10
I will make this a moderate priority when I get back to my day-to-day job.
3
I will make this a priority, but a low priority, when I get back to my day-to-day job.
0
I will not make this a priority when I get back to my day-to-day job.
0
Do you feel you were able to get the help you needed? Eighteen respondents marked “Yes” and there was one no response. Overall, what is your opinion of the workshop? Common themes included rating the workshop as excellent; there was consensus that facilitators provided an adequate balance between lecture and activities, and appropriate management of varying levels of statistical knowledge. Below are examples of responses:

27
“impressed with how much they learned” “I still have a lot to learn”
“useful and well organized” “facilitation was good”
“good information exchange experience” “I appreciate the WHO team” “good balance between theoretical concept, implementation issues, and hands-on
exercises” “balanced the information appropriately for people who have a statistical
background and those that don’t” The overlying theme was that there needed to be two days for VCQI and more exercises to practice the concepts. How could the workshop be improved?
“more exercises” “close to perfect”
“more VCQI time” “have detailed demonstrations or exercises with live data to enhance understanding.
What is your preferred format for technical support?
Number of Responses e-learning 11
Mentors 10 WhatsApp 9 Teleconferences 7 Web-based platform 9 In-person workshops 12 Email communications 10 Other (describe) Video tutorial
Video tutorial Skype
In-person workshops, e-learning, and mentors were the most preferred method for support. While teleconferences was the least preferred method. For a full evaluation report, please refer to the training DropBox.