statistical techniques for research rommel s. de gracia rommel s. de gracia seps for planning &...
TRANSCRIPT
STATISTICAL TECHNIQUES
FOR research ROMMEL S. DE GRACIA SEPS for PLANNING & RESEARCH

What options you have? •BE LAME – “Usual Thinking Syndrome” – soothed with what you have and “think no more”;
•BE RIDICULOUS - Do things badly; or
•BE STRATEGIC – be an agent of positive change; Do the right things right.

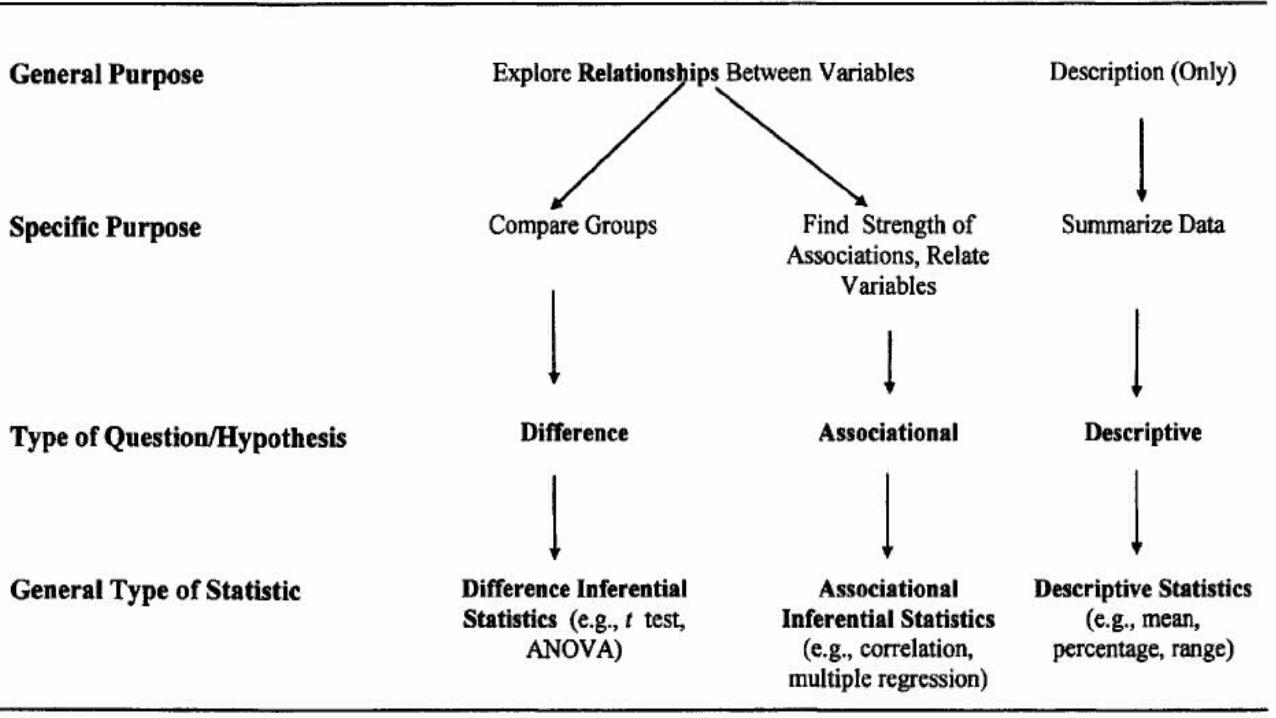
Considerations for Choosing a Statistical Technique THE RESEARCH QUESTION. What is it that we want to know? That is, do we want to test differences, to explore relationships between variables, or to simply describe our data? THE NATURE AND LEVEL OF MEASUREMENT OF THE DATA COLLECTED. That is, is our data numerical or categorical? Is our data of the nominal, ordinal, or interval/ratio level? NUMBER OF VARIABLES INVOLVED IN THE INVESTIGATION. That is, do we need to use

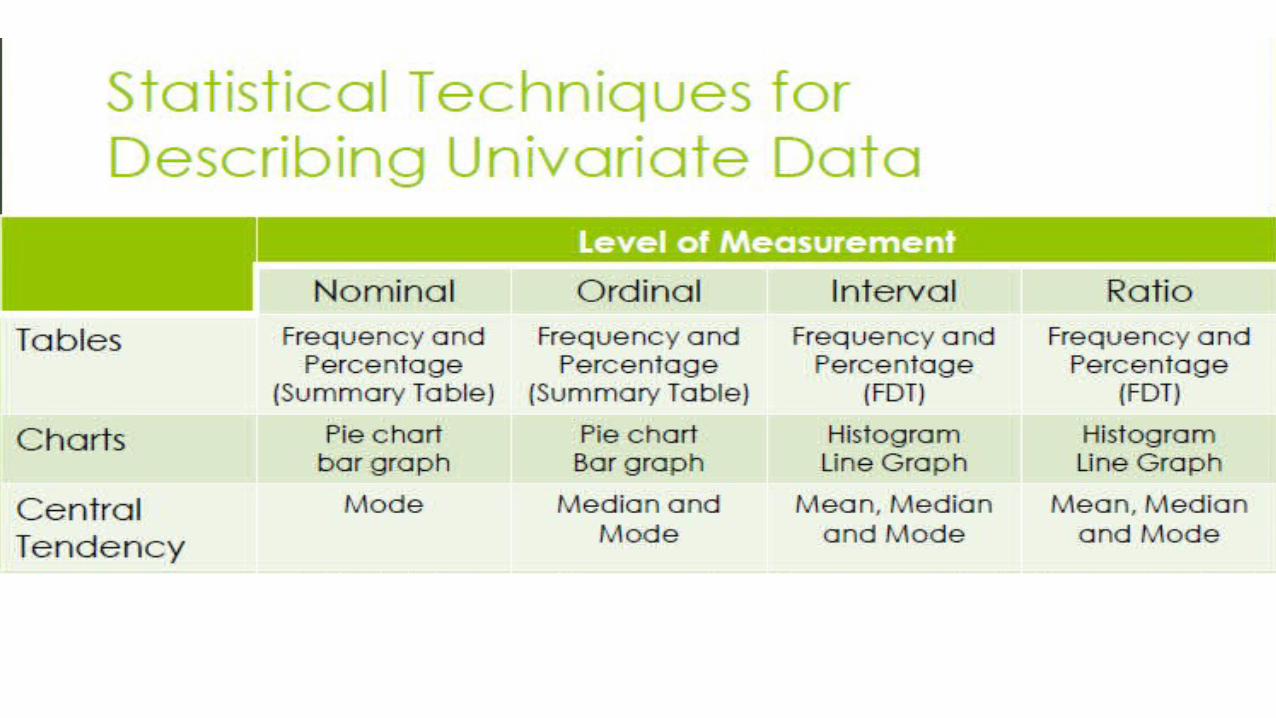
Scale of Measurement
Nominal – qualitative and categorical (for identification)
Ordinal – qualitative and ranked data – (converted numerically)
Interval-Ratio – quantitative with meaning

Guide for Choosing Statistical Techniques 1Univariate techniques are used to investigate one variable at a time. 1Bivariate techniques are used to investigate two variables at time. 1Multivariate techniques are used to analyze more than two variables simultaneously.


Some Examples:Example of Research Questions
Independent Variable
Dependent Variable
Essential Feature Descriptive
Statistics
What is the compliance in the implementation of the Grade 2 English curriculum relative to a. Percent of LC’s implemented b. Number of teaching-learning delivered c.Percent of learning competencies mastered
Mean %MedianStandard Deviation
Level/ Extent of Compliance
a. % of LCs implemented.b. No of teaching-learning deliveredc. % of learning competence
Descriptive
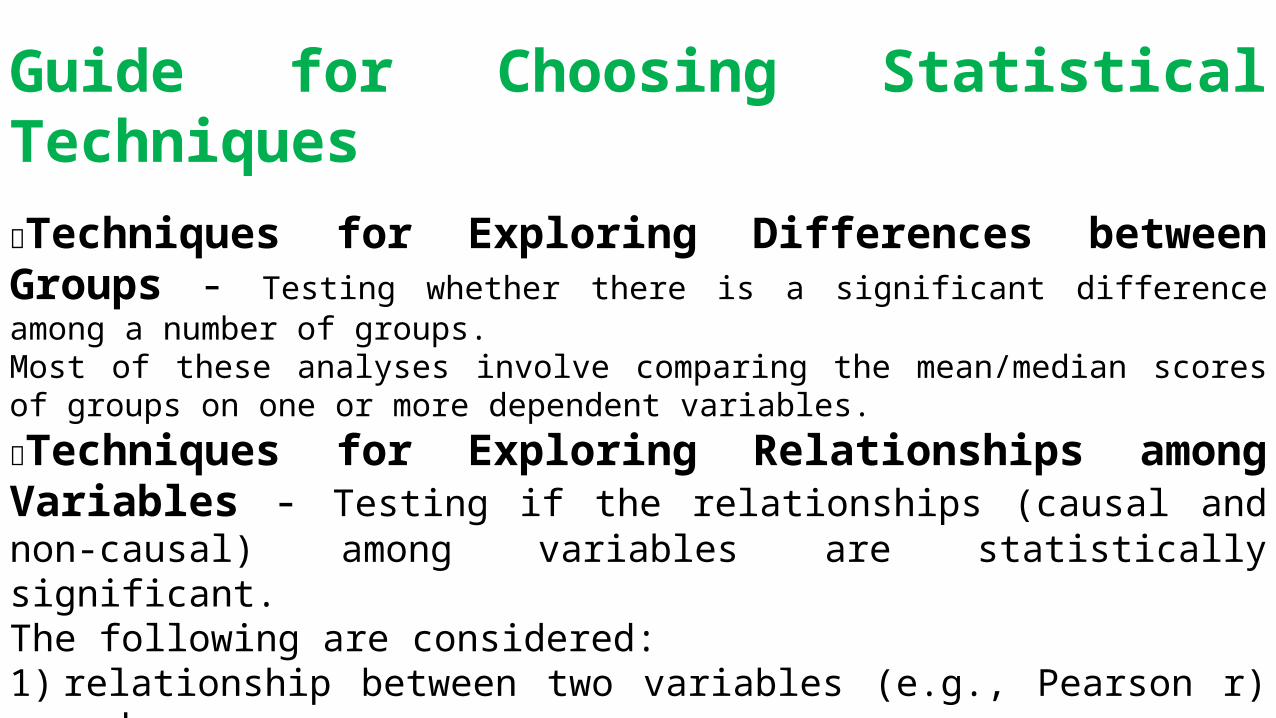
Guide for Choosing Statistical Techniques
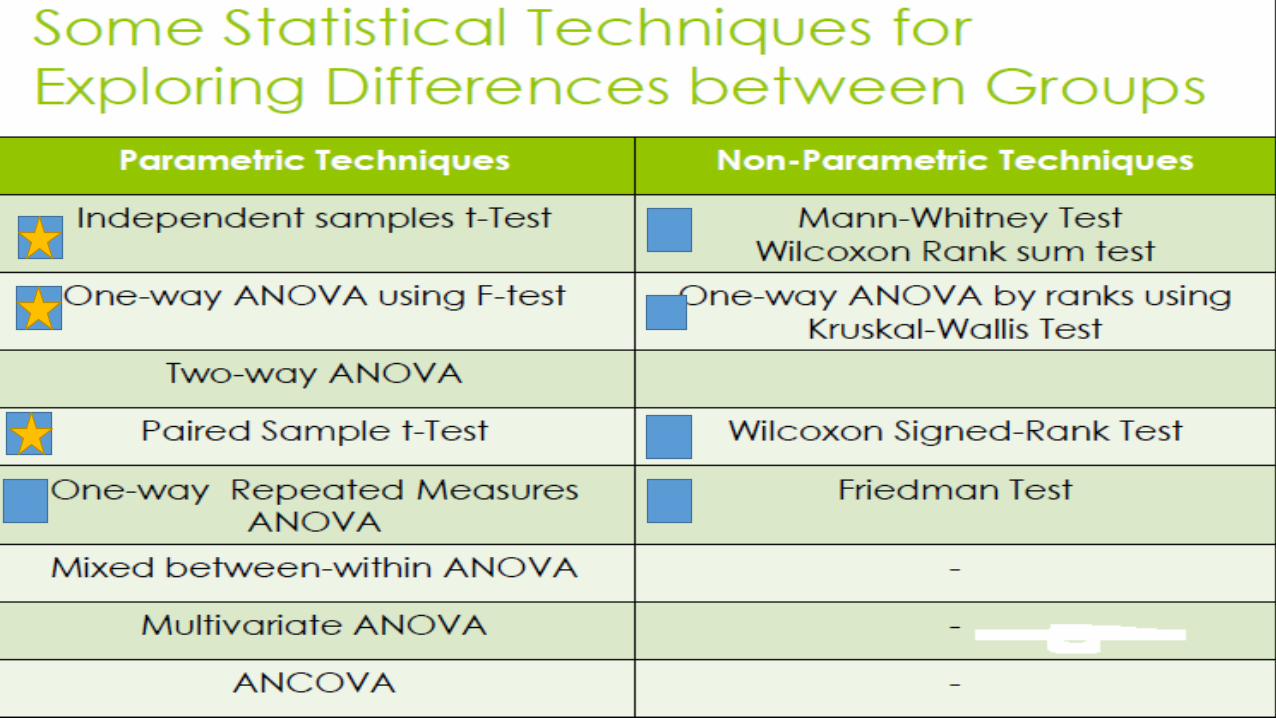
Techniques for Exploring Differences between Groups - Testing whether there is a significant difference among a number of groups. Most of these analyses involve comparing the mean/median scores of groups on one or more dependent variables.
Techniques for Exploring Relationships among Variables - Testing if the relationships (causal and non-causal) among variables are statistically significant. The following are considered: 1) relationship between two variables (e.g., Pearson r) and 2) causal relationships of variable/s on another variable (e.g., linear regression analysis).

A Comparison Nonparametric tests are distribution free and do not require testing for assumptions. When assumptions are met, parametric tests are more powerful.

YES
YES
NO
YES
Some Examples:Example of Research Questions
Independent Variable
Dependent Variable
Essential Feature
Parametric Statistics
Non-Parametric(Alternative)
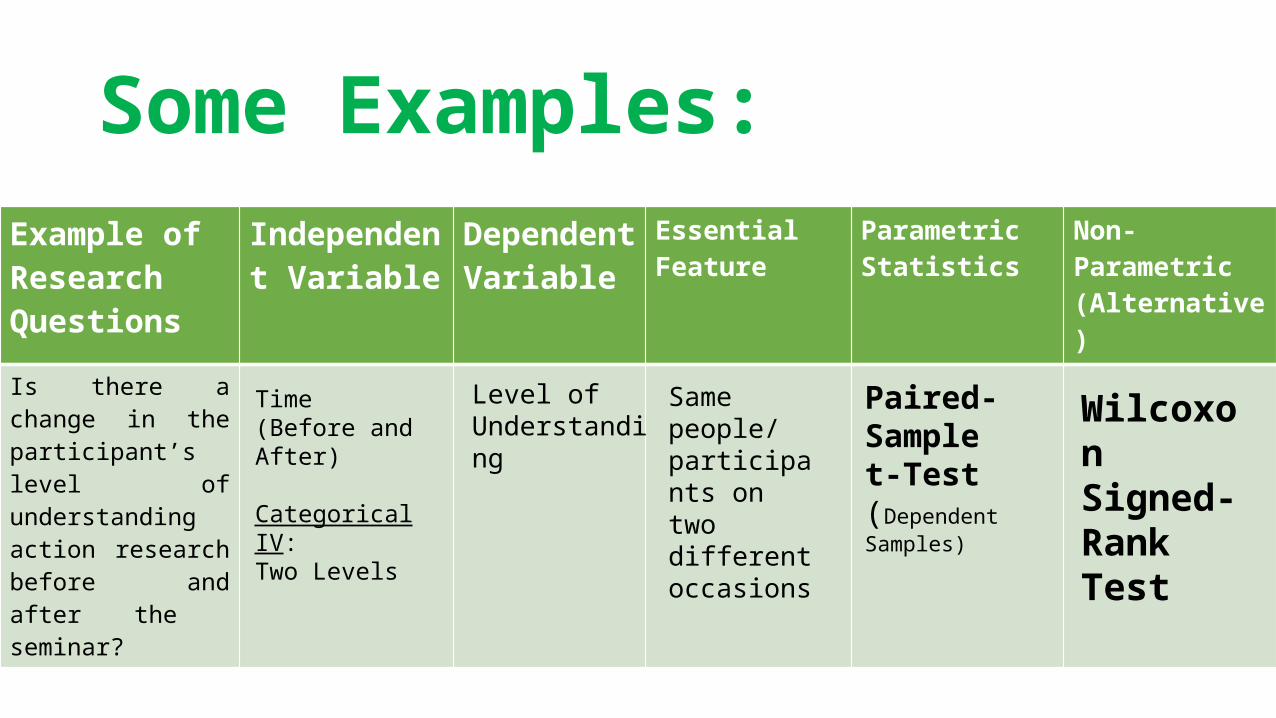
Is there a change in the participant’s level of understanding action research before and after the seminar?
Time (Before and After)
Categorical IV: Two Levels
Level of Understanding
Same people/participants on two different occasions
Paired-Sample t-Test(Dependent Samples)
Wilcoxon Signed-Rank Test

Example of Research Questions
Independent Variable
Dependent Variable
Essential Feature Parametric Statistics
Non-Parametric(Alternative)
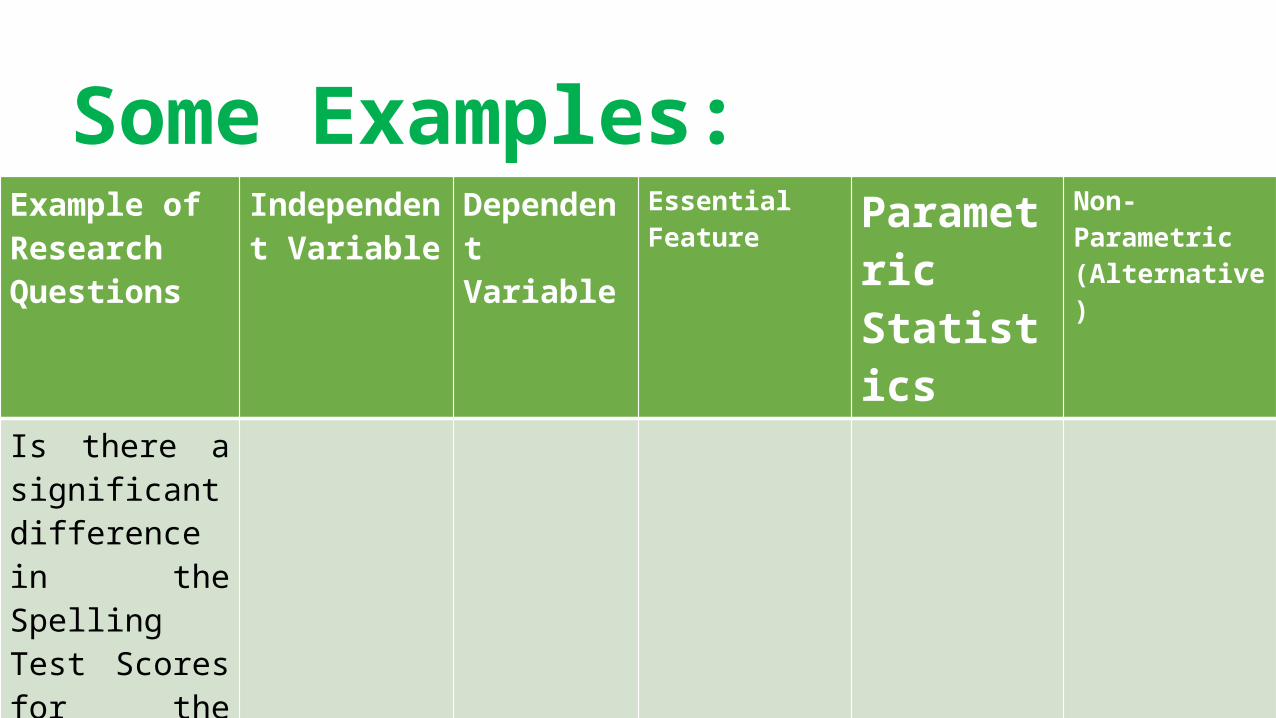
Is there a significant difference in the Spelling Test Scores between males and females?
Some Examples:
GENDER (Male and Female)
Categorical IV: Two Levels
Spelling Test Scores
Two Groups: Different people in each group
T-Test for Independent Samples
Mann Whitney test
Wilcoxon Rank sum test
Example of Research Questions
Independent Variable
Dependent Variable
Essential Feature Parametric Statistics
Non-Parametric(Alternative)
Is there a significant difference in the Spelling Test Scores for the three-different curricula (RBEC, STEM, SPA)?
Some Examples:

Example of Research Questions
Independent Variable
Dependent Variable
Essential Feature Parametric Statistics
Non-Parametric(Alternative)
Is there a significant difference in the Spelling Test Scores for the three-different curricula (RBEC, STEM, SPA)?
Curricula(RBEC, STEM, SPA)
Categorical IV: Three Levels/Groups
Spelling Test Scores
More than two groups: Different people in each group
One-Way ANOVA using F-Test
Kruskal Wallis ANOVA by ranks
Some Examples:

Example of Research Questions
Independent Variable
Dependent Variable
Essential Feature Parametric Statistics
Non-Parametric(Alternative)
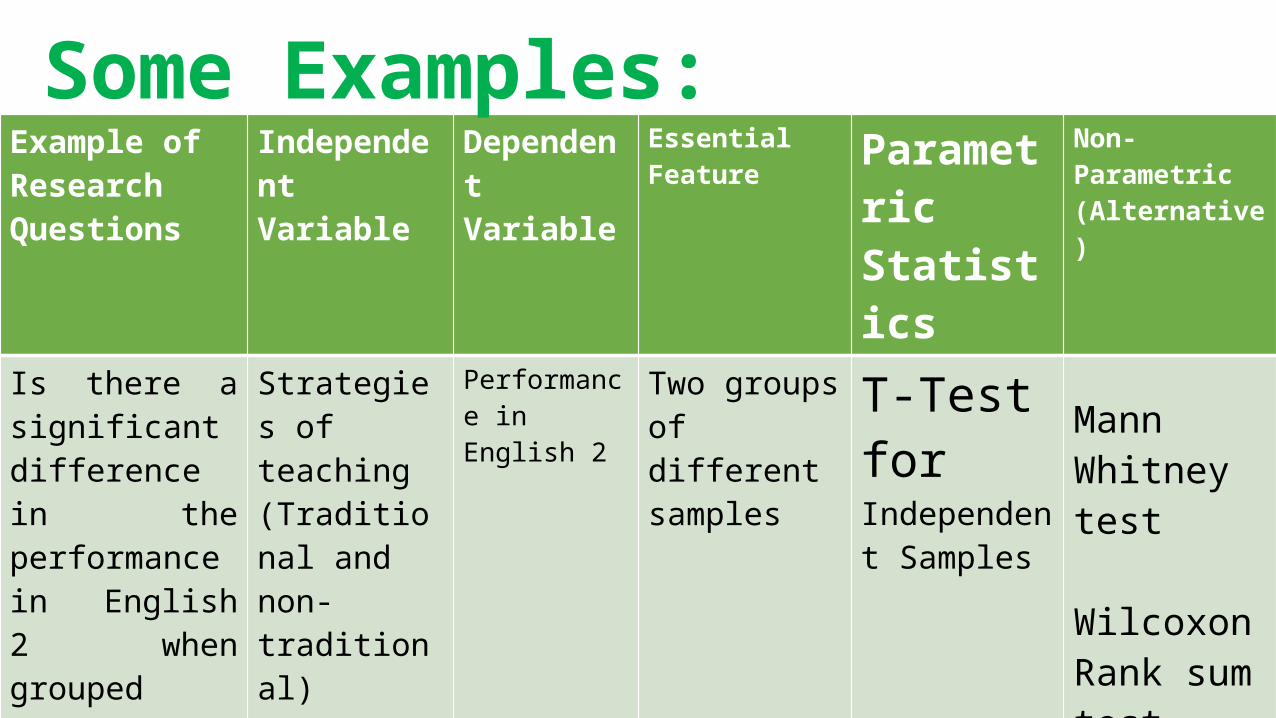
Is there a significant difference in the performance in English 2 when grouped according to the strategies of teaching (traditional and non-traditional) used?
Some Examples:
Example of Research Questions
Independent Variable
Dependent Variable
Essential Feature Parametric Statistics
Non-Parametric(Alternative)
Is there a significant difference in the performance in English 2 when grouped according to the strategies of teaching (traditional and non-traditional) used?
Strategies of teaching(Traditional and non-traditional)
Categorical IV: Two levels
Performance in English 2
Two groups of different samples
T-Test for Independent Samples
Mann Whitney test
Wilcoxon Rank sum test
Some Examples:


Some Examples:

Example of Research Questions
Independent Variable
Dependent Variable
Essential Feature Parametric Statistics
Non-Parametric(Alternative)
Is there a relationship between educational attainment and percent of LCs implemented?
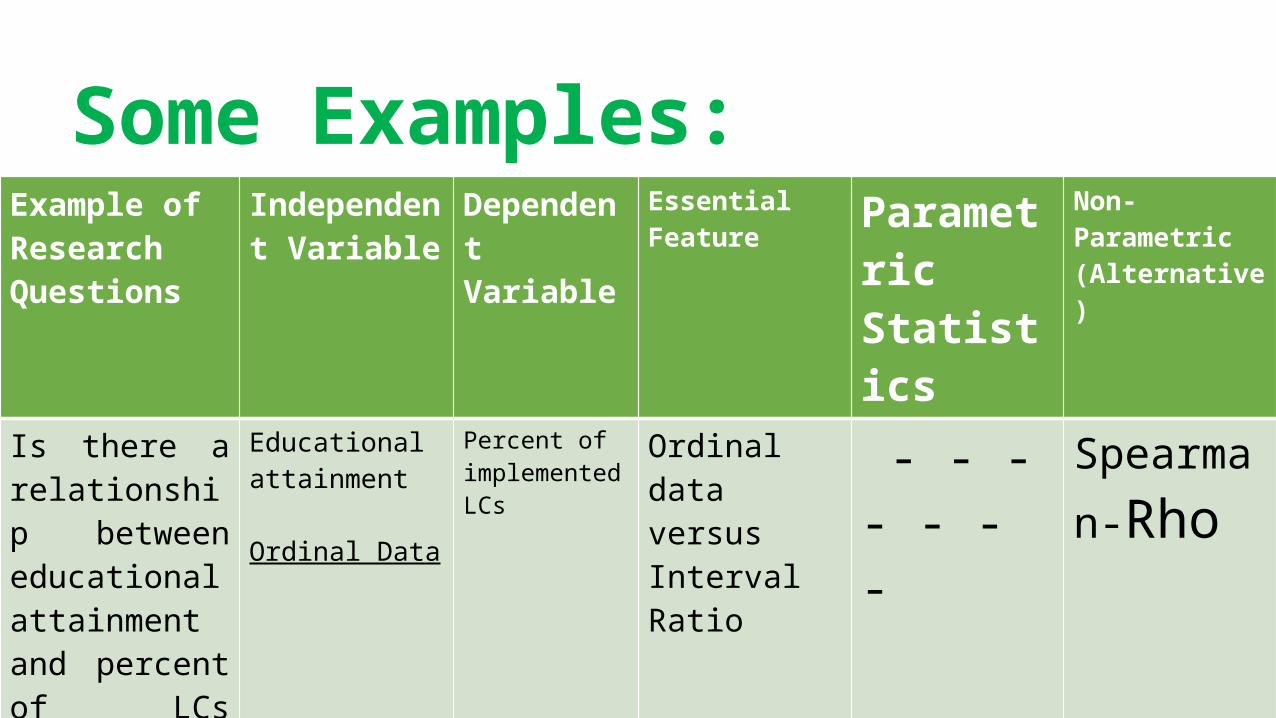
Example of Research Questions
Independent Variable
Dependent Variable
Essential Feature Parametric Statistics
Non-Parametric(Alternative)
Is there a relationship between educational attainment and percent of LCs implemented?
Educational attainment
Ordinal Data
Percent of implemented LCs
Ordinal data versus Interval Ratio
- - - - - - - Spearman-Rho
Some Examples:

WORKSHOP 1
