statistical study of the impact of adaptive traffic signal...
TRANSCRIPT

117
Transportation Research Record: Journal of the Transportation Research Board, No. 2356, Transportation Research Board of the National Academies, Washington, D.C., 2013, pp. 117–126.DOI: 10.3141/2356-14
C. Slavin, W. Feng, and M. Figliozzi, Civil and Environmental Engineering, Port-land State University, P.O. Box 751, Portland, OR 97207. P. Koonce, Portland Bureau of Transportation, 1120 Southwest 5th Avenue, Room 800, Portland, OR 97204. Corresponding author: M. Figliozzi, [email protected].
to help buses to stay on schedule. A late bus communicates a priority request to the traffic signal controller, and the controller adjusts the settings to allow for additional green time for the bus or shortened red time if the bus is waiting at the intersection. Efficient TSP sys-tems are able to help buses stay on schedule and improve their travel time and reliability (2). Another tool used to manage traffic signals more effectively is adaptive traffic signal control, which operates traffic signals by using real-time traffic demand data to optimize the performance of the corridor or network.
The main goal of this study was to evaluate whether the imple-mentation of adaptive traffic systems positively affects traffic speeds, bus transit performance, and TSP. The next sections present background regarding adaptive signal control and TSP, a descrip-tion of the study area, key performance measures, a discussion of the results, and conclusions.
Background
adaptive Traffic Signal control
Traffic signal timing can be used to alleviate congestion by using the existing infrastructure as efficiently as possible. However, traf-fic signal timing is often unresponsive to actual traffic conditions because it is run by pretimed plans that are updated every couple of years. This practice is problematic when unexpected traffic patterns occur, and it can lead to worsened congestion, especially during heavy commuting periods. Adaptive traffic signal control is a solu-tion that is responsive to the traffic conditions in the field. These systems use detection and algorithms to adapt the traffic signal tim-ing parameters to optimize traffic operations. Various types of adap-tive systems are available that operate in slightly different manners. One widely used system is the Sydney Coordinated Adaptive Traffic System (SCATS).
SCATS was developed in Australia in the early 1970s and has been used successfully in Australia for the past 40 years. The current system uses loop detection near the stop bars in addition to video cameras to operate in real-time conditions. The system optimizes cycle lengths, phase splits, and offsets on a cycle-by-cycle basis. The degree of saturation is used to adjust the cycle length. Phase splits are timed by giving each approach an equal degree of satura-tion, or higher priority can be given to the main road. SCATS selects offsets on the basis of free-flow travel time and degree of saturation, which provides minimum stops for the vehicles on the main road-way. The popularity of SCATS has grown over time, and its use has expanded to other countries, including the United States (3).
Statistical Study of the Impact of Adaptive Traffic Signal Control on Traffic and Transit Performance
Courtney Slavin, Wei Feng, Miguel Figliozzi, and Peter Koonce
The Sydney Coordinated Adaptive Traffic System (SCATS) is designed to improve mobility on congested corridors with variable demand; SCATS is expected to improve transit performance. Because many urban corri-dors are heavily used by transit routes, it is important to determine how SCATS affects transit performance on congested corridors. However, there is limited research on evaluating the impact of SCATS on tran-sit performance. To the best of the authors’ knowledge, this research presents the first field evaluation of SCATS with transit signal priority in the United States. The case study is based on before-and-after traffic and transit data along Powell Boulevard, one of the most congested urban arterials in the Portland, Oregon, metropolitan region. Using permanent traffic data collection stations, bus automated vehicle location and automatic passenger count data, and transit signal pri-ority request data, this work presents the results of statistical tests and regressions to determine the impacts of SCATS. Statistically sig-nificant differences were observed in travel times and SCATS-related regression parameters. Overall, travel time changes or improvements related to SCATS seemed to depend greatly on the direction of travel and time of day.
Congestion in urban areas is a growing concern in the United States. Over the past 20 years, not only has congestion increased in cities, but it has created longer peak periods and continues to reduce travel time reliability. In some urban areas, public transpor-tation has been expanded and given priority as a tool to increase mobility while alleviating congestion because efficient public transportation can provide a more affordable option and is able to transport more passengers per vehicle than private vehicles. Buses make up the largest percentage of public transportation modes in the United States, with 52.5% of the number of passenger trips and 38.9% of the passenger miles; transit use has increased in the past two decades (1).
One of the problems of a bus transit system is that buses are directly affected by roadway congestion wherever they share the right-of-way with general traffic. Hence, the performance of public transit in congested corridors is affected by traffic volumes and sig-nal timing at intersections. Transit signal priority (TSP) can be used

118 Transportation Research Record 2356
Evaluation of ScaTS
SCATS has been installed in cities across the United States with mixed results. Various before-and-after studies have tested the improvements of adaptive traffic signal control compared with exist-ing pretimed or time-of-day plans. Many claims are made about per-formance improvements; however, the results vary on a case-by-case basis. Some differences in performance improvements may be partly related to how the evaluation was conducted, in addition to other potential site-specific reasons.
The evaluation of an adaptive traffic signal control system is not a trivial exercise and requires certain conditions to ensure fairness and accuracy. One condition is related to the reference system or the exist-ing timing plans that constitute the evaluation baseline; the more opti-mized and responsive to traffic conditions the existing timing plans already are, the more difficult it is to see improvements with the imple-mentation of an adaptive system. Clearly defining the baseline system performance is crucial when improvements are reported (4).
Other factors that affect the evaluation of an adaptive traffic sig-nal control system are roadway specific, such as changes in traf-fic volumes and geometry of the intersections. Geometric changes or not controlling for traffic volumes between the before and after periods can be another common flaw in the evaluation; relevant data should be collected within a narrow time window to avoid big changes in the demand patterns. Most of the studies did not use per-manent data collection stations and instead focused their evaluation on peak and off-peak periods. This practice provides insufficient data because traffic volumes fluctuate greatly throughout the day.
Only a few studies have evaluated the joint effects of adaptive signal control systems and TSP in the United States (5–7), and few evaluations have closely examined the relationship between SCATS and TSP (8). The City of Beaverton in Oregon implemented SCATS on Farmington Road in 2011. Only six of the intersections operate under adaptive signal control. The 0.7-mi segment carries heavy traffic in the eastbound and westbound directions. The corridor has two travel lanes in each direction and a speed limit of 30 mph. The before-and-after study conducted by DKS Associates exam-ined three performance measures: side-street delay, travel time, and recovery from signal preemption (9). Side-street delay was obtained from a Synchro model, the travel time from Bluetooth media access control reader devices, and the recovery from signal preemption was found with preemption logs. The results indicated that the larg-est improvement was a faster recovery time after preemption from the TriMet (the transit agency for the Portland metro area) WES commuter train. Before SCATS was implemented, recovery from preemption took up to 6 min; afterward, recovery was reduced to less than 2 min. With preemption triggered every 10 to 15 min dur-ing peak periods, this reduction in recovery has had a significant impact on traffic performance. However, side-street delay was reduced only when traffic arrived randomly and not in a platoon; the greatest travel time improvements occurred during off-peak periods. No statistical tests were conducted. Research has also sim-ulated SCATS and its impact on emissions using VISSIM, but TSP was not included (10, 11).
STudy arEa dEScripTion
Powell Boulevard is an urban arterial corridor located in Portland, Oregon, that connects the Portland downtown and the City of Gresham. Powell Boulevard, also known as Highway US-26, has
two lanes of traffic in each direction and a variety of land uses. The route runs in the eastbound and westbound directions and includes the Ross Island Bridge, which crosses the Willamette River. The study area is shown in Figure 1a, where downtown Portland is shown to the west of Powell Boulevard. In the map, Points A and D are the start and end points, respectively, of the study corridor along Powell Boulevard.
Powell Boulevard is a major commuter arterial that has experi-enced growing congestion in the westbound direction in the morn-ing peak period and in the eastbound direction in the evening peak period. Congestion has rendered the arterial unable to meet its pur-pose of efficiently moving users. However, improving the perfor-mance of this arterial is difficult because of the competing needs of different types of users, such as pedestrians, transit, and private automobiles, as well as balancing mobility and accessibility for a diverse array of activities and land uses along the corridor.
Powell Boulevard experiences congested or over-capacity condi-tions during peak periods. In 2009, the average annual daily traffic ranged from 56,500 vehicles right off the Ross Island Bridge, to 41,000 vehicles at the intersection of Powell and Milwaukie Ave-nue, to 34,100 vehicles at the intersection of Powell Boulevard and 39th Avenue (12). By following the Highway Capacity Manual procedures to obtain signalized intersection level of service (LOS), it was found that the intersection at Powell and 39th has a rela-tively low LOS during peak periods, ranging from C to F (13). For the morning peak period, from 8 to 9 a.m., one of the movements operates at LOS F, and the westbound through movements are at LOS E. For the afternoon peak period, from 5 to 6 p.m., four of the movements (two left turns and two eastbound through movements) operate at LOS F. LOS by movement for Powell and 39th Avenue is shown in Figure 1c for both peak periods. Intersection LOS was calculated on the basis of delay per movement (14).
A high-frequency bus route that runs along Powell Boulevard is also affected by congestion. Route 9 is in the top 10 TriMet routes in terms of productivity and passenger demand. In 2011, Route 9 served 37.9 passengers per vehicle hour (15). The peak periods for Route 9 coincide with general vehicle traffic peaks that occur in the morning for the westbound direction and in the afternoon for the eastbound direction. There is no dedicated bus lane in this segment.
The SCATS implementation is shown in Figure 1b; SCATS was implemented in the segment between Point A (SE Milwaukie Avenue, close to 11th Avenue and Powell Boulevard) and Point D (Southeast 72nd Avenue and Powell Boulevard). The inter sections of particular interest are highlighted with either a triangle or a circle. The triangles represent transit time points, which are bus stops where holding and schedule recovery can take place if the bus operator is ahead of schedule. The two circled intersections are the locations of traffic counters. This location was the first SCATS implementation to integrate TSP in the United States (16).
pErformancE mEaSurES
The objective of the SCATS implementation in the Powell Bou-levard corridor was to improve traffic operations and reduce con-gestion. SCATS was expected to help achieve this objective by allocating green time more effectively by responding to current traffic conditions. Therefore, traffic volumes and speeds were used as the key performance measures to control for changes in travel patterns. Bus performance is greatly affected by traffic; traffic was measured to control for this factor in the analysis. Traffic volumes

Slavin, Feng, Figliozzi, and Koonce 119
were monitored by two Wavetronix units that were installed by the City of Portland. The units digitally generate a radar signal to collect vehicle counts, speeds, and classifications. The Wavetronix units were installed close to Powell and 26th Avenue and Powell and 39th Avenue but with enough setback from the intersection to assure free-flow traffic conditions (no queuing) even during the peak periods.
Transit performance measures were also used to compare before-and-after SCATS conditions. Data provided by TriMet included Route 9 automatic vehicle location and passenger counts. The per-formance measures included schedule delay, headway delay, idling time, and travel time. Passenger boarding activities were used to control for differences between the before and after periods.
On-time performance and headway adherence are the two most popular reliability measures used in the transit industry for low-
and high-frequency service, respectively; high-frequency service is defined by bus headways shorter than 10 min (17). These per-formance measures are paired with schedule and headway delay. On-time performance represents the percentage of on-time depar-tures at the stop level. The Transit Capacity and Quality of Service Manual defines on-time performance as being 0 to 5 min late (17). TriMet defines on-time performance as being no more than 1 min early to no later than 5 min past the scheduled departure time. The index for on-time performance percentage was calculated by using TriMet’s version:
−
−
1early depart records
all depart records
late depart records
all depart records(1)
FIGURE 1 Study area overview of (a) segment location, (b) Powell Boulevard corridor, and (c) LOS for intersection at Powell Boulevard and 39th Avenue.
AD
AM PeakPeriod
PM PeakPeriod
C
C
C
C
D
D
Powell Blvd
D
D
F
E
E
E
C
F
D
F
E
D
Powell Blvd
D
E
F
C
C
F
39th A
ve
39th A
ve
A B C D
Milwaukie 26th Ave 39th AveTraffic Counter Transit Time Point & Traffic Counter
72nd
Ave
(a)
(b)
(c)

120 Transportation Research Record 2356
Headway adherence represents the regularity of bus headways; the formula for calculating headway adherence is shown by Equation 2 (14):
c =
standard deviation of headway deviations
mean scheduled headway(2)vh
where cvh is the coefficient of variation of headways and headway deviation is the difference between the actual departure headway and the scheduled departure headway at a stop. The Transit Capac-ity and Quality of Service Manual suggests an LOS threshold for each reliability index as shown in Table 1 (17). The greater the on-time performance ratio is, or the lower the headway adherence index is, the more reliable the transit service is.
Idling time is defined as the difference between actual departure time and actual arrival time at a stop minus dwell time at that stop. Idling time represents the extra time that a bus waits at a stop. For example, if the bus stop is at a near-side stop (i.e., a stop placed right before the bus enters an intersection), then idling time can be partially attributed to time waiting at a red light and without includ-ing passenger service time. Idling time can be used as a proxy to measure the amount of traffic blocking the bus exit after serving passengers at a stop.
Ideally, all variables that can affect travel time both before and after SCATS should be controlled for. The authors examined before-and-after transit performance conditions during the same month, although a year apart, to account for seasonal variation. Because the traffic data were not available for the year before the SCATS system was installed, traffic and transit performance measures were calculated for different time periods. For traffic data, the before time period was a week before the SCATS system was installed, and the after time period was 2 months after SCATS. A 2-month period was used because there was a SCATS calibration period. Transit data for the whole month of November were used. In addition, traffic flow was evaluated close to the intersections at 26th and 39th Avenues (circles in Figure 1b), and a transit time point (triangle in Figure 1b) was used for transit performance evaluation of scheduled stops.
EvaluaTion rESulTS
Traffic Evaluation
The key objective for the implementation of an adaptive system on Powell Boulevard was to reduce congestion. The Portland Bureau of Transportation selected the SCATS system specifically to improve traffic operations on the corridor. Volume was selected as a perfor-mance measure to understand how throughput was affected along Powell Boulevard, and speed was examined to look at queuing and congestion, as indicated by low speeds.
The traffic comparison was performed for the morning (7 to 9 a.m.) and afternoon (4 to 6 p.m.) weekday peak periods. Only the peak period corresponding to commuter traffic (morning westbound and afternoon eastbound traffic) was used. To account for daily variation in traffic, Monday, Tuesday, Wednesday, Thursday, and Friday data were averaged. Data were collected on the following dates:
• Before SCATS: October 3 to 7, 2011 (Monday through Friday), and
• After SCATS: November 28 to December 2, 2011 (Monday through Friday).
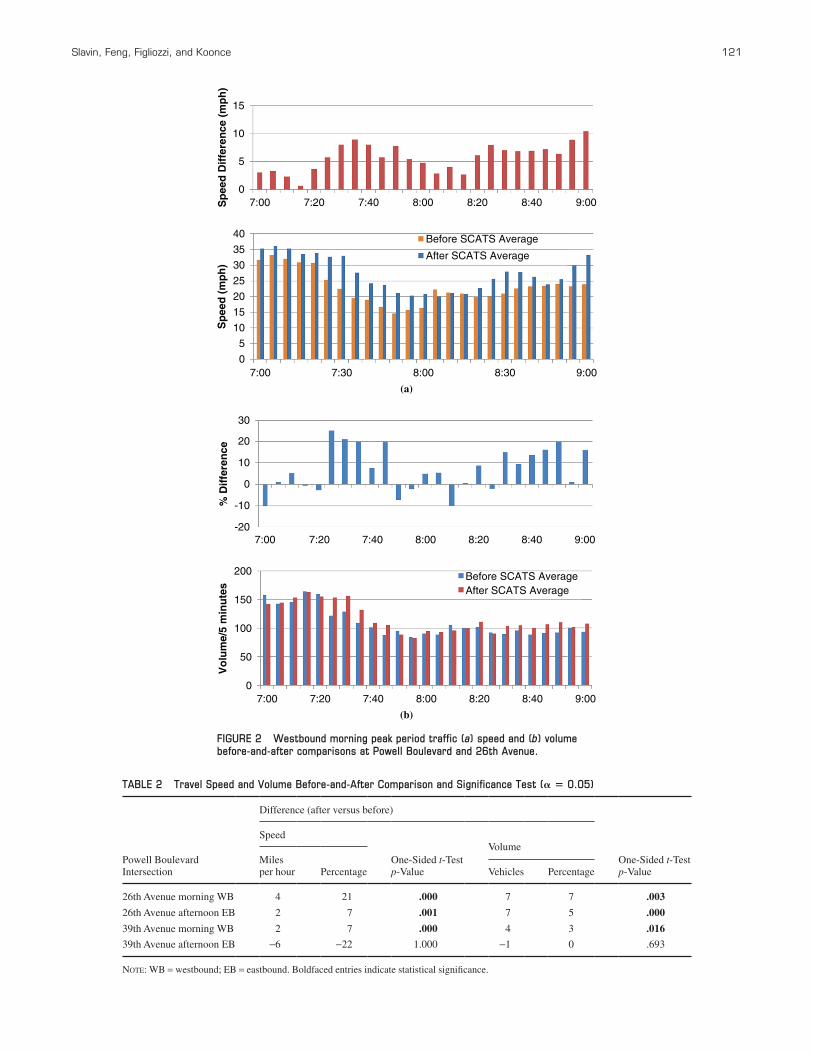
Figure 2 shows the westbound average speed and volume before and after the SCATS implementation at the intersection of Powell and 26th Avenue for morning peak hours. Figure 2a shows that after SCATS the speeds increased and were closer to the speed limit of 35 mph.
Volume changes for the morning peak period are shown for Powell and 26th in Figure 2b. During most of the morning peak period, a significantly higher volume of vehicles was present after SCATS was implemented. Figure 2 shows the average differences in travel speed (in miles per hour) and volume (number of vehicles per 5 min) and the level of significance. The results show that at Powell Avenue and 26th there were both significant speed improvements and higher traffic volumes after SCATS was installed (Table 2).
The intersection at Powell and 39th Avenue yielded more mixed results. For the morning peak period, there were significant speed and volume improvements. However, during the afternoon peak period, there were speed decreases, and the volume remained fairly constant. It is possible that the mixed results are because 26th Ave-nue is a more minor cross street with smaller volume, and 39th is a large arterial with a higher volume. The SCATS system did not change the average cycle length significantly, but it did increase the variability of the cycle length, especially when compared to time-of-day plans (which were in use before SCATS was imple-mented). The SCATS system adjusts splits on the basis of demand and allocates the time as needed. That is, in practice SCATS favored the main arterial (Powell) when there was less demand at the secondary street; the green time on Powell increased, and on 26th Avenue it decreased. This improvement or higher efficiency in the allocation of green time was not possible at 39th because of its higher traffic volume. A study for Kittelson and Associates of Portland by Hathaway et al. looked at the queuing at each inter-section along this route and found mixed positive results at different intersections, movement directions, and times of day (18). A positive outcome was that cycle failures have been almost eliminated.
Transit Evaluation
Detailed bus stop event data, one month each from November 2010 and November 2011, were used to evaluate transit performance before and after SCATS was implemented. Passenger activity was examined to control for possible changes in transit activity. There were no other major changes to the route before and after the SCATS implementa-tion. Statistical tests indicated that there were no significant differences in passenger boarding per hour or passenger load per bus at any time point or segment. TriMet’s policy specifies that at certain time points bus operators cannot depart earlier than 1 min from the scheduled departure time. If a bus operator arrives more than 1 min early, they will most likely hold the bus, which increases idling time. This policy was consistent both before and after the SCATS implementation.
TABLE 1 LOS for On-Time Performance and Headway Adherence
LOS On-Time Performance Headway Adherence
A 0.95–1.00 0.00–0.21
B 0.90–0.949 0.22–0.30
C 0.85–0.899 0.31–0.39
D 0.80–0.849 0.40–0.52
E 0.75–0.799 0.53–0.74
F <0.75 ≥0.75
Slavin, Feng, Figliozzi, and Koonce 121
7:000
5
10
Sp
eed
Dif
fere
nce
(m
ph
)
15
7:20 7:40 8:00 8:20 8:40 9:00
-20
-10
0
10
20
30
% D
iffe
ren
ce
7:00 7:20 7:40 8:00 8:20 8:40 9:00
0
50
100
Vo
lum
e/5
min
ute
s
150
200
7:00 7:20 7:40 8:00 8:20 8:40 9:00
Before SCATS AverageAfter SCATS Average
(b)
(a)
7:00 7:300
5
10Sp
eed
(m
ph
)
15
20
25
30
35
40 Before SCATS Average
After SCATS Average
8:00 8:30 9:00
FIGURE 2 Westbound morning peak period traffic (a) speed and (b) volume before-and-after comparisons at Powell Boulevard and 26th Avenue.
TABLE 2 Travel Speed and Volume Before-and-After Comparison and Significance Test (a 5 0.05)
Difference (after versus before)
Powell Boulevard Intersection
Speed
One-Sided t-Test p-Value
VolumeOne-Sided t-Test p-Value
Miles per hour Percentage Vehicles Percentage
26th Avenue morning WB 4 21 .000 7 7 .003
26th Avenue afternoon EB 2 7 .001 7 5 .000
39th Avenue morning WB 2 7 .000 4 3 .016
39th Avenue afternoon EB −6 −22 1.000 −1 0 .693
Note: WB = westbound; EB = eastbound. Boldfaced entries indicate statistical significance.

122 Transportation Research Record 2356
Statistical results are shown in Table 3, including the mean, standard deviation, number of observations, and significance of the statistical results for both schedule delay and headway delay. In addition, the on-time performance and LOS are shown for the off-peak periods, and headway adherence and LOS are shown for the peak periods.
Schedule delay was not significantly improved in the east-bound or westbound direction during the off-peak period. The time-point schedule delay was better in the westbound off-peak hours compared with the eastbound direction delay. There were no major changes in on-time performance in either direction of travel. LOS was low both before and after SCATS was imple-mented: an F in the eastbound direction and a slightly better D in the westbound direction.
The mean headway delay was close to 0 s, but the standard devia-tions ranged from 4 to 5 min. There were no significant improvements in the deviation of headway delay after SCATS was implemented, and headway adherence remained the same or became slightly worse. LOS remained in the same category.
In general, the implementation of SCATS did not significantly improve or worsen transit performance at Powell and 39th. The only exception was the reduction in schedule delay in the westbound direction after SCATS.
Idling Time
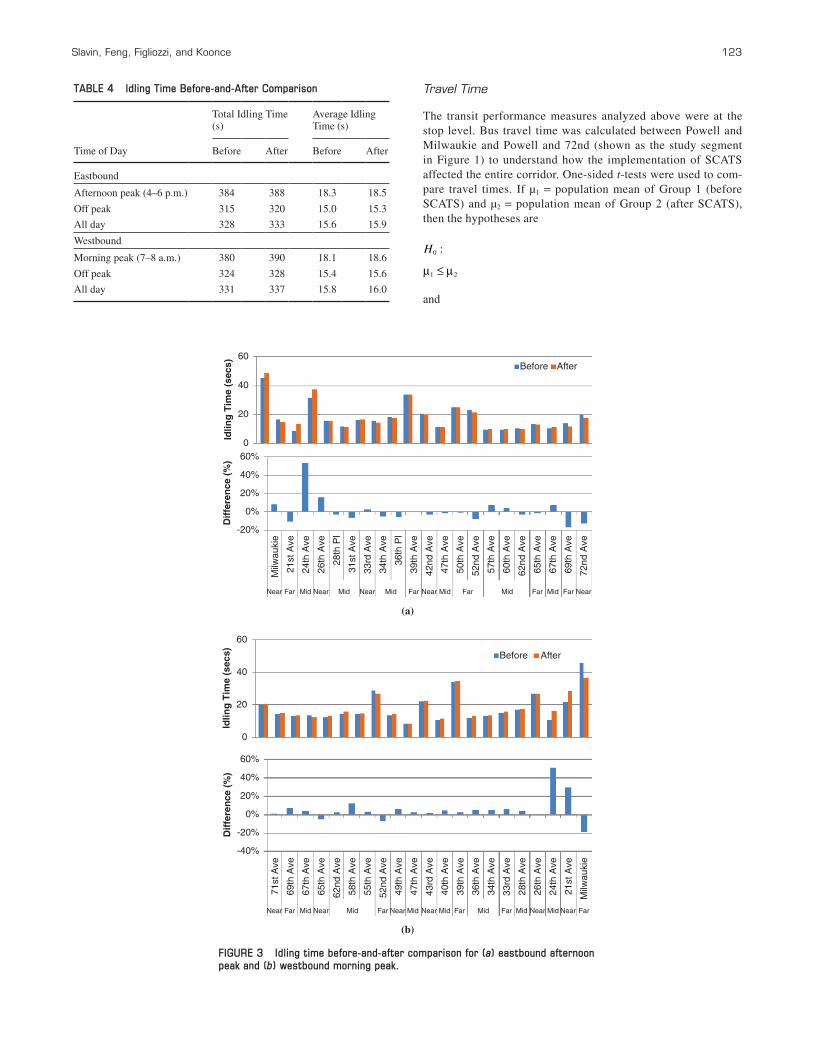
Idling time, which is the extra time spent at a bus stop after serving passengers, was calculated at every stop in the segment where SCATS was implemented. The idling time was summed and averaged over all the stops in each direction.
The results indicated no major changes in idling time over the cor-ridor, from Powell and Milwaukie Avenue to Powell and 72nd Avenue (Table 4). Mean idling times during the peak periods are shown in Figure 3. Eastbound, at the majority of the stops, the idling time was similar before and after SCATS. However, the larg-est percentage increases in idling time were observed at 24th and 26th Avenues. In the westbound direction, the stops with the larg-est percentage increases in idling time were observed at 24th and 21st Avenues. However, at the more important or congested inter-sections, Milwaukie and 39th, the amount of idling time did not change consistently or significantly.
Time Point Reliability
Time-point reliability evaluation data were collected at Powell and 39th Avenue and compared by using different performance measures for peak and off-peak periods in both directions.
The high-frequency periods occurred between 4 and 6 p.m. in the eastbound direction and between 7 and 8 a.m. in the westbound direction. All other times were low-frequency service or off peak. For off-peak periods schedule delay and on-time performance are the sug-gested performance measures, but for peak periods headway delay and headway adherence are the performance measures suggested by the Transit Capacity and Quality of Service Manual.
Mean schedule delay was compared by using a one-sided t-test; if µ1 = population mean of Group 1 (before SCATS) and µ2 = pop-ulation mean of Group 2 (after SCATS), the null and alternative hypotheses can be stated as follows:
H
µ ≤ µ
:0
1 2
and
H
µ > µ
:1
1 2
Mean headway delay (i.e., actual headway minus scheduled headway) was compared by using a one-sided F-test; if σ2
1 = popu-lation variance of Group 1 (before SCATS) and σ2
2 = population variance of Group 2 (after SCATS), and given that for headway adherence the deviation is relevant, then the hypotheses are
H
σσ
≤
:
1
0
12
22
and
H
σσ
>
:
1
1
12
22
TABLE 3 Time Point Off-Peak Reliability Performance at Powell Boulevard and 39th Avenue
Schedule DelayHeadway Delay
EB Off Peak WB Off PeakEB Afternoon Peak (4–6 p.m.)
WB Morning Peak (7–8 a.m.)
Parameter Before After Before After Before After Before After
Mean (s) 168 172 138 109 0 −10 7 2
SD (s) 238 227 222 210 270 295 205 234
Observations 1,557 1,578 1,643 1,679 354 377 255 270
p-value .685 .000a .954 .983
On-time performance 0.74 0.74 0.83 0.84
Headway adherence NA NA NA NA 0.42 0.47 0.31 0.38
LOS F F D D C C C C
Note: NA = not available. aBoldfaced entry indicates statistical significance.
Slavin, Feng, Figliozzi, and Koonce 123
Travel Time
The transit performance measures analyzed above were at the stop level. Bus travel time was calculated between Powell and Milwaukie and Powell and 72nd (shown as the study segment in Figure 1) to understand how the implementation of SCATS affected the entire corridor. One-sided t-tests were used to com-pare travel times. If µ1 = population mean of Group 1 (before SCATS) and µ2 = population mean of Group 2 (after SCATS), then the hypotheses are
H
µ ≤ µ
:0
1 2
and
TABLE 4 Idling Time Before-and-After Comparison
Total Idling Time (s)
Average Idling Time (s)
Time of Day Before After Before After
Eastbound
Afternoon peak (4–6 p.m.) 384 388 18.3 18.5
Off peak 315 320 15.0 15.3
All day 328 333 15.6 15.9
Westbound
Morning peak (7–8 a.m.) 380 390 18.1 18.6
Off peak 324 328 15.4 15.6
All day 331 337 15.8 16.0
FIGURE 3 Idling time before-and-after comparison for (a) eastbound afternoon peak and (b) westbound morning peak.
0
20
40
Idlin
g T
ime
(sec
s)
-20%
0%
Near
Milw
auki
e
21st
Ave
24th
Ave
26th
Ave
31st
Ave
39th
Ave
47th
Ave
50th
Ave
57th
Ave
60th
Ave
65th
Ave
67th
Ave
69th
Ave
62nd
Ave
72nd
Ave
42nd
Ave
52nd
Ave
33rd
Ave
34th
Ave
28th
Pl
36th
Pl
Near Near Near NearFar Far Far Far FarMid Mid Mid Mid Mid Mid
20%
40%
60%
Dif
fere
nce
(%
)
60Before After
0
20
40
60
Idlin
g T
ime
(sec
s)
71st
Ave
21st
Ave
24th
Ave
26th
Ave
40th
Ave
39th
Ave
47th
Ave
49th
Ave
55th
Ave
58th
Ave
65th
Ave
67th
Ave
69th
Ave
62nd
Ave
Milw
auki
e
43rd
Ave
52nd
Ave
33rd
Ave
34th
Ave
28th
Ave
36th
Ave
Near Near Near Near Near NearFar Far Far Far FarMid Mid Mid Mid Mid Mid Mid
-20%
-40%
0%
20%
40%
60%
Dif
fere
nce
(%
)
Before After
(a)
(b)

124 Transportation Research Record 2356
H
µ > µ
:1
1 2
In addition, to determine if the deviations of travel time changed before and after SCATS, one-sided f-tests were conducted. If σ2
1 = population variance of Group 1 (before SCATS) and σ2
2 = popula-tion variance of Group 2 (after SCATS), then the null and alternative hypotheses are
H
σσ
≤
:
1
0
12
22
and
H
σσ
>
:
1
1
12
22
Results indicated that in the eastbound direction the mean travel times were significantly improved throughout the day after SCATS was implemented. In the westbound direction, the mean travel times were not improved (Table 5). The deviation of travel time after the implementation of SCATS was not significantly improved in either direction. The bus scheduled travel time was constant over the two time periods.
Travel Time Regression Models
To control for all the potential differences in bus operation before and after SCATS, several regression models were estimated. The vari-ables’ names, descriptions, and ranges of values are listed in Table 6. The base model is shown in Table 7. The first model, including all eight parameters, indicated that all variables except SCATS were significant. To examine the impact of SCATS on the other variables, interaction variables were included in the model.
Interactions between SCATS and priority, SCATS and offs, and SCATS and lifts were not significant. The interactions were sig-nificant between SCATS and ons, SCATS and stops, SCATS and peak, and SCATS and direction. After further analysis, it was found that the interaction with SCATS and stops was more significant
than that with SCATS and ons, and using both in the same regression model forced SCATS and ons to become insignificant.
The final regression analysis is shown in Table 7 next to the base model. In order to determine whether the final model was better than the base model, an incremental F-test was conducted to test the hypo-thesis that the coefficients of the additional variables were equal to zero. In this case, the unconstrained model had 12 predictors, and the constrained model had seven, so there were five additional vari-ables. The incremental F-value was 37.105, with a corresponding p-value of .000, indicating that the final model was a significant improvement on the base model.
A comparison of both models shows the results are very stable, which highlights the robustness and quality of the model. The fac-tors related to passengers yielded similar results, indicating that each passenger boarding took on average about 4 s, each passenger alighting took on average less than half a second, and each lift usage took on average 31 additional seconds. Each stop that the bus had to make during a trip took on average 19 additional seconds.
Trips that had TSP were reduced by approximately 24 s on aver-age; the value of this parameter was stable, which shows that the impact of transit priority was not affected by SCATS. This is an important result because a priori it was not possible to predict whether the interaction between SCATS and TSP would be beneficial.
From the base model, it is possible to see that trips made dur-ing the peak period had higher travel times (about 140 s more on
TABLE 5 Travel Time Performance
Eastbound Westbound
Afternoon Peak (4–6 p.m.) Off Peak All Day
Morning Peak (7–8 a.m.) Off Peak All Day
Distribution Parameter Before After Before After Before After Before After Before After Before After
Mean (s) 897 879 755 739 782 765 953 1,070 808 801 827 839
SD (s) 131 134 144 156 153 162 202 351 146 172 163 226
No. of observations 382 376 1,578 1,592 1,960 1,968 256 272 1,641 1,677 1,897 1,949
p-Value (t-Test) .031a .001a .000a 1.000 .103 .971
p-Value (f-Test) .670 .999 .994 1.000 1.000 1.000
Note: No. = number. aBoldfaced entries indicate statistical significance.
TABLE 6 Explanatory Variables in Regression Model
Name Description Range Mean
Ons Number of passenger boardings for trip 0–110 16.45
Offs Number of passenger alightings for trip 0–70 15.35
Lift Number of times the lift was used during trip
0–4 0.10
Stops Number of stops during trip 0–21 11.74
Priority 1 if transit signal priority was requested, 0 otherwise
0, 1 0.61
Peak 1 if trip was during peak period, 0 otherwise
0, 1 0.16
WB 1 if trip was in westbound direction, 0 otherwise
0, 1 0.50
SCATS 1 if SCATS was implemented, 0 otherwise
0, 1 0.50

Slavin, Feng, Figliozzi, and Koonce 125
average) than trips during the off-peak period. Trips made in the westbound direction had higher travel times (about 30 s more on average) than trips in the eastbound direction.
The results of the regression analysis allow a before-and-after SCATS comparison for each peak period and direction. The vari-able for SCATS during off peak in the westbound direction was not significant in the model, which means that the coefficient was zero or equal to the baseline (before SCATS, off peak, eastbound). Looking at the other variables, it can be seen that on average, after SCATS
• Eastbound off-peak period travel time decreased 33 s,• Westbound off-peak period travel time decreased 24 s,• Eastbound peak period travel time decreased 42 s, and• Westbound peak period travel time increased 110 s.
In short, SCATS helped to significantly reduce travel times in both directions and times except for the westbound peak period. These regression results are consistent with the results observed in Table 5, which shows that the mean westbound peak period increased by 117 s. Clearly, these travel times were not caused by changes in pas-senger demand or boarding–alighting patterns. Bus travel times may have increased in the westbound peak hours but decreased at all other times after SCATS because of the relatively high concentrated pas-senger demand in the westbound a.m. peak hours; in addition, the Ross Island Bridge (downstream of the westbound direction in the study segment) is capacity constrained and limits westbound operations.
concluSion
In order to evaluate traffic and transit performance before and after SCATS implementation, this research compared changes in traffic vol-umes and speeds and studied changes in transit performance measures such as schedule delay, headway delay, idling time, and travel time.
Overall, the traffic conditions before and after SCATS were sig-nificantly different in terms of speed and volume. SCATS showed statistically significant improvements regarding traffic speeds at one minor intersection even when traffic volumes showed a statistically significant increase. At a major intersection results were mixed and not conclusive.
This study also examined the joint impacts of SCATS and TSP on transit performance. Statistical tests and regression analysis deter-mined that SCATS did not negatively affect transit performance on Powell Boulevard. In particular, TSP was not affected by SCATS, which means there seems to be no additional benefit of TSP to transit vehicles by having SCATS implemented. Overall, it was determined that the improvements available through SCATS varied at different times of day and in different travel directions. Travel times were reduced in both directions during the off-peak period, which covers most of the day. However, the peak periods are when bus demand is the highest. During the peak periods, improvements in travel time for the entire study corridor segment were observed in the eastbound direction, but there were no improvements in the westbound direc-tion. However, bus on-time performance and idling time were not directly correlated with traffic travel speed; therefore, it is possible that there was no significant improvement in on-time performance or idling time while there was an improvement for travel times.
From the traffic evaluation it seems that after SCATS transit buses may be dealing with the same congested conditions at major intersections but with improved conditions at minor intersections. The transit evaluation accounted for passenger ridership, which did not change significantly between the two time periods.
acknowlEdgmEnTS
The authors gratefully acknowledge the Oregon Transportation Research and Education Consortium for sponsoring this research. The authors thank Willie Rotich of the Portland Bureau of Transportation
TABLE 7 Travel Time Regression Analysis Results
Base Model Final Model
Parameter B SEB p-Value B SEB p-Value
Constant 476.286 5.415 .000 494.587 5.348 .000
Ons 3.973 0.156 .000 3.961 0.156 .000
Offs 0.416 0.193 .031 0.45 0.191 .019
Lift 31.04 3.92 .000 30.997 3.875 .000
Stops 19.528 0.556 .000 18.663 0.594 .000
Priority −24.745 2.929 .000 −23.994 2.897 .000
Peak 139.605 3.963 .000 NA NA NA
WB direction 32.971 3.348 .000 NA NA NA
After SCATS stops NA NA NA 1.685 0.357 .000
After SCATS peak WB NA NA NA 221.087 8.076 .000
After SCATS peak EB NA NA NA 87.736 7.648 .000
After SCATS off-peak EB NA NA NA −33.226 4.357 .000
Before SCATS peak WB NA NA NA 112.052 8.754 .000
Before SCATS peak EB NA NA NA 130.395 7.442 .000
Before SCATS off-peak WB NA NA NA 24.259 4.511 .000
Note: Base model: R2 = .534, F = 1,258.326, N = 7,687; final model: R2 = .545, F = 767.483, N = 7,687. After SCATS off-peak WB was insignificant and was excluded. Baseline was before SCATS off-peak EB.

126 Transportation Research Record 2356
for his support and encouragement. David Crout and Steve Callas of TriMet provided valuable assistance and bus transit data. The authors thank Eric Albright of Portland State University for his help with the transit data analysis. The authors also thank William Farley for providing intersection LOS data.
rEfErEncES
1. Dickens, M., and J. Neff. APTA 2011 Public Transportation Fact Book. 2011.
2. Smith, H. R., P. B. Hemily, and M. Ivanovic. Transit Signal Priority (TSP): A Planning and Implementation Handbook. ITS America, 2005.
3. TransCore. SCATS Adaptive Traffic Control System. http://www.trans core.com/I-A/traffic%20management%20systems/atms-download.shtml. Accessed March 1, 2012.
4. Soyke, N., D. M. Bullock, and D. Gettman. A Systematic Approach to Evaluate Adaptive Traffic Control Methods. London, 2006.
5. Negus, B. J., and S. E. Moore. The Benefits of SCRAM: The Maroon-dah Highway Survey. Australian Road Research, Vol. 12, No. 4, 1984, pp. 1–16.
6. Mirchandani, P. B., and D. E. Lucas. Integrated Transit Priority and Rail/Emergency Preemption in Real-Time Traffic Adaptive Signal Control. Journal of Intelligent Transportation Systems: Technology, Planning, and Operations, Vol. 8, No. 2, 2004, pp. 101–115.
7. Zhang, Y. An Evaluation of Transit Signal Priority and SCOOT Adaptive Signal Control. http://scholar.lib.vt.edu/theses/available/etd-05212001-231555/. Accessed Nov. 14, 2012.
8. Cornwell, P. R., J. Y. K. Luk, and B. J. Negus. Tram Priority in SCATS. Traffic Engineering and Control, Vol. 27, No. 11, 1986, pp. 561–565.
9. Peters, J., P. O’Brien, and J. Pachman. Memorandum: Farmington Road Adaptive Traffic Control Benefits Analysis. DKS Associates, Portland, Ore., 2011.
10. Kergaye, C., A. Stevanovic, and P. Martin. Comparative Evaluation of Adaptive Traffic Control System Assessments Through Field and Micro-simulation. Journal of Intelligent Transportation Systems, Vol. 14, No. 2, 2010, pp. 109–124.
11. Stevanovic, A., J. Stevanovic, and C. Kergaye. Environmental Benefits of Adaptive Traffic Control System: Assessment of Fuel Consump-tion and Vehicular Emissions. Presented at 91st Annual Meeting of the Transportation Research Board, Washington, D.C., 2012.
12. Oregon Department of Transportation. 2009 Traffic Volumes on State Highways. 2009. http://www.oregon.gov/ODOT/TD/TDATA/tsm/docs/ 2009_TVT.pdf. Accessed April 20, 2012.
13. Signalized Intersections. In Highway Capacity Manual, TRB, National Research Council, Washington, D.C., 2000.
14. Kittelson and Associates, Inc., Quality Counts, and Portland State Uni-versity. Powell Boulevard, Oregon, Video Results. 2010.
15. TriMet. Transit Investment Plan FY 2012. http://www.trimet.org/tip/index.htm. Accessed March 15, 2012.
16. City of Portland. Transportation Operations Innovation and Demonstra-tion Program 2008–2011 STIP Application: US-26 Adaptive Signal System. 2008.
17. Kittelson and Associates, Inc., KFH Group, Inc., Parsons Brincker-hoff Quade and Douglas, Inc., and K. Hunter-Zaworski. TCRP Report 100: Transit Capacity and Quality of Service Manual, 2nd ed. Trans-portation Research Board of the National Academies, Washington, D.C., 2003.
18. Hathaway, E., S. Tsoi, and T. Urbanik. ODOT Transportation Operation Innovation and Demonstration Evaluation: Powell Boulevard SCATS System Evaluation. 2012.
Any errors or omissions are the responsibility of the authors.
The Operations Section peer-reviewed this paper.