statistical report of the european biogas ... - decisive2020
TRANSCRIPT

Abridged version
Annual Statistical Report of the European Biogas Association
STATISTICAL REPORT 2017

Founded in 2009, the European Biogas Association
(EBA) promotes the sustainable production and use
of biogas, biomethane and syngas from anaerobic
digestion (AD) and biomass gasification in Europe.
This covers all end-use applications, including heat,
electricity and automotive fuel. The members of the
EBA comprise national biogas associations, institutes
and companies from over 26 countries across Europe.
The association includes the majority of producers,
companies, consultants and researchers in the
European biogas sector.
Renewable Energy House
Rue d’Arlon 63-65,
B – 1040 Brussels
Belgium
Tel +32 24 00 10 89
Fax +32 2546 1934
http://www.european-biogas.eu
All rights reserved. This report was compiled thanks to the efforts of EBA members and collaborators, who provided all the
required statistical data and information. It is primarily intended for EBA members, free of charge, and for sale to other
interested parties. All data provided in this report is for information purposes and shall be treated as indicative only.
Users shall agree that use of the data contained in this report is their own responsibility. No part of this publication may be
reproduced, distributed, or transmitted in any form or by any means, including photocopying, recording, or other electronic or
mechanical methods, without the prior written permission of the publisher. For permission requests, please write to
[email protected], except in the case of brief quotations embodied in critical reviews and other non-commercial use
permitted by copyright law.
Disclaimer
An excerpt from the Statistical Report, © European Biogas Association 2017

i
EBA Statistical Report 2017 - Abridged
The Statistical Report of the European Biogas Association is an extensive examination of the state of the biogas industry in
Europe. The report covers the 28 EU countries, as well as Iceland, Norway, Serbia and Switzerland. Data presented include
biogas, biomethane and gasification statistics (when available), along with relevant legislative information and National
Renewable Energy Action Plan (NREAP) targets. The data originate mainly from national biogas associations, national statistical
reports, industries present in the countries in question, or - in the absence of submitted data - from data previously compiled
by the EBA and published in the EBA’s regular country profiles.
Methodology
An extensive discussion of the EU market is presented in this report, along with country-by-country analysis of 23 EU countries,
including AT, BE, CH, CZ, DE, DK, EE, EL, ES, FI, FR, HR, HU, IE, IT, LV, NO, PL, PT, RO, SE, SK and the UK. If you are accessing the
digital version, you can easily navigate through the report by clicking on the boxes at the right of every even-numbered page
to go directly to a specific country. Every country profile was sent for review purposes to the relevant national stakeholders,
to ensure published information provides an accurate picture of the situation in each country. Main contributors are
highlighted in the respective country analysis.
By default, data presented include four types of substrates: agricultural, landfill, sewage sludge and ‘other’, and follow a strict
colour code. The different substrates include the following:
all substrates related to agricultural production, e.g. energy crops (primary crop with high starch content),
agricultural residues (manure, straw, other) and cover/catch crops;
organic waste producing biogas collected on landfill sites, sometimes referred to as ‘landfill gas’
in literature;
sewage sludge produced at a wastewater treatment plant;
various types of organic waste such as bio- and municipal waste, household waste and industrial waste
(for example from the food and beverage industry).
A more comprehensive abbreviation list is available at the end of this excerpt. Concerning units:
• Watt-hours (Wh) are used for biogas and biomethane production, to allow easy comparison between statistics;
• Joules (J) are used for heat production;
• Watts (W) are used for the Installed Electric Capacity (IEC) of biogas plants, generally as MW (megawatt, 106 W).
Watts (W) are used in preference to Watts electric (Wel), to ensure clarity for a general readership. Watts are not
used to describe any concept other than IEC, to avoid confusion.
Agricultural
Landfill
Sewage
Other
How to use this report
Deremince, B. and Königsberger, S. “Statistical Report of the European Biogas Association 2017.” Brussels, Belgium,
December 2017.
How to quote this report

ii
EBA Statistical Report 2017 - Abridged
The structure of the 2017 EBA statistical report has been extensively remodelled: this year’s publication
provides more than 120 pages of in-depth information and data about European biogas, biomethane
and syngas produced by anaerobic digestion and biomass gasification. It also offers a unique and
comprehensive overview of renewable gas production in Europe (data available for 32 European
countries), with 23 individual country analyses including the evolution of national support schemes and
tracking of National Renewable Energy Action Plan (NREAP) targets. The full Country Profile France from
the EBA Statistical Report 2017 is included in the following pages as an example.
Please contact [email protected] for pricing and delivery details if you would like to order a copy
of the full report.
Interested in getting the full EBA Statistical Report?

iii
EBA Statistical Report 2017 - Abridged
European Overview ……………………………………………………………………………………..1
Biogas Plants………………………………………………………………………………………….1
Installed Electric Capacity (IEC) in the Biogas Sector ……………………………..3
Electricity Generation from Biogas………………………………………………………..5
Feedstock Use for Biogas Production…………………………………………………….7
Biomethane Production………………………………………………………………………..9
Biomethane Plants……………………………………………………………………………...11
Biogas Upgrading Units……………………………………………………………………….13
Feedstock Use for Biomethane Production………………………………………….15
National Renewable Energy Action Plans (NREAPs)……………………………..16
Support Schemes for Biogas and Biomethane in the EU……………………...17
Individual Country Analyses……………………………………………………………………….19
Abbreviations and Colour Key…………………………………………………………………..117
Table of Contents of the Full Report

iv
EBA Statistical Report 2017 - Abridged
The President’s Foreword
Dear reader,
I am proud to present to you the 2017 Statistical Report by the European Biogas Association. It has become a
tradition to release this publication as we near the year’s end, and this seventh edition, like those of previous years,
has only been possible through the constant and dedicated support of our members. The hands-on knowledge of
EBA members lies behind all the most significant insights in this comprehensive publication. I want to thank
everyone who contributed to make this report possible.
This EBA Statistical Report includes the most up-to-date information available on the biogas and biomethane
markets for the year 2016. There were 17,662 biogas plants and 503 biomethane plants in operation in Europe in
December 2016. Despite the headwind our industry faces, this again represents growth, especially in the
biomethane sector, which was very active in 2016 and 2017. The last two years have seen the creation of a new
association to facilitate biomethane trade at an EU level (the European Renewable Gas Registry – ERGaR),
significant advances in innovative technologies (including power-to-methane and biomass gasification)
and initiatives to highlight and support the crucial role of renewable gas in ensuring a cost-effective energy
transition in Europe (such as the Gas for Climate initiative, led by Ecofys). If the European energy transition from
fossil to renewable is to succeed, the biogas industry will need to play an integral part in future development.
A complete European picture thus gives good cause for optimism. The European Biogas Association will continue to
increase collaboration in the sector, as illustrated by the recent development of the Biorefine Cluster in
collaboration with the University of Gent (aimed at bringing together projects in energy and nutrient cycling).
The EBA will also continue to provide momentum to the biogas and biomethane industry and to protect the
interests of the industry at EU level, as was done during preparation of the second version of the Renewable Energy
Directive in 2017 (still in the legislation stage at time of writing). At our conference in January 2018, the theme of
which is ‘Greening Gas’, we will address the important topics of the future, such as power-to-gas, biomethane in
transport, cross-border trade in biomethane, and biomass gasification. Everyone is welcome to join in and be part
of an EU-wide promising future fuelled by renewable methane.
I wish you an inspiring read.
Jan Stambasky
EBA President

1
EBA Statistical Report 2017 - Abridged
AT
EU
BE
CH
CZ
DE
DK
EE
EL
ES
FI
FR
HR
HU
IE
IT
LV
NO
PL
PT
RO
SE
SK
UK
Europe
Total IEC in 2016 Increase relative to 2015 Country with greatest increase in 2016
9,985 MW +858 MW (9%) Germany (+617 MW)
Installed Electric Capacity (IEC) in the Biogas Sector
Although the number of biogas plants in Europe has been
stabilising since 2015, the total Installed Electric Capacity
(IEC) is on the rise. The IEC increased in Europe from
4,158 MW in 2010 (earliest EBA data), to 9,985 MW in 2016
(+5,827 MW). In 2016 alone, the IEC increased by 858 MW
(+9%). Growth in Installed Electric Capacity (IEC) since 2011
has been mainly due to the building of plants running on
agricultural substrates: such plants went from 3,408 MW
in 2011 to 6,348 MW in 2016 (+2,940 MW - 56.5% of the
total increase).
Growth in Installed Electric Capacity in Europe 2010-2016 (MW) (total IEC in 2016: 9,985 MW)
Although Germany is the country displaying the highest
increase in IEC in 2016 (+617 MW), growth in the number of
plants in the country in 2016 was relatively low.
This incongruity is in fact an accident of statistics:
the apparent sudden growth in German IEC in 2016 is due to
the IEC of landfill and wastewater treatment plant-based
installations not being accounted for in previous years
(see the chapter on Germany in the full version of the EBA
Statistical Report 2017 for more information).
In Germany, both the IEC and the ‘average electric
capacity’ (the IEC used full-time by plants) are quantified,
to evaluate the proportion of biogas plants operating flexibly
through the year. While the IEC has been growing in the last
few years, the average electric capacity (roughly 3,755 MW
in 2016) does so very slowly, in line with the gradual increase
in the number of biogas plants in the country.
The countries that saw the greatest IEC development in 2016
were Germany (+617 MW, statistical anomaly due to change
in data gathering methodology, see above),
Spain (+101 MW, but this result is uncertain because
differing classification in force in the country makes it
difficult to track evolution in the sector accurately),
the United Kingdom (+52 MW), France (+28 MW) and Poland
(+25 MW). No EU countries experienced a decrease in IEC in
2016. For more information about Installed Electric Capacity
in the European biogas sector, see the full version of the EBA
Statistical Report 2017.
EU

2
EBA Statistical Report 2017 - Abridged
The number of biogas plants in Europe has greatly increased.
Between 2009 (earliest EBA data) and 2016, the total
number of biogas plants rose from 6,227 to
17,662 installations (+11,435 units). Growth was particularly
strong from 2010 to 2012, reaching double figures every
year. Since 2015, progress in the sector has slowed, with an
increase of only 1% in 2016 (+223 units). Most of that
growth derives from the increase in plants running on
agricultural substrates: these went from 4,797 units in 2009
to 12,496 installations in 2016 (+7,699 units, 67% of the total
increase). Agricultural plants are then followed by biogas
plants running on sewage sludge (2,838 plants),
landfill waste (1,604 units) and various other types of waste
(688 plants).
Total number of plants in 2016 Increase relative to 2015 Country with greatest increase in 2016
17,662 installations +223 units (1%) France (+93 units)
Biogas Plants
Evolution of the number of biogas plants in Europe (total number of plants in 2016: 17,662)
In 2016, the most dynamic countries in Europe for biogas
plant construction were France (+93 units) and the United
Kingdom (+41 units). France has seen very significant
development in both the biogas and the biomethane sectors
in recent years: the country is extensively analysed in the
‘French Country Profile’, an EBA publication released in
August 2017 (accessible in the members section of the EBA
website). The reduced rate of growth in the total number of
biogas plants in Europe in recent years is mainly due to
changes in national legal frameworks. In Germany for
example, the leading country in Europe for biogas and
biomethane production, only a relatively low increase was
registered in 2016. This is likely to be related to a shift in the
German support scheme (Erneuerbare-Energien-Gesetz,
better known as the ‘EEG’), which started in 2012 and was
completed in 2017. Under the scheme as it now stands,
biogas plants with an Installed Electric Capacity (IEC) above
100 kW are not eligible for the Feed-in Tariff (FiT) and must
go through a (technology-specific) tendering process to
obtain a sliding Feed-in Premium (FiP). Within the FiT,
the highest tariff is reserved for plants with an IEC below
75 kW and whose feedstock comprises over 80% manure
(in mass, excluding poultry manure). The legal shift, along
with the over-achievement of German biogas relative to
National Renewable Energy Action Plan (NREAP) targets
(4,635 installed MW, surpassing the 3,267 MW target in
2016), slowed down growth in the sector, with the rate
stabilising in 2015. More in-depth information is available in
the section on Germany in the full EBA Statistical Report
2017.
3
EBA Statistical Report 2017 - Abridged
AT
EU
BE
CH
CZ
DE
DK
EE
EL
ES
FI
FR
HR
HU
IE
IT
LV
NO
PL
PT
RO
SE
SK
UK
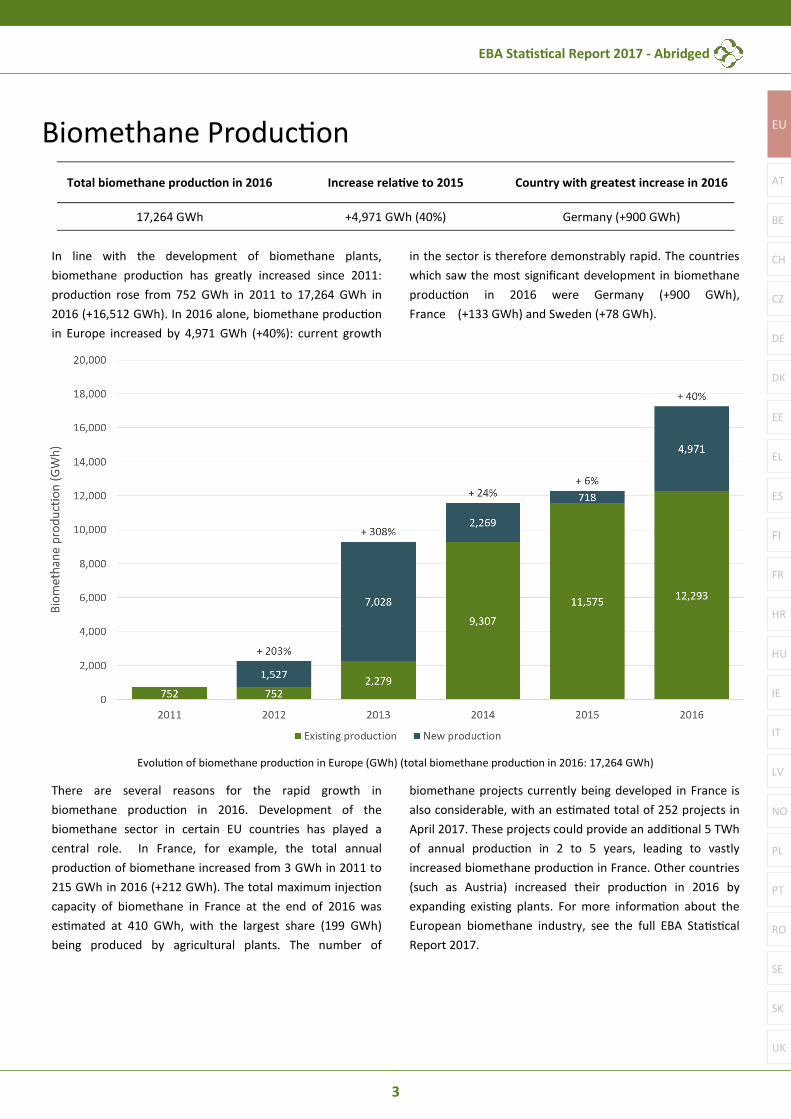
Total biomethane production in 2016 Increase relative to 2015 Country with greatest increase in 2016
17,264 GWh +4,971 GWh (40%) Germany (+900 GWh)
Biomethane Production
In line with the development of biomethane plants,
biomethane production has greatly increased since 2011:
production rose from 752 GWh in 2011 to 17,264 GWh in
2016 (+16,512 GWh). In 2016 alone, biomethane production
in Europe increased by 4,971 GWh (+40%): current growth
in the sector is therefore demonstrably rapid. The countries
which saw the most significant development in biomethane
production in 2016 were Germany (+900 GWh),
France (+133 GWh) and Sweden (+78 GWh).
Evolution of biomethane production in Europe (GWh) (total biomethane production in 2016: 17,264 GWh)
There are several reasons for the rapid growth in
biomethane production in 2016. Development of the
biomethane sector in certain EU countries has played a
central role. In France, for example, the total annual
production of biomethane increased from 3 GWh in 2011 to
215 GWh in 2016 (+212 GWh). The total maximum injection
capacity of biomethane in France at the end of 2016 was
estimated at 410 GWh, with the largest share (199 GWh)
being produced by agricultural plants. The number of
biomethane projects currently being developed in France is
also considerable, with an estimated total of 252 projects in
April 2017. These projects could provide an additional 5 TWh
of annual production in 2 to 5 years, leading to vastly
increased biomethane production in France. Other countries
(such as Austria) increased their production in 2016 by
expanding existing plants. For more information about the
European biomethane industry, see the full EBA Statistical
Report 2017.
EU

4
EBA Statistical Report 2017 - Abridged
France
Number of
plants
Total
annual
Installed
Electric
Type of support
scheme
2014 NREAP
target status National EBA contributors for 2016
[n] [GWh] [MW] [Type]
(starting year) [Status]
Biogas 873 n/a 393 FiT (2001) Achieved
Biomethane 26 215 - FiT (2011) -
France started to develop its biogas production early on:
both biogas and electricity from biogas were already
available in 1990 (earliest Eurostat data), although in small
amounts: electricity production from biogas in 1990 was only
72 GWh. Production started to increase significantly in the
early 2000’s, when the main support scheme (a Feed-in
Tariff) was introduced in the country. In its original version,
the Feed-in Tariff (FiT) ranged from 61 to 91.5 € per MWh for
electricity production from biogas (45 to 57.2 € per MWh if
based on landfill waste). Biogas installations with an Installed
Electric Capacity (IEC) below 12 MW were eligible for a
duration of 15 years. The support scheme was then updated
multiple times, for example in 2002 (introduction of an
efficiency bonus) and 2006 (introduction of a ‘methanisation’
bonus). The support scheme helped a great deal in
developing production of biogas and electricity from biogas
in the country, as shown in figure 1-FR. In 2017, the FiT
ranges from 150 € per MWh (IEC above 500 kW)
to 175 € per MWh (IEC below 80 kW), with a bonus of
50 € per MWh if feedstock use comprises more than 60%
manure. Biogas installations are also eligible for tenders to
help the sector develop further. A bonus was introduced in
2016 for biogas based on landfill waste or sewage sludge
(IEC above 500 kW) as part of the ‘law related to energy
transition and green growth’.
Figure 1-FR: Evolution of FiT and electricity production from biogas in France

5
EBA Statistical Report 2017 - Abridged
AT
EU
BE
CH
CZ
DE
DK
EE
EL
ES
FI
FR
HR
HU
IE
IT
LV
NO
PL
PT
RO
SE
SK
UK
EBA and Eurostat data also show that the number of biogas
plants in France has greatly developed since 2010
(earliest EBA data). The total number of plants rose from
498 installations in 2010 to 873 in 2016
(+375 units, see figure 2-FR). Development of the sector
since 2010 has stemmed principally from agricultural plants,
which increased in number from 48 to 330 units during the
same time period (+282 units). In 2016, biogas plants based
on landfill waste were still the most numerous, with a total
of 351 units (40% of the total number), closely followed by
plants based on agricultural substrates (38%), as highlighted
in figure 2-FR.
Figure 2-FR: Evolution of the number of biogas plants in France (left) and number of plants per feedstock in 2016 (right)
Figure 3-FR: Evolution of Installed Electric Capacity in France (left) and IEC per feedstock in 2016 (right) in the biogas sector
FR

6
EBA Statistical Report 2017 - Abridged
Figure 5-FR: Evolution of the number of biomethane plants in France (left) and number of plants per feedstock in 2016 (right)
Installed Electric Capacity (IEC) in France has also increased
very considerably, in accordance with the number of biogas
plants. Between 2011 and 2016, total IEC rose from 210 MW
to 393 MW installed (+183 MW), constituting growth of 86%
in only 5 years (see figure 3-FR). Although biogas plants
based on agricultural substrates are roughly equivalent in
total number to landfill-based plants (see above),
plants based on landfill waste contribute by far the largest
share of the national IEC, with 260 MW installed (66%),
significantly ahead of agricultural plants (which contribute
20% of the total IEC with 80 MW installed).
Concerning feedstock use for biogas production in the
country, France has set a cap of 15% energy crops
permissible in the total substrate mix of a biogas plant
(by mass percentage, calculated across an average of three
years). Energy crops in France are defined as food crops
(cereals and other starch, sugar, oil and leguminous crops
usable for human or animal consumption) or energy crops
grown as main crops. Excluding substrate from landfill and
sewage (given their inherent production system), the main
feedstock for biogas production in France is manure:
as illustrated in figure 4-FR, manure accounts for two thirds
(by mass) of the substrate mix (most of agricultural
residues), while the second most widely-used feedstock is
energy crops (14%). Other feedstocks include various kinds
of waste, principally municipal, bio-, industrial and other
types of waste. Agricultural feedstocks for biogas production
purposes in France are thus mainly comprised of waste.
Figure 4-FR: Distribution of feedstock use for biogas production
in France in 2015

7
EBA Statistical Report 2017 - Abridged
AT
EU
BE
CH
CZ
DE
DK
EE
EL
ES
FI
FR
HR
HU
IE
IT
LV
NO
PL
PT
RO
SE
SK
UK
France has allowed biomethane injection in the gas grid
since 2011, and inaugurated the first biomethane plant in
November of that year. Between 2011 and 2016, the number
of biomethane plants increased from 3 to 26 installations
(+23 units, see figure 5-FR) and there are 40 biomethane
plants running at the time of writing (October 2017).
As is the case for biogas, development of biomethane
production has originated principally from agricultural
plants. In 2016, 18 plants were using agricultural substrates,
equating to 69% of all plants with only 5 based on waste
(‘other’, mainly municipal wastes) and 3 on sewage sludge.
The total annual production of biomethane has also
increased substantially, in line with the rise in the
biomethane plant numbers. Total biomethane production
rose from 3 GWh in 2011 to 215 GWh in 2016 (+212 GWh,
see figure 6-FR). The total maximum injection capacity of
biomethane in France at the end of 2016 was estimated at
410 GWh1, with the largest share located in agricultural
plants, which contribute a collective capacity of 199 GWh
(49% of the maximum injection capacity), in line with the
high proportion of plants using agricultural substrates.
Figure 6-FR: Evolution of biomethane production in France (left) and
maximum annual biomethane injection capacity in GWh per feedstock in 2016 (right)
Like biogas, biomethane production in France largely relies
on waste use for its process. As highlighted by figure 7-FR,
the main feedstock is sewage sludge (41%), followed by bio-
and municipal waste (30%). Energy crops dedicated to
energy production only amounted to 7% in 2016. This waste
valorisation puts France in a strong position to comply with
the upcoming sustainability criteria of the new EU
Renewable Energy Directive (RED II). The distribution of
biomethane upgrading technologies in France is presented in
figure 7-FR.
Support schemes for biomethane development were first
implemented in 2011. These included a feed-in tariff
(duration of 15 years) and a Guarantee of Origin (GoO)
instrument to track biomethane production. A compensation
mechanism was also set in place to help biomethane
producers with the price compared to natural gas, and with
additional expenses (costs linked to the GoO scheme,
management fees for the compensation scheme, etc).
These support schemes were completed in 2013 by the
introduction of ‘double valorisation’, which allows a plant to
produce either electricity or biomethane from biogas
(its production then benefits from the FiT for electricity or
biomethane depending on the type of energy produced).
The evolution of the biomethane tariffs in 2016 based on
substrate use and output capacity is displayed in figure 8-FR.
FR
1 Renewable gas panorama 2017 - GRTgaz

8
EBA Statistical Report 2017 - Abridged
Figure 8-FR: Evolution of the FiT for biomethane in France based on substrate use and output capacity
(Renewable gas panorama 2017 - GRTgaz2)
Figure 7-FR: Distribution of feedstock use for biomethane production (mass percentage, panorama gaz renouvelable 2016)
(left) and number of plants per upgrading technique (right) in France in 2016
2 Renewable gas panorama 2017 - GRTgaz

9
EBA Statistical Report 2017 - Abridged
AT
EU
BE
CH
CZ
DE
DK
EE
EL
ES
FI
FR
HR
HU
IE
IT
LV
NO
PL
PT
RO
SE
SK
UK
In the system currently operating in France, every GoO
represents one MWh of biomethane produced, and is valid
for a duration of two years. The biomethane producer enters
a contract with a gas supplier of their choice, to whom the
GoO is transferred. When the MWh of biomethane is
consumed, the GoO is deleted from the registry.
Currently, 18 gas suppliers have expressed their interest in
biomethane. Every molecule of biomethane produced is thus
tracked by the French biomethane registry: injection,
trade and selling are registered. This work has been carried
out by the GRDF since 2012 and is accessible on the
gobiomethane website3. The market is currently not open to
traders.
Although France greatly increased its biogas and biomethane
production, the growth rate may not be enough to enable
the country to reach its various targets. For biogas
production, France set two sets of targets:
• the ‘Pluriannual Energy Programme’ (Programmation
Pluriannuelle de l’Énergie - PPE) decree released in
October 2016, aiming at 9.2 TWh by 2018 and
13.5 TWh by 2023
• National Renewable Energy Action Plan (NREAP)
aiming at an electricity production of 3.7 TWh by
2020
As highlighted by figure 9-FR, extrapolated production is
lower than the target set by the French Pluriannual Energy
Programme (9.2 TWh in 2018 and 13.5 TWh in 2023).
Notice that although the PPE and NREAP targets assume an
exponential growth for both biogas production and
electricity from biogas production, the extrapolation
considered for figure 9-FR is linear because the development
of Installed Electric Capacity (see figure 3-FR) and the share
of renewable energy in gross final energy consumption in
France have both been linear for the last few years.
Figure 9-FR: Biogas production in France: reported numbers and forecast (TWh)
FR
3 https://gobiomethane.grdf.fr/

10
EBA Statistical Report 2017 - Abridged
Development of the IEC is roughly in line with national
objectives (NREAP): in 2011, 2012 and 2015, France even
reached a slightly higher IEC than the original target,
although it is lagging behind its 2016 target of 415 MW,
with only 393 MW installed (see figure 10-FR). The contrast
between the trend in development of biogas and electricity
production from biogas, and the trend in IEC development,
can be partially explained by the specificities of the French
biogas market. According to a study made in 2015 (ecube
20154), biogas operators and investors in new projects in
France are facing numerous issues, both in opening new
biogas plants and in the operation of existing sites. One of
the main reasons listed is the variable income caused by
process interruption (lowered operating time), with almost
two thirds of biogas sites facing a return on investment
significantly lower than expected. The French biogas sector is
thus roughly developing according to existing plans, but is for
the moment performing poorly. The same can be said of
French biomethane development, which is likely to struggle
to reach its PPE targets (1.7 TWh by 2018, 8 TWh by 2023).
Figure 10-FR: IEC of biogas plants of in France: forecast and reality
Although development in France is lagging slightly behind its
various targets, the country is one of the most promising in
Europe for biogas and biomethane production.
This significant potential derives from three main factors:
rapid development of the number of biomethane projects,
feedstock availability, and state-of-the-art research in
innovative pathways (biomass gasification, power-to-
methane).
The number of biomethane projects currently being
developed in France is significant. GRTgaz estimates that
biomethane projects queuing for grid connection amounted
to 241 in late 2016 (252 in April 2017). These projects could
amount to 5 TWh of annual production in 2 to 5 years,
making biomethane production skyrocket in France and
establishing the country as the second biggest biomethane
producer in Europe (5 TWh amounts to 59% of the 2015
German biomethane production). The map of these
252 French projects per company in charge is illustrated in
figure 11-FR.
Regarding feedstock availability, a recent report from the
European Commission highlights the significant potential for
biogas production in France. The report indicates that the
country could reach more than 4.2 Mtoe (48.9 TWh)
of biogas by 2030, as illustrated in figure 12-FR (Kampman et
al 2016). For this level of biogas production to be reached, an
‘accelerated growth’ scenario would be necessary. If this
were to ensue, the feedstock and biogas potential would
correlate with “the structure of the agricultural sector,
especially concerning the amount of manure”, and no more
than 20% of the substrate mix would be energy crops.
4ecube (strategy consultants). “Etat Des Lieux de La Filière Biogaz: Rapport Final”, 2015.

11
EBA Statistical Report 2017 - Abridged
AT
EU
BE
CH
CZ
DE
DK
EE
EL
ES
FI
FR
HR
HU
IE
IT
LV
NO
PL
PT
RO
SE
SK
UK
Figure 11-FR: Geographical distribution of the biomethane projects queuing for approval in France
The accelerated growth scenario includes assumptions about
deployment pace, feedstock deployment, learning curve,
investment costs and conversion efficiencies. The cap on
energy crops doesn’t impact French biogas potential,
given that it is legally required not to use above 15% of
energy crops in the substrate mix for biogas production.
Reaching this 4.2 Mtoe potential, second highest in Europe
after Germany’s, would suffice to reach the 10% target for
renewable gas in natural gas consumption by 2030
(Energy code target) without using more energy crops than
today, and to reach the Pluriannual Energy Programme
target of 8 TWh by 2023. PPE targets for 2030 are under
discussion at the time of writing.
Finally, France is investing heavily in innovative pathways in
the biogas sector, and plans to invest in gasification and
power-to-gas in future years. The Gaya Project, for example,
is an experimental 600 kW state-of-the-art pilot model
aimed at enabling the production of biomethane from dry
biomass-to-gas (wood, straw, etc). The Gaya project was
launched in 2010 on the initiative of 11 partners from the
industrial, institutional, and academic worlds in France and
Europe (led by ENGIE) and was inaugurated in October 2017.
The Jupiter 1000 Project is an example of a power-to-
methane project in France. The project led by GRTgaz aims
at valorising the electricity surplus from local RES and
industrial sources of CO2 by transforming the two into
synthetic methane and hydrogen near Marseille.
FR

12
EBA Statistical Report 2017 - Abridged
Figure 12-FR: Growth of biogas production per Member State in Scenarios 2 and 4 (accelerated growth) in ktoe5
Bruno Deremince
Technical and Project Officer
Tel: +32.24.00.10.87
Stefanie Königsberger
Technical and Project Officer
Tel: +32.24.00.10.87
Further Information
5 Kampman, B. et al. Optimal Use of Biogas from Waste Streams: An Assessment of the Potential of Biogas from Digestion in the EU beyond 2020,
December 2016.

Abbreviations
CH4
CHP
CO2
€
FiP
FiT
GC
GoO
IEC
kWel
kWth
LFG
Mio
M-, G-, TWh
NREAP
P2G
ROC
AT
BE
BG
CH
CY
CZ
DE
DK
EE
EL
ES
FI
FR
HR
HU
IE
IS
IT
LT
LU
LV
MT
NL
NO
PL
PT
RO
RS
SE
SI
SK
UK
Methane
Combined Heat and Power
Carbon dioxide
Euro
Feed-in premium
Feed-in tariff
Green Certificate
Guarantee of Origin
Installed Electric Capacity
Kilowatt electric
Kilowatt thermal
Landfill gas
Million
Mega-, Giga-, Terawatt hour
National Renewable Energy Action plan
Power-to-gas
Renewable Obligation Certificate
Austria
Belgium
Bulgaria
Switzerland
Cyprus
Czech Republic
Germany
Denmark
Estonia
Greece
Spain
Finland
France
Croatia
Hungary
Ireland
Iceland
Italy
Lithuania
Luxembourg
Latvia
Malta
The Netherlands
Norway
Poland
Portugal
Romania
Serbia
Sweden
Slovenia
Slovakia
United Kingdom

European Biogas Association
Rue d’Arlon 63-65
1040 Brussels, Belgium
+32 24 00 10 89
This Statistical Report is published by the European Biogas Association.
It was written and designed by the EBA’s technical department (Bruno Deremince and Stefanie Königsberger).
December 2017
Join us on
The European Biogas Association Statistical Report 2017 has been printed thanks to the support of proud EBA Members: