statistical mutation calling from sequenced overlapping dna pools
TRANSCRIPT

Statistical Mutation Calling from SequencedOverlapping DNA Pools in TILLING Experiments
Victor Missirian1, Luca Comai2, Vladimir Filkov∗1
1 Department of Computer Science, UC Davis, 1 Shields Ave., Davis, CA 95616, USA2 Department of Plant Biology and Genome Center, 1 Shields Ave., Davis, CA 95616, USA
Email: [email protected];
∗Corresponding author
Abstract
Background: TILLING (Targeting induced local lesions IN genomes) is an efficient reverse genetics approachfor detecting induced mutations in pools of individuals. Combined with the high-throughput of next-generationsequencing technologies, and the resolving power of overlapping pool design, TILLING provides an efficient andeconomical platform for functional genomics across thousands of organisms.
Results: We propose a probabilistic method for calling TILLING-induced mutations, and their carriers, from highthroughput sequencing data of overlapping population pools, where each individual occurs in two pools. Weassign a probability score to each sequence position by applying Bayes’ Theorem to a simplified binomial modelof sequencing error and expected mutations, taking into account the coverage level. We test the performance ofour method on variable quality, high-throughput sequences from wheat and rice mutagenized populations.
Conclusions: We show that our method effectively discovers mutations in large populations with sensitivity of92.5% and specificity of 99.8%. It also outperforms existing SNP detection methods in detecting real mutations,especially at higher levels of coverage variability across sequenced pools, and in lower quality short reads sequencedata. The implementation of our method is available from: http://www.cs.ucdavis.edu/∼filkov/CAMBa/.
Background
TILLING (Targeting Induced Local Lesions INGenomes) [1] is a reverse genetics approach to de-tect effects of globally induced mutations in a pop-ulation and identify the individuals that have mu-tations in genes of interest. Mutations discoveredthrough TILLING allow the functional characteriza-tion of genes known only by their sequence. Further-more, because TILLING is applicable to any speciesthat can be mutagenized, it can be used to knock outundesirable characters in crops [2]. A refinement of
previous approaches, TILLING-by-Sequencing (Co-mai et al., unpublished) follows up the mutagenesiswith deep sequencing of individuals or populations ofinterest. Because of the high throughput of currentsequencing technologies, deep sequencing to hundredand thousand fold coverage is possible [3]. This al-lows unprecedented precision when identifying theinduced mutations.
The TILLING-by-sequencing setup in one ofour labs (Comai) uses the mutagen ethyl methane-sulphonate (EMS) or the combination of sodiumazide and methyl-nitrosourea (Az-MNU) to induce
1

mutations in a population of 1500-6000 individuals.The mutations induced will be heterozygous in 2/3of the cases and homozygous in the rest. Units of768 individuals arrayed in a 96 well-plate, 8 indi-viduals per well, are then screened. The row andcolumn samples are pooled to yield 8 row- and 12column-pools (for a total of 20 pools). Thus, therow and column pools overlap in their DNA contentin such a way that each individuals DNA is presentin exactly 2 pools. This arrangement allows for theidentification of both the mutated positions and theindividuals that carry them. We call this setup bi-dimensional pooling , and illustrate it in Fig. 1. DNAfrom each of the 20 pools is PCR-amplified withprimers designed to amplify 1-1.5 DNA segmentsfrom up to 40 genes of interest, and subsequentlysequenced using Illumina GA machines. The readsare then mapped onto reference genomes.
Given a stretch of DNA of interest from a refer-ence genome and a complete set of deep sequenced,bi-dimensionally overlapping pools (20 pools in ourcase) we want to identify the positions with muta-tions along the DNA and their individual carriers.The computational problem, then, is to identify theposition and the row- and column-pool for each mu-tation.
Any solution to this problem would of coursefocus on identifying significant differences betweenthe reference genome and the sequenced DNA. Theproblem is complicated by the non-independentpools of the experimental setup, the infrequency ofthe mutation’s occurrences with respect to the sizeof the population under study, and also by variabil-ity, or non-uniformity in the sequencing coverage,which is not uncommon for 2nd generation sequenc-ing technologies [4]. For example, in our experimen-tal setting, a mutation in a single individual is ex-pected to cause a higher base change frequency inone row and one column library, and many muta-tions can be recognized in this way, by visual detec-tion of outliers (we call this the Outlier approach).In Fig. 2, we show the base change frequency for eachlibrary at three positions with confirmed mutationsfrom mutagenized wheat and rice. From left to right,there is apparent increased difficulty in identifying amutation. The accuracy of calls made by the Outlierapproach depends on the coverage, or number of nu-cleotide calls per position per library. Given a fixedprobability of base change due to error, at high cov-erage levels, libraries with real mutations will usu-ally stand out clearly from the noise. As coverage
drops, a larger range of base change frequencies mayreasonably occur due to chance in the absence of areal mutation, thus increasing the number of falsepositives. The Outlier approach cannot distinguishthese cases because it does not take coverage levelsinto account, so a single gene that has low cover-age on a few libraries can cause a high overall falsepositive rate.
Here we propose a new method, Coverage AwareMutation calling using Bayesian analysis, CAMBa,(read like the dance) which directly considers thepooled setup and coverage levels when calculatingmutation and noise probabilities. Using data fromtwo TILLING experiments, one on rice and one ontetraploid wheat, we validate CAMBa’s efficacy inidentifying mutations, and demonstrate that it doesat least as well as other mutation calling methods,and that it outperforms the other methods on therice experiment which has a lower quality and highervariance in coverage across libraries. We also testand confirm the hypothesis that CAMBa is insen-sitive to lower data quality and variable sequencingcoverage across libraries dur to the overlapping poolsexperimental design.
Related Work
Rigola et al. [5] use a Poisson distribution based ap-proach to identify mutations and natural variationsin individuals using bi- and three-dimensional pool-ing schemes coupled with high-throughput sequenc-ing. We compare their method to CAMBa in theResults section.
A variety of approaches exist for callingSNPs from non-overlapping pooled samples, e.g.VarScan [6], CRISP [7], SNPseeker [8], the MAQalignment tool [9], and others; and non-pooled sam-ples, e.g. POLYBAYES [10], PolyScan [11], themethod by Stephens et al. [12], and others. Ourapproach is specifically geared to working on pooledexperiments with overlap between the DNA pools,i.e. DNA from the same individual is present intwo pools. That is not the case for these other ap-proaches, so we could not compare them directly toCAMBa. Moreover, these other approaches iden-tify mutations but not the individuals in the popu-lations that carry them. We modified some of them(VarScan and CRISP) in order to compare them toCAMBa and report those studies in the Results sec-tion.
Overlapping pool designs for high-throughput re-
2

sequencing have been recently proposed by Prabhuand Pe’er [13], where they focus on optimizing over-laps to increase design efficiency (as compared tooptimal), lower necessary sequencing coverage, de-crease false positives and false negatives, and iden-tify mutation carrier with lower ambiguity. They donot provide software for testing their designs and itis not immediately clear that their designs could eas-ily fit into standard wet lab protocols (e.g. with re-spect to standard well plates, etc.) Our overlappingpooling scheme can be evaluated in their theoreticalframework, and in terms of the “code efficiency” itis 50% worse than the theoretically optimal binarydesign (although it is not clear if that optimum isachievable in practice).
MethodsThe experimental TILLING setup encompasses a 2Dwell-plate, with iwell individuals pooled per well andil individuals in each library l, the total number ofwells nw in the experiment, the reference base r atthe current position, the probabilities pc and pncwith which the mutagen, EMS or MNU, will inducea specific canonical (G → A or C → T ) or non-canonical base change at a given position in a singleindividual, and the fraction of induced mutations tzfor each zygosity z.
The input data, D, is comprised of a set, L, ofrow and column libraries of short reads covering thesequences of interest. The reads for each libraryare aligned to their reference sequences using theMAQ (Mapping and Assembly with Quality) align-ment tool [9], associating each position in each till-ing sequence with a set of nucleotide calls: eitherthe reference nucleotide base, r or a base changer → m, m 6= r. In the alignment, or pileup, ofreads, for each position we count the total num-ber of reads, i.e. coverage, in a given library, de-noted by nl, and separately the number of reads thathave base b at that position in that library, klb (sonl = klA + klT + klC + klG).
To find the carriers and the mutations, given thedata, D, and the well-plate experimental setup foreach sequence position we model the posterior prob-abilities of each possible mutation in each well. We
assume that at most one individual will have a mu-tation at any given sequence position. 1 Thus, atmost one well can have a mutation with respect toone specific base change. We denote these possibil-ities, or ( configurations), as cw,m, where w is thewell, and m is the base change from reference. (Inour setup, we distinguish 288 mutation possibilitiessince we have 96 wells and 3 possible base changesdifferent than the reference). The probabilities cor-responding to the configurations are p(cw,m|D). Wecall a mutation at a given position if the probabilityof at least one mutant configurations cw,m exceeds apredefined threshold indicating that well w containsan individual with base change m at the current po-sition. If more than one cw,m pass the threshold,then the one with highest probability is chosen. Thethreshold is determined based on the expected num-ber of mutations in an experiment, as described inSec. .
In the following we calculate the probabilitiesp(cw,m|D). Since the experimental procedure makesthe expected number of heterozygous mutationsequal to twice the number of homozygous muta-tions, we further distinguish configurations by zygos-ity, and use cw,m,z to model the probabilities of het-erozygous, z = het, and homozygous, z = hom, mu-tations separately, and p(cw,m|D) = p(cw,m,het|D)+p(cw,m,hom|D). Then, from Bayes’ Theorem we get:
p(cw,m,z | D) =p(cw,m,z)p(D | cw,m,z)∑
c′∈C p(c′)p(D | c′),
where C is the set of all possible configurationscw,m,z at the given position (288 ∗ 2 = 576 in oursetup). Since we exclude all configurations withmore than one mutant individual for the current po-sition, the sum of the prior probabilities p(c′ | s) donot add up to 1, but normalizing does not affect theresult.
Next, we calculate both the prior and conditionallikelihood probabilities. We model the prior proba-bility of a base change r → m at the current positionin exactly i out of the iwell individuals in a given wellas:
1This is supported by evidence from a previous TILLING experiment in tetraploid wheat using the mutagen EMS, whereSlade et al. [2] identified 50 positions for which at least one of the 768 individuals contained a mutation but only 3 for whichthere was a mutation in two individuals. In rice, which has a significantly lower expected mutagenesis rate at each possiblereference base [2, 14, 15], we expect an even smaller percentage of the positions for which there is a mutation in one individualto have a mutation in more than one individual.
3

pim =
{B(i | iwell, pc) if r → m is canonical
B(i | iwell, pnc) if r → m is non-canonical
where B(i | iwell, pc) is the Binomial distribution,i.e. the probability of having i successes out of iwell
trials given an individual success probability of pc.A given well has prior probability ptm = p1m of
being a mutant well for base change m and pfm =p0m of being a non-mutant well for base change m.The prior probability of a given configuration cw,m,z
is the product of the prior probabilities of each wellw on each base change m, multiplied by the frac-tion of induced mutations with the given zygosity,if applicable. Thus, since there are three possiblebase changes at the current position, m, m′, and m′′,p(cw,m,z) = tzptmpnw−1
fm pnw
fm′pnw
fm′′ . Note that theseprobabilities are the same for all wells (i.e. theydon’t depend on w).
To calculate the likelihood p(D | cw,m,z), we usethe fact that each well w is an intersection of a rowand a column library. First, we assume that all basechange counts are conditionally independent givennl and cw,m,z, and so we simplify the likelihood tothe individual libraries:
p(D | cw,m,z) =∏
m∈{A,T,C,G}m6=rl∈L
p(klm | nl, cw,m,z).
Each term in the product on the right is the con-ditional probability of observing klm reads havingbase m at that position, given nl coverage for thatlibrary and configuration cw,m,z. We model this withthe Binomial distribution, as a function of probabil-ity rlmc, the expected rate of reading base change mat the current position in library l, given configura-tion cw,m,z:
p(klm | nl, cw,m,z) = B(klm | nl, rlmc).
We model rlmc in terms of mlc, the fraction ofmutant alleles in library l under configuration c, andrr→m, the rate at which a base r is read as m in wellw, as: rlmc = (1 −mlc)rr→m,c + mlc. We computemlc from the number of individuals il in library l andthe zygosity z of the candidate mutation. Finally, weestimate rr→m:
rr→m,c =∑l∈Lc
klm/∑l∈Lc
nl.
where Lc is the set of all libraries excluding the two(one row and one column library) which intersect atwell w, and have mutation m at the given position.
Pre-processing
For each library, we compute a low quality cutoff forbase calls to be one standard deviation below themean quality of the reference base calls; we throwout all base calls below this quality threshold. Afterfiltering out low quality base calls, we do not searchfor candidate mutations at the current position if themean coverage over all but two libraries is less than10,000, to avoid inaccurate estimates of rr→m.
The orientation bias of a specific base is thefraction of base reads for that base coming fromreads that map to the forward rather than the re-verse strand of the TILLING sequence. If the ref-erence base orientation bias for a given library atthe current position is different from the orientationbias of base change m with pvalue < 0.01, then weset p(D | cw,m,z) = 0 to exclude each configura-tion c for which a well represented in that libraryis a mutant well for base change m. We also setp(D | cw,m,z) = 0 for these configurations if the ref-erence base orientation bias for the given library isgreater than 10 or less than 0.1, since a strong ref-erence base orientation bias can make it difficult todetect a significant difference between the orienta-tion biases of the reference base and a given basechange. In addition, if a given library has morebase reads for the candidate base change than forthe reference base at the current position, then weset p(D | cw,m,z) = 0 for each configuration wherea well in that library is a mutant well for any basechange.
Number of Predictions
We construct our initial estimate of the numberof real mutations in a given experiment by addingup the probabilities of each possible induced basechange at each position across all TILLING se-quences in all individuals, where the probability of agiven canonical or non-canonical base change is de-termined from CEL-1 screening of an experiment onthe same organism using the same mutagen [14,15],
4

as described in the data section below. By thismethod, we estimate 47 real mutations in Rice and69 real mutations in wheat. Since CEL-1 has a sig-nificant false negative rate, we correct our initial es-timate using additional validation information fromthe wheat experiment. When an older version of ourapproach was run on the wheat experiment, 8 of the10 predictions ranked 86 to 95 were tested and all 8were confirmed. We drop below this ranking to givethe semi-conservative estimate of 107 real mutations.We divide 107 by 69 to get a candidate scaling fac-tor of 1.55. We predict the number of real mutationsfor a given experiment to be 1.55 times our initialestimate of the number of real mutations from CEL-1 screening. The predicted number of mutations is107, by definition, for wheat, and it is 75 for rice.This determines our threshold.
The above approach for determining the appro-priate threshold yields very good bounds for our dataand can be applied whenever previous CEL-1 screen-ing experiments have been done. In the absence ofsuch prior experiments, one can apply the follow-ing method, although the results may include higherfalse positive rates. The false positive rate at a givennumber of predictions can be estimated by runningCAMBa with input a scaled down bi-dimensional ar-rangement using only the row pools. E.g., the rowpools in the new scheme could be half of the actualrow pools, and the new column pools could be theother half of the original row pools. Since we ex-pect few or no instances where the same mutationoccurs in two independent row libraries, the num-ber of row/row calls serves as an upper bound onthe number of false positives among the row/columncandidates. Similarly, we could scale down the orig-inal arrangement using the original column pools in-stead of the row pools. We scale up by the ratioof the number of row/column pools versus the num-ber of row/row pools, and choose the largest numberof candidates for which the estimated false positiverate is nearest to our goal threshold. As an illustra-tion of this method, we split the wheat data set 12column pools into two groups of 6 pools each, andran CAMBa on this new bi-dimensional pooled dataof 6 rows and 6 columns. At a false positive rate of0.05, this method yields a threshold for CAMBa of105 mutations.
We note that although CAMBa yields posteriorprobabilities for each of thousands or tens of thou-sands of positions, we never use hypothesis testingto determine the threshold in either of the two ap-
proaches above, and thus we need not correct formultiple hypothesis testing.
Methods for Comparison
We compare the performance of CAMBa to thoseof a number of methods below. Only the Out-lier and the Poisson outlier methods predict boththe mutated positions and the individual carriers,whereas the others only predict the mutation po-sitions. Hence, either they or CAMBa have beenmodified to allow for the comparison. In each casewe specify the modification undertaken.
The Outlier method uses the same preprocessingtechniques as CAMBa, and is inspired by simple vi-sual identification of a row and column library pairthat stand out from the rest in terms of the fre-quency of a given base change. When consideringa given position in a TILLING sequence, if at leastone well has a score greater than a fixed thresholdt on some base change, then we predict a mutationfor the base change and well combination with thehighest score. For a given well w and base changem, we find the z-score of the r → m base changefrequency for both the associated row and columnlibrary with respect to the distribution of the r → mbase change frequencies for the remaining libraries,and we set the score of well w on base change m tobe the lower of these two z-scores. We add 0.0001 tothe sample standard deviation to avoid division byzero.
The Poisson outlier method is described in aTILLING-by-sequencing pipeline by Rigola et al. [5].This method consider only G to A and C to Tbase changes for the purposes of mutation detec-tion. Since MNU can induce any type of base changein rice, we modified the Poisson outlier method tosearch for all possible base changes when detectingmutations in rice. Rather than following the proce-dure for detecting natural variation, which considersall base changes as a whole, we tested for each basechange individually, to reflect the assumption thatan individual will have at most one mutation at agiven position.
VarScan is a SNP identification method in indi-vidual or pools of massively parallel sequence databy Koboldt et al [6]. It identifies variants based onread counts, base quality, and allele frequency. Weused VarScan with varying p-values (its only param-eter setting). VarScan does not take into accountoverlap in pools and it does not identify the indi-
5

viduals carrying the mutations. To compare it toCAMBa in a bi-dimensional setting, we ran VarScanseparately on the row pools and again on the col-umn pools. We took the maximum of the row andcolumn p-values as the combined p-value for a muta-tion present in both the rows and the columns. Theresults were mostly unchanged when we ran VarScanon the 20 pools together.
CRISP [7] is a statistical method for variant de-tection in pooled DNA samples, shown to dominatea number of other methods in direct comparison ofSNP detection [7]. Like VarScan, CRISP does notidentify the mutation carriers, so when comparingCAMBa and CRISP by the number of candidatesthat overlap with the set of confirmed mutations,we considered only the position and base change ofeach candidate. Since it does not account for pooloverlap, to compare it to CAMBa we ran CRISPunder three different scenarios: on all 20 libraries,separately on the 8 row-pools, and separately on the12 column-pools. We only include results for CRISPon its default parameters, due to the non-intuitiveperformance of CRISP when running it with relaxedparameters. (As CRISP has two user-modifiable pa-rameters, we performed two-dimensional search todetermine the threshold combination that gives usthe set of top candidates that has the highest over-lap with the set of confirmed mutations. Unfortu-nately, even after this optimization step, the perfor-mance was weaker than when CRISP was run withthe default parameters. Modifying CRISP more sub-stantially was beyond the scope of this project andcertainly beyond expectations of any practicing bi-ologist.)
We also attempted comparisons with MAQ [9]but we could not get any mutation predictions onour data sets with their default settings.
Results and Discussion
Using data from two TILLING-by-sequencing exper-iments we analyze the performance of CAMBa andcompare it to those of other approaches. We investi-gate the effect of sequencing quality, sequencing cov-erage variability, and the overlapping pool design onthe fidelity of our and the other methods in resolvingmutations from the data.
Two TILLING Experiments
Using the setup described earlier (768 individuals ar-rayed evenly into a 96-well plate, 8 row and 12 col-umn pools sequenced) a total of 13 rice genes (avg.TILLING seq. length = 1393 bp) and 5 wheat genes(avg. TILLING seq. length = 934 bp) of interestwere sequenced using Illumina GA machines to lookfor mutations in a population of 768 individuals. Thereads on the average were of length 35 bp for the riceand 40 bp for the wheat data. There was a signifi-cant difference in the read quality between the two:the rice had an average Phred quality score of 13 andthe wheat of 31. There was also a larger variance incoverage between individual libraries in the rice dataset than in the wheat data set. Also, on average, thecoverage was 140× per individual in rice and 270×in wheat. The full data and experiments will be de-tailed elsewhere (Comai et al., unpublished). Thedifferences in quality, coverage, etc. between thesetwo data sets make them very good case studies forour method.
To evaluate the performance of the mutation call-ing algorithms, we used two sets of mutations, oneset for wheat and one for rice, which have been previ-ously confirmed using an independent method (PCRamplification followed by sequencing) [16]. In totalwe had 39 confirmed mutations from the wheat ex-periment and 11 from the rice experiment. 2 We notethat the confirmed mutations are a fraction of the to-tal expected mutations in these data sets. Ideally, allpredicted mutations should be tested, but practicalresource constrains dictate limits on the validation.
Using prior TILLING experiments we determinethe probabilities of a canonical mutation, pc, non-canonical mutation, pnc. We assume position inde-pendent values for pc and pnc, as indicated by priorexperiments [2,14,15]. We estimate pc and pnc fromic and inc, the induced mutation rates for canonicaland non-canonical mutations, and ptil(b), the frac-tion of TILLING reference sequences with base b, foreach b (in prior corresponding experiments): pc =ic/ptilG,C and pnc = inc/pnc
(2ptilG,C + 3ptilA,T
).
We compute ic and inc using previously describedmethods [14, 15]. Thus, we get for rice, pc =5.6×10⁻⁶ and pnc = 4.93×10⁻⁷, and for wheat, pc =3.88×10⁻⁶ and pnc = 0. The fraction of heterozy-gous mutations is thet = 2/3, and homozygous mu-tations is thom = 1/3.
2These sets of confirmed mutations come from predictions using prior iterations of our approach, and prior experimentalapproaches, using CEL-1, on these data sets and all consequently confirmed with PCR amplification.
6

Validation
Due to the apparent bimodality of the calculatedposterior probabilities, and their clustering aroundthe values of 0 and 1, we apply the following functionto transform t, the posterior probabilities returnedby CAMBa:
F (t) =
{−(log10(1− t)− log10(0.5)
)if t ≥ 0.5
log10(t)− log10(0.5) if t < 0.5
F (t) is effectively the log posterior probabil-ity. For both the rice and wheat TILLING-by-sequencing experiment, the predictions of CAMBaand the other methods are compared against the cor-responding set of confirmed mutations.
To investigate the relationship between the num-ber of predictions and the rates of true positives andfalse negatives, we ran the methods with differentparameter settings. This was especially useful inthe case of VarScan and the Poisson method, whichyielded unreasonable numbers of predictions at theirdefault settings (e.g., the Poisson method at a pvalueof 0.01, recommended by its authors, yielded thou-sands of predictions). So, for a range of values ofCAMBa’s F (t), we generated a set of predictionsfor CAMBa and then set the threshold for the othermethods to return the same number of predictions.Given an objective number of actual mutations ina data set, this approach makes it easy to estimatethe false negatives and false positives directly. As agood estimate of the actual mutations for each dataset, we use the above determined estimates (basedon external knowledge) of 107 mutations for wheatand 75 for rice.
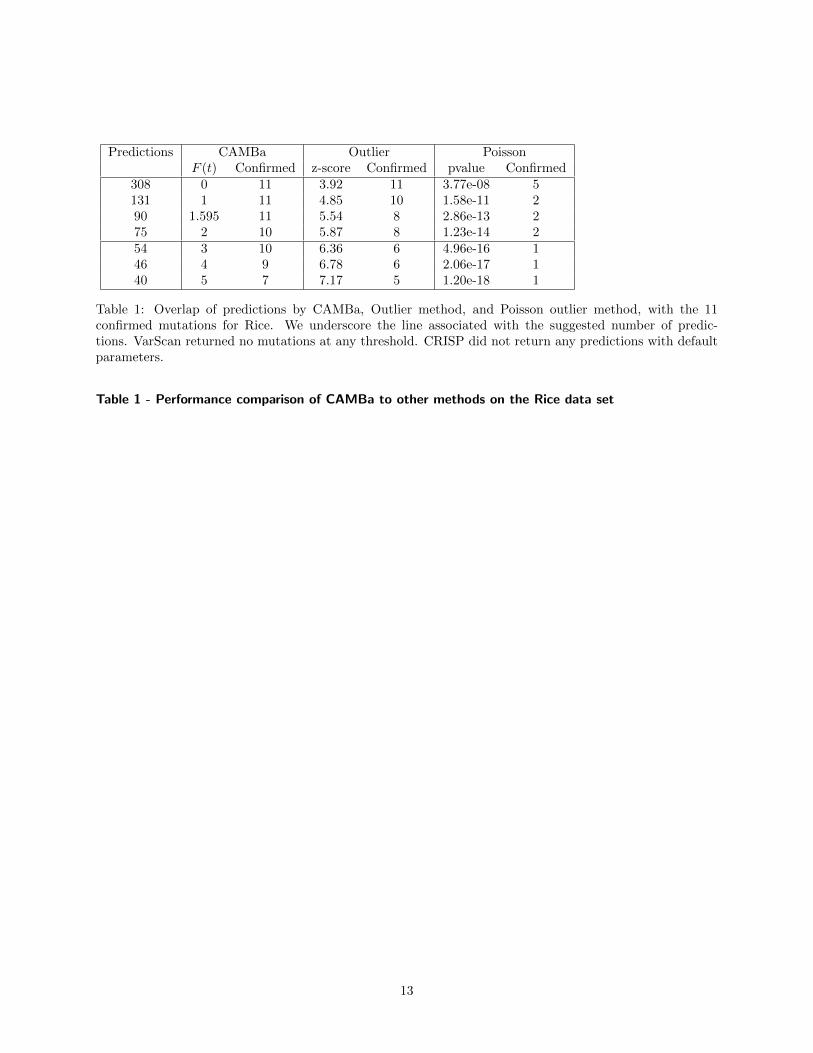
In Tables 1 and 2 we show the overlap betweenthe predictions of each method and the tested andconfirmed sets of mutation candidates, as well as theoverlap between the predictions of the two methods.On the rice data set, CAMBa dominates the othermethods clearly. Increasing the threshold causes thenumber of predictions for rice to increase at a greaterrate than for wheat, for all three methods. This islikely due to the lower quality of the rice data, thushigher amount of noise, as well as the variable se-quencing coverage across pools, as we show below.Interestingly, neither VarScan nor CRISP generatedany predictions on this data. At the threshold asdetermined above of 75 mutations in rice, CAMBapredicted correctly 10 out of the 11 confirmed muta-tions. These results are strong evidence that given
lower quality data CAMBa can utilize the overlap-ping pools experimental setup to its advantage bet-ter than the other methods could.
On the wheat data set, we see greater overlapbetween the predictions of CAMBa and the othermethods. This is consistent with the fact that thewheat data set is of higher quality, and thus muta-tions are easier to identify. At the threshold as de-termined above of 107 mutations in wheat, CAMBapredicted correctly 36 out of the 39 confirmed mu-tations. (Looking closer in the sequence data for the3 false negatives, we found out that one of them isdue to strand-specific bias which resulted in wrongfrequencies of base changes, and another was due tounder-sequencing; the third showed up in the tableat a much higher threshold.)
It is straight forward to estimate the false posi-tive rate and false negative rate using these tables.To do so, first we assume that the confirmed mu-tations have been randomly chosen from the set ofall mutations. Thus, we scale by 107/39 the truepositives, false positives, and false negatives. ForCAMBa, in wheat this gives TP = 99, FP = 8,and FN = 8, for a false negative rate of 7.5×10⁻²
i.e. sensitivity of 92.5%, and a false positive rate of2×10−3 i.e. specificity of 99.8%. Similarly, in rice,CAMBa has sensitivity of 93.4% and specificity of99.96%. Interestingly, even the much lower read dataquality of the rice data (as given by the Phred qual-ity scores above) does not seem to affect CAMBa’sperformance.
By comparison, on wheat, CRISP with defaultparameters yielded (in the best of three scenarios,see above, when run on all 20 pools) 118 predic-tions of which 32 overlapped with the 39 confirmedmutations. This works out to sensitivity of 82% andspecificity of 99.6% in wheat (CRISP yielded no pre-dictions on the rice data set).
To further evaluate the reason for CAMBa’s ad-vantage over CRISP, we also ran CAMBa in a “naivemode” by removing the information that pools over-lap (i.e. one dimensional pooling). We did this bygiving CAMBa a bi-dimensional arrangement of only1 row and 12 column-pools (i.e. we used only thecolumn pools). CAMBa predicted 103 mutations ofwhich 30 overlapped with the confirmed 39. Whenrepeated with the 8 row-pools only there were 99predictions of which 26 overlapped the 39 confirmedones. We could not run CAMBa in “naive mode” onall 20 libraries because they were not independent.CRISP, on the other hand, predicted 147 mutations,
7

of which 30 overlapped with the 39 confirmed oneswhen ran on the row-pools only, and predicted 104,including 25 of the 39 confirmed, when ran on thecolumn-pools only. CRISP appears to have an ad-vantage if we compare its run on all 20 pools versusCAMBa on either the row- or column-pools only, butsuch a comparison is not objective and the advan-tage is in part due to CAMBa working on less data.Neither method shows consistend advantage whencompared on the same number of pools (8 or 12) inthe one dimensional case. Overall, this is strong ev-idence that using an overlapping experimental pooldesign imparts better advantage. We could not com-pare CAMBa to CRISP on the data sets used in theCRISP paper [7] as the sequence data could not bemade available to us.
Coverage Variability over Libraries
CAMBa shows small performance advantage overthe other methods on the wheat experiment, whichhas consistently high coverage levels across all li-braries and between genes. In contrast, CAMBa hasa very clear advantage in the rice experiment, andhere we investigate the difference.
In Fig. 3 we show the coverage variance acrosslibraries for all genes in both experiments, wheat ingray, and rice in black. It is apparent that the blacklines are overall higher on the plot than the graylines, especially the line for HLP1. To test the hy-pothesis that coverage variability gives CAMBa anadvantage over the other methods, we performed twocomputational studies. In the first one, we modifythe rice data set to exclude the TILLING sequencesfor gene HLP1 which has both the lowest mean cov-erage and the highest coverage variability across li-braries in this experiment. On this modified dataset, all methods perform comparably, as shown inTable 3.
In the second study, we gradually increase thecoverage level variance across libraries in the wheatexperiment by selectively discarding base reads. Weset the new coverage level of each library on a givengene to be the coverage ratio of that library to the li-brary with the highest coverage on that gene, raisedto the scaling factor s, multiplied by the coverage ofthe highest coverage library for that gene. To reachthe desired coverage level for a given gene on a givenlibrary, we discard each base call with fixed probabil-ity. CAMBa gains a solid advantage over the Outliermethod between s = 2 and s = 3. At these levels the
coverage still is pretty high overall. The predictionswith added coverage variance at s = 3 are shownin Table 4. This level of coverage variance wouldcorrespond to a level of 0.7 in Fig. 3. We concludethat the likeliest reason for the advantage we see inCAMBa’s performance is due to its insensitivity tocoverage variability in the data, an effect of both itsexplicit use of coverage in the model, and the greatersignal sensitivity imparted by the overlapping pooldesign. While still possible that, on the average, lowcoverage may be the culprit, the second study abovemakes that unlikely.
We note that while the rice experiment uses themutagen MNU and the wheat experiment uses EMS,the choice of mutagen does not seem to have a sig-nificant effect on either the overall mutagenesis rateor the proportion of canonical versus non-canonicalmutations [14].
ConclusionsWe demonstrated that our probabilistic method,which explicitly takes into account the bi-dimensional, overlapping pools experimental setup,and sequence coverage at each position for each li-brary, can effectively discover rare mutations in largepopulations, as well as the individuals that carrythem. It also has a performance advantage overother methods for detecting mutations from high-throughput sequencing of a TILLING populationwhen there is significant coverage variability overlibraries or lower quality data. More generally, itfollows from our experiments that accounting for se-quencing coverage variability can improve mutationdetection in overlapping DNA pools. It would be in-teresting to work out the relationship between cover-age depth and pool size. Likewise, we demonstratedthat an overlapping pooling scheme, beyond offeringcarrier identification, also yields increased sensitiv-ity of mutation detection when the data is less thanideal. This work implies a possible association be-tween the amount of pool overlap (i.e. pool designcode efficiency, or dimensionality of an experimen-tal setup) and detection sensitivity, which deservescloser attention, especially for experiments on largerpopulations.
There are several directions in which our toolcan be improved. We can add to our model an ex-plicit account for position dependence of the mu-tations. Also, we can extend the model to allow
8
multiple mutations at any given position (because ofprior estimates of such events, we suspect that thoseimprovements together will yield less than 10% im-provement). We plan to continue using and improv-ing CAMBa in Comai’s TILLING laboratory. Asother technological issues like higher throughput andsequence tagging get introduced into our pipeline,the issues of coverage sufficiency and higher multi-dimensional TILLING will be addressed.
We note that properly accounting for coveragevariability may improve results in other genomicsproblems benefiting from 2nd generation sequenc-ing, like sequence mapping, genome assembly, andmotif finding.
Authors contributionsThe TILLING-by-Sequencing technology was devel-oped by LC. VM, LC,and VF concieved the compu-tational framework, VM and VF designed the stud-ies. VM developed the software and run the exper-iments. VM and VF wrote the paper, LC helped inediting.
AcknowledgmentsThis work was supported in part by NSF Plant Genomeaward DBI-0822383, TRPGR: Efficient identification ofinduced mutations in crop species by ultra-high through-put DNA sequencing.
References1. McCallum C, et al: Targeting Induced Local Lesions
IN Genomes (TILLING) for Plant Functional Ge-nomics. Plant Physiology 2000, 123:439–42.
2. Slade A, et al: A reverse genetic, nontransgenic ap-proach to wheat crop improvement by TILLING.Nature Biotechnology 2004, 23:75–81.
3. Shendure J, Ji H: Next-generation DNA sequencing.Nature Biotechnology 2008, 26:1135–45.
4. Harismendy O, Frazer KA: Method for improving se-quence coverage uniformity. BioTechniques46:229–31.
5. Rigola D, et al: High-Throughput Detection ofInduced Mutations and Natural Variation Us-ing KeyPointTM Technology. PLOS One 2009,4(3):e4761.
6. Koboldt DC, et al: VarScan: variant detection inmassively parallel sequencing of individual andpooled samples. Bioinformatics 2009, 25:2283–85.
7. Bansal V: A statistical method for the detectionof variants from next-generation resequencing ofDNA pools. Bioinformatics 2010, 26:i318–24.
8. Druley TE, et al: Quantification of rare allelic vari-ants from pooled genomic DNA. Nature Methods2009, 6:263–65.
9. Li Hea: Mapping short DNA sequencing readsand calling variants using mapping quality scores.Genome Research 2008, 18:1851–1858.
10. Marth G, et al: A general approach to single-nucleotide polymorphism discovery. Nature Genet-ics 1999, 23:452.
11. Chen K, et al: PolyScan: An automatic indel andSNP detection approach to the analysis of humanresequencing data. Genome Research 2007, 17:659–66.
12. Stephens M, et al: Automating sequence-based de-tection and genotyping of SNPs from diploid sam-ples. Nature Genetics 2006, 38:375–81.
13. Prabhu S, Pe’er I: Overlapping pools for high-throughput targeted resequencing. Genome Re-search 2009, 19:1254–61.
14. Till B, et al: Discovery of chemically induced muta-tions in rice by TILLING. BMC Plant Biology 2007,7:19.
15. Uauy C, et al: A modified TILLING approachto detect induced mutations in tetraploid andhexaploid wheat. BMC Plant Biology 2009, 9:1.
16. Porreca GJ, et al: Multiplex amplification of largesets of human exons. Nature Methods 2007, 4:907–9.
9

Row Pools
Co
lum
n P
oo
ls
Figure 1: There are 96 wells and 20 pools (12 column- and 8 row-pools) in our bi-dimensional pooling scheme.Thus, each individual is present in two pools.
FiguresFigure 1 - Bi-dimensional arrangement of the overlapping pools experiments
10
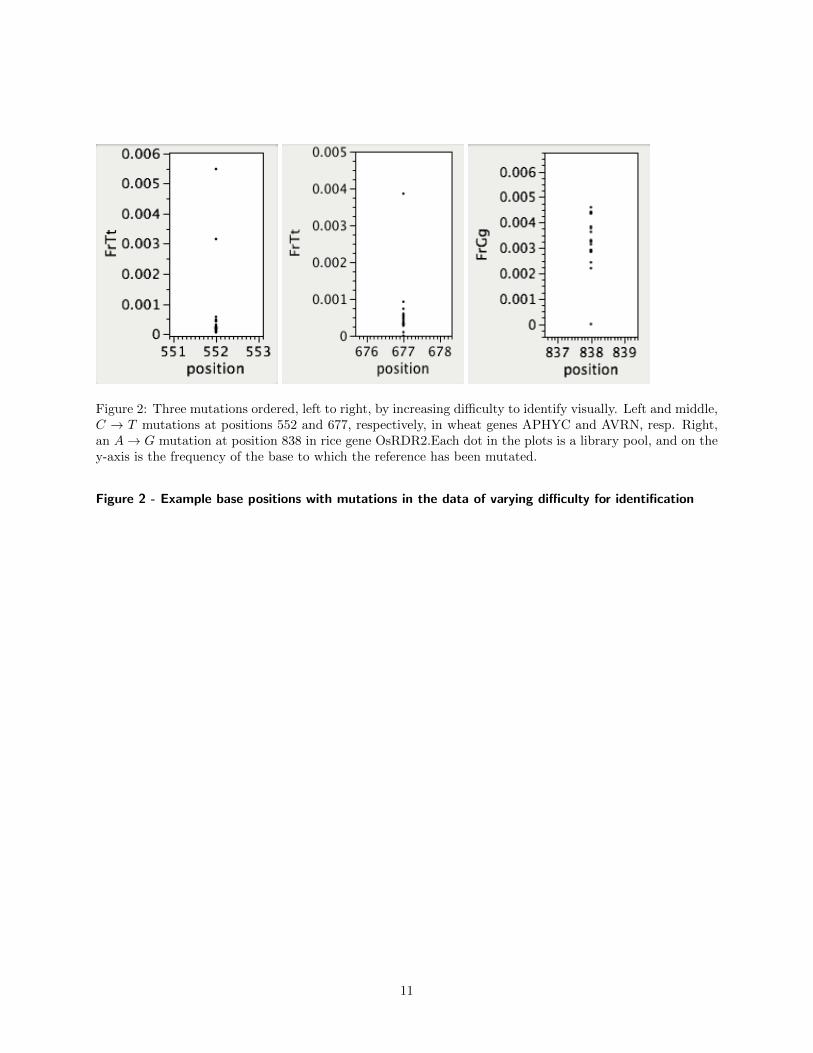
Figure 2: Three mutations ordered, left to right, by increasing difficulty to identify visually. Left and middle,C → T mutations at positions 552 and 677, respectively, in wheat genes APHYC and AVRN, resp. Right,an A→ G mutation at position 838 in rice gene OsRDR2.Each dot in the plots is a library pool, and on they-axis is the frequency of the base to which the reference has been mutated.
Figure 2 - Example base positions with mutations in the data of varying difficulty for identification
11
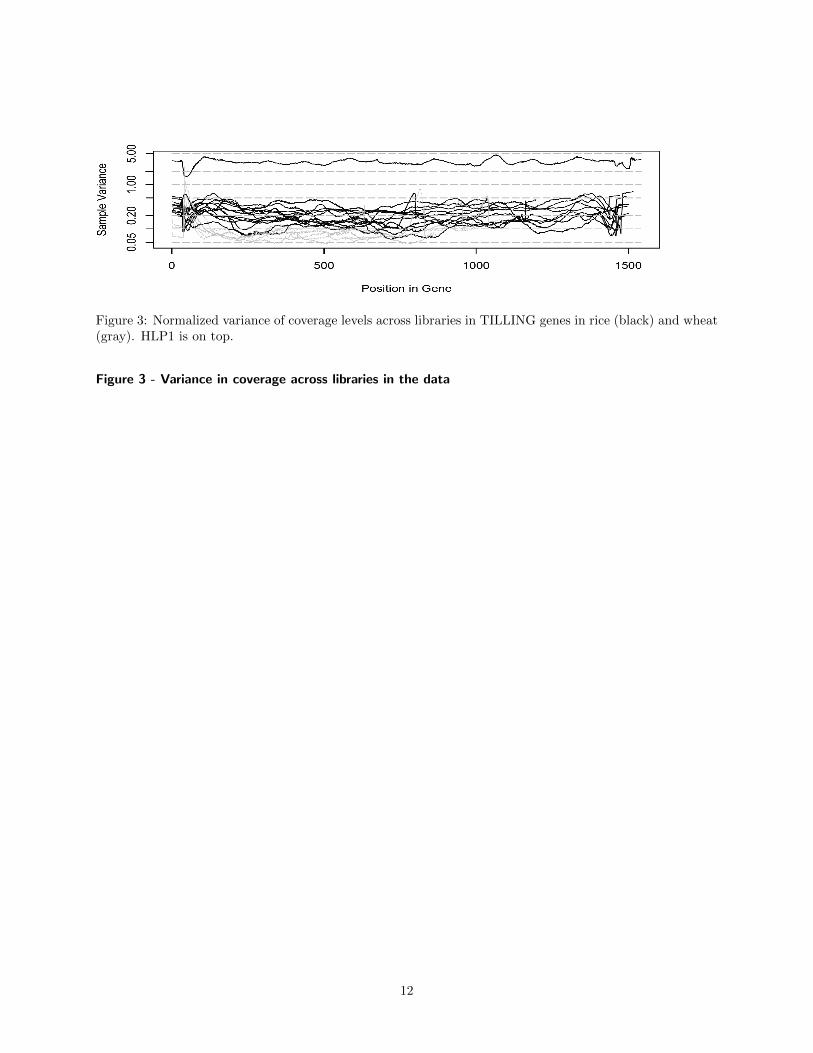
Figure 3: Normalized variance of coverage levels across libraries in TILLING genes in rice (black) and wheat(gray). HLP1 is on top.
Figure 3 - Variance in coverage across libraries in the data
12
Predictions CAMBa Outlier PoissonF (t) Confirmed z-score Confirmed pvalue Confirmed
308 0 11 3.92 11 3.77e-08 5131 1 11 4.85 10 1.58e-11 290 1.595 11 5.54 8 2.86e-13 275 2 10 5.87 8 1.23e-14 254 3 10 6.36 6 4.96e-16 146 4 9 6.78 6 2.06e-17 140 5 7 7.17 5 1.20e-18 1
Table 1: Overlap of predictions by CAMBa, Outlier method, and Poisson outlier method, with the 11confirmed mutations for Rice. We underscore the line associated with the suggested number of predic-tions. VarScan returned no mutations at any threshold. CRISP did not return any predictions with defaultparameters.
Table 1 - Performance comparison of CAMBa to other methods on the Rice data set
13

Predictions CAMBa Outlier Poisson VarScanF (t) Confirmed z threshold Confirmed pvalue Confirmed pvalue Confirmed
310 -10 37 1.83 37 1.42e-02 35 9.51e-07 19172 -5 36 2.27 36 7.18e-03 35 2.51e-09 16107 0 36 3.07 36 1.15e-03 34 5.71e-13 1292 5 33 4.93 32 4.63e-06 32 3.52e-14 1081 10 31 7.01 32 9.26e-08 29 5.04e-15 959 15 21 10.2 23 1.21e-11 22 5.90e-19 7
Table 2: Overlap of Predictions by CAMBa, Outlier method, the Poisson outlier method, and VarScanwith the 39 confirmed mutations for Tetraploid Wheat.We underscore the line associated with the suggestednumber of predictions.
Table 2 - Performance comparison of CAMBa to other methods on the Wheat data set
14

Predictions CAMBa OutlierF (t) Confirmed z-score Confirmed
252 0 11 3.47 1173 2 10 4.53 1040 5 7 6.03 724 10 6 7.58 4
Table 3: Excluding HLP1 from the rice data lowers the coverage variance across libraries and CAMBaperforms comparably.
Table 3 - Effects of lowered variance in the data on CAMBa’s performance
15

Predictions CAMBa OutlierF (t) Confirmed z-score Confirmed
104 0 34 3.86 3065 5 27 6.57 2443 10 21 9.41 1718 15 10 17.1 9
Table 4: When coverage variance is artificially increased in wheat, CAMBa has the advantage.
Table 4 - Effects of increased variance in the data on CAMBa’s performance
16