statistical inference for (python) data analysis. an introduction
TRANSCRIPT

daftCode sp. z o.o.
Statistical inference for (Python) Data Analysis.An introduction
Piotr Milanowski

daftCode sp. z o.o.
Statistical inference? Wait, why?
● Quantify a level of trust for values you obtain● Compare values● Infer validity of provided data

daftCode sp. z o.o.
Buzz phrases for this talk
● Probability ● Distribution● Random variable● Significance● Hypothesis testing● Statistic

daftCode sp. z o.o.
Part 1. Preparation.

daftCode sp. z o.o.
Building Python statistical stack
● Necessary modules:
Numpy
Scipy● Helpful modules:
Pandas
Matplotlib

daftCode sp. z o.o.
NumPy
● http://www.numpy.org● Numerical library● Optimized for speed and memory efficiency● Many useful and intuitive functionalities, and
methods (especially for multidimensional arrays)

daftCode sp. z o.o.
NumPy (Example)
Python>>> # Vector>>> v = [1, 2, 3, 4]>>> # scaling vector 2v>>> v2 = [2*i for i in v]>>> # Adding vectors v+v2>>> v3 = [v[i]+v2[i] for i in range(len(v))]>>> # Vector normalization>>> mean = sum(v)/len(v)>>> zero_mean = [(i – mean) for i in v]>>> std = sum(i**2 for i in zero_mean)/len(v)>>> normalized = [i/std for i in zero_mean]
Python + NumPy>>> import numpy as np>>> # Vector>>> v = np.array([1, 2, 3, 4])>>> # sacling vector 2v>>> v2 = 2*v>>> # Adding vectors v+v2>>> v3 = v2 + v>>> # Normalization>>> normalized = v.mean()/v.std()

daftCode sp. z o.o.
SciPy
● http://www.scipy.org● A set of scientific libraries for signal analysis
(scipy.signal), image analysis (scipy.ndimage), Fourier transform (scipy.fftpack), linear algebra (scipy.linalg), integration (scipy.integrate)…..
● Here: scipy.stats
daftCode sp. z o.o.
Pandas & Matplotlib
● http://pandas.pydata.org● Great datastructures with helpful methods
● http://matplotlib.org/● Visualization library

daftCode sp. z o.o.
Part 2. Examples

daftCode sp. z o.o.
Eaxample 1. Anomaly detection.
● Data: number of daily page entries from 3 months
● Question: should we be suspicious if for a given day we have 800, 850 and 900 entries?

daftCode sp. z o.o.
Example 1. Anomaly detection
>>> import numpy as np>>> values = np.array([…]) # Get values from >>> # somewhere>>> valuesarray([796, 756, 827, 779, 787, 731, 847, 829, 794,790, 831, 820, 822, 792, 767, 757, 777, 775, 799, 756, 849, 808, 800, 823, 798, 809, 783, 800, 848, 772, 853, 759, 745, 868, 713, 863, 819, 829, 799, 777, 785, 812, 877, 839, 783, 867, 875, 829, 818, 813, 763, 829, 812, 867, 790, 748, 822, 774, 900, 830, 781, 795, 825, 799, 795, 839, 840, 765, 781, 781, 797, 821, 852, 836, 811, 771, 800, 752, 776, 755, 798, 839, 821, 794, 846, 834, 825, 825, 830, 814, 839, 760, 786, 747, 803, 717, 801, 819, 789, 824, 835, 806, 858, 774, 848, 793, 826, 796, 798, 773, 779, 775, 779, 806, 768, 787, 788, 822, 843, 780])>>> values.max(), values.min()(900, 713)
daftCode sp. z o.o.
Example 1. Anomaly detection
● Assumption: values are drawn from Poisson distribution
● What is the probability of obtaining 800, 850, 900 for Poisson distribution fitted to this data?
● What is threshold value?● scipy.stats.poisson (and many other
distributions)

daftCode sp. z o.o.
Example 1. Anomaly detection
>>> import scipy.stats as ss>>> # Calculating distribution parameter>>> mu = values.mean()>>> # Check for 800>>> 1 – ss.poisson.cdf(800, mu) # equal to ss.poisson.sf(800, mu)0.548801>>> # Check for 900>>> 1 – ss.poisson.cdf(900, mu)0.00042>>> # Check for 850>>> 1 – ss.poisson.cdf(850, mu)0.05205
>>> # Threshold for magical 5%>>> ss.poisson.ppf(0.95, mu)851
● 3 lines of code (read data, calculate distribution parameter, calculate threshold), and the detector is ready!

daftCode sp. z o.o.
Example 2. Confidence intervals
● What is the mean number of entries?● What is the 95% confidence interval for
calculated mean?
>>> # CI simulation>>> def ci(v, no_reps):... for i in range(no_reps):... idx = np.random.randint(0, len(v), size=len(v))... yield v[idx].mean()>>> # Get simulated means>>> gen = ci(values, 10000)>>> sim_means = np.fromiter(gen, 'float')>>> # 95% Confidence interval>>> (ci_low, ci_high) = np.percentile(sim_means, [2.5, 97.5])>>> print(ci_low, ci_high)797.942 810.350
daftCode sp. z o.o.
Example 3. Comparing distributions
● Data: two sets of time spent on time – one set for fraud data (F), and second for non-fraud data (C)
● Question: is there a (significant) difference in those two distributions?
daftCode sp. z o.o.
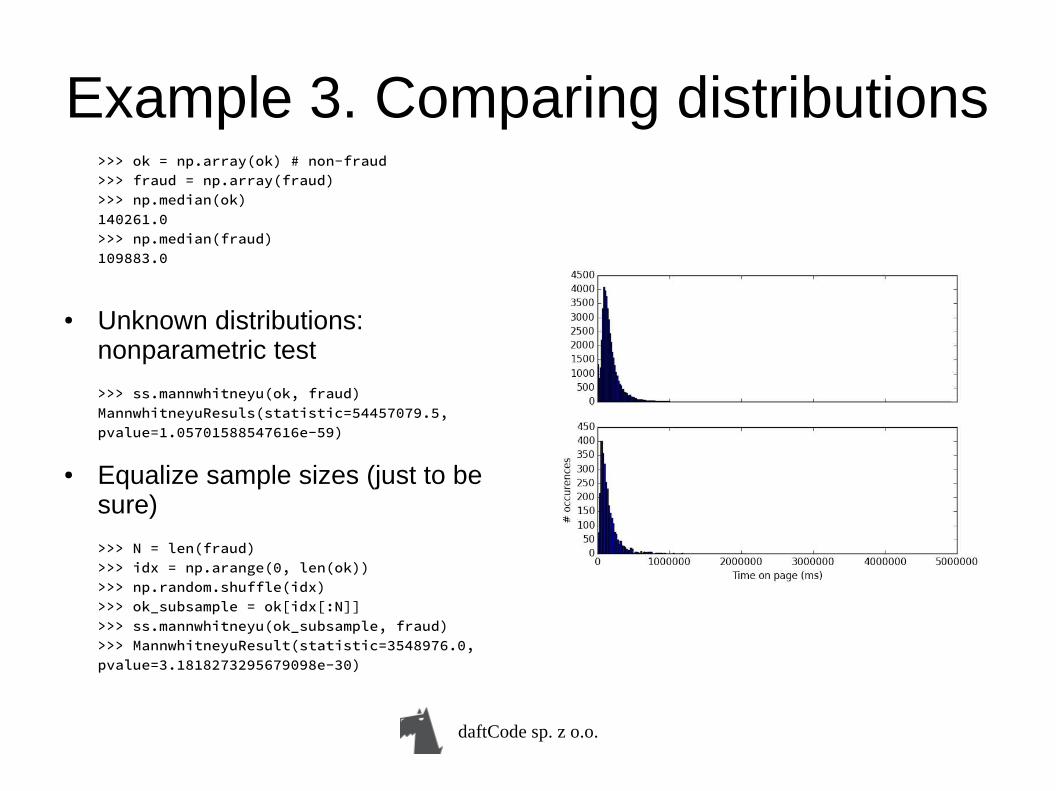
Example 3. Comparing distributions>>> ok = np.array(ok) # non-fraud>>> fraud = np.array(fraud)>>> np.median(ok)140261.0>>> np.median(fraud)109883.0
● Unknown distributions: nonparametric test
>>> ss.mannwhitneyu(ok, fraud)MannwhitneyuResuls(statistic=54457079.5,pvalue=1.05701588547616e-59)
● Equalize sample sizes (just to be sure)
>>> N = len(fraud)>>> idx = np.arange(0, len(ok))>>> np.random.shuffle(idx)>>> ok_subsample = ok[idx[:N]]>>> ss.mannwhitneyu(ok_subsample, fraud)>>> MannwhitneyuResult(statistic=3548976.0, pvalue=3.1818273295679098e-30)

daftCode sp. z o.o.
Example 4. Bootstrap
● The same data and question as previous● Test without any build-in tests● Hypothesis 0: both datasets are drawn from the
same distribution● Mix them together, draw two new datasets (with
replacement), calculate statistic (difference in median)
● Probability of obtaining statistic larger or equal to the initial one (from original data)

daftCode sp. z o.o.
Example 4. Bootstrap
>>> # generate statistics>>> def generate_statistics(vec1, vec2, no_reps=10000):... all_ = np.r_[vec1, vec2]... N, M = len(vec1), len(vec2)... for i in range(no_reps):... random_indices = np.random.randint(0, M+N, size=M+N)... tmp1 = all_[random_indices[:M]]... tmp2 = all_[random_indices[M:]]... yield np.abs(np.median(tmp1) – np.median(tmp2))
>>> # Initial statistic>>> stat_0 = np.abs(np.median(ok) – np.median(fraud))>>> gen = generate_statistics(ok, fraud)>>> stats = np.fromiter(gen, 'float')>>> # Get the probability of obtaining statistic larger then initial>>> np.sum(stats >= stat_0)/len(stats)0.0
daftCode sp. z o.o.
Example 5. Naive Bayes
● Can we classify fraud based on time spent on a page?
● Using Naive Bayes:P(F|t) ~ P(t|F)P(F)
P(C|t) ~ P(t|C)P(C)● P(t|F), P(t|C) are sample distributions
P(C), P(F)
daftCode sp. z o.o.
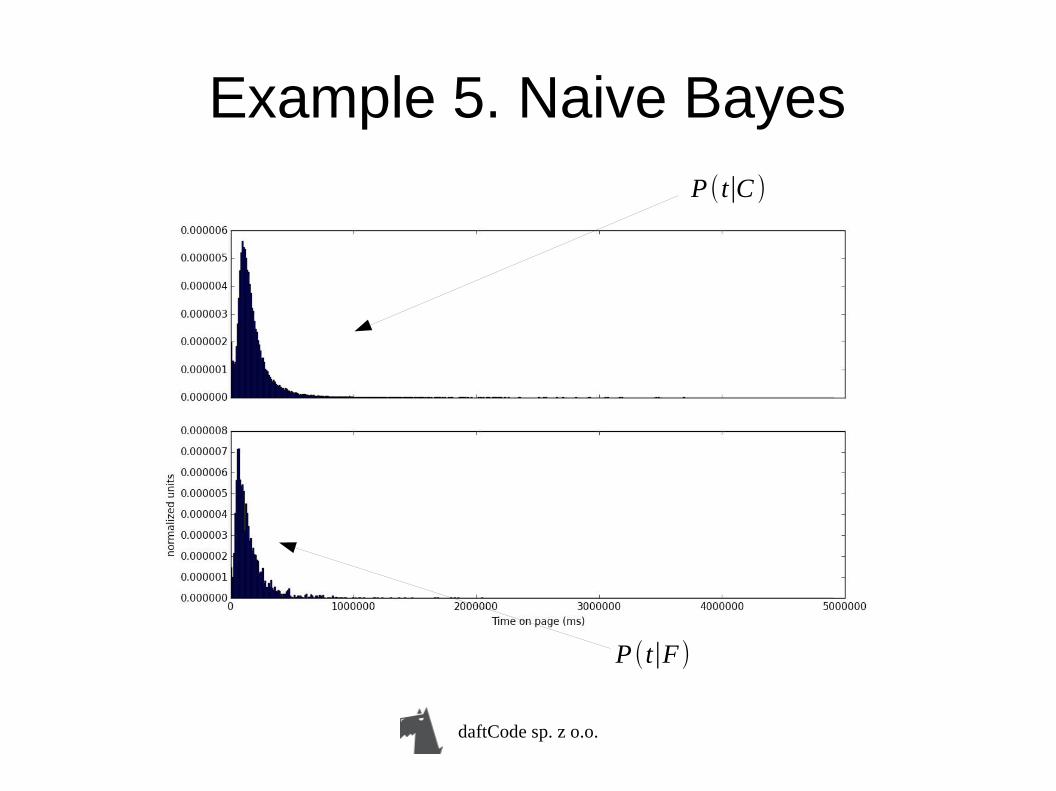
Example 5. Naive BayesP (t∣C )
P (t∣F )
daftCode sp. z o.o.
Example 5. Naive Bayes
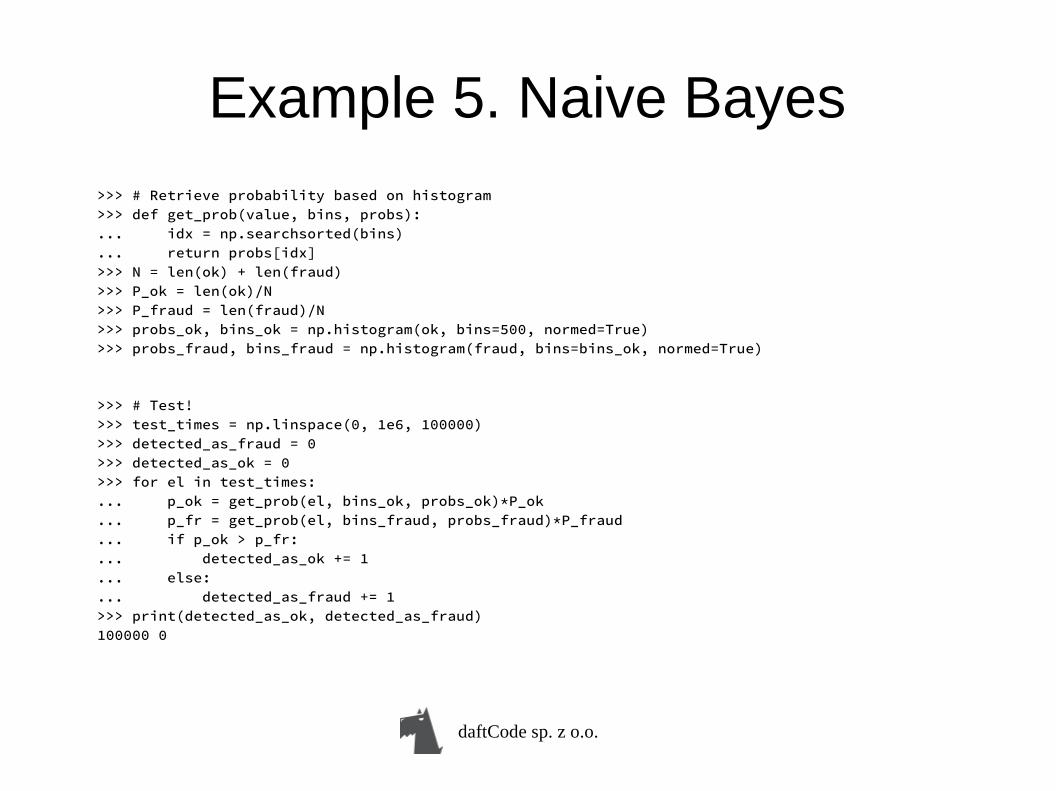
>>> # Retrieve probability based on histogram>>> def get_prob(value, bins, probs):... idx = np.searchsorted(bins)... return probs[idx]>>> N = len(ok) + len(fraud)>>> P_ok = len(ok)/N>>> P_fraud = len(fraud)/N>>> probs_ok, bins_ok = np.histogram(ok, bins=500, normed=True)>>> probs_fraud, bins_fraud = np.histogram(fraud, bins=bins_ok, normed=True)
>>> # Test!>>> test_times = np.linspace(0, 1e6, 100000)>>> detected_as_fraud = 0>>> detected_as_ok = 0>>> for el in test_times:... p_ok = get_prob(el, bins_ok, probs_ok)*P_ok... p_fr = get_prob(el, bins_fraud, probs_fraud)*P_fraud... if p_ok > p_fr:... detected_as_ok += 1... else:... detected_as_fraud += 1>>> print(detected_as_ok, detected_as_fraud)100000 0
daftCode sp. z o.o.
Example 5. Naive Bayes
● NB doesn't seem to work that well in this example
● Better results by just putting a threshold● But still, several lines of code and classifier
ready!

daftCode sp. z o.o.
Almost at the end. Just one more slide… and it's a summary!

daftCode sp. z o.o.
Summary
● Statistical inference is used to compare and validate values
● It gives some quantification, but there still is a room for subjective decisions (p-values, priors)
● It is quite easy to do statistics in Python when you have proper tools