statistical history fact book 2015/2016 -...
TRANSCRIPT

Valencia College Institutional Research
Post Office Box 3028 Orlando, FL 32802-3028
407 299 5000 valenciacollege.edu
Statistical History
Fact Book 2015/2016
January 2017 Updated April 2017

Table of Contents
Valencia College Statistical History Fact Book Institutional Research 2015/2016 1.1
SECTION ONE – Table of Contents Table of Contents .................................................................................................................................................. 1.1 SECTION TWO – Overview Student Profile Credit Student Profile ........................................................................................................................................... 2.1 Postsecondary Adult Vocational (PSAV) Student Profile ...................................................................................... 2.2 Continuing Workforce Education (CWE) Student Profile ....................................................................................... 2.3 SECTION THREE – Service Area Population by County and Municipality ................................................................................................................ 3.1 Population Change by Decade .............................................................................................................................. 3.2 Population Projections Florida and Orlando Metropolitan Counties ................................................................... 3.3 Population by Race and Hispanic Origin Orlando Metropolitan Counties 2010 Census ....................................... 3.4 SECTION FOUR – Enrollment Statistics By Headcount Enrollment Credit, EPI, PSAV, CWE, and Continuing Education (Report Year) ..................................................... 4.1 Comparative Credit Enrollment History (Fall Term) .............................................................................................. 4.2 Unduplicated Credit Enrollment (Report Year) ...................................................................................................... 4.3 Unduplicated Postsecondary Adult Vocational (PSAV) Enrollment (Report Year) ................................................. 4.3 Unduplicated Continuing Workforce Education (CWE) Enrollment (Report Year) ............................................... 4.3 Enrollment Status by FT/PT Status & Average Credit Hours Taken (Fall Term) .................................................... 4.4 Credit Enrollment by Program Area (Fall Term) .................................................................................................... 4.5 Credit Enrollment by Miscellaneous Category (Fall Term) .................................................................................... 4.5 Credit Headcount by Term Reporting Year 2013/2014 ........................................................................................ 4.6 By Geographic Location Credit Student Distribution by County (Fall Term) ................................................................................................ 4.7 By High School Orange & Osceola County High School Graduates 2014 Market Share (Fall Term)............................................... 4.8 Dual Enrollment Comparisons Dual Enrollment Comparisons (by Term) ................................................................................................ 4.9 Dual Enrollment Comparisons (by Report Year) .................................................................................... 4.13 International Student Enrollment (Fall Term) Collegewide ............................................................................................................................................ 4.17 West Campus ……………………………………………………………………………………………………………………………………. 4.24 East Campus ........................................................................................................................................... 4.30 Winter Park Campus ................................................................................................................................ 4.35 Osceola Campus...................................................................................................................................... 4.36 Lake Nona Campus ................................................................................................................................. 4.38 By FTE FTE by Instructional Category & Term (Collegewide) ........................................................................................... 4.39 FTE by Instructional Category & Term (West Campus) .......................................................................................... 4.40 FTE by Instructional Category & Term (East Campus) ........................................................................................... 4.41 FTE by Instructional Category & Term (Osceola Campus) ..................................................................................... 4.42
FTE by Instructional Category & Term (Winter Park Campus) .............................................................................. 4.43 FTE by Instructional Category & Term (Lake Nona Campus) …………………………………………………………………………….. 4.44 FTE by Instructional Category & Term (Poinciana Campus) ………………………………………………………………………….…… 4.45 FTE by Instructional Category & Term (Public Safety Campus) .…………………………………………………………………….….. 4.46
SECTION FIVE – Completion and Placement Completers by Degree and Certificate Programs (Report Year) ........................................................................... 5.1 Completer Placement Rates (Report Year) ........................................................................................................... 5.5

Table of Contents
Valencia College Statistical History Fact Book Institutional Research 2015/2016 1.2
SECTION SIX – Personnel Full-Time & Part-Time Personnel Comparison (October 1, 2012, 2013, 2014) ..................................................... 6.1 SECTION SEVEN – Financial Resources Valencia Operating Budget Comparison (Fiscal Year) ........................................................................................... 7.1 Valencia Grant Revenues (Fiscal Year) .................................................................................................................. 7.2 Valencia Current Fund Expenditures (Fiscal Year) ................................................................................................ 7.4 Comparison of Financial Aid Types (Federal Report Year) .................................................................................... 7.5 SECTION EIGHT – Appendices Credit Enrollment Statistics Summer Term Collegewide by Headcounts, Gender, and Ethnicity ................................................................................ 8.1 West Campus by Headcounts, Gender, and Ethnicity ............................................................................. 8.2 East Campus by Headcounts, Gender, and Ethnicity ............................................................................... 8.3 Osceola Campus by Headcounts, Gender, and Ethnicity ......................................................................... 8.4 Winter Park Campus by Headcounts, Gender, and Ethnicity .................................................................. 8.5 Lake Nona Campus by Headcounts, Gender, and Ethnicity ..................................................................... 8.6 Fall Term Collegewide by Headcounts, Gender, and Ethnicity ................................................................................ 8.7 West Campus by Headcounts, Gender, and Ethnicity ............................................................................. 8.8 East Campus by Headcounts, Gender, and Ethnicity ............................................................................... 8.9 Osceola Campus by Headcounts, Gender, and Ethnicity ......................................................................... 8.10 Winter Park Campus by Headcounts, Gender, and Ethnicity .................................................................. 8.11 Lake Nona Campus by Headcounts, Gender, and Ethnicity ..................................................................... 8.12 Spring Term Collegewide by Headcounts, Gender, and Ethnicity ................................................................................ 8.13 West Campus by Headcounts, Gender, and Ethnicity ............................................................................. 8.14 East Campus by Headcounts, Gender, and Ethnicity .............................................................................. 8.15 Osceola Campus by Headcounts, Gender, and Ethnicity ........................................................................ 8.16 Winter Park Campus by Headcounts, Gender, and Ethnicity .................................................................. 8.17 Lake Nona Campus by Headcounts, Gender, and Ethnicity ..................................................................... 8.18 Glossary .................................................................................................................................................................. 8.19
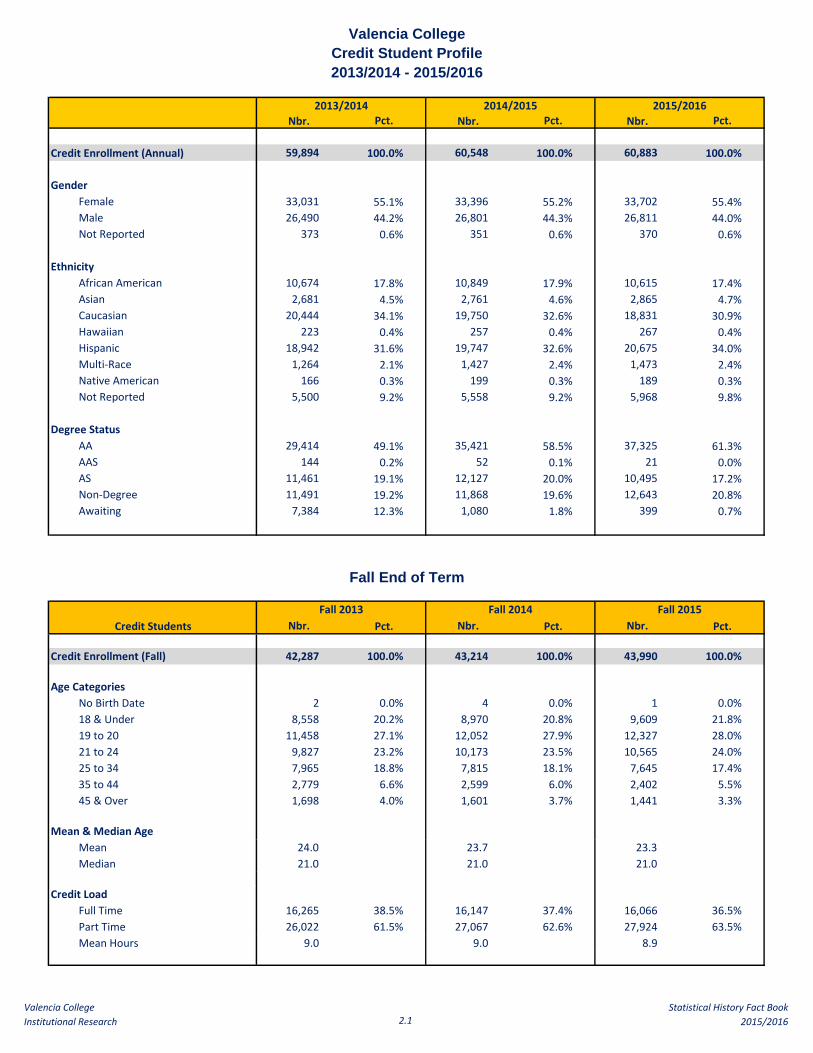
Nbr. Pct. Nbr. Pct. Nbr. Pct.
Credit Enrollment (Annual) 59,894 100.0% 60,548 100.0% 60,883 100.0%
Gender 59,894 60,548
Female 33,031 55.1% 33,396 55.2% 33,702 55.4%
Male 26,490 44.2% 26,801 44.3% 26,811 44.0%
Not Reported 373 0.6% 351 0.6% 370 0.6%
Ethnicity
African American 10,674 17.8% 10,849 17.9% 10,615 17.4%
Asian 2,681 4.5% 2,761 4.6% 2,865 4.7%
Caucasian 20,444 34.1% 19,750 32.6% 18,831 30.9%
Hawaiian 223 0.4% 257 0.4% 267 0.4%
Hispanic 18,942 31.6% 19,747 32.6% 20,675 34.0%
Multi-Race 1,264 2.1% 1,427 2.4% 1,473 2.4%
Native American 166 0.3% 199 0.3% 189 0.3%
Not Reported 5,500 9.2% 5,558 9.2% 5,968 9.8%
Degree Status
AA 29,414 49.1% 35,421 58.5% 37,325 61.3%
AAS 144 0.2% 52 0.1% 21 0.0%
AS 11,461 19.1% 12,127 20.0% 10,495 17.2%
Non-Degree 11,491 19.2% 11,868 19.6% 12,643 20.8%
Awaiting 7,384 12.3% 1,080 1.8% 399 0.7%
Nbr. Pct. Nbr. Pct. Nbr. Pct.
Credit Enrollment (Fall) 42,287 100.0% 43,214 100.0% 43,990 100.0%
Age Categories 0.0% 43,214 98.2% 43,990 100.0%
No Birth Date 2 0.0% 4 0.0% 1 0.0%
18 & Under 8,558 20.2% 8,970 20.8% 9,609 21.8%
19 to 20 11,458 27.1% 12,052 27.9% 12,327 28.0%
21 to 24 9,827 23.2% 10,173 23.5% 10,565 24.0%
25 to 34 7,965 18.8% 7,815 18.1% 7,645 17.4%
35 to 44 2,779 6.6% 2,599 6.0% 2,402 5.5%
45 & Over 1,698 4.0% 1,601 3.7% 1,441 3.3%
Mean & Median Age
Mean 24.0 23.7 23.3
Median 21.0 21.0 21.0
Credit Load 42,287 97.9% 43,214 98.2% 43,990 100.0%
Full Time 16,265 38.5% 16,147 37.4% 16,066 36.5%
Part Time 26,022 61.5% 27,067 62.6% 27,924 63.5%
Mean Hours 9.0 9.0 8.9
Valencia College
Credit Student Profile
2013/2014 - 2015/2016
Credit Students
2013/2014 2014/2015 2015/2016
Fall 2015Fall 2013 Fall 2014
Fall End of Term
Valencia College
Institutional Research 2.1Statistical History Fact Book
2015/2016
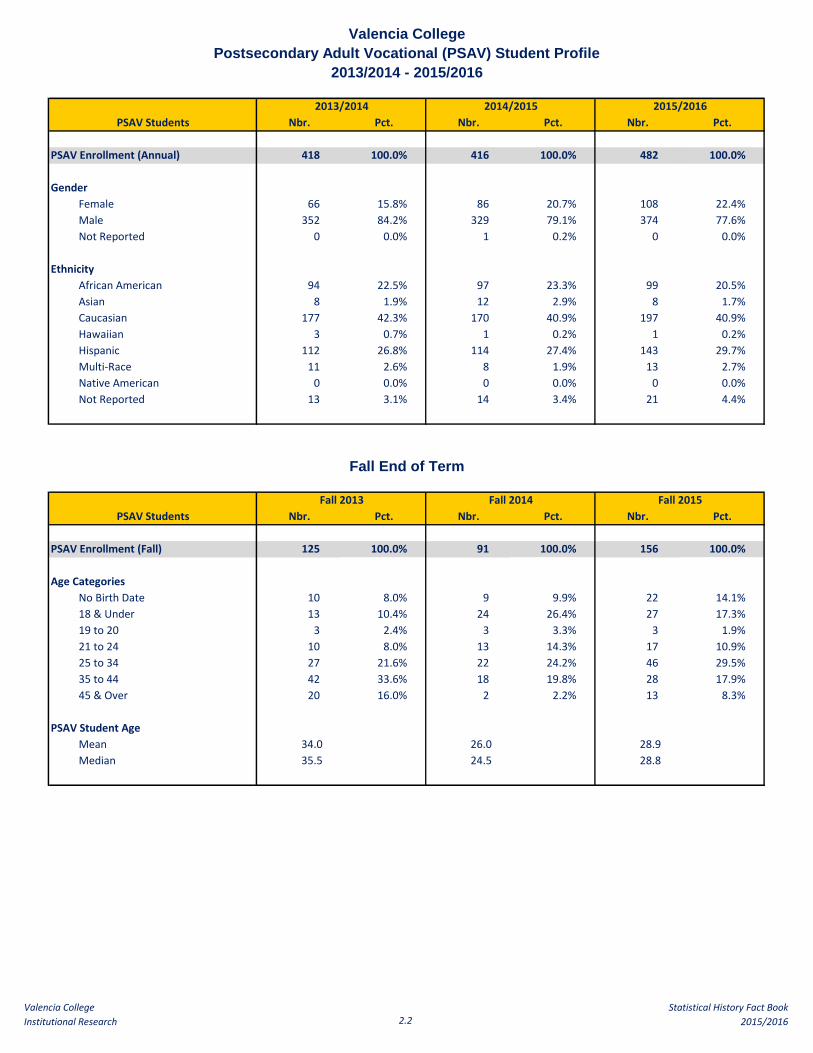
Valencia College
Postsecondary Adult Vocational (PSAV) Student Profile
2013/2014 - 2015/2016
Nbr. Pct. Nbr. Pct. Nbr. Pct.
PSAV Enrollment (Annual) 418 100.0% 416 100.0% 482 100.0%
Gender 418 100.0% 416 100.0%
Female 66 15.8% 86 20.7% 108 22.4%
Male 352 84.2% 329 79.1% 374 77.6%
Not Reported 0 0.0% 1 0.2% 0 0.0%
0.0% 0.0%
African American 94 22.5% 97 23.3% 99 20.5%
Asian 8 1.9% 12 2.9% 8 1.7%
Caucasian 177 42.3% 170 40.9% 197 40.9%
Hawaiian 3 0.7% 1 0.2% 1 0.2%
Hispanic 112 26.8% 114 27.4% 143 29.7%
Multi-Race 11 2.6% 8 1.9% 13 2.7%
Native American 0 0.0% 0 0.0% 0 0.0%
Not Reported 13 3.1% 14 3.4% 21 4.4%
Fall End of Term
Nbr. Pct. Nbr. Pct. Nbr. Pct.
PSAV Enrollment (Fall) 125 100.0% 91 100.0% 156 100.0%
Age Categories 125 100.0% 91 100.0%
No Birth Date 10 8.0% 9 9.9% 22 14.1%
18 & Under 13 10.4% 24 26.4% 27 17.3%
19 to 20 3 2.4% 3 3.3% 3 1.9%
21 to 24 10 8.0% 13 14.3% 17 10.9%
25 to 34 27 21.6% 22 24.2% 46 29.5%
35 to 44 42 33.6% 18 19.8% 28 17.9%
45 & Over 20 16.0% 2 2.2% 13 8.3%
PSAV Student Age
Mean 34.0 26.0 28.9
Median 35.5 24.5 28.8
PSAV Students
2013/2014 2014/2015 2015/2016
PSAV Students
Ethnicity
Fall 2013 Fall 2014 Fall 2015
Valencia College
Institutional Research 2.2Statistical History Fact Book
2015/2016

Valencia College
Continuing Workforce Education (CWE) Student Profile
2013/2014 - 2015/2016
Nbr. Pct. Nbr. Pct. Nbr. Pct.
CWE Enrollment (Annual) 3,859 100.0% 4,248 100.0% 3,967 100.0%
Gender
Female 2,023 52.4% 2,114 49.8% 1,747 44.0%
Male 1,751 45.4% 1,901 44.8% 1,581 39.9%
Not Reported 85 2.2% 233 5.5% 639 16.1%
Ethnicity
African American 238 6.2% 210 4.9% 174 4.4%
Asian 104 2.7% 114 2.7% 87 2.2%
Caucasian 852 22.1% 955 22.5% 695 17.5%
Hawaiian 4 0.1% 8 0.2% 5 0.1%
Hispanic 1,067 27.6% 1,145 27.0% 943 23.8%
Multi-Race 27 0.7% 30 0.7% 33 0.8%
Native American 0 0.0% 0 0.0% 0 0.0%
Not Reported 1,567 40.6% 1,786 42.0% 2,030 51.2%
Note: Only includes CWE reported for State Funding (Support)
Fall End of Term
Nbr. Pct. Nbr. Pct. Nbr. Pct.
CWE Enrollment (Fall) 2,185 100.0% 2,159 100.0% 2,228 100.0%
Age Categories
No Birth Date 977 44.7% 864 40.0% 1,097 49.2%
18 & Under 124 5.7% 174 8.1% 159 7.1%
19 to 20 13 0.6% 21 1.0% 17 0.8%
21 to 24 75 3.4% 79 3.7% 89 4.0%
25 to 34 264 12.1% 299 13.8% 286 12.8%
35 to 44 288 13.2% 291 13.5% 262 11.8%
45 & Over 444 20.3% 431 20.0% 318 14.3%
Student Age
Mean 38.3 36.6 35.1
Median 37.4 36.2 34.3
Note: Only includes CWE reported for State Funding (Support)
CWE Students
2013/2014 2014/2015 2015/2016
CWE Students
Fall 2013 Fall 2014 Fall 2015
Valencia College
Institutional Research 2.3Statistical History Fact Book
2015/2016

Valencia College
Population by County and Municipality
Orlando Metropolitan Counties
2016 Estimate vs 2010 Census
2016 2010 Number Percent
Estimate Census Data Change Change
Orange County 1,280,387 1,145,956 134,431 11.7%
Apopka 47,826 41,542 6,284 15.1%
Bay Lake 15 47 -32 -68.1%
Belle Isle 6,541 5,988 553 9.2%
Eatonville 2,251 2,159 92 4.3%
Edgewood 2,642 2,503 139 5.6%
Lake Buena Vista 22 10 12 120.0%
Maitland 17,598 15,751 1,847 11.7%
Oakland 2,635 2,538 97 3.8%
Ocoee 41,881 35,579 6,302 17.7%
Orlando 271,752 238,300 33,452 14.0%
Windermere 2,889 2,462 427 17.3%
Winter Garden 41,606 34,568 7,038 20.4%
Winter Park 29,308 27,852 1,456 5.2%
UNINCORPORATED 813,421 736,657 76,764 10.4%
Osceola County 322,862 268,685 54,177 20.2%
Kissimmee 68,401 59,682 8,719 14.6%
St. Cloud 42,998 35,183 7,815 22.2%
UNINCORPORATED 211,463 173,820 37,643 21.7%
Seminole County 449,124 422,718 26,406 6.2%
Altamonte Springs 43,905 41,496 2,409 5.8%
Casselberry 27,786 26,241 1,545 5.9%
Lake Mary 16,119 13,822 2,297 16.6%
Longwood 14,897 13,657 1,240 9.1%
Oviedo 37,128 33,342 3,786 11.4%
Sanford 57,248 53,570 3,678 6.9%
Winter Springs 36,156 33,282 2,874 8.6%
UNINCORPORATED 215,885 207,308 8,577 4.1%
Source: Florida Population Estimates for Counties and Municipalities April 1, 2016
Location
Valencia College
Institutional Research 3.1Statistical History Fact Book
2015/2016

Valencia College
Population Change by Decade
Orlando Metropolitan Statistical Area
1990 through 2015
Census Population Percent Change
Location 2015 (Estimate) 2010 2000 1990 2010 to 2014 2000 to 2010 1990 to 2000
Total Florida Population 19,815,183 18,801,332 15,982,824 12,938,071 5.4% 17.6% 23.5%
Total Florida MSA Population 19,106,299 18,094,334 15,337,308 12,400,158 5.6% 18.0% 23.7%
Total Orlando MSA Population 2,320,195 2,134,406 1,644,563 1,224,844 8.7% 29.8% 34.3%
Lake County 316,569 297,047 210,527 152,104 6.6% 41.1% 38.4%
Orange County 1,252,396 1,145,956 896,344 677,491 9.3% 27.8% 32.3%
Osceola County 308,327 268,685 172,493 107,728 14.8% 55.8% 60.1%
Seminole County 442,903 422,718 365,199 287,521 4.8% 15.8% 27.0%
Note: MSAs are based on the December 2009 U.S. Office of Management and Budget MSA definitions (OMB Bulletin No. 10.02)
Data for 1990, 2000, and 2010 include census corrections
Source: Population and Population Change for Metropolitan Statistical Areas in Florida 2015
Valencia College
Institutional Research 3.2Statistical History Fact Book
2015/2016

Valencia College
Population Projections
Florida and Orlando Metropolitan Counties
2015 - 2045
2015
Estimate
FLORIDA 19,815,183
Medium 21,372,207 7.9% 22,799,508 15.1% 24,070,978 21.5% 25,212,399 27.2% 26,252,141 32.5% 27,217,568 37.4%
LAKE 316,569
Medium 356,276 12.5% 393,989 24.5% 428,800 35.5% 461,988 45.9% 493,323 55.8% 520,090 64.3%
ORANGE 1,252,396
Medium 1,407,607 12.4% 1,551,402 23.9% 1,679,737 34.1% 1,799,137 43.7% 1,908,027 52.4% 2,003,994 60.0%
OSCEOLA 308,327
Medium 368,239 19.4% 427,923 38.8% 481,649 56.2% 525,714 70.5% 566,321 83.7% 605,783 96.5%
SEMINOLE 442,903
Medium 474,464 7.1% 502,117 13.4% 525,372 18.6% 545,764 23.2% 563,920 27.3% 580,610 31.1%
Source : FL Demographic Estimating Conference, Feb 2015 and the University of FL, BEBR, FL Population Studies, Vol. 49, Bulleting 174, January 2016; Projections of FL Population by County,
2020-2045, with Estimates for 2015
Projections Projections
2020 2025 2030 2035 2040 2045
Projections Projections Projections Projections
Valencia College
Institutional Research 3.3Statistical History Fact Book
2015/2016

Valencia College
Population by Race and Hispanic Origin
Orlando Metropolitan Counties
2010 Census
Asian Black Hispanic White Other
Total Florida Population 18,801,310 2.4% 15.2% 22.5% 57.9% 2.1%
Lake County 297,052 1.7% 9.4% 12.1% 74.5% 2.3%
Orange County 1,145,956 4.8% 19.5% 26.9% 46.0% 2.8%
Osceola County 268,685 2.6% 9.1% 45.5% 40.3% 2.5%
Seminole County 422,718 3.7% 10.5% 17.1% 66.3% 2.4%
Source: "Florida Population: Census Summary 2010," page 41 & 42 BEBR (Bureau of Economic and Business Research)
University of Florida, April 2011
2010 Census Population
Valencia College
Institutional Research 3.4Statistical History Fact Book
2015/2016

Valencia CollegeInstitutional Research 4.1
Statistical History Fact Book2015/2016
Year Nbr. % Change Nbr. % Change Nbr. % Change Nbr. % Change Nbr. % Change Nbr. % Change
2015/2016 60,883 1% 200 -4% 482 16% 3,967 -7% 7,586 19% 73,118 1.8%2014/2015 60,548 1.1% 208 -8.8% 416 -0.5% 4,248 10.1% 6,384 6.6% 71,804 2.0%2013/2014 59,894 -0.1% 228 -6.6% 418 86.6% 3,859 7.4% 5,991 -5.1% 70,390 0.1%2012/2013 59,958 -1.3% 244 10.4% 224 -10.0% 3,592 -2.2% 6,312 6.7% 70,330 -0.7%2011/2012 60,770 3.0% 221 -3.1% 249 -15.6% 3,672 -38.9% 5,913 7.6% 70,825 -0.3%2010/2011 59,014 6.7% 228 -24.0% 295 10.5% 6,006 -11.0% 5,494 3.9% 71,037 4.6%2009/2010 55,302 10.0% 300 2.0% 267 -33.9% 6,749 -6.9% 5,287 10.7% 67,905 7.8%2008/2009 50,255 8.8% 294 45.5% 404 -6.9% 7,249 -4.1% 4,774 -22.1% 62,976 4.1%2007/2008 46,180 7.6% 202 77.2% 434 -13.4% 7,555 -4.2% 6,129 10.7% 60,500 6.2%
2006/2007 42,913 2.6% 114 NA 501 -1.4% 7,887 4.3% 5,535 41.3% 56,950 5.8%2005/2006 41,820 -0.5% 508 61.3% 7,562 3.7% 3,916 NA 53,806 8.4%2004/2005 42,039 -1.9% 315 -18.2% 7,294 -33.2% 49,648 -8.3%2003/2004 42,847 -0.7% 385 5.8% 10,924 -3.1% 54,156 -1.1%2002/2003 43,128 -0.7% 364 -2.7% 11,277 5.6% 54,769 0.5%2001/2002 43,440 7.5% 374 1.9% 10,674 -2.0% 54,488 5.5%2000/2001 40,397 3.0% 367 9.9% 10,889 -0.5% 51,653 2.2%1999/2000 39,234 6.1% 334 17.2% 10,949 -5.6% 50,517 3.3%1998/1999 36,995 0.5% 285 24.5% 11,601 1.3% 48,881 0.8%1997/1998 36,817 -0.1% 229 NA 11,457 5.7% 48,503 1.7%
1996/1997 36,843 1.0% 10,844 1.1% 47,687 1.0%1995/1996 36,486 3.0% 10,726 30.2% 47,212 8.1%1994/1995 35,416 0.3% 8,240 7.4% 43,656 1.6%1993/1994 35,307 -1.5% 7,670 -17.6% 42,977 -4.8%1992/1993 35,841 5.9% 9,308 -40.1% 45,149 -8.6%1991/1992 33,842 9.9% 15,549 -28.3% 49,391 -5.9%1990/1991 30,800 12.8% 21,692 -23.9% 52,492 -6.0%1989/1990 27,297 9.7% 28,519 8.5% 55,816 9.1%1988/1989 24,872 9.4% 26,276 -17.3% 51,148 -6.2%1987/1988 22,739 9.1% 31,776 -7.0% 54,515 -0.9%
1986/1987 20,836 6.4% 34,175 15.7% 55,011 12.0%1985/1986 19,575 11.0% 29,536 37.1% 49,111 25.3%1984/1985 17,631 -0.8% 21,550 -15.6% 39,181 -9.5%1983/1984 17,780 5.1% 25,532 8.8% 43,312 7.3%1982/1983 16,915 -1.6% 23,457 17.4% 40,372 8.6%1981/1982 17,194 7.6% 19,988 -2.9% 37,182 1.7%1980/1981 15,976 9.1% 20,582 17.0% 36,558 13.4%1979/1980 14,646 0.7% 17,590 41.1% 32,236 19.3%1978/1979 14,545 16.2% 12,468 4.2% 27,013 10.3%1977/1978 12,519 5.9% 11,964 NA 24,483 107.0%
1976/1977 11,825 23.3% 11,825 23.3%1975/1976 9,593 -14.5% 9,593 -14.5%1974/1975 11,221 27.9% 11,221 27.9%1973/1974 8,774 10.8% 8,774 10.8%1972/1973 7,918 37.6% 7,918 37.6%1971/1972 5,754 10.5% 5,754 10.5%1970/1971 5,206 32.3% 5,206 32.3%1969/1970 3,935 25.9% 3,935 25.9%1968/1969 3,125 451.1% 3,125 451.1%1967/1968 567 NA 567 NA
Note:
Source:
1. Totals are duplicated across instructional categories (student could be in more than one category)
1. Banner STU4 & Student Data Base 2. Prior to 1997/1998, PSAV was included in CWE; CWE only includes data reported for state funding (support)
2. Continuing Education provided its own data for open enrollment courses
Valencia CollegeAnnual Enrollment
Credit, Educator Preparation Institute, Postsecondary Adult Vocational,Continuing Workforce Education, and Continuing Education
Reporting Year 1967/1968 - 2015/2016*Total StudentsCredit EPI PSAV CWE (CJI & VE) Continuing Education

Valencia CollegeInstitutional Research 4.2
Statistical History Fact Book2015/2016
Valencia CollegeComparative Credit Enrollment History
Fall End of Term1979/1980 - 2015/2016
Year Nbr. % Change Nbr. % Change Nbr. % Change
2015/2016 16,066 -0.5% 27,924 3.2% 43,990 1.8%2014/2015 16,147 -0.7% 27,067 4.0% 43,214 2.2% 2013/2014 16,265 -3.5% 26,022 1.2% 42,287 -0.7% 2012/2013 16,861 -4.6% 25,710 2.7% 42,571 -0.3% 2011/2012 17,676 -0.3% 25,036 6.0% 42,712 3.3% 2010/2011 17,723 2.1% 23,617 10.2% 41,340 6.6% 2009/2010 17,352 11.0% 21,428 8.2% 38,780 9.4%
2008/2009 15,632 11.3% 19,801 6.5% 35,433 8.5% 2007/2008 14,048 13.4% 18,600 5.4% 32,648 8.7% 2006/2007 12,387 5.9% 17,650 0.0% 30,037 2.4% 2005/2006 11,696 -1.7% 17,646 0.0% 29,342 -0.7% 2004/2005 11,900 8.5% 17,653 -3.5% 29,553 1.0% 2003/2004 10,966 -0.9% 18,289 -0.5% 29,255 -0.7% 2002/2003 11,063 4.7% 18,384 -0.8% 29,447 1.2% 2001/2002 10,568 7.5% 18,540 4.0% 29,108 5.2% 2000/2001 9,832 7.4% 17,832 2.5% 27,664 4.2% 1999/2000 9,158 7.1% 17,399 4.4% 26,557 5.3%
1998/1999 8,551 1.2% 16,662 2.4% 25,213 2.0% 1997/1998 8,452 0.2% 16,265 0.4% 24,717 0.3% 1996/1997 8,438 7.4% 16,198 -0.4% 24,636 2.1% 1995/1996 7,858 4.8% 16,263 1.2% 24,121 2.4% 1994/1995 7,495 5.3% 16,069 -0.5% 23,564 1.3% 1993/1994 7,118 0.0% 16,142 0.7% 23,260 0.5% 1992/1993 7,117 0.7% 16,032 7.4% 23,149 5.3% 1991/1992 7,067 15.3% 14,922 10.8% 21,989 12.2% 1990/1991 6,131 12.3% 13,463 10.6% 19,594 11.1% 1989/1990 5,459 14.8% 12,172 20.6% 17,631 18.7%
1988/1989 4,756 17.3% 10,096 3.0% 14,852 7.2% 1987/1988 4,053 13.2% 9,803 9.2% 13,856 10.3% 1986/1987 3,581 8.7% 8,978 1.3% 12,559 3.3% 1985/1986 3,293 3.8% 8,865 7.3% 12,158 10.5% 1984/1985 3,171 -6.5% 8,261 7.2% 10,998 -0.9% 1983/1984 3,393 -10.3% 7,709 9.2% 11,102 2.4% 1982/1983 3,784 -6.4% 7,062 -0.3% 10,846 -2.5% 1981/1982 4,041 1.8% 7,082 34.0% 11,123 20.2% 1980/1981 3,969 8.3% 5,285 -4.0% 9,254 0.9% 1979/1980 3,665 5,504 9,169
Note: Enrollments include College Prep and exclude PSAVSource: Banner STU4
Full-Time Part-Time Total

Valencia CollegeUnduplicated Annual Enrollment (Credit)
End of Term2013/2014 - 2015/2016
Difference
2014/2015 - 2015/2016
2013/2014 2014/2015 2015/2016 Nbr. Pct.
Summer Term 25,137 25,244 25,160 -84 -0.3%
Fall Term 42,287 43,214 43,990 776 1.8%
Spring Term 39,619 40,350 40,536 186 0.5%
59,894 60,548 60,883 335 0.6%
Note: 1. Credit excludes PSAV, CWE, and EPI
2. Term and Annual headcounts are unduplicated
Source: 1. Student Data Base, Student Characteristics Report
Unduplicated Annual EnrollmentPostsecondary Adult Vocational (PSAV)
End of Term2013/2014 - 2015/2016
Difference
2014/2015 - 2015/2016
2013/2014 2014/2015 2015/2016 Nbr. Pct.
Summer Term 58 122 160 38 31.1%
Fall Term 125 91 156 65 71.4%
Spring Term 264 235 221 -14 -6.0%
418 416 482 66 15.9%
Note: 1. Term and Annual headcounts are unduplicated
Source: 1. Student Data Base
Unduplicated Annual EnrollmentContinuing Workforce Education (CWE)
End of Term2013/2014 - 2015/2016
Difference
2014/2015 - 2015/2016
2013/2014 2014/2015 2015/2016 Nbr. Pct.
Summer Term 283 234 206 -28 -12.0%
Fall Term 2,185 2,159 2,228 69 3.2%
Spring Term 1,998 2,534 2,206 -328 -12.9%
3,859 4,248 3,967 -281 -6.6%
Note: 1. Only includes CWE reported for state funding (support)
2. Term and Annual headcounts are unduplicated
Source: 1. Student Data Base
Term
Annual Undup CWE
Term
Annual Undup Credit
Term
Annual Undup PSAV
Valencia College
Institutional Research 4.3Statistical History Fact Book
2015/2016

Valencia CollegeInstitutional Research 4.4
Statistical History Fact Book2015/2016
Valencia CollegeEnrollment Status
Full-Time and Part-Time 1980/1981 - 2015/2016
Year Full-Time Part-Time Full-Time Part-Time All Students
2015/2016 36.5% 63.5% 12.8 6.6 8.9
2014/2015 37.4% 62.6% 12.8 6.7 8.92013/2014 38.5% 61.5% 12.8 6.6 9.02012/2013 39.6% 60.4% 12.8 6.6 9.02011/2012 41.4% 58.6% 12.9 6.6 9.22010/2011 42.9% 57.1% 12.9 6.6 9.3
2009/2010 44.7% 55.3% 12.9 6.5 9.42008/2009 44.1% 55.9% 13.0 6.4 9.32007/2008 43.0% 57.0% 12.9 6.4 9.22006/2007 41.2% 58.8% 12.9 6.3 9.12005/2006 39.9% 60.1% 12.9 6.3 8.9
2004/2005 40.3% 59.7% 12.9 6.4 9.02003/2004 37.5% 62.5% 12.8 6.2 8.72002/2003 37.1% 62.9% 12.8 6.1 8.62001/2002 36.3% 63.7% 12.8 6.1 8.52000/2001 35.5% 64.5% 12.8 6.0 8.4
1999/2000 34.5% 65.5% 13.1 6.1 8.51998/1999 33.9% 66.1% 13.3 7.0 8.51997/1998 34.2% 65.8% 13.2 5.9 8.41996/1997 34.3% 65.7% 12.9 5.6 8.11995/1996 32.6% 67.4% 12.9 5.6 8.0
1994/1995 31.8% 68.2% 12.8 5.6 7.91993/1994 30.6% 69.4% 12.9 5.6 7.81992/1993 30.7% 69.3% 13.2 5.7 8.11991/1992 32.1% 67.9% 13.0 5.5 7.91990/1991 31.3% 68.7% 13.0 5.4 7.7
1989/1990 31.0% 69.0% 13.0 5.4 7.71988/1989 32.0% 68.0% 13.0 5.4 7.81987/1988 29.3% 70.7% 13.0 5.3 7.51986/1987 28.5% 71.5% 13.0 5.3 7.51985/1986 27.1% 72.9% 13.0 5.3 7.4
1984/1985 27.7% 72.3% 13.0 5.4 7.51983/1984 30.6% 69.4% 13.0 5.6 7.81982/1983 34.9% 65.1% 13.0 5.7 8.21981/1982 36.3% 63.7% NA NA NA1980/1981 40.5% 59.5% NA NA NA
Source: Banner STU4, Just the Facts
Fall End of Term
FT / PT Status Average Credit Hours Taken

Valencia CollegeInstitutional Research 4.5
Statistical History Fact Book2015/2016
Valencia CollegeCredit Enrollment by Program Area
2013/2014 - 2015/2016
DifferenceFall 2013 Fall 2014 Fall 2015 Fall 2014 -Fall 2015
Program Area Nbr. Pct. Nbr. Pct. Nbr. Pct. Nbr. Pct.
AA Degree 21,442 50.7% 25,805 59.7% 26,098 59.3% 293 1.4%
AS / AAS Degree 14,243 33.7% 10,631 24.6% 10,581 24.1% -50 -0.4%
Other (Miscellaneous) 6,602 15.6% 6,778 15.7% 7,311 16.6% 533 8.1%
TOTAL 42,287 100.0% 43,214 100.0% 43,990 100.0% 776 1.8%
Note: Other miscellaneous includes missing data, Student Characteristics Report
Credit Enrollment by Miscellaneous Category
2013/2014 - 2015/2016
DifferenceFall 2013 Fall 2014 Fall 2015 Fall 2014 -Fall 2015
Self-Reported Major Nbr. Pct. Nbr. Pct. Nbr. Pct. Nbr. Pct.
Personal Interest 2,652 40.2% 2,826 41.7% 2,941 40.2% 115 4.1%
Upgrading Job Skills 180 2.7% 116 1.7% 127 1.7% 11 9.5%
Teacher Recertification 24 0.4% 35 0.5% 30 0.4% -5 -14.3%
Transient 1,654 25.1% 1,718 25.3% 1,838 25.1% 120 7.0%
Dual Enrollment 1,926 29.2% 1,954 28.8% 2,244 30.7% 290 14.8%
Not Indicated/Missing Data 166 2.5% 129 1.9% 131 1.8% 2 1.6%
TOTAL 6,602 100.0% 6,778 100.0% 7,311 100.0% 533 7.9%
Note: Credit enrollments exclude PSAVSource: Banner STU4
Fall End of Term
Fall End of Term

Valencia CollegeInstitutional Research 4.6
Statistical History Fact Book2015/2016
Valencia CollegeCredit Headcount by Term
Reporting Year2015/2016
Summer Fall Spring Annual Campus Annual CollegewideCampus 2015 2015 2016 Unduplicated2
Unduplicated3
West Campus 9,780 15,947 14,861 25,916
East Campus 9,984 17,293 15,938 28,153
Osceola Campus 3,967 8,083 7,614 12,896
Winter Park Center 743 1,276 979 2,640
Lake Nona Campus 686 1,341 1,096 2,452
Public Safety Campus 50 48 80
Term Total (Unduplicated)1 25,160 43,990 40,536
Collegewide Annual Total (Unduplicated)3 60,883
Note:1. Term Total = a student is counted once per term2. Annual Campus Unduplicated = a student is counted once per campus per year3. Annual Collegewide Unduplicated = a student is counted once per year
Source: Banner STU4

Valencia CollegeInstitutional Research 4.7
Statistical History Fact Book2015/2016
Valencia CollegeCredit Student Distribution by County
2015/2016
Number of Percent ofCounty (In-District) Students Total
Orange County 27,730 63.0% Osceola County 7,683 17.5%
Total In-District 35,413 80.5%
Number of Percent ofCounty (Surrounding Valencia's District) Students Total
Brevard County 170 0.4% Lake County 627 1.4% Polk County 737 1.7% Seminole County 2,403 5.5% Volusia County 161 0.4%
Total Surrounding Counties 4,098 9.3%
Number of Percent ofOther In-State Students Total
Total Other In-State 3,637 8.3%
Number of Percent ofTotal In-State Residents Students Total
Total Florida Residents 43,142 98.1%
Number of Percent ofOut of State / Missing Zip Codes Students Total
Out of State / Missing Zip Codes 848 1.9%
Number of Percent ofTotal All Students Fall 2015 Students Total
Total All Students 43,990 100.0%
Source: IR Data X and C Files
Fall 2015 End of Term
Total Credit Students: 43,990
Valencia CollegeInstitutional Research 4.8
Statistical History Fact Book2015/2016
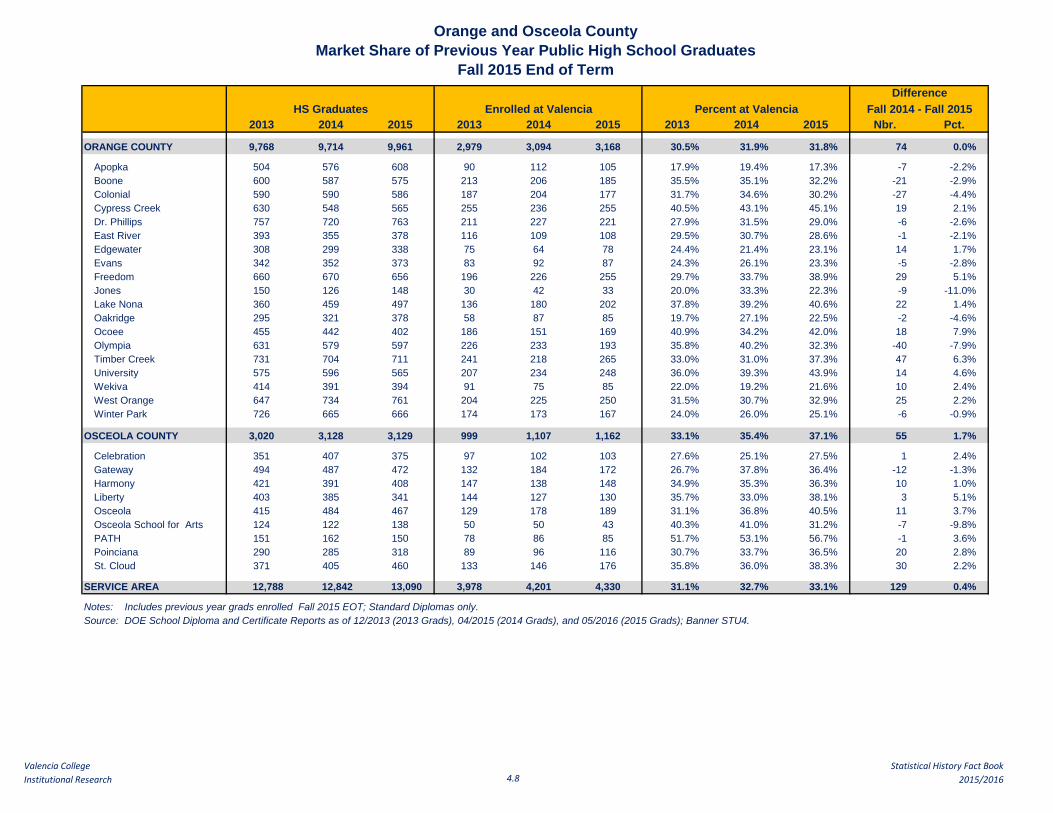
Orange and Osceola CountyMarket Share of Previous Year Public High School Graduates
Fall 2015 End of TermDifference
HS Graduates Enrolled at Valencia Percent at Valencia Fall 2014 - Fall 20152013 2014 2015 2013 2014 2015 2013 2014 2015 Nbr. Pct.
ORANGE COUNTY 9,768 9,714 9,961 2,979 3,094 3,168 30.5% 31.9% 31.8% 74 0.0% Apopka 504 576 608 90 112 105 17.9% 19.4% 17.3% -7 -2.2%Boone 600 587 575 213 206 185 35.5% 35.1% 32.2% -21 -2.9%Colonial 590 590 586 187 204 177 31.7% 34.6% 30.2% -27 -4.4%Cypress Creek 630 548 565 255 236 255 40.5% 43.1% 45.1% 19 2.1%Dr. Phillips 757 720 763 211 227 221 27.9% 31.5% 29.0% -6 -2.6%East River 393 355 378 116 109 108 29.5% 30.7% 28.6% -1 -2.1%Edgewater 308 299 338 75 64 78 24.4% 21.4% 23.1% 14 1.7%Evans 342 352 373 83 92 87 24.3% 26.1% 23.3% -5 -2.8%Freedom 660 670 656 196 226 255 29.7% 33.7% 38.9% 29 5.1%Jones 150 126 148 30 42 33 20.0% 33.3% 22.3% -9 -11.0%Lake Nona 360 459 497 136 180 202 37.8% 39.2% 40.6% 22 1.4%Oakridge 295 321 378 58 87 85 19.7% 27.1% 22.5% -2 -4.6%Ocoee 455 442 402 186 151 169 40.9% 34.2% 42.0% 18 7.9%Olympia 631 579 597 226 233 193 35.8% 40.2% 32.3% -40 -7.9%Timber Creek 731 704 711 241 218 265 33.0% 31.0% 37.3% 47 6.3%University 575 596 565 207 234 248 36.0% 39.3% 43.9% 14 4.6%Wekiva 414 391 394 91 75 85 22.0% 19.2% 21.6% 10 2.4%West Orange 647 734 761 204 225 250 31.5% 30.7% 32.9% 25 2.2%Winter Park 726 665 666 174 173 167 24.0% 26.0% 25.1% -6 -0.9%
OSCEOLA COUNTY 3,020 3,128 3,129 999 1,107 1,162 33.1% 35.4% 37.1% 55 1.7% Celebration 351 407 375 97 102 103 27.6% 25.1% 27.5% 1 2.4%Gateway 494 487 472 132 184 172 26.7% 37.8% 36.4% -12 -1.3%Harmony 421 391 408 147 138 148 34.9% 35.3% 36.3% 10 1.0%Liberty 403 385 341 144 127 130 35.7% 33.0% 38.1% 3 5.1%Osceola 415 484 467 129 178 189 31.1% 36.8% 40.5% 11 3.7%Osceola School for Arts 124 122 138 50 50 43 40.3% 41.0% 31.2% -7 -9.8%PATH 151 162 150 78 86 85 51.7% 53.1% 56.7% -1 3.6%Poinciana 290 285 318 89 96 116 30.7% 33.7% 36.5% 20 2.8%St. Cloud 371 405 460 133 146 176 35.8% 36.0% 38.3% 30 2.2%
SERVICE AREA 12,788 12,842 13,090 3,978 4,201 4,330 31.1% 32.7% 33.1% 129 0.4%
Notes: Includes previous year grads enrolled Fall 2015 EOT; Standard Diplomas only. Source: DOE School Diploma and Certificate Reports as of 12/2013 (2013 Grads), 04/2015 (2014 Grads), and 05/2016 (2015 Grads); Banner STU4.

Valencia CollegeInstitutional Research 4.9
Statistical History Fact Book2015/2016
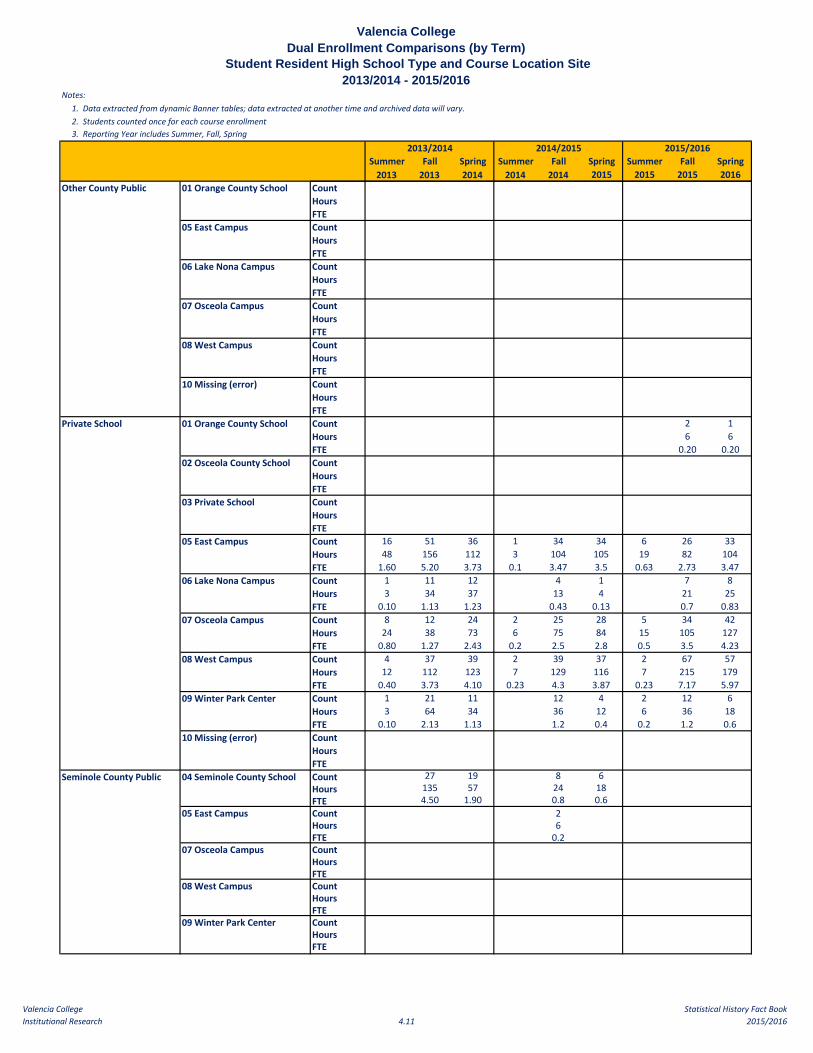
Valencia CollegeDual Enrollment Comparisons (by Term)
1. Data extracted from dynamic Banner tables; data extracted at another time and archived data will vary.2. Students counted once for each course enrollment
Summer Fall Spring Summer Fall Spring Summer Fall Spring2013 2013 2014 2014 2014 2015 2015 2015 2016
Count 714 5,140 5,066 734 5,356 5,416 796 6,286 6,490Hours 2,176 15,805 15,672 2,241 16,408 16,642 2,443 19,308 20,070FTE 72.53 526.83 522.40 74.7 546.93 554.73 81.43 643.6 669Count 249 1,275 1,275 219 1,347 1397 255 1,552 1671Hours 758 3,917 3,937 666 4,118 4282 786 4,769 5130FTE 25.27 130.57 131.23 22.2 137.27 142.73 26.2 158.97 171Count 35 553 508 69 489 448 67 666 604Hours 109 1,734 1,596 214 1,519 1,380 209 2,054 1,860FTE 3.63 57.80 53.20 7.13 50.63 46 6.97 68.47 62Count 264 1,870 1,900 306 1,887 2,036 278 2,097 2,332Hours 801 5,694 5,861 924 5,758 6,246 845 6,431 7,184FTE 26.70 189.80 195.37 30.8 191.93 208.2 28.17 214.37 239.47Count 136 1,309 1,259 123 1,459 1,391 162 1,769 1,716Hours 418 4,060 3,904 386 4,490 4,300 500 5,444 5,390FTE 13.93 135.33 130.13 12.87 149.67 143.33 16.67 181.47 179.67Count 30 133 124 17 174 144 34 202 167Hours 90 400 374 51 523 434 103 610 506FTE 3.00 13.33 12.47 1.7 17.43 14.47 3.43 20.33 16.87Count Hours FTE Count 13 56 69 6 73 80 16 72 94Hours 39 174 220 22 227 249 52 228 296FTE 1.30 5.80 7.33 0.73 7.57 8.3 1.73 7.6 9.87
06 Lake Nona Campus Count 6 19 29 6 27 26 6 59 56Hours 18 59 90 19 87 79 19 182 173FTE 0.60 1.97 3.00 0.63 2.9 2.63 0.63 6.07 5.77Count 7 38 31 3 23 28 5 34 47Hours 21 116 98 10 72 88 16 105 151FTE 0.70 3.87 3.27 0.33 2.4 2.93 0.53 3.5 5.03Count 7 41 68 11 41 61 5 68 77Hours 22 128 213 34 128 195 15 213 235FTE 0.73 4.27 7.10 1.13 4.27 6.5 0.5 7.1 7.83Count 3 9 12 2 3 4 2 12 10Hours 9 27 36 6 9 12 6 37 30FTE 0.30 0.90 1.20 0.2 0.3 0.4 0.2 1.23 1CountHoursFTE
07 Osceola Campus
08 West Campus
Student Resident High School Type and Course Location Site2013/2014 - 2015/2016
Notes:
3. Reporting Year includes Summer, Fall, Spring
Table 1: Term Total for Dual Enrolled Students
2013/2014 2014/2015 2015/2016
09 Winter Park Center
Home School 01 Orange County School
05 East Campus
07 Osceola Campus
08 West Campus
09 Winter Park Center
10 Missing (error)
Administrative 05 East Campus
06 Lake Nona Campus

Valencia CollegeInstitutional Research 4.10
Statistical History Fact Book2015/2016
Valencia CollegeDual Enrollment Comparisons (by Term)
1. Data extracted from dynamic Banner tables; data extracted at another time and archived data will vary.2. Students counted once for each course enrollment
Summer Fall Spring Summer Fall Spring Summer Fall Spring2013 2013 2014 2014 2014 2015 2015 2015 2016
Student Resident High School Type and Course Location Site2013/2014 - 2015/2016
Notes:
3. Reporting Year includes Summer, Fall, Spring
2013/2014 2014/2015 2015/2016
Count 629 521 468 397 534 508Hours 1,915 1,617 1429 1214 1624 1629FTE 63.83 53.90 47.63 40.47 54.13 54.3Count 1 Hours 3 FTE 0.10
03 Private School CountHoursFTECount 186 857 896 151 976 1033 177 1158 1202Hours 565 2,651 2,773 458 2993 3174 544 3560 3682FTE 18.83 88.37 92.43 15.27 99.77 105.8 18.13 118.67 122.73Count 21 203 164 36 213 193 31 260 243Hours 66 644 519 111 662 597 97 808 751FTE 2.20 21.47 17.30 3.7 22.07 19.9 3.23 26.93 25.03Count 80 247 232 62 299 347 69 326 371Hours 240 750 707 188 909 1060 211 1000 1142FTE 8.00 25.00 23.57 6.27 30.3 35.33 7.03 33.33 38.07Count 112 939 875 103 1028 1003 133 1291 1242Hours 342 2,886 2,702 324 3151 3086 410 3962 3840FTE 11.40 96.20 90.07 10.8 105.03 102.87 13.67 132.07 128Count 19 92 79 9 143 113 25 163 124Hours 57 276 238 27 430 341 76 492 377FTE 1.90 9.20 7.93 0.9 14.33 11.37 2.53 16.4 12.57CountHoursFTECount 1 42 2Hours 3 126 6FTE 0.10 4.20 0.20Count 150 185 239 201 215 206Hours 450 591 717 603 677 646FTE 15.00 19.70 23.9 20.1 22.57 21.53
05 East Campus Count 34 77 105 61 133 123 56 123 165Hours 106 234 325 183 401 373 171 380 517FTE 3.53 7.80 10.83 6.1 13.37 12.43 5.7 12.67 17.23Count 7 144 145 27 172 157 30 245 200Hours 22 441 455 84 538 487 93 758 620FTE 0.73 14.70 15.17 2.8 17.93 16.23 3.1 25.27 20.67Count 169 1,423 1,427 239 1276 1365 199 1386 1573Hours 516 4,340 4,389 720 3910 4210 603 4238 4839FTE 17.20 144.67 146.30 24 130.33 140.33 20.1 141.27 161.3Count 13 46 64 7 76 85 22 73 105Hours 42 142 194 21 232 265 68 222 323FTE 1.40 4.73 6.47 0.7 7.73 8.83 2.27 7.4 10.77Count 7 11 22 6 16 23 5 15 27Hours 21 33 66 18 48 69 15 45 81FTE 0.70 1.10 2.20 0.6 1.6 2.3 0.5 1.5 2.7Count 25 25 102 93Hours 75 75 306 279FTE 2.50 2.50 10.20 9.30
Osceola County Public 01 Orange County School
02 Osceola County School
06 Lake Nona Campus
07 Osceola Campus
08 West Campus
09 Winter Park Center
10 Missing (error)
Orange County Public 01 Orange County School
02 Osceola County School
05 East Campus
06 Lake Nona Campus
07 Osceola Campus
08 West Campus
09 Winter Park Center
10 Missing (error)
Valencia CollegeInstitutional Research 4.11
Statistical History Fact Book2015/2016
Valencia CollegeDual Enrollment Comparisons (by Term)
1. Data extracted from dynamic Banner tables; data extracted at another time and archived data will vary.2. Students counted once for each course enrollment
Summer Fall Spring Summer Fall Spring Summer Fall Spring2013 2013 2014 2014 2014 2015 2015 2015 2016
Student Resident High School Type and Course Location Site2013/2014 - 2015/2016
Notes:
3. Reporting Year includes Summer, Fall, Spring
2013/2014 2014/2015 2015/2016
CountHoursFTECountHoursFTE
06 Lake Nona Campus CountHoursFTECountHoursFTECountHoursFTECountHoursFTECount 2 1Hours 6 6FTE 0.20 0.20CountHoursFTECountHoursFTECount 16 51 36 1 34 34 6 26 33Hours 48 156 112 3 104 105 19 82 104FTE 1.60 5.20 3.73 0.1 3.47 3.5 0.63 2.73 3.47
06 Lake Nona Campus Count 1 11 12 4 1 7 8Hours 3 34 37 13 4 21 25FTE 0.10 1.13 1.23 0.43 0.13 0.7 0.83Count 8 12 24 2 25 28 5 34 42Hours 24 38 73 6 75 84 15 105 127FTE 0.80 1.27 2.43 0.2 2.5 2.8 0.5 3.5 4.23Count 4 37 39 2 39 37 2 67 57Hours 12 112 123 7 129 116 7 215 179FTE 0.40 3.73 4.10 0.23 4.3 3.87 0.23 7.17 5.97Count 1 21 11 12 4 2 12 6Hours 3 64 34 36 12 6 36 18FTE 0.10 2.13 1.13 1.2 0.4 0.2 1.2 0.6Count Hours FTE Count 27 19 8 6Hours 135 57 24 18FTE 4.50 1.90 0.8 0.6Count 2Hours 6FTE 0.2CountHoursFTE
08 West Campus CountHoursFTECountHoursFTE
Private School 01 Orange County School
02 Osceola County School
03 Private School
05 East Campus
07 Osceola Campus
08 West Campus
09 Winter Park Center
10 Missing (error)
Seminole County Public 04 Seminole County School
05 East Campus
07 Osceola Campus
09 Winter Park Center
Other County Public 01 Orange County School
05 East Campus
07 Osceola Campus
08 West Campus
10 Missing (error)

Valencia CollegeInstitutional Research 4.12
Statistical History Fact Book2015/2016
Valencia CollegeDual Enrollment Comparisons (by Term)
1. Data extracted from dynamic Banner tables; data extracted at another time and archived data will vary.2. Students counted once for each course enrollment
Summer Fall Spring Summer Fall Spring Summer Fall Spring2013 2013 2014 2014 2014 2015 2015 2015 2016
Student Resident High School Type and Course Location Site2013/2014 - 2015/2016
Notes:
3. Reporting Year includes Summer, Fall, Spring
2013/2014 2014/2015 2015/2016
398 364 318 325 369 37371 89 124 126 120 115
18 18 8 6180 471 541 172 565 613 185 624 721
06 Lake Nona Campus 29 176 194 59 221 218 56 279 275185 682 709 209 651 742 181 694 833103 442 489 87 505 571 114 645 67530 92 92 17 111 107 32 125 122
18 18 66 65
438 1,936 1,960 441 1,959 1,997 464 2,292 2,39319 48 67 17 54 63 19 78 90
261 1,198 1,162 221 1213 1211 260 1448 1458140 608 659 200 636 671 176 703 776
18 64 54 3 48 46 9 63 69
18 18 8 6
Table 2: Unduplicated dual enrollments by course location (CrseSite)
08 West Campus
01 Orange County School02 Osceola County School03 Private School04 Seminole County School05 East Campus
07 Osceola Campus
Other County PublicPrivate SchoolSeminole County Public
09 Winter Park Center10 Missing (error)
TotalHome SchoolOrange County PublicOsceola County Public
Table 3: Unduplicated dual enrollments by resident high school type (DualType)

Valencia CollegeInstitutional Research 4.13
Statistical History Fact Book2015/2016
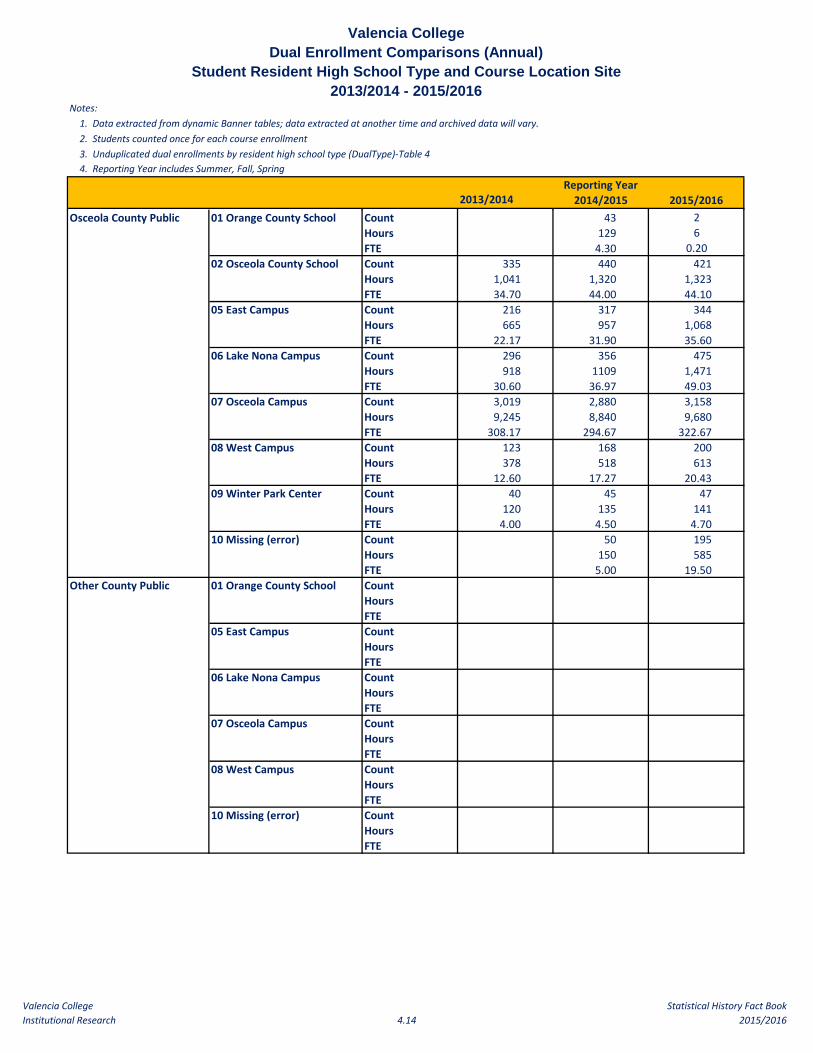
Valencia CollegeDual Enrollment Comparisons (Annual)
Student Resident High School Type and Course Location Site2013/2014 - 2015/2016
Notes: 1. Data extracted from dynamic Banner tables; data extracted at another time and archived data will vary.2. Students counted once for each course enrollment3. Unduplicated dual enrollments by resident high school type (DualType)-Table 4
2013/2014 2014/2015 2015/2016Count 10,920 11,506 13,572Hours 33,653 35,291 41,821FTE 1,121.77 1,176.37 1,394.03CountHoursFTECount 138 159 182Hours 433 498 576FTE 14.43 16.60 19.20
06 Lake Nona Campus Count 54 59 121Hours 167 185 374FTE 5.57 6.17 12.47Count 76 54 86Hours 235 170 272FTE 7.83 5.67 9.07Count 116 113 150Hours 363 357 463FTE 12.10 11.90 15.43Count 24 9 24Hours 72 27 73FTE 2.40 0.90 2.43
10 Missing (error) CountHoursFTECount 1,150 865 1,042Hours 3,532 2,643 3,253FTE 117.73 88.10 108.43Count 1 Hours 3 FTE 0.10 CountHoursFTECount 1,939 2,160 2,537Hours 5,989 6,625 7,786FTE 199.63 220.83 259.53
06 Lake Nona Campus Count 388 442 534Hours 1229 1370 1,656FTE 40.97 45.67 55.20Count 559 708 766Hours 1,697 2,157 2,353FTE 56.57 71.90 78.43Count 1,926 2,134 2,666Hours 5,930 6,561 8,212FTE 197.67 218.70 273.73Count 190 265 312Hours 571 798 945FTE 19.03 26.60 31.50CountHoursFTE
4. Reporting Year includes Summer, Fall, Spring
Annual Total
Home School 01 Orange County School
05 East Campus
07 Osceola Campus
08 West Campus
09 Winter Park Center
Reporting Year
Orange County Public 01 Orange County School
02 Osceola County School
03 Private School
05 East Campus
07 Osceola Campus
08 West Campus
09 Winter Park Center
10 Missing (error)
Valencia CollegeInstitutional Research 4.14
Statistical History Fact Book2015/2016
Valencia CollegeDual Enrollment Comparisons (Annual)
Student Resident High School Type and Course Location Site2013/2014 - 2015/2016
Notes: 1. Data extracted from dynamic Banner tables; data extracted at another time and archived data will vary.2. Students counted once for each course enrollment3. Unduplicated dual enrollments by resident high school type (DualType)-Table 4
2013/2014 2014/2015 2015/2016
4. Reporting Year includes Summer, Fall, Spring
Reporting Year
Count 43 2Hours 129 6FTE 4.30 0.20Count 335 440 421Hours 1,041 1,320 1,323FTE 34.70 44.00 44.10Count 216 317 344Hours 665 957 1,068FTE 22.17 31.90 35.60
06 Lake Nona Campus Count 296 356 475Hours 918 1109 1,471FTE 30.60 36.97 49.03Count 3,019 2,880 3,158Hours 9,245 8,840 9,680FTE 308.17 294.67 322.67Count 123 168 200Hours 378 518 613FTE 12.60 17.27 20.43Count 40 45 47Hours 120 135 141FTE 4.00 4.50 4.70Count 50 195Hours 150 585FTE 5.00 19.50CountHoursFTECountHoursFTE
06 Lake Nona Campus CountHoursFTECountHoursFTECountHoursFTECountHoursFTE
Other County Public 01 Orange County School
05 East Campus
07 Osceola Campus
08 West Campus
10 Missing (error)
Osceola County Public 01 Orange County School
02 Osceola County School
05 East Campus
07 Osceola Campus
08 West Campus
09 Winter Park Center
10 Missing (error)

Valencia CollegeInstitutional Research 4.15
Statistical History Fact Book2015/2016
Valencia CollegeDual Enrollment Comparisons (Annual)
Student Resident High School Type and Course Location Site2013/2014 - 2015/2016
Notes: 1. Data extracted from dynamic Banner tables; data extracted at another time and archived data will vary.2. Students counted once for each course enrollment3. Unduplicated dual enrollments by resident high school type (DualType)-Table 4
2013/2014 2014/2015 2015/2016
4. Reporting Year includes Summer, Fall, Spring
Reporting Year
Count 3Hours 12FTE 0.40CountHoursFTECountHoursFTECount 103 69 65Hours 316 212 205FTE 10.53 7.07 6.83
06 Lake Nona Campus Count 24 5 15Hours 74 17 46FTE 2.74 0.57 1.53Count 44 55 81Hours 135 165 247FTE 4.50 5.50 8.23Count 80 78 126Hours 247 252 401FTE 8.23 8.40 13.37Count 33 16 20Hours 101 48 60FTE 3.37 1.60 2.00CountHoursFTECount 46 14Hours 192 42FTE 6.40 1.40Count 2Hours 6FTE 0.2
06 Lake Nona Campus CountHoursFTECountHoursFTECountHoursFTECountHoursFTE
Private School 01 Orange County School
02 Osceola County School
03 Private School
05 East Campus
07 Osceola Campus
08 West Campus
09 Winter Park Center
10 Missing (error)
Seminole County Public 04 Seminole County School
05 East Campus
07 Osceola Campus
08 West Campus
09 Winter Park Center

Valencia CollegeInstitutional Research 4.16
Statistical History Fact Book2015/2016
Notes: 1. Data extracted from dynamic Banner tables; data extracted at another time and archived data will vary.2. Students counted once for each course enrollment3. Unduplicated dual enrollments by resident high school type (DualType)-Table 4
Unduplicated dual enrollments by course location (CrseSite)TABLE 5: Students are counted per year for each course location attendedCourse Meeting Location 2013/2014 2014/2015 2015/2016
01 Orange County School 410 367 38402 Osceola County School 110 140 12803 Private School04 Seminole County School 18 805 East Campus 733 841 92806 Lake Nona Campus 266 308 38707 Osceola Campus 875 875 96508 West Campus 628 717 87109 Winter Park Center 177 194 22910 Missing (error) 18 68
Unduplicated dual enrollments by resident high school type (DualType)TABLE 6: Students counted once per year for each high school type(Dual enrollment class may not have met at this location)Dual High School Type 2013/2014 2014/2015 2015/2016
Total 2,363 2,182 2,563Home School 71 71 100Orange County Public 1,464 1,310 1,563Osceola County Public 661 703 816Other County Public Private School 141 80 84Seminole County Public 26 18
Unduplicated dual enrollments by reporting yearTABLE 7: Students counted once per reporting year
2013/2014 2014/2015 2015/2016Total 2,182 2,160 2,563
Valencia CollegeDual Enrollment Comparisons (Annual)
Student Resident High School Type and Course Location Site2013/2014 - 2015/2016
4. Reporting Year includes Summer, Fall, Spring

Valencia CollegeInstitutional Research 4.17
Statistical History Fact Book2015/2016
Fall End of Term2013/2014 - 2015/2016
Note: International students include NON-SEVIS and SEVIS students. “NON-SEVIS” Includes students on all visa types (except students on F and J visas), students who arenot U.S. citizens or permanent residents. “SEVIS” includes students on F and J visas.
Source: InternationalStudentCharacteristics.sas
Collegewide Fall 2013 Fall 2014 Fall 2015Unduplicated StudentsNON-SEVIS Students 266 355 404SEVIS Students 387 517 793All 653 872 1197
Collegewide Fall 2013 Fall 2014 Fall 2015Unduplicated StudentsTotal Enrollment by Country - All (NON-SEVIS and SEVIS) 653 872 1197Total Countries Represented - All (NON-SEVIS and SEVIS) 86 99 112
Collegewide Fall 2013 Fall 2014 Fall 2015NON-SEVIS Students
Legal NationNot Reported 58 63 76ANGOLA 1 1 1ANTIGUA AND BARBUDA 1ARGENTINA 1 8 11ARUBA 1BAHAMAS,THE 1 1BANGLADESH 1 2BERMUDA 1 1BHUTAN 1BOLIVIA 2 1BRAZIL 25 34 35BRITISH INDIAN OCEAN TERRITORY 1BURKINA FASO 1 1CANADA 2 5 7CANAL ZONE 1 1CHILE 3 4 4CHINA 4 3 6COLOMBIA 18 30 38COSTA RICA 3 2CUBA 1 1DENMARK 1 1 2DOMINICAN REPUBLIC 2 4 3ECUADOR 2 2 3EGYPT 2 3EL SALVADOR 1 1 3ETHIOPIA 1FRANCE 3GERMANY 1 1GUATEMALA 4 2 3GUYANA 2HAITI 25 22 20HONDURAS 4 7 6HONG KONG 1INDIA 3 4 5IRELAND 1 1ITALY 2 1JAMAICA 3 3 2JAPAN 1 2KENYA 1KUWAIT 1LATVIA 1LEBANON 1LIBYA 2 5 3MEXICO 16 32 42MICRONESIA, FEDERATED STATES OF 1 1MOLDOVA 1 1MOROCCO 1 4 2NEPAL 1
Collegewide International Student EnrollmentValencia College
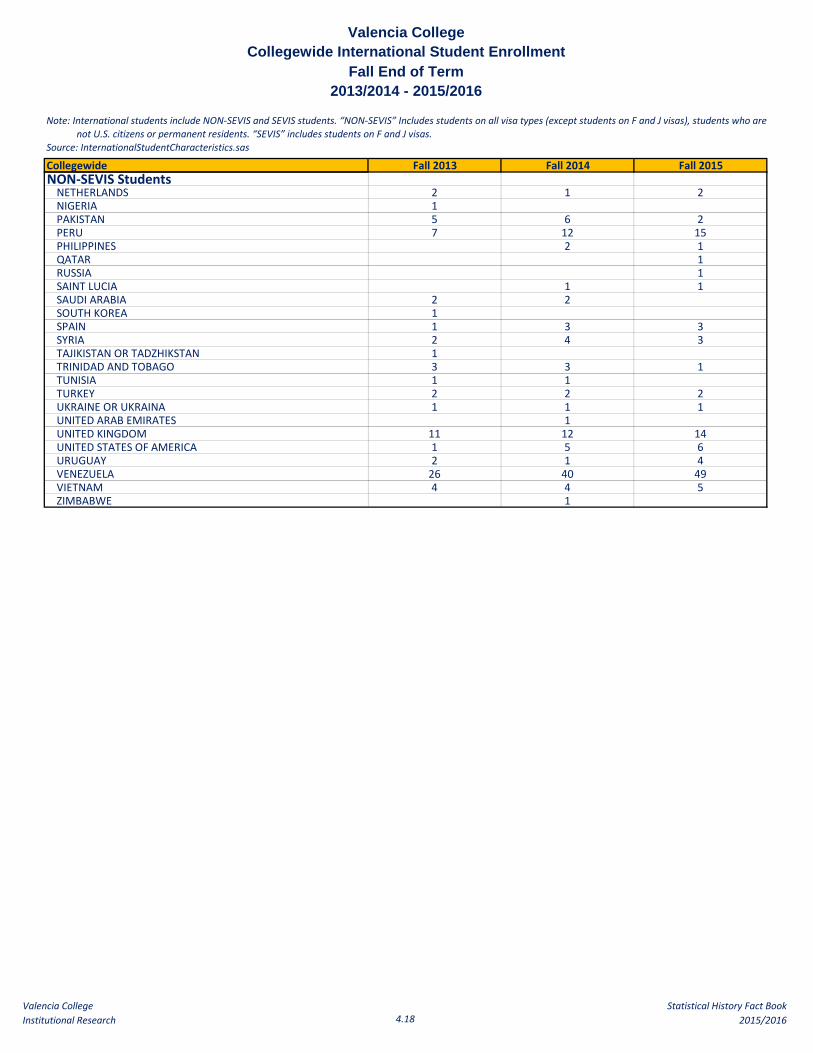
Valencia CollegeInstitutional Research 4.18
Statistical History Fact Book2015/2016
Fall End of Term2013/2014 - 2015/2016
Note: International students include NON-SEVIS and SEVIS students. “NON-SEVIS” Includes students on all visa types (except students on F and J visas), students who arenot U.S. citizens or permanent residents. “SEVIS” includes students on F and J visas.
Source: InternationalStudentCharacteristics.sas
Collegewide Fall 2013 Fall 2014 Fall 2015
Collegewide International Student EnrollmentValencia College
NON-SEVIS StudentsNETHERLANDS 2 1 2NIGERIA 1PAKISTAN 5 6 2PERU 7 12 15PHILIPPINES 2 1QATAR 1RUSSIA 1SAINT LUCIA 1 1SAUDI ARABIA 2 2SOUTH KOREA 1SPAIN 1 3 3SYRIA 2 4 3TAJIKISTAN OR TADZHIKSTAN 1TRINIDAD AND TOBAGO 3 3 1TUNISIA 1 1TURKEY 2 2 2UKRAINE OR UKRAINA 1 1 1UNITED ARAB EMIRATES 1UNITED KINGDOM 11 12 14UNITED STATES OF AMERICA 1 5 6URUGUAY 2 1 4VENEZUELA 26 40 49VIETNAM 4 4 5ZIMBABWE 1

Valencia CollegeInstitutional Research 4.19
Statistical History Fact Book2015/2016
Fall End of Term2013/2014 - 2015/2016
Note: International students include NON-SEVIS and SEVIS students. “NON-SEVIS” Includes students on all visa types (except students on F and J visas), students who arenot U.S. citizens or permanent residents. “SEVIS” includes students on F and J visas.
Source: InternationalStudentCharacteristics.sas
Collegewide Fall 2013 Fall 2014 Fall 2015
Collegewide International Student EnrollmentValencia College
SEVIS StudentsLegal NationALBANIA 2 2 1ANGOLA 4 14 13ANTIGUA AND BARBUDA 1 5ARGENTINA 1 1ARUBA 4 5 8AUSTRALIA 2AUSTRIA 1BAHAMAS,THE 8 18 20BAHRAIN 2 2BANGLADESH 4 4BARBADOS 1BELGIUM 1 2 1BELIZE 1BERMUDA 3 1 2BOLIVIA 2 2BOTSWANA 1BRAZIL 40 74 139CAMEROON 1 1CANADA 15 12 12CAPE VERDE 3 2 1CAYMAN ISLANDS 2CHILE 1 3 3CHINA 19 24 34COLOMBIA 8 16 23CONGO (BRAZZAVILLE) 1CONGO (KINSHASA) 1COSTA RICA 1 2CURACAO 1DENMARK 4 2 1DOMINICAN REPUBLIC 2 3 6ECUADOR 4 9 16EGYPT 3 2 4EL SALVADOR 1 1 1FRANCE 2 5 5GAZA STRIP 1 2 1GERMANY 2 1 4GHANA 2 1 1GRENADA 2 1GUATEMALA 1GUYANA 1 2HAITI 5 4 6HONDURAS 4 1 6HONG KONG 1 1 1ICELAND 4 5 2INDIA 4 3 11IRAQ 2 2IRELAND 1ISRAEL 1 2 1ITALY 2 1 3IVORY COAST (COTE D'IVOIRE) 1JAMAICA 6 3 15JAPAN 6 6 11JORDAN 3 10 16KAZAKHSTAN 1 1KENYA 1 2 2KOSOVO 1KUWAIT 5 9 9KYRGYZSTAN 1 1 1LEBANON 2

Valencia CollegeInstitutional Research 4.20
Statistical History Fact Book2015/2016
Fall End of Term2013/2014 - 2015/2016
Note: International students include NON-SEVIS and SEVIS students. “NON-SEVIS” Includes students on all visa types (except students on F and J visas), students who arenot U.S. citizens or permanent residents. “SEVIS” includes students on F and J visas.
Source: InternationalStudentCharacteristics.sas
Collegewide Fall 2013 Fall 2014 Fall 2015
Collegewide International Student EnrollmentValencia College
SEVIS StudentsLIBYA 1 3 2LITHUANIA 1MALAYSIA 1 1 1MALI 4 5 3MAURITANIA 2 2 2MAURITIUS 2MEXICO 3 6 6MOLDOVA 1MONGOLIA 1 1 1MOROCCO 9 12 23NEPAL 2 1 2NETHERLANDS 16 21 20NETHERLANDS ANTILLES 1 3 3NEW ZEALAND 1 1NIGERIA 1 2 12NORWAY 3 3OMAN 2 1 3PAKISTAN 3 4 5PANAMA 2PERU 2 3 9PHILIPPINES 2 2 1POLAND 1 1PORTUGAL 1 3 6QATAR 2 7 7RUSSIA 3 4RWANDA 1 1 1SAINT KITTS-NEVIS 1 1SAINT LUCIA 2SAUDI ARABIA 30 19 36SAINT MAARTEN 2SOUTH AFRICA 3SOUTH KOREA 8 8 7SPAIN 2SUDAN 1SURINAME 1 1SWEDEN 3 2 4SWITZERLAND 1 1SYRIA 1 4TAIWAN 1 3 1TANZANIA, UNITED REPUBLIC OF 1THAILAND 3 3TRINIDAD AND TOBAGO 1 2 2TUNISIA 1 1 2TURKEY 5 7 6TURKS AND CAICOS ISLAND 3 2 3UKRAINE OR UKRAINA 1 1 1UNITED ARAB EMIRATES 1UNITED KINGDOM 13 10 16VENEZUELA 71 91 133VIETNAM 10 10 28YEMEM (ADEN) 1 1 1YEMEN, DEMOCRATIC REPUBLIC OF 1 3
Valencia CollegeInstitutional Research 4.21
Statistical History Fact Book2015/2016
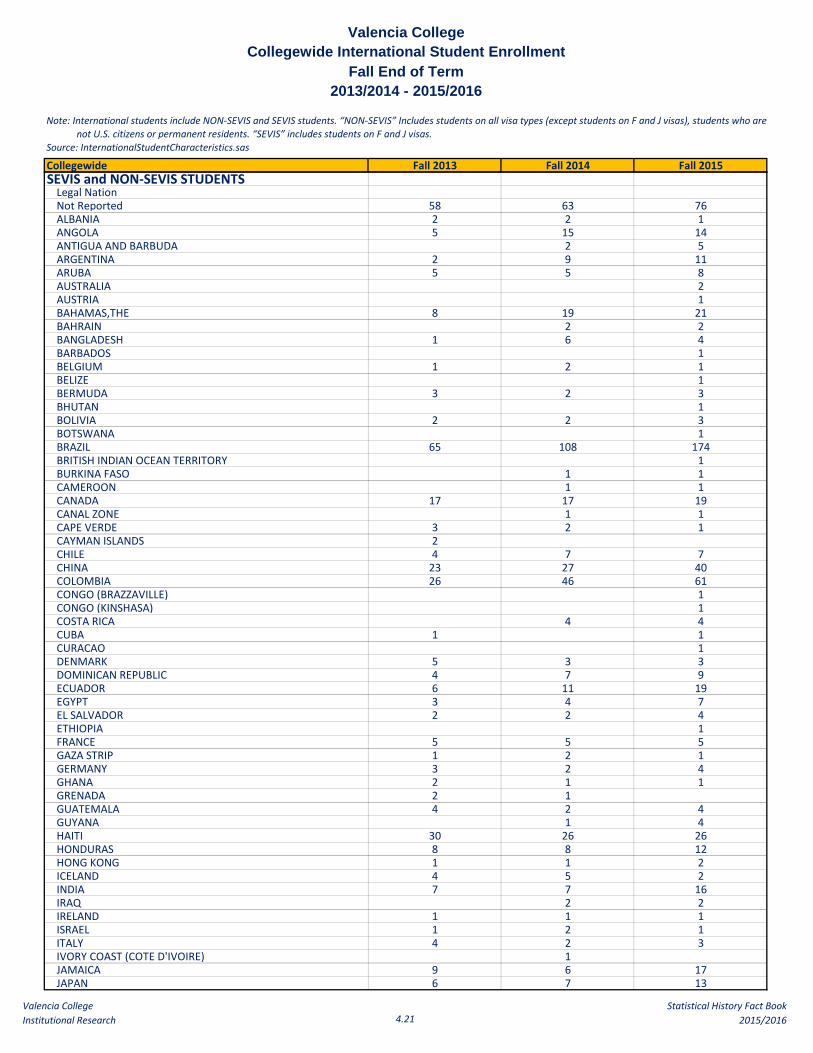
Fall End of Term2013/2014 - 2015/2016
Note: International students include NON-SEVIS and SEVIS students. “NON-SEVIS” Includes students on all visa types (except students on F and J visas), students who arenot U.S. citizens or permanent residents. “SEVIS” includes students on F and J visas.
Source: InternationalStudentCharacteristics.sas
Collegewide Fall 2013 Fall 2014 Fall 2015
Collegewide International Student EnrollmentValencia College
SEVIS and NON-SEVIS STUDENTSLegal NationNot Reported 58 63 76ALBANIA 2 2 1ANGOLA 5 15 14ANTIGUA AND BARBUDA 2 5ARGENTINA 2 9 11ARUBA 5 5 8AUSTRALIA 2AUSTRIA 1BAHAMAS,THE 8 19 21BAHRAIN 2 2BANGLADESH 1 6 4BARBADOS 1BELGIUM 1 2 1BELIZE 1BERMUDA 3 2 3BHUTAN 1BOLIVIA 2 2 3BOTSWANA 1BRAZIL 65 108 174BRITISH INDIAN OCEAN TERRITORY 1BURKINA FASO 1 1CAMEROON 1 1CANADA 17 17 19CANAL ZONE 1 1CAPE VERDE 3 2 1CAYMAN ISLANDS 2CHILE 4 7 7CHINA 23 27 40COLOMBIA 26 46 61CONGO (BRAZZAVILLE) 1CONGO (KINSHASA) 1COSTA RICA 4 4CUBA 1 1CURACAO 1DENMARK 5 3 3DOMINICAN REPUBLIC 4 7 9ECUADOR 6 11 19EGYPT 3 4 7EL SALVADOR 2 2 4ETHIOPIA 1FRANCE 5 5 5GAZA STRIP 1 2 1GERMANY 3 2 4GHANA 2 1 1GRENADA 2 1GUATEMALA 4 2 4GUYANA 1 4HAITI 30 26 26HONDURAS 8 8 12HONG KONG 1 1 2ICELAND 4 5 2INDIA 7 7 16IRAQ 2 2IRELAND 1 1 1ISRAEL 1 2 1ITALY 4 2 3IVORY COAST (COTE D'IVOIRE) 1JAMAICA 9 6 17JAPAN 6 7 13
Valencia CollegeInstitutional Research 4.22
Statistical History Fact Book2015/2016
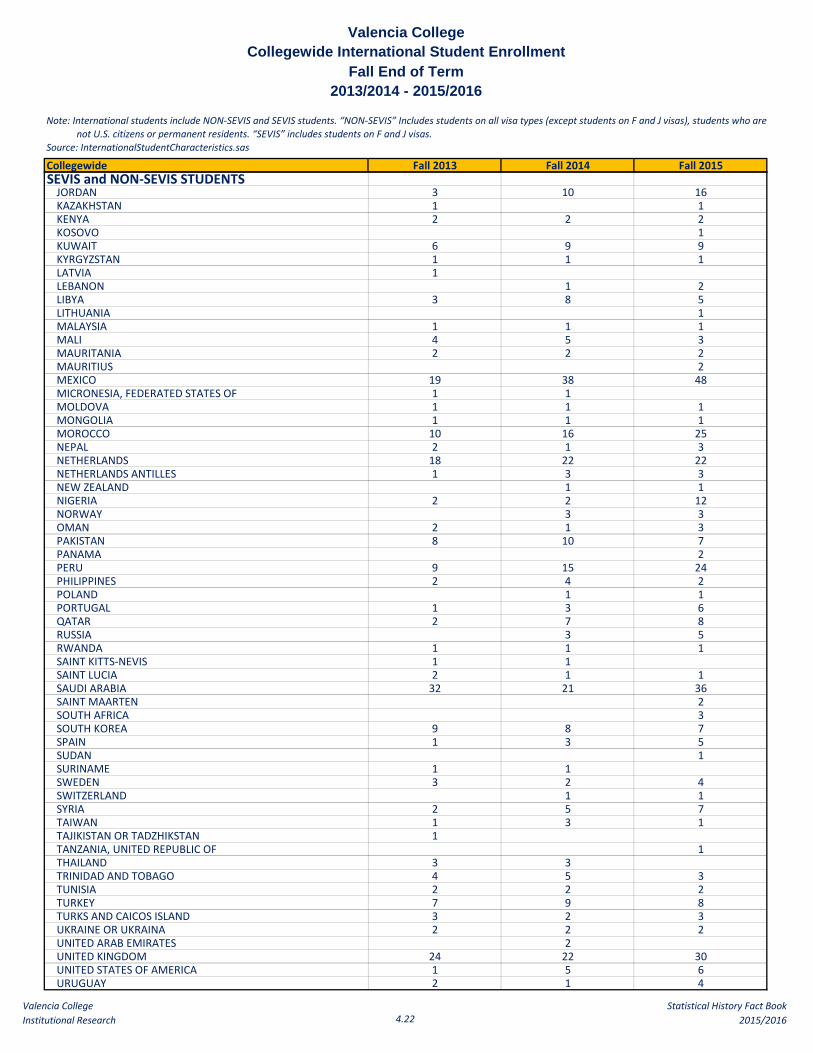
Fall End of Term2013/2014 - 2015/2016
Note: International students include NON-SEVIS and SEVIS students. “NON-SEVIS” Includes students on all visa types (except students on F and J visas), students who arenot U.S. citizens or permanent residents. “SEVIS” includes students on F and J visas.
Source: InternationalStudentCharacteristics.sas
Collegewide Fall 2013 Fall 2014 Fall 2015
Collegewide International Student EnrollmentValencia College
SEVIS and NON-SEVIS STUDENTSJORDAN 3 10 16KAZAKHSTAN 1 1KENYA 2 2 2KOSOVO 1KUWAIT 6 9 9KYRGYZSTAN 1 1 1LATVIA 1LEBANON 1 2LIBYA 3 8 5LITHUANIA 1MALAYSIA 1 1 1MALI 4 5 3MAURITANIA 2 2 2MAURITIUS 2MEXICO 19 38 48MICRONESIA, FEDERATED STATES OF 1 1MOLDOVA 1 1 1MONGOLIA 1 1 1MOROCCO 10 16 25NEPAL 2 1 3NETHERLANDS 18 22 22NETHERLANDS ANTILLES 1 3 3NEW ZEALAND 1 1NIGERIA 2 2 12NORWAY 3 3OMAN 2 1 3PAKISTAN 8 10 7PANAMA 2PERU 9 15 24PHILIPPINES 2 4 2POLAND 1 1PORTUGAL 1 3 6QATAR 2 7 8RUSSIA 3 5RWANDA 1 1 1SAINT KITTS-NEVIS 1 1SAINT LUCIA 2 1 1SAUDI ARABIA 32 21 36SAINT MAARTEN 2SOUTH AFRICA 3SOUTH KOREA 9 8 7SPAIN 1 3 5SUDAN 1SURINAME 1 1SWEDEN 3 2 4SWITZERLAND 1 1SYRIA 2 5 7TAIWAN 1 3 1TAJIKISTAN OR TADZHIKSTAN 1TANZANIA, UNITED REPUBLIC OF 1THAILAND 3 3TRINIDAD AND TOBAGO 4 5 3TUNISIA 2 2 2TURKEY 7 9 8TURKS AND CAICOS ISLAND 3 2 3UKRAINE OR UKRAINA 2 2 2UNITED ARAB EMIRATES 2UNITED KINGDOM 24 22 30UNITED STATES OF AMERICA 1 5 6URUGUAY 2 1 4

Valencia CollegeInstitutional Research 4.23
Statistical History Fact Book2015/2016
Fall End of Term2013/2014 - 2015/2016
Note: International students include NON-SEVIS and SEVIS students. “NON-SEVIS” Includes students on all visa types (except students on F and J visas), students who arenot U.S. citizens or permanent residents. “SEVIS” includes students on F and J visas.
Source: InternationalStudentCharacteristics.sas
Collegewide Fall 2013 Fall 2014 Fall 2015
Collegewide International Student EnrollmentValencia College
SEVIS and NON-SEVIS STUDENTSVENEZUELA 97 131 182VIETNAM 14 14 33YEMEM (ADEN) 1 1 1YEMEN, DEMOCRATIC REPUBLIC OF 1 3ZIMBABWE 1

Valencia CollegeInstitutional Research 4.24
Statistical History Fact Book2015/2016
Valencia College
Fall End of Term2013/2014 - 2015/2016
Note: International students include NON-SEVIS and SEVIS students. “NON-SEVIS” Includes students on all visa types (except students on F and J visas), students who are not U.S. citizens or permanent residents. “SEVIS” includes students on F and J visas.
Source: InternationalStudentCharacteristics.sas
West Campus Fall 2013 Fall 2014 Fall 2015Unduplicated StudentsNON-SEVIS Students 172 227 238SEVIS Students 209 295 428All 381 522 666
West Campus Fall 2013 Fall 2014 Fall 2015Unduplicated StudentsTotal Enrollment by Country - All (NON-SEVIS and SEVIS) 381 522 666Total Countries Represented - All (NON-SEVIS and SEVIS) 66 77 84
West Campus Fall 2013 Fall 2014 Fall 2015NON-SEVIS Students
Legal NationNot Reported 42 45 54ANGOLA 1 1 1ARGENTINA 1 5 5BAHAMAS,THE 1 1BANGLADESH 1 1BHUTAN 1BOLIVIA 2 1BRAZIL 19 26 26CANADA 1 1CANAL ZONE 1 1CHILE 2 3 3CHINA 2 2 5COLOMBIA 12 20 20COSTA RICA 2 1DENMARK 1DOMINICAN REPUBLIC 1 3 2ECUADOR 2 1 1EGYPT 1 2EL SALVADOR 2ETHIOPIA 1FRANCE 2GERMANY 1 1GUATEMALA 2 1 2GUYANA 1HAITI 17 17 18HONDURAS 2 4 4HONG KONG 1INDIA 1 1IRELAND 1ITALY 1JAMAICA 3 3 2JAPAN 1 2KENYA 1LATVIA 1LIBYA 2 5 2MEXICO 8 19 24MOLDOVA 1 1MOROCCO 1 4 2NEPAL 1NETHERLANDS 2 1PAKISTAN 4 4 1PERU 2 4 4PHILIPPINES 1RUSSIA 1SAINT LUCIA 1 1
West Campus International Student Enrollment

Valencia CollegeInstitutional Research 4.25
Statistical History Fact Book2015/2016
Valencia College
Fall End of Term2013/2014 - 2015/2016
Note: International students include NON-SEVIS and SEVIS students. “NON-SEVIS” Includes students on all visa types (except students on F and J visas), students who are not U.S. citizens or permanent residents. “SEVIS” includes students on F and J visas.
Source: InternationalStudentCharacteristics.sas
West Campus Fall 2013 Fall 2014 Fall 2015
West Campus International Student Enrollment
NON-SEVIS StudentsSPAIN 1 3 3SYRIA 1 3 2TAJIKISTAN OR TADZHIKST 1TRINIDAD AND TOBAGO 2 3 1TUNISIA 1 1TURKEY 1 1 1UNITED ARAB EMIRATES 1UNITED KINGDOM 6 6 6UNITED STATES OF AMERICA 1 3 1URUGUAY 1 1 1VENEZUELA 17 24 25VIETNAM 2 2 2

Valencia CollegeInstitutional Research 4.26
Statistical History Fact Book2015/2016
Valencia College
Fall End of Term2013/2014 - 2015/2016
Note: International students include NON-SEVIS and SEVIS students. “NON-SEVIS” Includes students on all visa types (except students on F and J visas), students who are not U.S. citizens or permanent residents. “SEVIS” includes students on F and J visas.
Source: InternationalStudentCharacteristics.sas
West Campus Fall 2013 Fall 2014 Fall 2015
West Campus International Student Enrollment
SEVIS StudentsLegal NationALBANIA 1 1ANGOLA 3 13 13ANTIGUA AND BARBUDA 1 2ARGENTINA 1 1ARUBA 2AUSTRALIA 1BAHAMAS,THE 6 11 9BANGLADESH 3 2BARBADOS 1BELGIUM 1 1BERMUDA 3 1 1BOLIVIA 1 1BOTSWANA 1BRAZIL 37 69 122CANADA 10 9 6CAPE VERDE 2 2 1CHILE 1 2 1CHINA 10 10 15COLOMBIA 3 7 11CONGO (BRAZZAVILLE) 1CONGO (KINSHASA) 1DENMARK 3DOMINICAN REPUBLIC 2 2 4ECUADOR 2 3 4EGYPT 1 1FRANCE 3 2GERMANY 1 1GHANA 1GRENADA 1GUYANA 1 1HAITI 4 1 1HONDURAS 2HONG KONG 1 1 1ICELAND 1 1INDIA 2 2 8IRAQ 1 1IRELAND 1ISRAEL 1 1 1ITALY 2 1 2IVORY COAST (COTE D'IVOIRE) 1JAMAICA 4 2 6JAPAN 2 2 5JORDAN 5 6KENYA 1 2 2KOSOVO 1KUWAIT 1 2KYRGYZSTAN 1 1 1LEBANON 1LIBYA 1 1 1LITHUANIA 1MALAYSIA 1 1MALI 2 2MEXICO 1 3 4MONGOLIA 1 1 1MOROCCO 6 9 20NEPAL 1 1 1NETHERLANDS 5 7 3NETHERLANDS ANTILLES 1 1

Valencia CollegeInstitutional Research 4.27
Statistical History Fact Book2015/2016
Valencia College
Fall End of Term2013/2014 - 2015/2016
Note: International students include NON-SEVIS and SEVIS students. “NON-SEVIS” Includes students on all visa types (except students on F and J visas), students who are not U.S. citizens or permanent residents. “SEVIS” includes students on F and J visas.
Source: InternationalStudentCharacteristics.sas
West Campus Fall 2013 Fall 2014 Fall 2015
West Campus International Student Enrollment
SEVIS StudentsNEW ZEALAND 1 1NIGERIA 1 3NORWAY 3 2PAKISTAN 2 2 1PERU 1 3 7PHILIPPINES 1 1 1POLAND 1 1PORTUGAL 1 1 2RUSSIA 1 2RWANDA 1 1 1SAINT LUCIA 1SAUDI ARABIA 2 4 4SOUTH AFRICA 2SOUTH KOREA 6 6 7SPAIN 1SWEDEN 1 1 1SYRIA 1 1TAIWAN 1TANZANIA, UNITED REPUBLIC OF 1THAILAND 2 3TRINIDAD AND TOBAGO 1 1TUNISIA 1 1 1TURKEY 1 2 1TURKS AND CAICOS ISLAND 3 2 3UNITED KINGDOM 12 7 10VENEZUELA 44 59 83VIETNAM 4 4 13

Valencia CollegeInstitutional Research 4.28
Statistical History Fact Book2015/2016
Valencia College
Fall End of Term2013/2014 - 2015/2016
Note: International students include NON-SEVIS and SEVIS students. “NON-SEVIS” Includes students on all visa types (except students on F and J visas), students who are not U.S. citizens or permanent residents. “SEVIS” includes students on F and J visas.
Source: InternationalStudentCharacteristics.sas
West Campus Fall 2013 Fall 2014 Fall 2015
West Campus International Student Enrollment
SEVIS and NON-SEVIS STUDENTSLegal NationNot Reported 42 45 54ALBANIA 1 1ANGOLA 4 14 14ANTIGUA AND BARBUDA 1 2ARGENTINA 2 6 5ARUBA 2AUSTRALIA 1BAHAMAS,THE 6 12 10BANGLADESH 1 4 2BARBADOS 1BELGIUM 1 1BERMUDA 3 1 1BHUTAN 1BOLIVIA 2 1 2BOTSWANA 1BRAZIL 56 95 148CANADA 11 9 7CANAL ZONE 1 1CAPE VERDE 2 2 1CHILE 3 5 4CHINA 12 12 20COLOMBIA 15 27 31CONGO (BRAZZAVILLE) 1CONGO (KINSHASA) 1COSTA RICA 2 1DENMARK 3 1DOMINICAN REPUBLIC 3 5 6ECUADOR 4 4 5EGYPT 1 1 3EL SALVADOR 2ETHIOPIA 1FRANCE 2 3 2GERMANY 2 1 1GHANA 1GRENADA 1GUATEMALA 2 1 2GUYANA 1 2HAITI 21 18 19HONDURAS 2 4 6HONG KONG 1 1 2ICELAND 1 1INDIA 3 3 8IRAQ 1 1IRELAND 1 1ISRAEL 1 1 1ITALY 3 1 2IVORY COAST (COTE D'IVOIRE) 1JAMAICA 7 5 8JAPAN 2 3 7JORDAN 5 6KENYA 2 2 2KOSOVO 1KUWAIT 1 2KYRGYZSTAN 1 1 1LATVIA 1LEBANON 1LIBYA 3 6 3LITHUANIA 1MALAYSIA 1 1

Valencia CollegeInstitutional Research 4.29
Statistical History Fact Book2015/2016
Valencia College
Fall End of Term2013/2014 - 2015/2016
Note: International students include NON-SEVIS and SEVIS students. “NON-SEVIS” Includes students on all visa types (except students on F and J visas), students who are not U.S. citizens or permanent residents. “SEVIS” includes students on F and J visas.
Source: InternationalStudentCharacteristics.sas
West Campus Fall 2013 Fall 2014 Fall 2015
West Campus International Student Enrollment
SEVIS and NON-SEVIS STUDENTSMALI 2 2MEXICO 9 22 28MOLDOVA 1 1MONGOLIA 1 1 1MOROCCO 7 13 22NEPAL 1 1 2NETHERLANDS 7 7 4NETHERLANDS ANTILLES 1 1NEW ZEALAND 1 1NIGERIA 1 3NORWAY 3 2PAKISTAN 6 6 2PERU 3 7 11PHILIPPINES 1 2 1POLAND 1 1PORTUGAL 1 1 2RUSSIA 1 3RWANDA 1 1 1SAINT LUCIA 1 1 1SAUDI ARABIA 2 4 4SOUTH AFRICA 2SOUTH KOREA 6 6 7SPAIN 1 3 4SWEDEN 1 1 1SYRIA 1 4 3TAIWAN 1TAJIKISTAN OR TADZHIKST 1TANZANIA, UNITED REPUBLIC OF 1THAILAND 2 3TRINIDAD AND TOBAGO 3 3 2TUNISIA 2 2 1TURKEY 2 3 2TURKS AND CAICOS ISLAND 3 2 3UNITED ARAB EMIRATES 1UNITED KINGDOM 18 13 16UNITED STATES OF AMERICA 1 3 1URUGUAY 1 1 1VENEZUELA 61 83 108VIETNAM 6 6 15

Valencia CollegeInstitutional Research 4.30
Statistical History Fact Book2015/2016
Valencia College
Fall End of Term2013/2014 - 2015/2016
Note: International students include NON-SEVIS and SEVIS students. “NON-SEVIS” Includes students on all visa types (except students on F and J visas), students who are not U.S. citizens or permanent residents. “SEVIS” includes students on F and J visas.
Source: InternationalStudentCharacteristics.sas
East Campus Fall 2013 Fall 2014 Fall 2015Unduplicated StudentsNON-SEVIS Students 71 88 104SEVIS Students 176 205 318All 247 293 422
East Campus Fall 2013 Fall 2014 Fall 2015Unduplicated StudentsTotal Enrollment by Country - All (NON-SEVIS and SEVIS) 247 293 422Total Countries Represented - All (NON-SEVIS and SEVIS) 64 73 82
East Campus Fall 2013 Fall 2014 Fall 2015NON-SEVIS Students
Legal NationNot Reported 13 9 14ARGENTINA 3 5ARUBA 1BANGLADESH 1BRAZIL 4 5 5BURKINA FASO 1 1CANADA 1 4 3CHILE 1 1 1CHINA 2 1 1COLOMBIA 2 5 8CUBA 1 1DENMARK 1 1 1DOMINICAN REPUBLIC 1 1 1ECUADOR 1EGYPT 1EL SALVADOR 1 1 1FRANCE 1GUATEMALA 1GUYANA 1HAITI 7 5 2HONDURAS 2 3 2INDIA 1 2 1ITALY 1 1KUWAIT 1LEBANON 1LIBYA 1MEXICO 4 10 15MICRONESIA, FEDERATED STATES OF 1 1NETHERLANDS 1 1PERU 2 5 7QATAR 1SAUDI ARABIA 2 2SOUTH KOREA 1SYRIA 1 1 1TRINIDAD AND TOBAGO 1TURKEY 1 1 1UKRAINE OR UKRAINA 1 1 1UNITED KINGDOM 5 5 4UNITED STATES OF AMERICA 2 2URUGUAY 1 3VENEZUELA 7 11 14VIETNAM 2 2 3ZIMBABWE 1
East Campus International Student Enrollment

Valencia CollegeInstitutional Research 4.31
Statistical History Fact Book2015/2016
Valencia College
Fall End of Term2013/2014 - 2015/2016
Note: International students include NON-SEVIS and SEVIS students. “NON-SEVIS” Includes students on all visa types (except students on F and J visas), students who are not U.S. citizens or permanent residents. “SEVIS” includes students on F and J visas.
Source: InternationalStudentCharacteristics.sas
East Campus Fall 2013 Fall 2014 Fall 2015
East Campus International Student Enrollment
SEVIS StudentsLegal NationALBANIA 1 1 1ANGOLA 1 1ANTIGUA AND BARBUDA 1ARUBA 4 5 5AUSTRALIA 1AUSTRIA 1BAHAMAS,THE 2 7 11BAHRAIN 2 2BELGIUM 1 1BELIZE 1BERMUDA 1BOLIVIA 1 1BRAZIL 3 3 11CAMEROON 1 1CANADA 5 2 6CAPE VERDE 1CAYMAN ISLANDS 2CHILE 1 1CHINA 9 13 18COLOMBIA 5 7 10COSTA RICA 1 2CURACAO 1DENMARK 1 2 1DOMINICAN REPUBLIC 2ECUADOR 2 6 9EGYPT 1 2 3EL SALVADOR 1 1 1FRANCE 2 2 3GAZA STRIP 1 2 1GERMANY 1 1 3GHANA 2 1GRENADA 1 1GUATEMALA 1HAITI 1 3 4HONDURAS 4 1 4ICELAND 3 4 2INDIA 2 1 2IRAQ 1 1ISRAEL 1JAMAICA 2 4JAPAN 4 4 6JORDAN 3 5 10KAZAKHSTAN 1 1KUWAIT 5 8 7LEBANON 1LIBYA 2 1MALAYSIA 1MALI 2 3 3MAURITANIA 2 2 2MAURITIUS 2MEXICO 1 3 2MOLDOVA 1MOROCCO 3 3 3NEPAL 1 1NETHERLANDS 11 14 16NETHERLANDS ANTILLES 1 2 2NIGERIA 1 1 9NORWAY 1OMAN 2 1 3
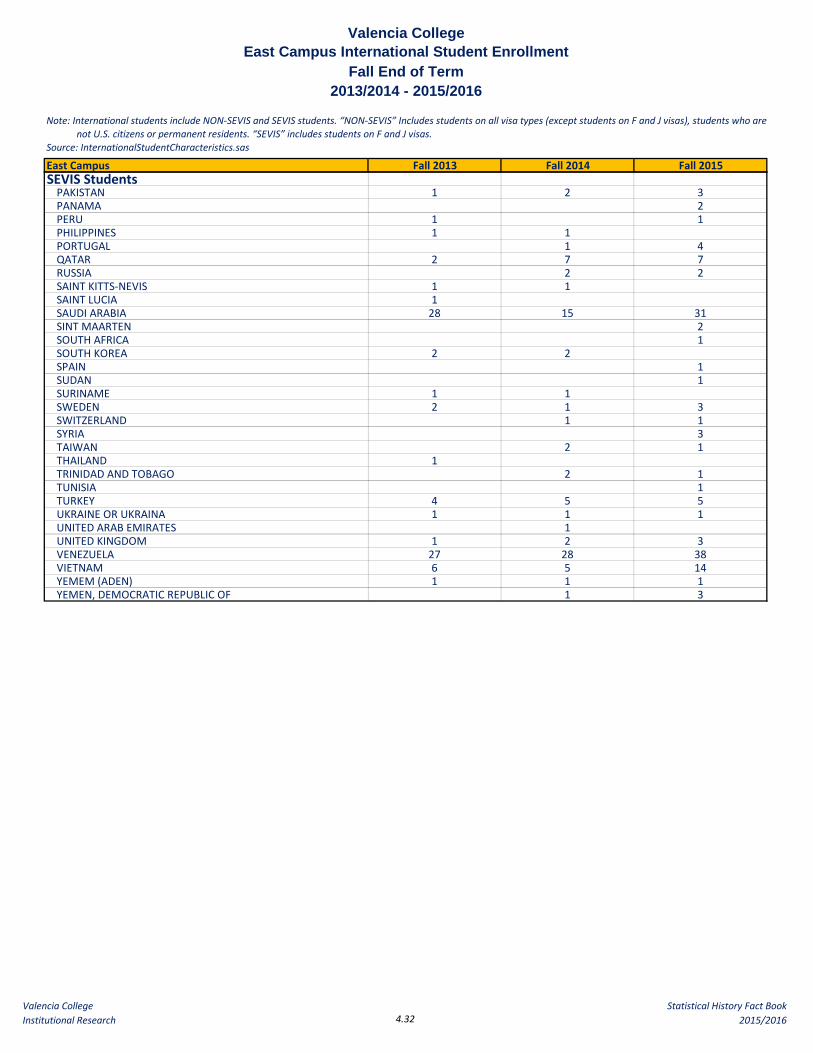
Valencia CollegeInstitutional Research 4.32
Statistical History Fact Book2015/2016
Valencia College
Fall End of Term2013/2014 - 2015/2016
Note: International students include NON-SEVIS and SEVIS students. “NON-SEVIS” Includes students on all visa types (except students on F and J visas), students who are not U.S. citizens or permanent residents. “SEVIS” includes students on F and J visas.
Source: InternationalStudentCharacteristics.sas
East Campus Fall 2013 Fall 2014 Fall 2015
East Campus International Student Enrollment
SEVIS StudentsPAKISTAN 1 2 3PANAMA 2PERU 1 1PHILIPPINES 1 1PORTUGAL 1 4QATAR 2 7 7RUSSIA 2 2SAINT KITTS-NEVIS 1 1SAINT LUCIA 1SAUDI ARABIA 28 15 31SINT MAARTEN 2SOUTH AFRICA 1SOUTH KOREA 2 2SPAIN 1SUDAN 1SURINAME 1 1SWEDEN 2 1 3SWITZERLAND 1 1SYRIA 3TAIWAN 2 1THAILAND 1TRINIDAD AND TOBAGO 2 1TUNISIA 1TURKEY 4 5 5UKRAINE OR UKRAINA 1 1 1UNITED ARAB EMIRATES 1UNITED KINGDOM 1 2 3VENEZUELA 27 28 38VIETNAM 6 5 14YEMEM (ADEN) 1 1 1YEMEN, DEMOCRATIC REPUBLIC OF 1 3

Valencia CollegeInstitutional Research 4.33
Statistical History Fact Book2015/2016
Valencia College
Fall End of Term2013/2014 - 2015/2016
Note: International students include NON-SEVIS and SEVIS students. “NON-SEVIS” Includes students on all visa types (except students on F and J visas), students who are not U.S. citizens or permanent residents. “SEVIS” includes students on F and J visas.
Source: InternationalStudentCharacteristics.sas
East Campus Fall 2013 Fall 2014 Fall 2015
East Campus International Student Enrollment
SEVIS and NON-SEVIS STUDENTSLegal NationNot Reported 13 9 14ALBANIA 1 1 1ANGOLA 1 1ANTIGUA AND BARBUDA 1ARGENTINA 3 5ARUBA 5 5 5AUSTRALIA 1AUSTRIA 1BAHAMAS,THE 2 7 11BAHRAIN 2 2BANGLADESH 1BELGIUM 1 1BELIZE 1BERMUDA 1BOLIVIA 1 1BRAZIL 7 8 16BURKINA FASO 1 1CAMEROON 1 1CANADA 6 6 9CAPE VERDE 1CAYMAN ISLANDS 2CHILE 1 2 2CHINA 11 14 19COLOMBIA 7 12 18COSTA RICA 1 2CUBA 1 1CURACAO 1DENMARK 2 3 2DOMINICAN REPUBLIC 1 1 3ECUADOR 2 6 10EGYPT 1 2 4EL SALVADOR 2 2 2FRANCE 3 2 3GAZA STRIP 1 2 1GERMANY 1 1 3GHANA 2 1GRENADA 1 1GUATEMALA 1 1GUYANA 1HAITI 8 8 6HONDURAS 6 4 6ICELAND 3 4 2INDIA 3 3 3IRAQ 1 1ISRAEL 1ITALY 1 1JAMAICA 2 4JAPAN 4 4 6JORDAN 3 5 10KAZAKHSTAN 1 1KUWAIT 6 8 7LEBANON 1 1LIBYA 2 2MALAYSIA 1MALI 2 3 3MAURITANIA 2 2 2MAURITIUS 2MEXICO 5 13 17MICRONESIA, FEDERATED STATES OF 1 1
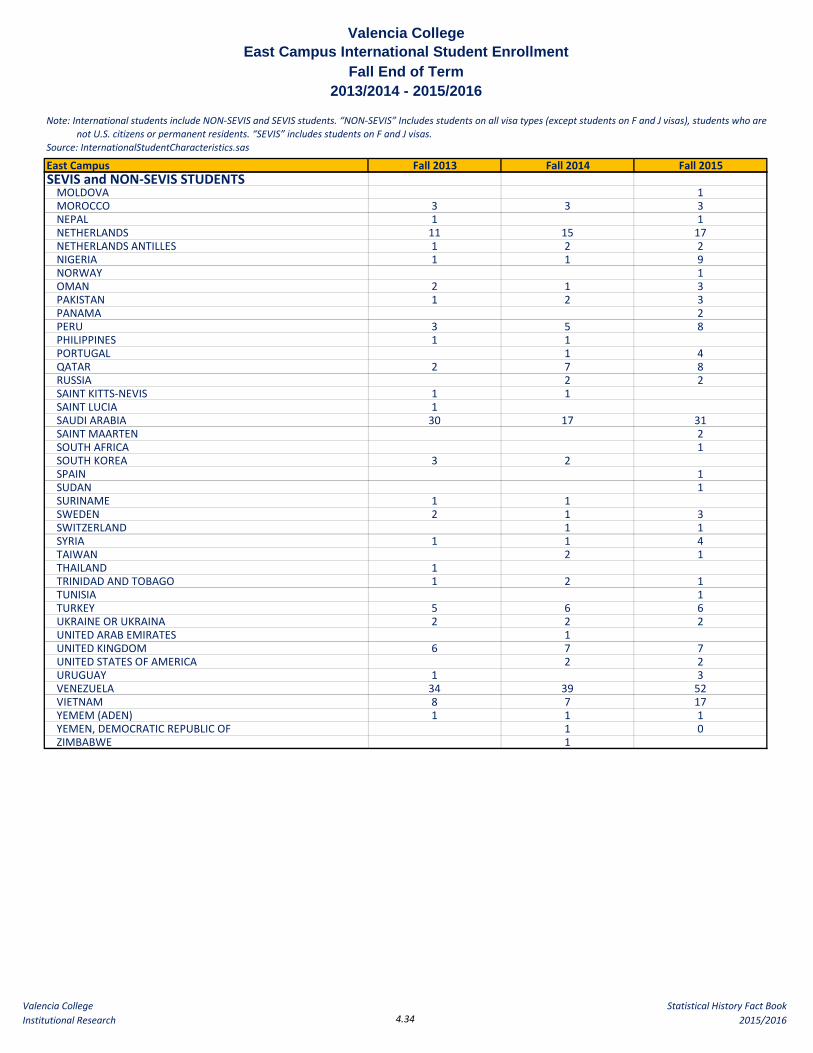
Valencia CollegeInstitutional Research 4.34
Statistical History Fact Book2015/2016
Valencia College
Fall End of Term2013/2014 - 2015/2016
Note: International students include NON-SEVIS and SEVIS students. “NON-SEVIS” Includes students on all visa types (except students on F and J visas), students who are not U.S. citizens or permanent residents. “SEVIS” includes students on F and J visas.
Source: InternationalStudentCharacteristics.sas
East Campus Fall 2013 Fall 2014 Fall 2015
East Campus International Student Enrollment
SEVIS and NON-SEVIS STUDENTSMOLDOVA 1MOROCCO 3 3 3NEPAL 1 1NETHERLANDS 11 15 17NETHERLANDS ANTILLES 1 2 2NIGERIA 1 1 9NORWAY 1OMAN 2 1 3PAKISTAN 1 2 3PANAMA 2PERU 3 5 8PHILIPPINES 1 1PORTUGAL 1 4QATAR 2 7 8RUSSIA 2 2SAINT KITTS-NEVIS 1 1SAINT LUCIA 1SAUDI ARABIA 30 17 31SAINT MAARTEN 2SOUTH AFRICA 1SOUTH KOREA 3 2SPAIN 1SUDAN 1SURINAME 1 1SWEDEN 2 1 3SWITZERLAND 1 1SYRIA 1 1 4TAIWAN 2 1THAILAND 1TRINIDAD AND TOBAGO 1 2 1TUNISIA 1TURKEY 5 6 6UKRAINE OR UKRAINA 2 2 2UNITED ARAB EMIRATES 1UNITED KINGDOM 6 7 7UNITED STATES OF AMERICA 2 2URUGUAY 1 3VENEZUELA 34 39 52VIETNAM 8 7 17YEMEM (ADEN) 1 1 1YEMEN, DEMOCRATIC REPUBLIC OF 1 0ZIMBABWE 1

Valencia CollegeInstitutional Research 4.35
Statistical History Fact Book2015/2016
Valencia College
Fall End of Term2013/2014 - 2015/2016
Note: International students include NON-SEVIS and SEVIS students. “NON-SEVIS” Includes students on all visa types (except students on F and J visas), students who are not U.S. citizens or permanent residents. “SEVIS” includes students on F and J visas.
Source: InternationalStudentCharacteristics.sas
Winter Park Campus Fall 2013 Fall 2014 Fall 2015Unduplicated StudentsNON-SEVIS Students 2 4 8SEVIS Students 1All 2 5 8
Winter Park Campus Fall 2013 Fall 2014 Fall 2015Unduplicated StudentsTotal Enrollment by Country - All (NON-SEVIS and SEVIS) 2 5 8Total Countries Represented - All (NON-SEVIS and SEVIS) 2 5 6
Winter Park Campus Fall 2013 Fall 2014 Fall 2015NON-SEVIS Students
Legal NationBRAZIL 1 1CANADA 1COLOMBIA 1 1INDIA 1 1 1NIGERIA 1PAKISTAN 1 1VENEZUELA 2
SEVIS StudentsLegal NationCANADA 1
SEVIS and NON-SEVIS STUDENTSLegal NationNot Reported 1BRAZIL 1 1CANADA 1 1COLOMBIA 1 1INDIA 1 1 1NIGERIA 1PAKISTAN 1 1VENEZUELA 2
Winter Park Campus International Student Enrollment
Valencia CollegeInstitutional Research 4.36
Statistical History Fact Book2015/2016
Valencia College
Fall End of Term2013/2014 - 2015/2016
Note: International students include NON-SEVIS and SEVIS students. “NON-SEVIS” Includes students on all visa types (except students on F and J visas), students who are not U.S. citizens or permanent residents. “SEVIS” includes students on F and J visas.
Source: InternationalStudentCharacteristics.sas
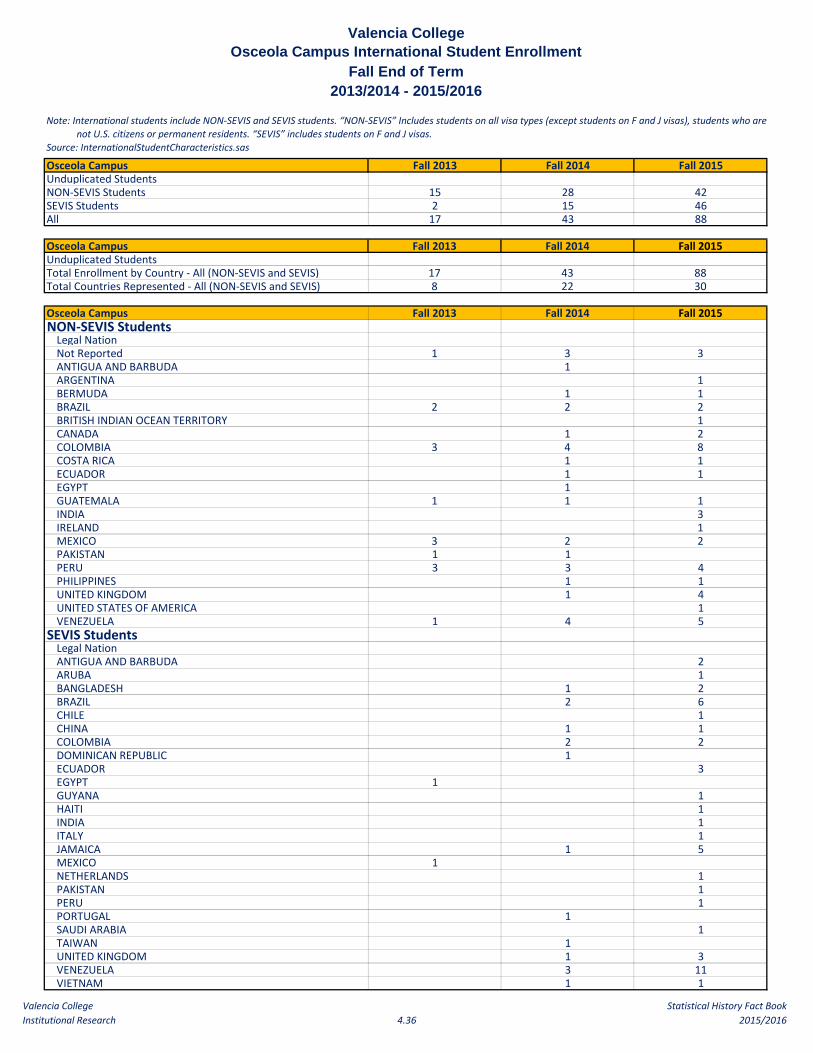
Osceola Campus Fall 2013 Fall 2014 Fall 2015Unduplicated StudentsNON-SEVIS Students 15 28 42SEVIS Students 2 15 46All 17 43 88
Osceola Campus Fall 2013 Fall 2014 Fall 2015Unduplicated StudentsTotal Enrollment by Country - All (NON-SEVIS and SEVIS) 17 43 88Total Countries Represented - All (NON-SEVIS and SEVIS) 8 22 30
Osceola Campus Fall 2013 Fall 2014 Fall 2015NON-SEVIS Students
Legal NationNot Reported 1 3 3ANTIGUA AND BARBUDA 1ARGENTINA 1BERMUDA 1 1BRAZIL 2 2 2BRITISH INDIAN OCEAN TERRITORY 1CANADA 1 2COLOMBIA 3 4 8COSTA RICA 1 1ECUADOR 1 1EGYPT 1GUATEMALA 1 1 1INDIA 3IRELAND 1MEXICO 3 2 2PAKISTAN 1 1PERU 3 3 4PHILIPPINES 1 1UNITED KINGDOM 1 4UNITED STATES OF AMERICA 1VENEZUELA 1 4 5
SEVIS StudentsLegal NationANTIGUA AND BARBUDA 2ARUBA 1BANGLADESH 1 2BRAZIL 2 6CHILE 1CHINA 1 1COLOMBIA 2 2DOMINICAN REPUBLIC 1ECUADOR 3EGYPT 1GUYANA 1HAITI 1INDIA 1ITALY 1JAMAICA 1 5MEXICO 1NETHERLANDS 1PAKISTAN 1PERU 1PORTUGAL 1SAUDI ARABIA 1TAIWAN 1UNITED KINGDOM 1 3VENEZUELA 3 11VIETNAM 1 1
Osceola Campus International Student Enrollment

Valencia CollegeInstitutional Research 4.37
Statistical History Fact Book2015/2016
Valencia College
Fall End of Term2013/2014 - 2015/2016
Note: International students include NON-SEVIS and SEVIS students. “NON-SEVIS” Includes students on all visa types (except students on F and J visas), students who are not U.S. citizens or permanent residents. “SEVIS” includes students on F and J visas.
Source: InternationalStudentCharacteristics.sas
Osceola Campus Fall 2013 Fall 2014 Fall 2015
Osceola Campus International Student Enrollment
SEVIS and NON-SEVIS STUDENTSLegal NationNot Reported 1 3 3ANTIGUA AND BARBUDA 1 2ARGENTINA 1ARUBA 1BANGLADESH 1 2BERMUDA 1 1BRAZIL 2 4 8BRITISH INDIAN OCEAN TERRITORY 1CANADA 1 2CHILE 1CHINA 1 1COLOMBIA 3 6 10COSTA RICA 1 1DOMINICAN REPUBLIC 1ECUADOR 1 4EGYPT 1 1GUATEMALA 1 1 1GUYANA 1HAITI 1INDIA 4IRELAND 1ITALY 1JAMAICA 1 5MEXICO 4 2 2NETHERLANDS 1PAKISTAN 1 1 1PERU 3 3 5PHILIPPINES 1 1PORTUGAL 1SAUDI ARABIA 1TAIWAN 1UNITED KINGDOM 2 7UNITED STATES OF AMERICA 1VENEZUELA 1 7 16VIETNAM 1 1

Valencia CollegeInstitutional Research 4.38
Statistical History Fact Book2015/2016
Valencia College
Fall End of Term2013/2014 - 2015/2016
Note: International students include NON-SEVIS and SEVIS students. “NON-SEVIS” Includes students on all visa types (except students on F and J visas), students who are not U.S. citizens or permanent residents. “SEVIS” includes students on F and J visas.
Source: InternationalStudentCharacteristics.sas
Lake Nona Campus Fall 2013 Fall 2014 Fall 2015Unduplicated StudentsNON-SEVIS Students 4 3 9SEVIS Students 1 1All 4 4 10
Lake Nona Campus Fall 2013 Fall 2014 Fall 2015Unduplicated StudentsTotal Enrollment by Country - All (NON-SEVIS and SEVIS) 4 4 10Total Countries Represented - All (NON-SEVIS and SEVIS) 3 2 4
Lake Nona Campus Fall 2013 Fall 2014 Fall 2015NON-SEVIS Students
Legal NationNot Reported 1 1 2COLOMBIA 1 1MEXICO 1 1 1UNITED STATES OF AMERICA 2VENEZUELA 1 1 3
SEVIS StudentsLegal NationVENEZUELA 1 1
SEVIS and NON-SEVIS STUDENTSLegal NationNot Reported 1 1 2COLOMBIA 1 1MEXICO 1 1 1UNITED STATES OF AMERIC 2VENEZUELA 1 2 4
Lake Nona Campus International Student Enrollment

Valencia CollegeInstitutional Research 4.39
Statistical History Fact Book2015/2016
Summer Fall Spring Collegewide 2015 2015 2016 FTE % FTE Nbr. Pct.
Advanced & Professional (Credit) 3,564.0 9,512.6 8,632.9 21,709.6 71.3% -545.0 -2.4% Post Sec Voc (PSV) 1,478.7 2,907.6 2,854.9 7,241.2 23.8% 1,029.9 16.6% College Prep (Credit) 203.2 556.8 373.9 1,133.9 3.7% -343.4 -23.2% Ed Prep Institute (Credit) 26.8 21.5 26.4 74.7 0.2% -4.0 -5.0%
Total Credit 5,272.7 12,998.6 11,888.1 30,159.4 99.0% 137.5 0.5%
Post Sec Adult Voc (PSAV) 69.6 69.3 125.7 264.6 0.9% 24.1 10.0% Cont WF Educ (CWE) 0.0 11.3 22.2 33.5 0.1% 21.4 176.7% Lifelong Learning 0.0 0.0 0.0 0.0 0.0% 0.0 N/A
Total Noncredit 69.6 80.6 147.9 298.0 1.0% 45.4 18.0%
Collegewide Total 5,342.3 13,079.2 12,036.0 30,457.4 100.0% 182.9 0.6% Percent of Collegewide Total 17.5% 42.9% 39.5% 100.0%
Summer Fall Spring Collegewide 2014 2014 2015 FTE % FTE Nbr. Pct.
Advanced & Professional (Credit) 3,828.9 9,990.2 8,435.5 22,254.6 73.5% 486.6 2.2% Post Sec Voc (PSV) 1,113.5 2,196.9 2,900.9 6,211.3 20.5% 839.3 15.6% College Prep (Credit) 343.7 679.6 454.0 1,477.3 4.9% -1,066.2 -41.9% Ed Prep Institute (Credit) 30.8 26.1 21.8 78.7 0.3% -11.4 -12.7%
Total Credit 5,316.9 12,892.8 11,812.2 30,021.9 99.2% 248.3 0.8%
Post Sec Adult Voc (PSAV) 56.6 49.0 134.9 240.5 0.8% -8.5 -3.4% Cont WF Educ (CWE) 12.1 0.0 0.0 12.1 0.0% -2.0 -14.2% Lifelong Learning 0.0 0.0 0.0 0.0 0.0% 0.0 N/A
Total Noncredit 68.7 49.0 134.9 252.6 0.8% -10.5 -4.0%
Collegewide Total 5,385.6 12,941.8 11,947.1 30,274.5 100.0% 237.8 0.8% Percent of Collegewide Total 17.8% 42.7% 39.5% 100.0%
Note: Does not include 3.4 FTE with no Campus indicator Source: Enrollment Bulletin, 2014/2015 EOY (Reporting Year)
Summer Fall Spring Collegewide 2013 2013 2014 FTE % FTE Nbr. Pct.
Advanced & Professional (Credit) 3,809.5 9,256.5 8,702.0 21,768.0 72.5% -222.4 -1.0% Post Sec Voc (PSV) 1,091.4 2,157.7 2,122.9 5,372.0 17.9% -103.0 -1.9% College Prep (Credit) 423.3 1,239.3 880.9 2,543.5 8.5% -242.4 -8.7% Ed Prep Institute (Credit) 27.3 33.1 29.7 90.1 0.3% -3.6 -3.8%
Total Credit 5,351.5 12,686.6 11,735.5 29,773.6 99.1% -571.4 -1.9%
Post Sec Adult Voc (PSAV) 49.5 53.7 145.8 249.0 0.8% 76.2 44.1% Cont WF Educ (CWE) 0.0 0.0 14.1 14.1 0.0% -6.6 -31.9% Lifelong Learning 0.0 0.0 0.0 0.0 0.0% 0.0 N/A
Total Noncredit 49.5 53.7 159.9 263.1 0.9% 69.6 36.0%
Collegewide Total 5,401.0 12,740.3 11,895.4 30,036.7 100.0% -501.8 -1.6% Percent of Collegewide Total 18.0% 42.4% 39.6% 100.0%
Note: Does not include 3.4 FTE with no Campus indicator Source: Enrollment Bulletin, 2013/2014 EOY (Reporting Year)
Collegewide 2012/2013 - 2013/2014
Valencia CollegeCollegewide
FTE by Instructional Category & Term2013/2014
Annual Difference
Collegewide 2013/2014 - 2014/2015
Valencia CollegeCollegewide
FTE by Instructional Category & Term2014/2015
Annual Difference
Source: Enrollment Bulletin, 2015/2016 EOY (Reporting Year)Note: Does not include 3.4 FTE with no Campus indicator
Collegewide 2014/2015 - 2015/2016
Valencia CollegeCollegewide
FTE by Instructional Category & Term2015/2016
Annual Difference

Valencia CollegeInstitutional Research 4.40
Statistical History Fact Book2015/2016
AnnualSummer Fall Spring Campus Campus CW
West Campus 2015 2015 2016 FTE % of FTE % of FTE Nbr. Pct.
Advanced & Professional (Credit) 1,086.9 2,850.1 2,570.4 6,507.4 63.8% 21.4% -133.0 -2.0% Post Sec Voc (PSV) 720.9 1,244.3 1,238.8 3,204.0 31.4% 10.5% 295.8 10.2% College Prep (Credit) 80.6 180.9 142.0 403.4 4.0% 1.3% -136.5 -25.3% Ed Prep Institute (Credit) 26.8 21.5 26.4 74.7 0.7% 0.2% -4.0 -5.0%
Total Credit 1,915.2 4,296.8 3,977.6 10,189.6 100.0% 33.5% 22.4 0.2%
Post Sec Adult Voc (PSAV) 0.0 0.0 0.0 0.0 0.0% 0.0% 0.0 N/ACont WF Educ (CWE) 0.0 1.2 3.8 4.9 0.0% 0.0% 4.9 N/ALifelong Learning 0.0 0.0 0.0 0.0 0.0% 0.0% 0.0 N/A
Total Noncredit 0.0 1.2 3.8 4.9 0.0% 0.0% 4.9 N/A
Campus Total 1,915.2 4,298.0 3,981.4 10,194.5 100.0% 33.5% 27.3 0.3% Percent of Campus Total 18.8% 42.2% 39.1% 100.0%
Source: Enrollment Bulletin, 2015/2016 EOY (Reporting Year)
AnnualSummer Fall Spring Campus Campus CW
West Campus 2014 2014 2015 FTE % of FTE % of FTE Nbr. Pct.
Advanced & Professional (Credit) 1,157.8 3,006.9 2,475.7 6,640.4 65.3% 21.9% 71.6 1.1% Post Sec Voc (PSV) 602.2 1,037.0 1,269.0 2,908.2 28.6% 9.6% 315.4 12.2% College Prep (Credit) 149.8 222.1 168.0 539.9 5.3% 1.8% -424.9 -44.0% Ed Prep Institute (Credit) 30.8 26.1 21.8 78.7 0.8% 0.3% -11.4 -12.7%
Total Credit 1,940.6 4,292.1 3,934.5 10,167.2 100.0% 33.6% -49.3 -0.5%
Post Sec Adult Voc (PSAV) 0.0 0.0 0.0 0.0 0.0% 0.0% 0.0 N/ACont WF Educ (CWE) 0.0 0.0 0.0 0.0 0.0% 0.0% 0.0 N/ALifelong Learning 0.0 0.0 0.0 0.0 0.0% 0.0% 0.0 N/A
Total Noncredit 0.0 0.0 0.0 0.0 0.0% 0.0% 0.0 N/A
Campus Total 1,940.6 4,292.1 3,934.5 10,167.2 100.0% 33.6% -49.3 -0.5% Percent of Campus Total 19.1% 42.2% 38.7% 100.0%
Source: Enrollment Bulletin, 2014/2015 EOY (Reporting Year)
AnnualSummer Fall Spring Campus Campus CW
West Campus 2013 2013 2014 FTE % of FTE % of FTE Nbr. Pct.
Advanced & Professional (Credit) 1,208.7 2,777.0 2,583.1 6,568.8 64.3% 21.9% -332.4 -4.8% Post Sec Voc (PSV) 581.5 1,012.1 999.2 2,592.8 25.4% 8.6% -23.1 -0.9% College Prep (Credit) 184.3 454.1 326.4 964.8 9.4% 3.2% -123.7 -11.4% Ed Prep Institute (Credit) 27.3 33.1 29.7 90.1 0.9% 0.3% -3.6 -3.8%
Total Credit 2,001.8 4,276.3 3,938.4 10,216.5 100.0% 34.0% -482.8 -4.5%
Post Sec Adult Voc (PSAV) 0.0 0.0 0.0 0.0 0.0% 0.0% 0.0 N/ACont WF Educ (CWE) 0.0 0.0 0.0 0.0 0.0% 0.0% 0.0 N/ALifelong Learning 0.0 0.0 0.0 0.0 0.0% 0.0% 0.0 N/A
Total Noncredit 0.0 0.0 0.0 0.0 0.0% 0.0% 0.0 N/A
Campus Total 2,001.8 4,276.3 3,938.4 10,216.5 100.0% 34.0% -482.8 -4.5% Percent of Campus Total 19.6% 41.9% 38.5% 100.0%
Source: Enrollment Bulletin, 2013/2014 EOY (Reporting Year)
West CampusFTE by Instructional Category & Term
2013/2014Annual Difference
2012/2013 - 2013/2014
2013/2014 - 2014/2015
Valencia CollegeWest Campus
FTE by Instructional Category & Term2014/2015
Annual Difference
2014/2015 - 2015/2016
Valencia CollegeWest Campus
FTE by Instructional Category & Term2015/2016
Annual Difference

Valencia CollegeInstitutional Research 4.41
Statistical History Fact Book2015/2016
AnnualSummer Fall Spring Campus Campus CW
East Campus 2015 2015 2016 FTE % of FTE % of FTE Nbr. Pct.
Advanced & Professional (Credit) 1,462.7 3,814.1 3,452.0 8,728.8 74.4% 28.7% -396.5 -4.3% Post Sec Voc (PSV) 496.9 1,100.7 1,056.1 2,653.7 22.6% 8.7% 323.1 13.9% College Prep (Credit) 59.4 185.8 110.4 355.6 3.0% 1.2% -121.1 -25.4% Ed Prep Institute (Credit) 0.0 0.0 0.0 0.0 0.0% 0.0% 0.0 N/A
Total Credit 2,019.0 5,100.6 4,618.5 11,738.1 100.0% 38.5% -194.5 -1.6%
Post Sec Adult Voc (PSAV) 0.0 0.0 0.0 0.0 0.0% 0.0% -105.6 -100.0% Cont WF Educ (CWE) 0.0 0.0 0.0 0.0 0.0% 0.0% 0.0 N/ALifelong Learning 0.0 0.0 0.0 0.0 0.0% 0.0% 0.0 N/A
Total Noncredit 0.0 0.0 0.0 0.0 0.0% 0.0% -105.6 -100.0%
Campus Total 2,019.0 5,100.6 4,618.5 11,738.1 100.0% 38.5% -300.1 -2.5%Percent of Campus Total 17% 43% 39% 100.0%
Source: Enrollment Bulletin, 2015/2016 EOY (Reporting Year)
AnnualSummer Fall Spring Campus Campus CW
East Campus 2014 2014 2015 FTE % of FTE % of FTE Nbr. Pct.
Advanced & Professional (Credit) 1,579.7 4,128.3 3,417.3 9,125.3 75.8% 30.1% 155.5 1.7% Post Sec Voc (PSV) 385.6 847.3 1,097.7 2,330.6 19.4% 7.7% 247.3 11.9% College Prep (Credit) 101.2 231.8 143.7 476.7 4.0% 1.6% -373.6 -43.9% Ed Prep Institute (Credit) 0.0 0.0 0.0 0.0 0.0% 0.0% 0.0 N/A
Total Credit 2,066.5 5,207.4 4,658.7 11,932.6 99.1% 39.4% 29.2 0.2%
Post Sec Adult Voc (PSAV) 56.6 49.0 0.0 105.6 0.9% 0.3% -143.4 -57.6% Cont WF Educ (CWE) 0.0 0.0 0.0 0.0 0.0% 0.0% 0.0 N/ALifelong Learning 0.0 0.0 0.0 0.0 0.0% 0.0% 0.0 N/A
Total Noncredit 56.6 49.0 0.0 105.6 0.9% 0.3% -143.4 -57.6%
Campus Total 2,123.1 5,256.4 4,658.7 12,038.2 100.0% 39.8% -114.2 -0.9%Percent of Campus Total 18% 44% 39% 100.0%
Source: Enrollment Bulletin, 2014/2015 EOY (Reporting Year)
AnnualSummer Fall Spring Campus Campus CW
East Campus 2013 2013 2014 FTE % of FTE % of FTE Nbr. Pct.
Advanced & Professional (Credit) 1,571.0 3,816.8 3,582.0 8,969.8 73.8% 29.9% -10.0 -0.1% Post Sec Voc (PSV) 403.0 858.3 822.0 2,083.3 17.1% 6.9% -26.8 -1.3% College Prep (Credit) 130.0 428.8 291.5 850.3 7.0% 2.8% -67.0 -7.3% Ed Prep Institute (Credit) 0.0 0.0 0.0 0.0 0.0% 0.0% 0.0 N/A
Total Credit 2,104.0 5,103.9 4,695.5 11,903.4 98.0% 39.6% -103.8 -0.9%
Post Sec Adult Voc (PSAV) 49.5 53.7 145.8 249.0 2.0% 0.8% 76.2 44.1% Cont WF Educ (CWE) 0.0 0.0 0.0 0.0 0.0% 0.0% 0.0 N/ALifelong Learning 0.0 0.0 0.0 0.0 0.0% 0.0% 0.0 N/A
Total Noncredit 49.5 53.7 145.8 249.0 2.0% 0.8% 76.2 44.1%
Campus Total 2,153.5 5,157.6 4,841.3 12,152.4 100.0% 40.5% -27.6 -0.2% Percent of Campus Total 18% 42% 40% 100.0%
Source: Enrollment Bulletin, 2013/2014 EOY (Reporting Year)
2014/2015 - 2015/2016
Valencia CollegeEast Campus
FTE by Instructional Category & Term2015/2016
Annual Difference
2012/2013 - 2013/2014
Valencia CollegeEast Campus
FTE by Instructional Category & Term2013/2014
Annual Difference
2013/2014 - 2014/2015
Valencia CollegeEast Campus
FTE by Instructional Category & Term2014/2015
Annual Difference
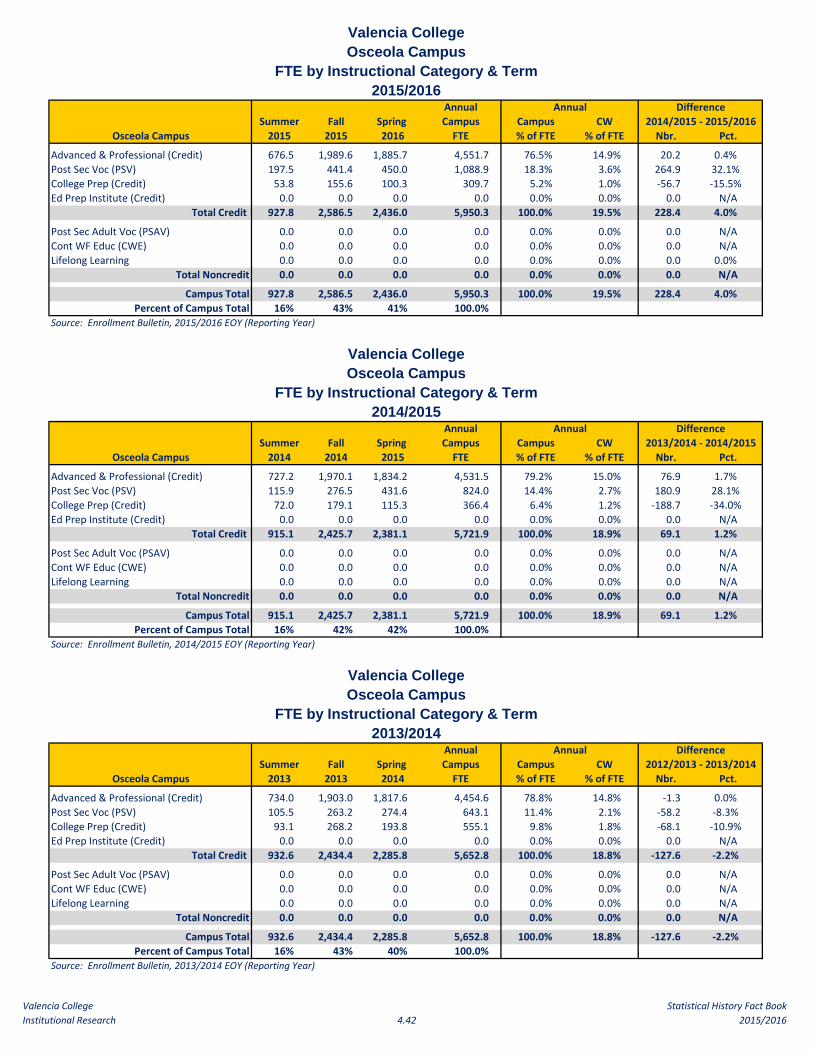
Valencia CollegeInstitutional Research 4.42
Statistical History Fact Book2015/2016
AnnualSummer Fall Spring Campus Campus CW
Osceola Campus 2015 2015 2016 FTE % of FTE % of FTE Nbr. Pct.
Advanced & Professional (Credit) 676.5 1,989.6 1,885.7 4,551.7 76.5% 14.9% 20.2 0.4% Post Sec Voc (PSV) 197.5 441.4 450.0 1,088.9 18.3% 3.6% 264.9 32.1% College Prep (Credit) 53.8 155.6 100.3 309.7 5.2% 1.0% -56.7 -15.5% Ed Prep Institute (Credit) 0.0 0.0 0.0 0.0 0.0% 0.0% 0.0 N/A
Total Credit 927.8 2,586.5 2,436.0 5,950.3 100.0% 19.5% 228.4 4.0%
Post Sec Adult Voc (PSAV) 0.0 0.0 0.0 0.0 0.0% 0.0% 0.0 N/ACont WF Educ (CWE) 0.0 0.0 0.0 0.0 0.0% 0.0% 0.0 N/ALifelong Learning 0.0 0.0 0.0 0.0 0.0% 0.0% 0.0 0.0%
Total Noncredit 0.0 0.0 0.0 0.0 0.0% 0.0% 0.0 N/A
Campus Total 927.8 2,586.5 2,436.0 5,950.3 100.0% 19.5% 228.4 4.0% Percent of Campus Total 16% 43% 41% 100.0%
Source: Enrollment Bulletin, 2015/2016 EOY (Reporting Year)
AnnualSummer Fall Spring Campus Campus CW
Osceola Campus 2014 2014 2015 FTE % of FTE % of FTE Nbr. Pct.
Advanced & Professional (Credit) 727.2 1,970.1 1,834.2 4,531.5 79.2% 15.0% 76.9 1.7% Post Sec Voc (PSV) 115.9 276.5 431.6 824.0 14.4% 2.7% 180.9 28.1% College Prep (Credit) 72.0 179.1 115.3 366.4 6.4% 1.2% -188.7 -34.0% Ed Prep Institute (Credit) 0.0 0.0 0.0 0.0 0.0% 0.0% 0.0 N/A
Total Credit 915.1 2,425.7 2,381.1 5,721.9 100.0% 18.9% 69.1 1.2%
Post Sec Adult Voc (PSAV) 0.0 0.0 0.0 0.0 0.0% 0.0% 0.0 N/ACont WF Educ (CWE) 0.0 0.0 0.0 0.0 0.0% 0.0% 0.0 N/ALifelong Learning 0.0 0.0 0.0 0.0 0.0% 0.0% 0.0 N/A
Total Noncredit 0.0 0.0 0.0 0.0 0.0% 0.0% 0.0 N/A
Campus Total 915.1 2,425.7 2,381.1 5,721.9 100.0% 18.9% 69.1 1.2% Percent of Campus Total 16% 42% 42% 100.0%
Source: Enrollment Bulletin, 2014/2015 EOY (Reporting Year)
AnnualSummer Fall Spring Campus Campus CW
Osceola Campus 2013 2013 2014 FTE % of FTE % of FTE Nbr. Pct.
Advanced & Professional (Credit) 734.0 1,903.0 1,817.6 4,454.6 78.8% 14.8% -1.3 0.0% Post Sec Voc (PSV) 105.5 263.2 274.4 643.1 11.4% 2.1% -58.2 -8.3% College Prep (Credit) 93.1 268.2 193.8 555.1 9.8% 1.8% -68.1 -10.9% Ed Prep Institute (Credit) 0.0 0.0 0.0 0.0 0.0% 0.0% 0.0 N/A
Total Credit 932.6 2,434.4 2,285.8 5,652.8 100.0% 18.8% -127.6 -2.2%
Post Sec Adult Voc (PSAV) 0.0 0.0 0.0 0.0 0.0% 0.0% 0.0 N/ACont WF Educ (CWE) 0.0 0.0 0.0 0.0 0.0% 0.0% 0.0 N/ALifelong Learning 0.0 0.0 0.0 0.0 0.0% 0.0% 0.0 N/A
Total Noncredit 0.0 0.0 0.0 0.0 0.0% 0.0% 0.0 N/A
Campus Total 932.6 2,434.4 2,285.8 5,652.8 100.0% 18.8% -127.6 -2.2% Percent of Campus Total 16% 43% 40% 100.0%
Source: Enrollment Bulletin, 2013/2014 EOY (Reporting Year)
2014/2015 - 2015/2016
Valencia CollegeOsceola Campus
FTE by Instructional Category & Term2015/2016
Annual Difference
2012/2013 - 2013/2014
Valencia CollegeOsceola Campus
FTE by Instructional Category & Term2013/2014
Annual Difference
2013/2014 - 2014/2015
Valencia CollegeOsceola Campus
FTE by Instructional Category & Term2014/2015
Annual Difference

Valencia CollegeInstitutional Research 4.43
Statistical History Fact Book2015/2016
AnnualSummer Fall Spring Campus Campus CW
Winter Park Campus 2015 2015 2016 FTE % of FTE % of FTE Nbr. Pct.
Advanced & Professional (Credit) 202.8 496.9 400.2 1,099.9 88.4% 3.6% -54.6 -4.7% Post Sec Voc (PSV) 26.5 43.9 44.5 114.9 9.2% 0.4% 46.0 66.8% College Prep (Credit) 4.7 15.2 10.0 29.9 2.4% 0.1% -21.3 -41.7% Ed Prep Institute (Credit) 0.0 0.0 0.0 0.0 0.0% 0.0% 0.0 N/A
Total Credit 234.0 556.0 454.7 1,244.7 100.0% 4.1% -29.9 -2.3%
Post Sec Adult Voc (PSAV) 0.0 0.0 0.0 0.0 0.0% 0.0% 0.0 N/ACont WF Educ (CWE) 0.0 0.0 0.0 0.0 0.0% 0.0% -12.1 -100.0% Lifelong Learning 0.0 0.0 0.0 0.0 0.0% 0.0% 0.0 N/A
Total Noncredit 0.0 0.0 0.0 0.0 0.0% 0.0% -12.1 -100.0%
Campus Total 234.0 556.0 454.7 1,244.7 100.0% 4.1% -42.0 -3.3% Percent of Campus Total 18.8% 44.7% 36.5% 100.0%
Source: Enrollment Bulletin, 2015/2016 EOY (Reporting Year)
AnnualSummer Fall Spring Campus Campus CW
Winter Park Campus 2014 2014 2015 FTE % of FTE % of FTE Nbr. Pct.
Advanced & Professional (Credit) 222.1 502.5 429.9 1,154.5 89.7% 3.8% 83.4 7.8% Post Sec Voc (PSV) 9.8 24.4 34.7 68.9 5.4% 0.2% 29.2 73.6% College Prep (Credit) 12.8 25.6 12.8 51.2 4.0% 0.2% -40.4 -44.1% Ed Prep Institute (Credit) 0.0 0.0 0.0 0.0 0.0% 0.0% 0.0 N/A
Total Credit 244.7 552.5 477.4 1,274.6 99.1% 4.2% 72.2 6.0%
Post Sec Adult Voc (PSAV) 0.0 0.0 0.0 0.0 0.0% 0.0% 0.0 N/ACont WF Educ (CWE) 12.1 0.0 0.0 12.1 0.9% 0.0% -2.0 -14.2% Lifelong Learning 0.0 0.0 0.0 0.0 0.0% 0.0% 0.0 N/A
Total Noncredit 12.1 0.0 0.0 12.1 0.9% 0.0% -2.0 -14.2%
Campus Total 256.8 552.5 477.4 1,286.7 100.0% 4.3% 70.2 5.8% Percent of Campus Total 20.0% 42.9% 37.1% 100.0%
Source: Enrollment Bulletin, 2014/2015 EOY (Reporting Year)
AnnualSummer Fall Spring Campus Campus CW
Winter Park Campus 2013 2013 2014 FTE % of FTE % of FTE Nbr. Pct.
Advanced & Professional (Credit) 200.6 453.7 416.8 1,071.1 88.0% 3.6% -0.9 -0.1% Post Sec Voc (PSV) 1.4 21.9 16.4 39.7 3.3% 0.1% 1.2 3.1% College Prep (Credit) 11.2 48.0 32.4 91.6 7.5% 0.3% -14.4 -13.6% Ed Prep Institute (Credit) 0.0 0.0 0.0 0.0 0.0% 0.0% 0.0 N/A
Total Credit 213.2 523.6 465.6 1,202.4 98.8% 4.0% -14.1 -1.2%
Post Sec Adult Voc (PSAV) 0.0 0.0 0.0 0.0 0.0% 0.0% 0.0 N/ACont WF Educ (CWE) 0.0 0.0 14.1 14.1 1.2% 0.0% -6.6 -31.9% Lifelong Learning 0.0 0.0 0.0 0.0 0.0% 0.0% 0.0 N/A
Total Noncredit 0.0 0.0 14.1 14.1 1.2% 0.0% -6.6 -31.9%
Campus Total 213.2 523.6 479.7 1,216.5 100.0% 4.1% -20.7 -1.7% Percent of Campus Total 17.5% 43.0% 39.4% 100.0%
Source: Enrollment Bulletin, 2013/2014 EOY (Reporting Year)
2014/2015 - 2015/2016
Valencia CollegeWinter Park Campus
FTE by Instructional Category & Term2015/2016
Annual Difference
2012/2013 - 2013/2014
Valencia CollegeWinter Park Campus
FTE by Instructional Category & Term2013/2014
Annual Difference
2013/2014 - 2014/2015
Valencia CollegeWinter Park Campus
FTE by Instructional Category & Term2014/2015
Annual Difference

Valencia CollegeInstitutional Research 4.44
Statistical History Fact Book2015/2016
AnnualSummer Fall Spring Campus Campus CW
Lake Nona Campus 2015 2015 2016 FTE % of FTE % of FTE Nbr. Pct.
Advanced & Professional (Credit) 135.1 356.9 321.5 813.5 81.5% 2.7% 26.4 3.4% Post Sec Voc (PSV) 31.2 65.1 54.6 150.8 15.1% 0.5% 82.7 121.5% College Prep (Credit) 4.7 17.7 11.2 33.6 3.4% 0.1% -9.4 -21.9% Ed Prep Institute (Credit) 0.0 0.0 0.0 0.0 0.0% 0.0% 0.0 N/A
Total Credit 171.0 439.7 387.2 997.9 100.0% 3.3% 99.7 11.1%
Post Sec Adult Voc (PSAV) 0.0 0.0 0.0 0.0 0.0% 0.0% 0.0 N/ACont WF Educ (CWE) 0.0 0.0 0.0 0.0 0.0% 0.0% 0.0 N/ALifelong Learning 0.0 0.0 0.0 0.0 0.0% 0.0% 0.0 N/A
Total Noncredit 0.0 0.0 0.0 0.0 0.0% 0.0% 0.0 N/A
Campus Total 171.0 439.7 387.2 997.9 100.0% 3.3% 99.7 11.1% Percent of Campus Total 17.1% 44.1% 38.8% 100.0%
Source: Enrollment Bulletin, 2015/2016 EOY (Reporting Year)
AnnualSummer Fall Spring Campus Campus CW
Lake Nona Campus 2014 2014 2015 FTE % of FTE % of FTE Nbr. Pct.
Advanced & Professional (Credit) 142.0 374.0 271.1 787.1 87.6% 2.6% 87.3 12.5% Post Sec Voc (PSV) 0.0 11.4 56.7 68.1 7.6% 0.2% 48.8 252.8% College Prep (Credit) 7.8 21.0 14.2 43.0 4.8% 0.1% -33.1 -43.5% Ed Prep Institute (Credit) 0.0 0.0 0.0 0.0 0.0% 0.0% 0.0 N/A
Total Credit 149.8 406.4 342.0 898.2 100.0% 3.0% 103.0 13.0%
Post Sec Adult Voc (PSAV) 0.0 0.0 0.0 0.0 0.0% 0.0% 0.0 N/ACont WF Educ (CWE) 0.0 0.0 0.0 0.0 0.0% 0.0% 0.0 N/ALifelong Learning 0.0 0.0 0.0 0.0 0.0% 0.0% 0.0 N/A
Total Noncredit 0.0 0.0 0.0 0.0 0.0% 0.0% 0.0 N/A
Campus Total 149.8 406.4 342.0 898.2 100.0% 3.0% 103.0 13.0% Percent of Campus Total 16.7% 45.2% 38.1% 100.0%
Source: Enrollment Bulletin, 2014/2015 EOY (Reporting Year)
AnnualSummer Fall Spring Campus Campus CW
Lake Nona Campus 2013 2013 2014 FTE % of FTE % of FTE Nbr. Pct.
Advanced & Professional (Credit) 95.2 306.0 298.6 699.8 88.0% 2.3% 133.9 23.7% Post Sec Voc (PSV) 0.0 8.4 10.9 19.3 2.4% 0.1% 10.1 109.8% College Prep (Credit) 4.4 40.2 31.5 76.1 9.6% 0.3% 25.2 49.5% Ed Prep Institute (Credit) 0.0 0.0 0.0 0.0 0.0% 0.0% 0.0 N/A
Total Credit 99.6 354.6 341.0 795.2 100.0% 2.6% 169.2 27.0%
Post Sec Adult Voc (PSAV) 0.0 0.0 0.0 0.0 0.0% 0.0% 0.0 N/ACont WF Educ (CWE) 0.0 0.0 0.0 0.0 0.0% 0.0% 0.0 N/ALifelong Learning 0.0 0.0 0.0 0.0 0.0% 0.0% 0.0 N/A
Total Noncredit 0.0 0.0 0.0 0.0 0.0% 0.0% 0.0 N/A
Campus Total 99.6 354.6 341.0 795.2 100.0% 2.6% 169.2 27.0% Percent of Campus Total 12.5% 44.6% 42.9% 100.0%
Source: Enrollment Bulletin, 2013/2014 EOY (Reporting Year)
Annual
Difference
2014/2015 - 2015/2016
2013/2014 - 2014/2015
Valencia CollegeLake Nona Campus
FTE by Instructional Category & Term2014/2015
Difference
2012/2013 - 2013/2014
Valencia CollegeLake Nona Campus
Valencia CollegeLake Nona Campus
FTE by Instructional Category & Term2015/2016
Annual Difference
FTE by Instructional Category & Term2013/2014
Annual
Valencia CollegeInstitutional Research 4.45
Statistical History Fact Book2015/2016
AnnualSummer Fall Spring Campus Campus CW
Poinciana Campus 2015 2015 2016 FTE % of FTE % of FTE Nbr. Pct.
Advanced & Professional (Credit) 0.0 5.0 3.2 8.2 82.6% 0.0% -7.4 -47.4% Post Sec Voc (PSV) 0.0 0.0 0.0 0.0 0.0% 0.0% 0.0 N/ACollege Prep (Credit) 0.0 1.7 0.0 1.7 17.4% 0.0% 1.7 N/AEd Prep Institute (Credit) 0.0 0.0 0.0 0.0 0.0% 0.0% 0.0 N/A
Total Credit 0.0 6.7 3.2 9.9 100.0% 0.0% -5.7 -36.3%
Post Sec Adult Voc (PSAV) 0.0 0.0 0.0 0.0 0.0% 0.0% 0.0 N/ACont WF Educ (CWE) 0.0 0.0 0.0 0.0 0.0% 0.0% 0.0 N/ALifelong Learning 0.0 0.0 0.0 0.0 0.0% 0.0% 0.0 N/A
Total Noncredit 0.0 0.0 0.0 0.0 0.0% 0.0% 0.0 N/A
Campus Total 0.0 6.7 3.2 9.9 100.0% 0.0% -5.7 -36.3% Percent of Campus Total 0.0% 67.8% 32.2% 100.0%
Source: Enrollment Bulletin, 2015/2016 EOY (Reporting Year)
AnnualSummer Fall Spring Campus Campus CW
Poinciana Campus 2014 2014 2015 FTE % of FTE % of FTE Nbr. Pct.
Advanced & Professional (Credit) 0.0 8.4 7.2 15.6 100.0% 0.1% 15.6 N/APost Sec Voc (PSV) 0.0 0.0 0.0 0.0 0.0% 0.0% 0.0 N/ACollege Prep (Credit) 0.0 0.0 0.0 0.0 0.0% 0.0% 0.0 N/AEd Prep Institute (Credit) 0.0 0.0 0.0 0.0 0.0% 0.0% 0.0 N/A
Total Credit 0.0 8.4 7.2 15.6 100.0% 0.1% 15.6 N/A
Post Sec Adult Voc (PSAV) 0.0 0.0 0.0 0.0 0.0% 0.0% 0.0 N/ACont WF Educ (CWE) 0.0 0.0 0.0 0.0 0.0% 0.0% 0.0 N/ALifelong Learning 0.0 0.0 0.0 0.0 0.0% 0.0% 0.0 N/A
Total Noncredit 0.0 0.0 0.0 0.0 0.0% 0.0% 0.0 N/A
Campus Total 0.0 8.4 7.2 15.6 100.0% 0.1% 15.6 N/APercent of Campus Total 0.0% 53.8% 46.2% 100.0%
Source: Enrollment Bulletin, 2014/2015 EOY (Reporting Year)
AnnualSummer Fall Spring Campus Campus CW
Poinciana Campus 2013 2013 2014 FTE % of FTE % of FTE Nbr. Pct.
Advanced & Professional (Credit) 0.0 0.0 0.0 0.0 N/A 0.0% 0.0 N/APost Sec Voc (PSV) 0.0 0.0 0.0 0.0 N/A 0.0% 0.0 N/ACollege Prep (Credit) 0.0 0.0 0.0 0.0 N/A 0.0% 0.0 N/AEd Prep Institute (Credit) 0.0 0.0 0.0 0.0 N/A 0.0% 0.0 N/A
Total Credit 0.0 0.0 0.0 0.0 N/A 0.0% 0.0 N/A
Post Sec Adult Voc (PSAV) 0.0 0.0 0.0 0.0 N/A 0.0% 0.0 N/ACont WF Educ (CWE) 0.0 0.0 0.0 0.0 N/A 0.0% 0.0 N/ALifelong Learning 0.0 0.0 0.0 0.0 N/A 0.0% 0.0 N/ATotal Noncredit 0.0 0.0 0.0 0.0 N/A 0.0% 0.0 N/A
Campus Total 0.0 0.0 0.0 0.0 N/A 0.0% 0.0 N/APercent of Campus Total N/A N/A N/A N/A
Source: Enrollment Bulletin, 2013/2014 EOY
2014/2015 - 2015/2016
Valencia CollegePoinciana
FTE by Instructional Category & Term2015/2016
Annual Difference
Difference2013/2014 - 2014/2015
Valencia CollegePoinciana
FTE by Instructional Category & Term2014/2015
Annual
2010/2011 - 2011/2012
Valencia CollegePoinciana
FTE by Instructional Category & Term2013/2014
Annual Difference

Valencia CollegeInstitutional Research 4.46
Statistical History Fact Book2015/2016
AnnualSummer Fall Spring Campus Campus CW
School of Public Safety 2015 2015 2016 FTE % of FTE % of FTE Nbr. Pct.
Advanced & Professional (Credit) 0.0 0.0 0.0 0.0 N/A 0.0% 0.0 N/APost Sec Voc (PSV) 5.7 12.2 10.9 28.8 N/A 0.1% 28.8 N/ACollege Prep (Credit) 0.0 0.0 125.7 125.7 N/A 0.4% 125.7 N/AEd Prep Institute (Credit) 0.0 0.0 0.0 0.0 N/A 0.0% 0.0 N/A
Total Credit 5.7 12.2 136.5 154.5 N/A 0.5% 154.5 N/APost Sec Adult Voc (PSAV) 69.6 69.3 0.0 138.9 N/A 0.5% 138.9 N/ACont WF Educ (CWE) 0.0 10.1 18.4 28.5 N/A 0.1% 28.5 N/ALifelong Learning 0.0 0.0 0.0 0.0 N/A 0.0% 0.0 N/A
Total Noncredit 69.6 79.4 18.4 167.5 N/A 0.5% 167.5 N/ACampus Total 75.3 91.6 155.0 321.9 N/A 1.1% 321.9 N/A
Percent of Campus Total 23.4% 28.5% 48.1% 100.0%Source: Enrollment Bulletin, 2015/2016 EOY (Reporting Year)
2014/2015 - 2015/2016
Valencia CollegeSchool of Public Safety
FTE by Instructional Category & Term2015/2016
Annual Difference
Valencia College
Completers
Degree and Certificate Programs
2013/2014 to 2015/2016
Source: Completions 5_1 13SEP16
Difference
2014/2015 - 2015/2016
Degree Program 2013/2014 2014/2015 2015/2016 Nbr. Pct.
Total Graduates
BS, AA, AAS, and AS/PSV 7,411 7,704 7,487 -217 -2.8%
Total Completers
Certificate Programs 4,102 4,371 4,906 535 12.2%
Total Combined
Associate Programs & Certificate Programs 11,513 12,075 12,393 318 2.6%
Total Bachelors of Science 8 31 62 31 100.0%
BS Electrical and Computer Eng 0 9 21 12 133.3%
Radiology and Imaging Science 8 13 29 16 123.1%
Cardiopulmonary Science 0 9 12 3 33.3%
Total Associate In Arts 6,128 6,227 6,033 -194 -3.1%
Total Associate In Arts 6,128 6,227 6,033 -194 -3.1%
Total Postsecondary Vocational/AAS 12 7 4 -3 -42.9%
Business Administration 5 3 0 -3 -100.0%
Criminal Justice Technology 3 3 0 -3 -100.0%
Hospitality & Tourism Management 4 1 4 3 300.0%
Total Postsecondary Vocational/AS 1,263 1,439 1,388 -51 -3.5%
Accounting Technology 39 37 30 -7 -18.9%
Baking & Pastry Management 24 32 36 4 12.5%
Building Construction Technology 9 12 11 -1 -8.3%
Business Administration 152 193 189 -4 -2.1%
Cardiovascular/Cardiopulmonary 5 7 11 4 57.1%
Civil Engineering Technology 3 6 7 1 16.7%
Computer Engineering Technology 53 21 6 -15 -71.4%
Computer Information Administration 40 67 75 8 11.9%
Computer Programming & Analysis 48 54 58 4 7.4%
Criminal Justice Technology 108 90 85 -5 -5.6%
Culinary Management 27 36 28 -8 -22.2%
Dental Hygiene 23 19 17 -2 -10.5%
Diagnostic Medical Sonography 10 9 8 -1 -11.1%
Digital/Multimedia Technology 9 11 10 -1 -9.1%
Drafting & Design Technology 20 19 15 -4 -21.1%
Electronics Engineering Technology 30 41 29 -12 -29.3%
Emergency Medical Services-Associates Degree 43 44 24 -20 -45.5%
Film Production Technology 40 42 43 1 2.4%
Fire Science Technology 0 20 23 3 15.0%
Graphics Technology 39 42 33 -9 -21.4%
Health Information Technology 0 0 19 19 NA
Hospitality & Tourism Management 46 59 72 13 22.0%
Industrial Management Technology 8 6 11 5 83.3%
Landscape & Horticulture Technology 5 11 5 -6 -54.5%
Marketing Management 0 22 12 -10 -45.5%
Music Production Technology 38 31 42 11 35.5%
Network Systems Technology 0 51 46 -5 -9.8%
Nursing 208 218 222 4 1.8%
Office Administration 121 121 114 -7 -5.8%
Valencia College
Institutional Research 5.1Statistical History Fact Book
2015/2016

Valencia College
Completers
Degree and Certificate Programs
2013/2014 to 2015/2016
Source: Completions 5_1 13SEP16
Difference
2014/2015 - 2015/2016
Degree Program 2013/2014 2014/2015 2015/2016 Nbr. Pct.
Total Graduates
BS, AA, AAS, and AS/PSV 7,411 7,704 7,487 -217 -2.8%
Total Completers
Certificate Programs 4,102 4,371 4,906 535 12.2%
Total Combined
Associate Programs & Certificate Programs 11,513 12,075 12,393 318 2.6%
Paralegal Studies 57 50 48 -2 -4.0%
Radiography 23 26 20 -6 -23.1%
Respiratory Care 23 23 23 0 0.0%
Restaurant Management 5 8 9 1 12.5%
Theater & Entertainment Technology 7 11 7 -4 -36.4%
Total Post Secondary Adult Vocational Certificates 231 322 375 53 16.5%
Correctional Officer 73 69 86 17 24.6%
Law Enforcement Officer 158 131 155 24 18.3%
Aux. Law Enforcement Officer 0 10 0 -10 -100.0%
Fire Fighter 0 69 79 10 14.5%
Fire Apparatus Operator 0 43 55 12 27.9%
Total Post Secondary Vocational Certificates 3,613 3,766 4,203 437 11.6%
Advanced Network Infrastructure 0 28 30 2 7.1%
Accounting Technology Management 18 23 23 0 0.0%
Accounting Technology Operations 0 54 57 3 5.6%
Accounting Technology Specialist 0 60 61 1 1.7%
Advanced Electronic Technician 0 0 26 26 NA
Advanced Network Administration 0 19 24 5 26.3%
Audio Technology 23 15 13 -2 -13.3%
Autocad Foundations Technology 52 61 59 -2 -3.3%
Baking & Pastry Arts 72 33 28 -5 -15.2%
Basic Electronics Technician 78 37 48 11 29.7%
Broadcast Production 0 0 1 1 NA
Building Construction Specialist 13 6 0 -6 -100.0%
Business Management 336 366 374 8 2.2%
Business Operations 476 419 426 7 1.7%
Business Specialist 730 671 678 7 1.0%
Chef Apprentice 59 49 53 4 8.2%
Cisco CCNA Certificate 49 37 0 -37 -100.0%
Computer Programming 37 52 55 3 5.8%
Computer Programming Specialist 108 108 147 39 36.1%
Criminal Justice Technology Specialist 0 2 2 0 0.0%
Culinary Arts 33 33 27 -6 -18.2%
Culinary Arts Management Support 45 42 42 0 0.0%
Digital Forensics 0 0 4 4 NA
Digital Multimedia Authoring Development 13 4 1 -3 -75.0%
Digital Multimedia Video Production 3 16 14 -2 -12.5%
Digital Video Fundamentals 13 16 11 -5 -31.3%
Drafting 44 41 41 0 0.0%
Electrical Eng Robotics and Mechanics 0 0 7 7 NA
Entrepreneurship 0 0 6 6 NA
Valencia College
Institutional Research 5.2Statistical History Fact Book
2015/2016

Valencia College
Completers
Degree and Certificate Programs
2013/2014 to 2015/2016
Source: Completions 5_1 13SEP16
Difference
2014/2015 - 2015/2016
Degree Program 2013/2014 2014/2015 2015/2016 Nbr. Pct.
Total Graduates
BS, AA, AAS, and AS/PSV 7,411 7,704 7,487 -217 -2.8%
Total Completers
Certificate Programs 4,102 4,371 4,906 535 12.2%
Total Combined
Associate Programs & Certificate Programs 11,513 12,075 12,393 318 2.6%
Event Planning Management 20 15 15 0 0.0%
Film Production Fundamentals 7 4 6 2 50.0%
Fire Company Management 0 6 7 1 16.7%
Fire Instructor 0 7 1 -6 -85.7%
Fire Investigator I 0 2 2 0 0.0%
Fire Safety Inspector I 0 9 2 -7 -77.8%
Fire Safety Inspector II 0 1 1 0 0.0%
Fire Officer I 0 21 8 -13 -61.9%
Fire Officer II 0 2 0 -2 -100.0%
Fire Officer Supervisor 0 0 17 17 NA
Food & Beverages Management 65 78 111 33 42.3%
Graphic Design Support 0 59 58 -1 -1.7%
Graphics Design Production 60 49 41 -8 -16.3%
Guest Services Specialist 80 127 136 9 7.1%
Homeland Law Enforcement 0 0 36 36 NA
Homeland Security Specialist 21 29 21 -8 -27.6%
Information Technology Analyst 7 16 14 -2 -12.5%
Information Technology Support 75 82 101 19 23.2%
Information Technology Technician 19 10 0 -10 -100.0%
Interactive Media Production 17 4 33 29 725.0%
Interactive Media Support 79 73 60 -13 -17.8%
International Business Special 0 0 1 1 NA
Landscape & Horticulture Professional 9 8 3 -5 -62.5%
Landscape & Horticulture Specialist 9 9 3 -6 -66.7%
Landscape & Horticulture Technology 13 8 6 -2 -25.0%
Laser & Photonics Technician 17 14 17 3 21.4%
Medical Information Coder/Biller 81 47 14 -33 -70.2%
Medical Office Management 17 17 9 -8 -47.1%
Microcomputer Repair/Installer 100 94 14 -80 -85.1%
Network Administration 0 31 32 1 3.2%
Network Infrastructure 0 43 32 -11 -25.6%
Network Security 0 24 23 -1 -4.2%
Network Support Technician 0 67 68 1 1.5%
Office Management 23 31 15 -16 -51.6%
Office Specialist 98 123 49 -74 -60.2%
Office Support 310 225 129 -96 -42.7%
Operations Support and Service 0 0 648 648 NA
Paramedic 69 65 50 -15 -23.1%
Rapid Prototyping Specialist 0 8 10 2 25.0%
Rooms Division Management 52 51 56 5 9.8%
Stage Technology 110 82 82 0 0.0%
Video Editing & Postproduction 5 7 9 2 28.6%
Web Production 9 1 0 -1 -100.0%
Valencia College
Institutional Research 5.3Statistical History Fact Book
2015/2016

Valencia College
Completers
Degree and Certificate Programs
2013/2014 to 2015/2016
Source: Completions 5_1 13SEP16
Difference
2014/2015 - 2015/2016
Degree Program 2013/2014 2014/2015 2015/2016 Nbr. Pct.
Total Graduates
BS, AA, AAS, and AS/PSV 7,411 7,704 7,487 -217 -2.8%
Total Completers
Certificate Programs 4,102 4,371 4,906 535 12.2%
Total Combined
Associate Programs & Certificate Programs 11,513 12,075 12,393 318 2.6%
Webcast Media 0 0 1 1 NA
Wireless & IP Communication Technology 39 25 4 -21 -84.0%
Applied Technical Certificate 33 46 43 -3 -6.5%
Radiography 33 46 43 -3 -6.5%
Applied Technical Diploma 149 182 188 6 3.3%
Emergency Medical Technician 149 182 188 6 3.3%
EPI Certificates 76 55 97 42 76.4%
Educator Preparation Institute 76 55 97 42 76.4%
Valencia College
Institutional Research 5.4Statistical History Fact Book
2015/2016

Valencia College
Completer Placement Rates
by Degree and Certificate Programs
2011/2012 - 2013/2014Note: This table does NOT include all program completers
Placement rates are based solely on those students located by FETPIP
Source: AA-2 Follow-Up Reports (12/12/2013 ,11/21/2014 , 11/23/15)
2012 Accountability Report Measure 3 Part 2
2011/2012 2012/2013 2013/2014
Plcmt Pool Placed Pct. Plcmt Pool Placed Pct. Plcmt Pool Placed Pct.
Total Associate in Arts 5,948 4,809 80.9% 5,302 4,398 82.9% 5,559 4,544 81.7%
Total Associate in Science & AAS 1,065 1,001 94.0% 1,034 960 92.8% 970 937 96.6%
Total ATC, ATD, PSVC, & PSAV 3,292 3,151 95.7% 2,940 2,863 97.4% 3,420 3,326 97.3%
Business Administration 25 25 100.0% 32 32 100.0% - - NA
Criminal Justice Technology 9 8 88.9% 7 7 100.0% - - NA
Hospitality & Tourism Management 2 2 100.0% 3 3 100.0% - - NA
AAS 36 35 97.2% 42 42 100.0% 0 0 NA
Accounting Technology 30 30 100.0% 29 29 100.0% 31 31 100.0%
Baking & Pastry Management 25 22 88.0% 5 5 100.0% 18 17 94.4%
Building Construction Technology 9 8 88.9% 13 10 76.9% 8 6 75.0%
Business Administration 96 96 100.0% 107 107 100.0% 132 132 100.0%
Cardiovascular/Cardiopulmonary Technology 7 7 100.0% 5 5 100.0% 4 4 100.0%
Civil Engineering Technology 9 9 100.0% 20 16 80.0% 2 2 100.0%
Computer Engineering Technology 53 44 83.0% 49 41 83.7% 25 25 100.0%
Computer Information Technology 32 32 100.0% 32 28 87.5% 28 28 100.0%
Computer Programming And Analysis 35 32 91.4% 38 36 94.7% 32 32 100.0%
Criminal Justice Technology 69 64 92.8% 93 87 93.5% 82 82 100.0%
Culinary Management 25 23 92.0% 16 14 87.5% 17 16 94.1%
Dental Hygiene 14 14 100.0% 14 13 92.9% 21 21 100.0%
Diagnostic Medical Sonography Technology 9 9 100.0% 6 6 100.0% 1 1 100.0%
Digital Media/Multimedia Technology 6 5 83.3% 2 1 50.0% 6 6 100.0%
Drafting & Design Technology 18 14 77.8% 6 4 66.7% 13 10 76.9%
Electronics Engineering Technology 16 15 93.8% 23 23 100.0% 19 19 100.0%
Emergency Medical Services 39 37 93.8% 32 32 100.0% 35 34 97.1%
Entertainment Design Technology 7 6 85.7% - - NA - - NA
Film Production Technology 22 14 63.6% 22 18 81.8% 23 17 73.9%
Fire Science Technology (FESHE MODEL) - - NA - - NA 7 7 100.0%
Graphics Technology 32 21 65.6% 21 14 66.7% 16 9 56.3%
Hospitality & Tourism Management 33 33 100.0% 23 23 100.0% 39 39 100.0%
Industrial Management Technology 3 3 100.0% 3 3 100.0% 6 5 83.3%
Landscape & Horticulture Technology 1 1 100.0% 1 1 100.0% 3 2 66.7%
Music Production Technology - - NA 24 10 41.7% 20 13 65.0%
Nursing RN (Associate's Degree) 244 237 97.1% 229 225 98.3% 197 195 99.0%
Office Administration 91 91 100.0% 86 85 98.8% 100 100 100.0% Paralegal (Legal Assisting) 40 39 97.5% 46 40 87.0% 39 38 97.4%
Radiography 28 28 100.0% 17 16 94.1% 20 20 100.0%
Respiratory Care 15 13 86.7% 20 19 95.0% 19 19 100.0%
Restaurant Management 3 3 100.0% 1 1 100.0% 3 3 100.0%
Sound and Music technology 18 16 88.9% - - NA 4 4 100.0%
Theater And Entertainment Technology - - NA 9 6 66.7% 0 0 0.0% Total Associate in Arts/
PostSecondary Vocational (AS/PSV) 1,029 966 93.9% 992 918 92.5% 970 937 96.6%
Radiography (ATC) 16 15 93.8% 10 10 100.0% 30 27 90.0% Respiratory Care (ATC) - - NA - - NA - - NA
Applied Technical Certificate (ATC) 16 15 93.8% 10 10 100.0% 30 27 90.0%
Emergency Medical Technician 152 129 84.9% 146 135 92.5% 126 112 88.9%
Applied Technical Diploma (ATD) 152 129 84.9% 146 135 92.5% 126 112 88.9%
Degree Program
Valencia College
Institutional Research 5.5Statistical History Fact Book
2015/2016

Valencia College
Completer Placement Rates
by Degree and Certificate Programs
2011/2012 - 2013/2014Note: This table does NOT include all program completers
Placement rates are based solely on those students located by FETPIP
Source: AA-2 Follow-Up Reports (12/12/2013 ,11/21/2014 , 11/23/15)
2012 Accountability Report Measure 3 Part 2
2011/2012 2012/2013 2013/2014
Plcmt Pool Placed Pct. Plcmt Pool Placed Pct. Plcmt Pool Placed Pct.Degree Program
Accounting Technology Management 27 27 100.0% 26 26 100.0% 15 15 100.0%
Accounting Technology Operations - - NA - - NA 46 46 100.0%
Accounting Technology Specialist - - NA - - NA 47 47 100.0%
Advanced Network Infrastructure - - NA - - NA 33 33 100.0%
Audio Technology 29 23 79.3% 50 50 100.0% 17 17 100.0%
Baking & Pastry Arts 32 28 87.5% 14 13 92.9% 23 21 91.3%
Basic Electronics Technician 60 58 96.7% 68 68 100.0% 68 65 95.6%
Building Construction Specialist 8 7 87.5% 18 17 94.4% 5 3 60.0%
Business Management 230 230 100.0% 220 220 100.0% 283 283 100.0%
Business Operations 325 325 100.0% 324 324 100.0% 411 411 100.0%
Business Specialist 570 570 100.0% 558 558 100.0% 639 639 100.0%
Chef Apprentice - - NA - - NA 46 43 93.5%
CIT - Support Analyst (IT Analysis) 18 15 83.3% 16 15 93.8% 7 5 71.4%
CIT - Support Specialist (IT Support Specialist) 91 85 93.4% 66 58 87.9% 59 56 94.9%
Cisco CCNA Certificate 51 48 94.1% 53 52 98.1% 31 31 100.0%
Computer Programming 44 44 100.0% 9 8 88.9% 25 25 100.0%
Computer Programming Specialist 113 112 99.1% 78 78 100.0% 73 73 100.0%
Correctional Officer 69 69 100.0% - - NA - - NA
Culinary Arts 30 29 96.7% 18 17 94.4% 25 24 96.0%
Digital Media/Multimedia Authoring 6 6 100.0% 9 9 100.0% 3 3 100.0%
Digital Media/Multimedia Production 16 13 81.3% 6 6 100.0% 9 9 100.0%
Digital Media/Multimedia Video Production 4 4 100.0% 7 7 100.0% 2 2 100.0%
Digital Media - Web Production 6 6 100.0% 5 5 100.0% 6 5 83.3%
Digital Video Editing & Post Production 7 7 100.0% 3 3 100.0% 4 4 100.0%
Digital Video Fundamentals 16 13 81.3% 6 6 100.0% 10 9 90.0%
Digital Webcast Media 4 3 75.0% 6 6 100.0% 5 5 100.0%
Digital Webcast Technology 3 2 66.7% 1 1 100.0% 3 2 66.7%
Drafting 38 34 89.5% 29 28 96.6% 31 31 100.0%
Drafting - AutoCAD Foundations 45 43 95.6% 42 40 95.2% 43 39 90.7%
Entertainment (Stage Technology) 48 45 93.8% 38 29 76.3% 88 75 85.2% Film Production Fundamentals 1 1 100.0% 2 0 0.0% 4 2 50.0%
Graphic Design Production 68 65 95.6% 48 47 97.9% 48 47 97.9%
Graphic Design Support 76 70 92.1% 49 48 98.0% 56 53 94.6%
Graphics - Interactive Media Production 15 14 93.3% 11 11 100.0% 16 16 100.0%
Graphics - Interactive Media Support 78 71 91.0% 71 67 94.4% 62 62 100.0%
Homeland Security Specialist - - NA - - NA 13 12 92.3%
Hospitality - Event Planning Management 14 14 100.0% 15 14 93.3% 15 14 93.3%
Hospitality - Food & Beverage Management 54 51 94.4% 55 54 98.2% 57 54 94.7%
Hospitality - Guest Services Specialist 89 88 98.9% 104 104 100.0% 73 73 100.0%
Hospitality - Rooms Division Management 44 40 90.9% 36 35 97.2% 46 44 95.7%
Landscape & Horticulture Professional 3 3 100.0% 10 10 100.0% 5 5 100.0%
Landscape & Horticulture Specialist 5 5 100.0% 10 10 100.0% 6 6 100.0%
Landscape & Horticulture Technician 1 1 100.0% 2 2 100.0% 7 7 100.0%
Laser & Photonics Technician 11 11 100.0% 13 13 100.0% 14 12 85.7%
Medical Information Coder/Biller 47 31 66.0% 63 50 79.4% 54 44 81.5%
Medical Office Management 64 49 76.6% 18 17 94.4% 12 10 83.3%
Microcomputer Repairer/Installer 217 209 96.3% 134 127 94.8% 77 74 96.1%
Microsoft Systems Administrator (IT Tech) 26 25 96.2% 20 17 85.0% 15 12 80.0%
Microsoft Systems Engineer (Comp Specialist) 5 4 80.0% - - NA - - NA
Network Enterprise Administration - - NA - - NA 18 16 88.9%
Network Infrastructure - - NA - - NA 41 40 97.6%
Network Security - - NA - - NA 21 21 100.0%
Network Server Administration - - NA - - NA 28 28 100.0%
Network Support Technician - - NA - - NA 71 71 100.0%
Office Management 26 26 100.0% 19 19 100.0% 17 17 100.0%
Valencia College
Institutional Research 5.6Statistical History Fact Book
2015/2016

Valencia College
Completer Placement Rates
by Degree and Certificate Programs
2011/2012 - 2013/2014Note: This table does NOT include all program completers
Placement rates are based solely on those students located by FETPIP
Source: AA-2 Follow-Up Reports (12/12/2013 ,11/21/2014 , 11/23/15)
2012 Accountability Report Measure 3 Part 2
2011/2012 2012/2013 2013/2014
Plcmt Pool Placed Pct. Plcmt Pool Placed Pct. Plcmt Pool Placed Pct.Degree Program
Office Specialist 71 71 100.0% 80 80 100.0% 84 84 100.0%
Office Support 203 203 100.0% 239 239 100.0% 272 272 100.0%
Paramedic 59 54 91.5% 47 46 97.9% 45 42 93.3%
Wireless & IP Communication 57 55 96.5% 68 64 94.1% 30 28 93.3%
Postsecondary Vocational Certificate (PSVC) 3,124 3,007 96.3% 2,784 2,718 97.6% 3,264 3,187 97.6%
Valencia College
Institutional Research 5.7Statistical History Fact Book
2015/2016

Valencia College
Full-Time Personnel Comparison Profile
2013/2014 - 2015/2016
Note: *Percentages based on Total Full-Time Employees; Sub-Category percentages based on Category Heading
Source: APR (Annual Personnel Report); data extracted 10/1/2013, 10/1/2014, 12/9/2016
Nbr. Pct. Nbr. Pct. Nbr. Pct. Nbr. Pct.
Total Full-Time Employees 1,564 1,654 1,655 1 0.1%
Gender* 1,564 100.0% 1,654 100.0% 1,655 100.0% 1 0.1%
Female 910 58.2% 964 58.3% 981 59.3% 17 1.8%
Male 654 41.8% 690 41.7% 674 40.7% -16 -2.3%
Ethnicity* 1,564 100.0% 1,654 100.0% 1,655 100.0% 1 0.1%
Asian nonHispanic 86 5.5% 96 5.8% 91 5.5% -5 -5.2%
Black nonHispanic 232 14.8% 244 14.8% 241 14.6% -3 -1.2%
Hawaiian/Pacific Islander 0 0.0% 0 0.0% 1 0.1% 1 0.0%
Hispanic of Any Race 306 19.6% 330 20.0% 351 21.2% 21 6.4%
Indian/Alaskan nonHispanic 6 0.4% 6 0.4% 8 0.5% 2 33.3%
Multi-Race nonHispanic 6 0.4% 6 0.4% 7 0.4% 1 16.7%
White nonHispanic 880 56.3% 922 55.7% 910 55.0% -12 -1.3%
Unknown Ethnicity 48 3.1% 50 3.0% 46 2.8% -4 -8.0%
Employee Category 1,599 1,691 1,694 3 0.2%
Administrative Total* 72 4.6% 77 4.7% 80 4.8% 3 3.9%
Career Service Total* 716 45.8% 750 45.3% 724 43.7% -26 -3.5%
Secretarial/Clerical 248 34.6% 258 34.4% 256 35.4% -2 -0.8%
Service/Maintenance 159 22.2% 168 22.4% 159 22.0% -9 -5.4%
Teaching/Lab Assistant 115 16.1% 120 16.0% 103 14.2% -17 -14.2%
Technical/Paraprofessional 194 27.1% 204 27.2% 206 28.5% 2 1.0%
Faculty Total* 493 31.5% 508 30.7% 535 32.3% 27 5.3%
Faculty - Tenure 293 59.4% 334 65.7% 316 59.1% -18 -5.4%
Faculty - OnTenure Track 99 20.1% 68 13.4% 114 21.3% 46 67.6%
Faculty - Other 101 20.5% 106 20.9% 105 19.6% -1 -0.9%
Faculty Total by Degree* 493 31.5% 508 30.7% 535 32.3% 27 5.3%
Doctorate 125 25.4% 128 25.2% 144 26.9% 16 12.5%
Advanced Masters 88 17.8% 92 18.1% 101 18.9% 9 9.8%
Masters 256 51.9% 264 52.0% 267 49.9% 3 1.1%
Bachelors 10 2.0% 11 2.2% 13 2.4% 2 18.2%
Associate 9 1.8% 6 1.2% 5 0.9% -1 -16.7%
Less than Associate 2 0.4% 2 0.4% 1 0.2% -1 -50.0%
Unknown 3 0.6% 5 1.0% 4 0.7% -1 -20.0%
Professional* 318 20.3% 356 21.5% 355 21.5% -1 -0.3%
Difference
2013/2014 2014/2015 2015/2016
Category
2014/2015-2015/2016
Valencia College
Institutional Research 6.1Statistical History Fact Book
2015/2016

Valencia College
Part-Time Personnel Comparison Profile
2013/2014 - 2015/2016
Note: *Percentages based on Total Part-Time Employees; Sub-Category percentages based on Category Heading
Source: APR (Annual Personnel Report); data extracted 10/1/2013, 10/1/2014, 12/9/2016
Nbr. Pct. Nbr. Pct. Nbr. Pct. Nbr. Pct.
Total Part-Time Employees 1,775 1,940 1,922 -18 -0.9%
Gender* 1,775 100.0% 1,940 100.0% 1,922 100.0% -18 -0.9%
Female 926 52.2% 995 51.3% 977 50.8% -18 -1.8%
Male 849 47.8% 945 48.7% 945 49.2% 0 0.0%
Ethnicity* 1,775 100.0% 1,940 100.0% 1,922 100.0% -18 -0.9%
Asian nonHispanic 104 5.9% 102 5.3% 112 5.8% 10 9.8%
Black nonHispanic 234 13.2% 253 13.0% 246 12.8% -7 -2.8%
Hawaiian/Pacific Islander 1 0.1% 2 0.1% 4 0.2% 2 100.0%
Hispanic of Any Race 318 17.9% 375 19.3% 393 20.4% 18 4.8%
Indian/Alaskan nonHispanic 7 0.4% 7 0.4% 6 0.3% -1 -14.3%
Multi-Race nonHispanic 5 0.3% 14 0.7% 17 0.9% 3 21.4%
White nonHispanic 1,006 56.7% 1,089 56.1% 1,054 54.8% -35 -3.2%
Unknown Ethnicity 100 5.6% 98 5.1% 90 4.7% -8 -8.2%
Employee Category 1,775 1,940 1,922 -18 -0.9%
Administrative Total* 72 4.1% 77 4.0% 80 4.2% 3 3.9%
Career Service Total* 598 33.7% 663 34.2% 728 37.9% 65 9.8%
Secretarial/Clerical 217 36.3% 248 37.4% 283 38.9% 35 14.1%
Service/Maintenance 29 4.8% 45 6.8% 46 6.3% 1 2.2%
Teaching/Lab Assistant 0 0.0% 0 0.0% 0 0.0% 0 0.0%
Technical/Paraprofessional 352 58.9% 370 55.8% 399 54.8% 29 7.8%
Faculty Total* 1,153 65.0% 1,248 64.3% 1,161 60.4% -87 -7.0%
Faculty - Tenure 1 0.1% 0 0.0% 0 0.0% 0 0.0%
Faculty - OnTenure Track 0 0.0% 0 0.0% 0 0.0% 0 0.0%
Faculty - Other 1,152 99.9% 1,248 100.0% 1,161 100.0% -87 -7.0%
Faculty Total by Degree* 1,153 65.0% 1,248 64.3% 1,161 60.4% -87 -7.0%
Doctorate 176 15.3% 195 15.6% 192 16.5% -3 -1.5%
Advanced Masters 46 4.0% 39 3.1% 35 3.0% -4 -10.3%
Masters 624 54.1% 655 52.5% 605 52.1% -50 -7.6%
Bachelors 131 11.4% 116 9.3% 107 9.2% -9 -7.8%
Associate 41 3.6% 45 3.6% 40 3.4% -5 -11.1%
Less than Associate 6 0.5% 4 0.3% 5 0.4% 1 25.0%
Unknown 129 11.2% 194 15.5% 177 15.2% -17 -8.8%
Professional* 24 1.4% 29 1.6% 33 1.9% 4 13.8%
Category
Difference
2013/2014 2014/2015 2015/2016 2014/2015-2015/2016
Valencia College
Institutional Research 6.2Statistical History Fact Book
2015/2016
Valencia College
Total Full-Time and Part-Time Personnel Comparison Profile
2013/2014 - 2015/2016
Note: *Percentages based on Total Full-Time Employees; Sub-Category percentages based on Category Heading
Source: APR (Annual Personnel Report); data extracted 10/1/2013, 10/1/2014, 12/9/2016
Nbr. Pct. Nbr. Pct. Nbr. Pct. Nbr. Pct.
Total Full-Time & Part-Time Employees 3,339 3,594 3,577 -17 -0.5%
Gender* 3,339 100.0% 3,594 100.0% 3,577 100.0% -17 -0.5%
Female 1,836 55.0% 1,959 54.5% 1,958 54.7% -1 -0.1%
Male 1,503 45.0% 1,635 45.5% 1,619 45.3% -16 -1.0%
Ethnicity* 3,380 101.2% 3,594 100.0% 3,577 100.0% -17 -0.5%
Asian nonHispanic 190 5.6% 198 5.5% 203 5.7% 5 2.5%
Black nonHispanic 466 13.8% 497 13.8% 487 13.6% -10 -2.0%
Hawaiian/Pacific Islander 1 0.0% 2 0.1% 5 0.1% 3 150.0%
Hispanic of Any Race 624 18.5% 705 19.6% 744 20.8% 39 5.5%
Indian/Alaskan nonHispanic 13 0.4% 13 0.4% 14 0.4% 1 7.7%
Multi-Race nonHispanic 11 0.3% 20 0.6% 24 0.7% 4 20.0%
White nonHispanic 1,886 55.8% 2,011 56.0% 1,964 54.9% -47 -2.3%
Unknown Ethnicity 148 4.4% 148 4.1% 136 3.8% -12 -8.1%
Employee Category 3,374 3,634 3,616 -18 -0.5%
Administrative Total* 72 2.2% 80 2.2% 80 2.2% 0 0.0%
Career Service Total* 1,314 39.4% 1,413 39.3% 1,452 40.6% 39 2.8%
Secretarial/Clerical 465 35.4% 506 35.8% 539 37.1% 33 6.5%
Service/Maintenance 188 14.3% 213 15.1% 205 14.1% -8 -3.8%
Teaching/Lab Assistant 115 8.8% 120 8.5% 103 7.1% -17 -14.2%
Technical/Paraprofessional 546 41.6% 574 40.6% 605 41.7% 31 5.4%
Faculty Total* 1,646 49.3% 1,756 48.9% 1,696 47.4% -60 -3.4%
Faculty - Tenure 294 17.9% 334 19.0% 316 18.6% -18 -5.4%
Faculty - OnTenure Track 99 6.0% 68 3.9% 114 6.7% 46 67.6%
Faculty -Other 1,253 76.1% 1,354 77.1% 1,266 74.6% -88 -6.5%
Faculty Total by Degree* 1,646 49.3% 1,756 48.9% 1,696 47.4% -60 -3.4%
Doctorate 301 18.3% 323 18.4% 336 19.8% 13 4.0%
Advanced Masters 134 8.1% 131 7.5% 136 8.0% 5 3.8%
Masters 880 53.5% 919 52.3% 872 51.4% -47 -5.1%
Bachelors 141 8.6% 127 7.2% 120 7.1% -7 -5.5%
Associate 50 3.0% 51 2.9% 45 2.7% -6 -11.8%
Less than Associate 8 0.5% 6 0.3% 6 0.4% 0 0.0%
Unknown 132 8.0% 199 11.3% 181 10.7% -18 -9.0%
Professional* 342 10.2% 385 10.7% 388 10.8% 3 0.8%
Category
2014/2015-2015/2016
Difference
2013/2014 2014/2015 2015/2016
Valencia College
Institutional Research 6.3Statistical History Fact Book
2015/2016

Valencia College
Operating Budget Comparison
General Current Fund
2012/2013 - 2016/2017
Source: Valencia Operating Budget, 07/01/2016 - 06/30/2017, Exhibit A
Mil
lio
ns
$164.5 $164.9 $170.0$180.5
$217.9
$0.0
$50.0
$100.0
$150.0
$200.0
$250.0
2012/2013 2013/2014 2014/2015 2015/2016 2016/2017
Valencia College
Institutional Research 7.1
Statistical History Fact Book
2015/2016
Application Amount Award Amount Pending Grants Submitted Award Count Rate of Return
++Mean $ of
Application
2012-2013 $6,688,773 $4,914,010 $0 25 16 64% $267,5512013-2014 $46,651,194 $6,024,756 $0 41 23 56% $1,137,8342014-2015 $15,109,582 $8,911,806 $0 29 16 55% $521,0202015-2016 $12,351,159 $4,426,644 $36,580 26 12 46% $475,045Grand Total $80,800,707 $24,277,216 $36,580 121 67 55% $667,774
++ (Explanation of Mean of Application)
Application Amount
Mean $ of
Application
# of Apps Below
Mean
# of Apps Above
Mean Median
2012-2013 $6,688,773 $267,551 18 7 $78,4952013-2014 $46,651,194 $1,137,834 34 7 $57,6002014-2015 $15,109,582 $521,020 22 7 $266,7102015-2016 $12,351,159 $475,045 19 7 $156,902Grand Total $80,800,707 $667,774 93 28 $100,000
Valencia College
Grant Development
2016 Annual Report
Valencia College
Institutional Research 7.2Statistical History Fact Book
2015/2016

Valencia College
Grant Development
2016 Annual Report
Total 2012 Managed
Grants 14
Closed 2012 (of total) 1
2012 Managed $ $5,691,955
Total 2013 Managed
Grants 44
Closed 2013 (of total) 17
2013 Managed $ $11,938,942
Total 2014 Managed
Grants 45
Closed 2014 (of total) 15
2014 Managed $ $13,947,151
Total 2015 Managed
Grants 42
Closed 2015 (of total) 9
2015 Managed $ $19,873,630
Total 2016 Managed
Grants 48
Closed 2016 (of total) 11
2016 Managed $ $22,452,785
* All amounts based on Calendar Years (January - December)
* 2012 was the first year of RDO data migration to AFI
* Managed $ - calculated by summing the actual Award Amounts for each grant in the associated year
* 2016 reporting methodology was refined (accurately captures all phases of AFI grant management lifecycle)
Valencia College
Institutional Research 7.3Statistical History Fact Book
2015/2016

Dollars
Instructional / Academic Support 32.6% $94,409,324.30
Library 2.7% $7,683,990.84
Student Services 8.7% $25,237,375.20
Operation / Maintenance Physical Plant 8.9% $25,659,530.78
General & Institutional 12.7% $36,683,179.18
Student Aid / Scholarships 28.7% $83,101,738.55
Auxiliary Enterprises 5.8% $16,755,707.39
$289,530,846.24
Source: Valencia Annual Financial Report 6/30/2016, IR Exp Detail FY 1516 (Funds 1, 2, 3 & 5 only)
Expenditure Category
Total Expenditures
Valencia College
Current Fund Expenditures
2015/2016 Fiscal Year
Instructional / Academic Support
32.6%
Library2.7%
Student Services8.7%
Operation / Maintenance Physical Plant
8.9%
General & Institutional
12.7%
Student Aid / Scholarships
28.7%
Auxiliary Enterprises
5.8%
Valencia College
Institutional Research 7.4
Statistical History Fact Book
2015/2016

Valencia College
Comparison of Financial Aid Types
by Amount Disbursed, Number of Awards, and Number of Students
2013/2014 - 2015/2016
NOTE: Data extracted from Banner dynamic tables 09/08/2016; data extracted at another time will vary from this report.
1. Financial Aid Fiscal Year in Banner = Federal Fiscal Year (October 1-September 30)
2. Fiscal Year in Banner = Valencia Fiscal Year (July 1-June 30)
3. Foundation Fiscal Year = Foundation Fiscal Year (April 1-March 31)
2013/2014 2014/2015 2015/2016
Institutional Application 14,873 7,672 7,089
FAFSA Application 79,752 76,904 72,949
Total Applications 94,625 84,576 80,038
2013/2014 2014/2015 2015/2016
PELL Grant $ 75,604,179.00 75,544,960.00$ 71,251,419.00$
PELL Grant Awards 23738 23,542 21,945
PELL Grant Students 23738 23,542 21,945
Other Grant $ 5,798,272.00 6,169,551.00$ 5,712,523.00$
Other Grant Awards 7805 7,819 6,754
Other Grant Students 6040 5,909 5,082
Total Grants $ 81,402,451.00 81,714,511.00$ 76,963,943.00$
Total Grants Awarded 23825 23,616 22,011
Total Grant Students 23825 23,616 22,011
Bright Futures $ 3,004,251.00 1,588,541.00$ 954,423.00$
Bright Futures Awards 2451 1,414 873
Bright Futures Students 2451 1,413 871
Foundation $ 1,504,514.00 1,603,569.00$ 1,791,495.00$
Foundation Awards 1569 1,453 2,088
Foundation Students 1266 1,247 1,762
FA Fee Scholarship $ 3,997,787.00 3,518,645.00$ 3,660,212.00$
FA Fee Scholarship Awards 4184 3,585 3,749
FA Fee Scholarship Students 2825 2,405 2,698
Other Scholarship $ 791,243.00 796,691.00$ 975,136.00$
Other Scholarship Awards 862 686 779
Other Scholarship Students 801 618 698
Total Scholarships $ 9,297,794.00 7,507,446.00$ 7,381,266.00$
Total Scholarship Awards 6372 5,009 5,322
Total Scholarship Students 6372 5,009 5,322
Private Loan $ 1,817,279.00 1,903,662.00$ 2,273,278.00$
Private Loan Awards 283 287 319
Private Loan Students 283 287 319
Federal Student Loan $ 57,088,605.00 50,975,856.00$ 48,966,741.00$
Federal S Loan Awards 19304 17,115 15,529
Federal S Loan Students 11968 10,825 9,710
Financial Aid Year
Financial Aid Year
Valencia College
Institutional Research 7.5Statistical History Fact Book
2015/2016

Valencia College
Comparison of Financial Aid Types
by Amount Disbursed, Number of Awards, and Number of Students
2013/2014 - 2015/2016
NOTE: Data extracted from Banner dynamic tables 09/08/2016; data extracted at another time will vary from this report.
1. Financial Aid Fiscal Year in Banner = Federal Fiscal Year (October 1-September 30)
2. Fiscal Year in Banner = Valencia Fiscal Year (July 1-June 30)
3. Foundation Fiscal Year = Foundation Fiscal Year (April 1-March 31)
2013/2014 2014/2015 2015/2016
Financial Aid Year
Parent Loan $ 420,886.00 160,620.00$ 361,067.00$
Parent Loan Awards 56 29 61
Parent Loan Parents 56 29 61
Other Loan 0 0 0
Other Loan Awards 0 0 0
Other Loan Students 0 0 0
Work Study $ 704,577.00 393,479.00$ 393,349.00$
Work Study Awards 244 160 119
Work Study Students 243 160 119
2013/2014 2014/2015 2015/2016
Enrollments 59,092 59,555 59,812
Total Students 29,141 28,380 26,711
Source: Stat Hx FA Data 06JAN16
Financial Aid Year
Valencia College
Institutional Research 7.6Statistical History Fact Book
2015/2016

Valencia College
Collegewide
Summer End of Term
Credit Enrollment
2013/2014 - 2015/2016
Source: Summer Term Credit Stat Hx 08SEP16
Nbr. Pct. Nbr. Pct. Nbr. Pct. Nbr. Pct.
Full-Time 2,306 9.1% 2,132 8.5% 2,125 8.4% -7 -0.3%
Part-Time 22,938 90.9% 23,028 91.5% 23,309 91.6% 281 1.2%
Credit Hours Attempted
1-5 Credit Hours 9,177 36.4% 9,250 36.8% 9,463 37.2% 213 2.3%
6-8 Credit Hours 9,636 38.2% 9,576 38.1% 9,706 38.2% 130 1.3%
9-11 Credit Hours 4,125 16.3% 4,202 16.7% 4,140 16.3% -62 -1.5%
12+ Credit Hours 2,306 9.1% 2,132 8.5% 2,125 8.4% -7 -0.3%
TOTAL HEADCOUNT 25,244 100.0% 25,160 100.0% 25,434 100.0% 274 1.1%
Day/Evening Status
Day 15,507 61.4% 15,042 59.8% 14,852 58.4% -190 -1.3%
Evening 9,737 38.6% 10,118 40.2% 10,582 41.6% 464 4.4%
Gender
Female 14,162 56.1% 14,214 56.5% 14,375 56.5% 161 1.1%
Male 10,890 43.1% 10,764 42.8% 10,896 42.8% 132 1.2%
Unknown 192 0.8% 182 0.7% 163 0.6% -19 -11.7%
Ethnicity
African American 4,715 18.7% 4,630 18.4% 4,426 17.4% -204 -4.6%
Asian 1,276 5.1% 1,323 5.3% 1,320 5.2% -3 -0.2%
Caucasian 8,667 34.3% 8,260 32.8% 8,106 31.9% -154 -1.9%
Hawaiian 111 0.4% 116 0.5% 119 0.5% 3 2.5%
Hispanic 7,737 30.6% 8,005 31.8% 8,502 33.4% 497 5.8%
Multi-Race 538 2.1% 615 2.4% 625 2.5% 10 1.6%
Native American 72 0.3% 72 0.3% 94 0.4% 22 23.4%
Not Reported 2,128 8.4% 2,139 8.5% 2,242 8.8% 103 4.6%
TOTAL 25,244 100.0% 25,160 100.0% 25,434 100.0% 274 1.1%
2014/20152013/2014 2015/2016
Difference
2014/2015 - 2015/2016
Valencia College
Institutional Research 8.1Statistical History Fact Book
2015/2016

Valencia College
West Campus
Summer End of Term
Credit Enrollment
2013/2014 - 2015/2016
Source: Summer Term Credit Stat Hx 08SEP16
Nbr. Pct. Nbr. Pct. Nbr. Pct. Nbr. Pct.
Full-Time 1,182 11.2% 1,189 11.1% 1,223 11.1% 34 2.8%
Part-Time 9,384 88.8% 9,511 88.9% 9,780 88.7% 269 2.8%
Credit Hours Attempted
1-5 Credit Hours 3,033 28.7% 3,060 28.6% 3,209 29.1% 149 4.6%
6-8 Credit Hours 4,078 38.6% 4,142 38.7% 4,239 38.5% 97 2.3%
9-11 Credit Hours 2,273 21.5% 2,309 21.6% 2,332 21.2% 23 1.0%
12+ Credit Hours 1,182 11.2% 1,189 11.1% 1,244 11.3% 55 4.4%
TOTAL HEADCOUNT 10,566 100.0% 10,700 100.0% 11,024 100.0% 324 2.9%
Day/Evening Staus
Day 7,084 67.0% 6,795 63.5% 6,767 61.4% -28 -0.4%
Evening 3,482 33.0% 3,905 36.5% 4,257 38.6% 352 8.3%
Gender
Female 5,911 55.9% 6,074 56.8% 6,253 56.7% 179 2.9%
Male 4,576 43.3% 4,559 42.6% 4,697 42.6% 138 2.9%
Unknown 79 0.7% 67 0.6% 74 0.7% 7 9.5%
Ethnicity
African American 2,688 25.4% 2,636 24.6% 2,399 21.8% -237 -9.9%
Asian 611 5.8% 643 6.0% 666 6.0% 23 3.5%
Caucasian 3,439 32.5% 3,439 32.1% 3,523 32.0% 84 2.4%
Hawaiian 50 0.5% 58 0.5% 64 0.6% 6 9.4%
Hispanic 2,720 25.7% 2,804 26.2% 3,150 28.6% 346 11.0%
Multi-Race 215 2.0% 260 2.4% 259 2.3% -1 -0.4%
Native American 32 0.3% 31 0.3% 42 0.4% 11 26.2%
Not Reported 811 7.7% 829 7.7% 921 8.4% 92 10.0%
TOTAL 10,566 100.0% 10,700 100.0% 11,024 100.0% 324 2.9%
Difference
2013/2014 2014/2015 2015/2016 2014/2015 - 2015/2016
Valencia College
Institutional Research 8.2Statistical History Fact Book
2015/2016

Valencia College
East Campus
Summer End of Term
Credit Enrollment
2013/2014 - 2015/2016
Source: Summer Term Credit Stat Hx 08SEP16
Nbr. Pct. Nbr. Pct. Nbr. Pct. Nbr. Pct.
Full-Time 1,421 11.8% 1,345 11.2% 1,350 11.2% 5 0.4%
Part-Time 10,609 88.2% 10,634 88.8% 10,706 88.8% 72 0.7%
Credit Hours Attempted
1-5 Credit Hours 3,841 31.9% 3,731 31.1% 3,705 30.7% -26 -0.7%
6-8 Credit Hours 4,684 38.9% 4,714 39.4% 4,782 39.7% 68 1.4%
9-11 Credit Hours 2,084 17.3% 2,189 18.3% 2,219 18.4% 30 1.4%
12+ Credit Hours 1,421 11.8% 1,345 11.2% 1,350 11.2% 5 0.4%
TOTAL HEADCOUNT 12,030 100.0% 11,979 100.0% 12,056 100.0% 77 0.6%
Day/Evening Status
Day 6,917 57.5% 6,703 56.0% 6,633 55.0% -70 -1.1%
Evening 5,113 42.5% 5,276 44.0% 5,423 45.0% 147 2.7%
Gender
Female 6,572 54.6% 6,596 55.1% 6,671 55.3% 75 1.1%
Male 5,383 44.7% 5,299 44.2% 5,312 44.1% 13 0.2%
Unknown 75 0.6% 84 0.7% 73 0.6% -11 -15.1%
Ethnicity
African American 1,820 15.1% 1,846 15.4% 1,863 15.5% 17 0.9%
Asian 550 4.6% 592 4.9% 606 5.0% 14 2.3%
Caucasian 4,673 38.8% 4,429 37.0% 4,294 35.6% -135 -3.1%
Hawaiian 51 0.4% 48 0.4% 46 0.4% -2 -4.3%
Hispanic 3,653 30.4% 3,751 31.3% 3,935 32.6% 184 4.7%
Multi-Race 287 2.4% 309 2.6% 321 2.7% 12 3.7%
Native American 35 0.3% 39 0.3% 48 0.4% 9 18.8%
Not Reported 961 8.0% 965 8.1% 943 7.8% -22 -2.3%
TOTAL 12,030 100.0% 11,979 100.0% 12,056 100.0% 77 0.6%
Difference
2013/2014 2014/2015 2015/2016 2014/2015 - 2015/2016
Valencia College
Institutional Research 8.3Statistical History Fact Book
2015/2016

Valencia College
Osceola Campus
Summer End of Term
Credit Enrollment
2013/2014 - 2015/2016
Source: Summer Term Credit Stat Hx 08SEP16
Nbr. Pct. Nbr. Pct. Nbr. Pct. Nbr. Pct.
Full-Time 715 12.4% 703 11.9% 724 11.8% 21 2.9%
Part-Time 5,063 87.6% 5,199 88.1% 5,433 88.2% 234 4.3%
Credit Hours Attempted
1-5 Credit Hours 1,504 26.0% 1,531 25.9% 1,653 26.8% 122 7.4%
6-8 Credit Hours 2,481 42.9% 2,538 43.0% 2,631 42.7% 93 3.5%
9-11 Credit Hours 1,078 18.7% 1,130 19.1% 1,149 18.7% 19 1.7%
12+ Credit Hours 715 12.4% 703 11.9% 724 11.8% 21 2.9%
TOTAL HEADCOUNT 5,778 100.0% 5,902 100.0% 6,157 100.0% 255 4.1%
Day/Evening Status
Day 3,166 54.8% 3,285 55.7% 3,297 53.5% 12 0.4%
Evening 2,612 45.2% 2,617 44.3% 2,860 46.5% 243 8.5%
Gender
Female 3,445 59.6% 3,485 59.0% 3,611 58.6% 126 3.5%
Male 2,292 39.7% 2,389 40.5% 2,516 40.9% 127 5.0%
Unknown 41 0.7% 28 0.5% 30 0.5% 2 6.7%
Ethnicity
African American 852 14.7% 822 13.9% 837 13.6% 15 1.8%
Asian 285 4.9% 286 4.8% 259 4.2% -27 -10.4%
Caucasian 1,508 26.1% 1,480 25.1% 1,519 24.7% 39 2.6%
Hawaiian 32 0.6% 28 0.5% 27 0.4% -1 -3.7%
Hispanic 2,371 41.0% 2,545 43.1% 2,674 43.4% 129 4.8%
Multi-Race 96 1.7% 139 2.4% 156 2.5% 17 10.9%
Native American 8 0.1% 18 0.3% 22 0.4% 4 18.2%
Not Reported 626 10.8% 584 9.9% 663 10.8% 79 11.9%
TOTAL 5,778 100.0% 5,902 100.0% 6,157 100.0% 255 4.1%
Difference
2013/2014 2014/2015 2015/2016 2014/2015 - 2015/2016
Valencia College
Institutional Research 8.4Statistical History Fact Book
2015/2016

Valencia College
Winter Park Campus
Summer End of Term
Credit Enrollment
2013/2014 - 2015/2016
Source: Summer Term Credit Stat Hx 08SEP16
Nbr. Pct. Nbr. Pct. Nbr. Pct. Nbr. Pct.
Full-Time 355 16.8% 360 17.5% 344 16.2% -16 -4.7%
Part-Time 1,753 83.2% 1,703 82.5% 1,780 83.8% 77 4.3%
Credit Hours Attempted
1-5 Credit Hours 503 23.9% 514 24.9% 496 23.4% -18 -3.6%
6-8 Credit Hours 821 38.9% 778 37.7% 843 39.7% 65 7.7%
9-11 Credit Hours 429 20.4% 411 19.9% 441 20.8% 30 6.8%
12+ Credit Hours 355 16.8% 360 17.5% 344 16.2% -16 -4.7%
TOTAL HEADCOUNT 2,108 100.0% 2,063 100.0% 2,124 100.0% 61 2.9%
Day/Evening Status
Day 822 39.0% 840 40.7% 803 37.8% -37 -4.6%
Evening 1,286 61.0% 1,223 59.3% 1,321 62.2% 98 7.4%
Gender
Female 1,244 59.0% 1,228 59.5% 1,263 59.5% 35 2.8%
Male 848 40.2% 822 39.8% 851 40.1% 29 3.4%
Unknown 16 0.8% 13 0.6% 10 0.5% -3 -30.0%
Ethnicity
African American 335 15.9% 332 16.1% 303 14.3% -29 -9.6%
Asian 86 4.1% 67 3.2% 81 3.8% 14 17.3%
Caucasian 917 43.5% 841 40.8% 829 39.0% -12 -1.4%
Hawaiian 5 0.2% 10 0.5% 5 0.2% -5 -100.0%
Hispanic 536 25.4% 591 28.6% 658 31.0% 67 10.2%
Multi-Race 55 2.6% 66 3.2% 74 3.5% 8 10.8%
Native American 10 0.5% 5 0.2% 7 0.3% 2 28.6%
Not Reported 164 7.8% 151 7.3% 167 7.9% 16 9.6%
TOTAL 2,108 100.0% 2,063 100.0% 2,124 100.0% 61 2.9%
Difference
2013/2014 2014/2015 2015/2016 2014/2015 - 2015/2016
Valencia College
Institutional Research 8.5Statistical History Fact Book
2015/2016

Valencia College
Lake Nona Campus
Summer End of Term
Credit Enrollment
2013/2014 - 2015/2016
Source: Summer Term Credit Stat Hx 08SEP16
Nbr. Pct. Nbr. Pct. Nbr. Pct. Nbr. Pct.
Full-Time 154 12.7% 171 12.4% 195 12.2% 24 12.3%
Part-Time 1,062 87.3% 1,206 87.6% 1,399 87.8% 193 13.8%
Credit Hours Attempted
1-5 Credit Hours 371 30.5% 452 32.8% 456 28.6% 4 0.9%
6-8 Credit Hours 483 39.7% 509 37.0% 625 39.2% 116 18.6%
9-11 Credit Hours 208 17.1% 245 17.8% 318 19.9% 73 23.0%
12+ Credit Hours 154 12.7% 171 12.4% 195 12.2% 24 12.3%
TOTAL HEADCOUNT 1,216 100.0% 1,377 100.0% 1,594 100.0% 217 13.6%
Day/Evening Status
Day 721 59.3% 740 53.7% 903 56.6% 163 18.1%
Evening 495 40.7% 637 46.3% 691 43.4% 54 7.8%
Gender
Female 700 57.6% 843 61.2% 988 62.0% 145 14.7%
Male 498 41.0% 519 37.7% 594 37.3% 75 12.6%
Unknown 18 1.5% 15 1.1% 12 0.8% -3 -25.0%
Ethnicity
African American 141 11.6% 158 11.5% 187 11.7% 29 15.5%
Asian 60 4.9% 76 5.5% 71 4.5% -5 -7.0%
Caucasian 458 37.7% 461 33.5% 496 31.1% 35 7.1%
Hawaiian 5 0.4% 4 0.3% 9 0.6% 5 55.6%
Hispanic 384 31.6% 477 34.6% 607 38.1% 130 21.4%
Multi-Race 19 1.6% 47 3.4% 35 2.2% -12 -34.3%
Native American 5 0.4% 4 0.3% 10 0.6% 6 60.0%
Not Reported 144 11.8% 150 10.9% 179 11.2% 29 16.2%
TOTAL 1,216 100.0% 1,377 100.0% 1,594 100.0% 217 13.6%
Difference
2013/2014 2014/2015 2015/2016 2014/2015 - 2015/2016
Valencia College
Institutional Research 8.6Statistical History Fact Book
2015/2016
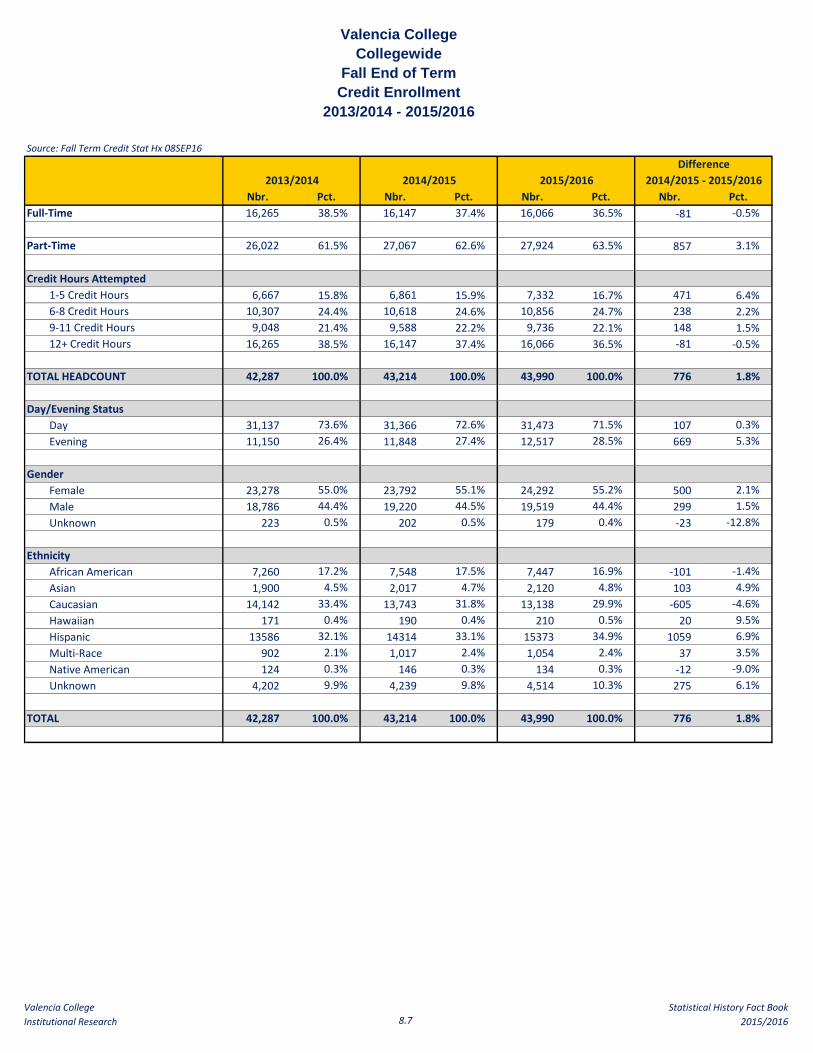
Valencia College
Collegewide
Fall End of Term
Credit Enrollment
2013/2014 - 2015/2016
Source: Fall Term Credit Stat Hx 08SEP16
Nbr. Pct. Nbr. Pct. Nbr. Pct. Nbr. Pct.
Full-Time 16,265 38.5% 16,147 37.4% 16,066 36.5% -81 -0.5%
Part-Time 26,022 61.5% 27,067 62.6% 27,924 63.5% 857 3.1%
Credit Hours Attempted
1-5 Credit Hours 6,667 15.8% 6,861 15.9% 7,332 16.7% 471 6.4%
6-8 Credit Hours 10,307 24.4% 10,618 24.6% 10,856 24.7% 238 2.2%
9-11 Credit Hours 9,048 21.4% 9,588 22.2% 9,736 22.1% 148 1.5%
12+ Credit Hours 16,265 38.5% 16,147 37.4% 16,066 36.5% -81 -0.5%
TOTAL HEADCOUNT 42,287 100.0% 43,214 100.0% 43,990 100.0% 776 1.8%
Day/Evening Status
Day 31,137 73.6% 31,366 72.6% 31,473 71.5% 107 0.3%
Evening 11,150 26.4% 11,848 27.4% 12,517 28.5% 669 5.3%
Gender
Female 23,278 55.0% 23,792 55.1% 24,292 55.2% 500 2.1%
Male 18,786 44.4% 19,220 44.5% 19,519 44.4% 299 1.5%
Unknown 223 0.5% 202 0.5% 179 0.4% -23 -12.8%
Ethnicity
African American 7,260 17.2% 7,548 17.5% 7,447 16.9% -101 -1.4%
Asian 1,900 4.5% 2,017 4.7% 2,120 4.8% 103 4.9%
Caucasian 14,142 33.4% 13,743 31.8% 13,138 29.9% -605 -4.6%
Hawaiian 171 0.4% 190 0.4% 210 0.5% 20 9.5%
Hispanic 13586 32.1% 14314 33.1% 15373 34.9% 1059 6.9%
Multi-Race 902 2.1% 1,017 2.4% 1,054 2.4% 37 3.5%
Native American 124 0.3% 146 0.3% 134 0.3% -12 -9.0%
Unknown 4,202 9.9% 4,239 9.8% 4,514 10.3% 275 6.1%
TOTAL 42,287 100.0% 43,214 100.0% 43,990 100.0% 776 1.8%
Difference
2013/2014 2014/2015 2015/2016 2014/2015 - 2015/2016
Valencia College
Institutional Research 8.7Statistical History Fact Book
2015/2016

Valencia College
West Campus
Fall End of Term
Credit Enrollment
2013/2014 - 2015/2016
Source: Fall Term Credit Stat Hx 08SEP16
Nbr. Pct. Nbr. Pct. Nbr. Pct. Nbr. Pct.
Full-Time 6,790 37.9% 6,807 37.2% 6,881 36.9% 74 1.1%
Part-Time 11,133 62.1% 11,515 62.8% 11,784 63.1% 269 2.3%
Credit Hours Attempted
1-5 Credit Hours 2,289 12.8% 2,343 12.8% 2,445 13.1% 102 4.2%
6-8 Credit Hours 4,473 25.0% 4,604 25.1% 4,732 25.4% 128 2.7%
9-11 Credit Hours 4,371 24.4% 4,568 24.9% 4,607 24.7% 39 0.8%
12+ Credit Hours 6,790 37.9% 6,807 37.2% 6,881 36.9% 74 1.1%
TOTAL HEADCOUNT 17,923 100.0% 18,322 100.0% 18,665 100.0% 343 1.8%
Day/Evening Status
Day 13,353 74.5% 13,286 72.5% 13,141 70.4% -145 -1.1%
Evening 4,570 25.5% 5,036 27.5% 5,524 29.6% 488 8.8%
Gender
Female 9,932 55.4% 10,236 55.9% 10,361 55.5% 125 1.2%
Male 7,893 44.0% 7,988 43.6% 8,222 44.1% 234 2.8%
Unknown 98 0.5% 98 0.5% 82 0.4% -16 -19.5%
Ethnicity
African American 4,246 23.7% 4,319 23.6% 4,195 22.5% -124 -3.0%
Asian 1,000 5.6% 1,023 5.6% 1,083 5.8% 60 5.5%
Caucasian 5,868 32.7% 5,700 31.1% 5,606 30.0% -94 -1.7%
Hawaiian 82 0.5% 91 0.5% 108 0.6% 17 15.7%
Hispanic 4,676 26.1% 4,984 27.2% 5,380 28.8% 396 7.4%
Multi-Race 365 2.0% 438 2.4% 452 2.4% 14 3.1%
Native American 57 0.3% 72 0.4% 56 0.3% -16 -28.6%
Not Reported 1,629 9.1% 1,695 9.3% 1,785 9.6% 90 5.0%
TOTAL 17,923 100.0% 18,322 100.0% 18,665 100.0% 343 1.8%
Difference
2013/2014 2014/2015 2015/2016 2014/2015 - 2015/2016
Valencia College
Institutional Research 8.8Statistical History Fact Book
2015/2016

Valencia College
East Campus
Fall End of Term
Credit Enrollment
2013/2014 - 2015/2016
Source: Fall Term Credit Stat Hx 08SEP16
Nbr. Pct. Nbr. Pct. Nbr. Pct. Nbr. Pct.
Full-Time 8,910 43.0% 8,981 41.7% 8,929 41.4% -52 -0.6%
Part-Time 11,826 57.0% 12,549 58.3% 12,632 58.6% 83 0.7%
Credit Hours Attempted
1-5 Credit Hours 2,662 12.8% 2,770 12.9% 2,828 13.1% 58 2.1%
6-8 Credit Hours 4,750 22.9% 5,041 23.4% 5,072 23.5% 31 0.6%
9-11 Credit Hours 4,414 21.3% 4,738 22.0% 4,732 21.9% -6 -0.1%
12+ Credit Hours 8,910 43.0% 8,981 41.7% 8,929 41.4% -52 -0.6%
TOTAL HEADCOUNT 20,736 100.0% 21,530 100.0% 21,561 100.0% 31 0.1%
Day/Evening Status
Day 14,657 70.7% 14,949 69.4% 14,720 68.3% -229 -1.6%
Evening 6,079 29.3% 6,581 30.6% 6,841 31.7% 260 3.8%
Gender
Female 11,105 53.6% 11,482 53.3% 11,621 53.9% 139 1.2%
Male 9,531 46.0% 9,964 46.3% 9,855 45.7% -109 -1.1%
Unknown 100 0.5% 84 0.4% 85 0.4% 1 1.2%
Ethnicity
African American 2,924 14.1% 3,223 15.0% 3,165 14.7% -58 -1.8%
Asian 828 4.0% 926 4.3% 997 4.6% 71 7.1%
Caucasian 8,178 39.4% 7,955 36.9% 7,480 34.7% -475 -6.4%
Hawaiian 72 0.3% 74 0.3% 81 0.4% 7 8.6%
Hispanic 6,523 31.5% 6,941 32.2% 7,373 34.2% 432 5.9%
Multi-Race 485 2.3% 540 2.5% 559 2.6% 19 3.4%
Native American 63 0.3% 76 0.4% 68 0.3% -8 -11.8%
Not Reported 1,663 8.0% 1,795 8.3% 1,838 8.5% 43 2.3%
TOTAL 20,736 100.0% 21,530 100.0% 21,561 100.0% 31 0.1%
Difference
2013/2014 2014/2015 2015/2016 2014/2015 - 2015/2016
Valencia College
Institutional Research 8.9Statistical History Fact Book
2015/2016

Valencia College
Osceola Campus
Fall End of Term
Credit Enrollment
2013/2014 - 2015/2016
Source: Fall Term Credit Stat Hx 08SEP16
Nbr. Pct. Nbr. Pct. Nbr. Pct. Nbr. Pct.
Full-Time 4,688 43.9% 4,566 43.0% 4,844 41.9% 278 5.7%
Part-Time 5,989 56.1% 6,055 57.0% 6,713 58.1% 658 9.8%
Credit Hours Attempted
1-5 Credit Hours 1,050 9.8% 1,063 10.0% 1,224 10.6% 161 13.2%
6-8 Credit Hours 2,590 24.3% 2,514 23.7% 2,716 23.5% 202 7.4%
9-11 Credit Hours 2,349 22.0% 2,478 23.3% 2,773 24.0% 295 10.6%
12+ Credit Hours 4,688 43.9% 4,566 43.0% 4,844 41.9% 278 5.7%
TOTAL HEADCOUNT 10,677 100.0% 10,621 100.0% 11,557 100.0% 936 8.1%
Day/Evening Status
Day 7,528 70.5% 7,428 69.9% 8,084 69.9% 656 8.1%
Evening 3,149 29.5% 3,193 30.1% 3,473 30.1% 280 8.1%
Gender
Female 6,224 58.3% 6,180 58.2% 6,683 57.8% 503 7.5%
Male 4,380 41.0% 4,396 41.4% 4,839 41.9% 443 9.2%
Unknown 73 0.7% 45 0.4% 35 0.3% -10 -28.6%
Ethnicity
African American 1,293 12.1% 1,339 12.6% 1,408 12.2% 69 4.9%
Asian 430 4.0% 437 4.1% 485 4.2% 48 9.9%
Caucasian 2,635 24.7% 2,393 22.5% 2,445 21.2% 52 2.1%
Hawaiian 44 0.4% 48 0.5% 46 0.4% -2 -4.3%
Hispanic 4,676 43.8% 4,798 45.2% 5,397 46.7% 599 11.1%
Multi-Race 198 1.9% 207 1.9% 235 2.0% 28 11.9%
Native American 27 0.3% 25 0.2% 27 0.2% 2 7.4%
Not Reported 1,374 12.9% 1,374 12.9% 1,514 13.1% 140 9.2%
TOTAL 10,677 100.0% 10,621 100.0% 11,557 100.0% 936 8.1%
Difference
2013/2014 2014/2015 2015/2016 2014/2015 - 2015/2016
Valencia College
Institutional Research 8.10Statistical History Fact Book
2015/2016

Valencia College
Winter Park Campus
Fall End of Term
Credit Enrollment
2013/2014 - 2015/2016
Source: Fall Term Credit Stat Hx 08SEP16
Nbr. Pct. Nbr. Pct. Nbr. Pct. Nbr. Pct.
Full-Time 1,553 42.6% 1,684 42.9% 1,736 42.9% 52 3.0%
Part-Time 2,090 57.4% 2,241 57.1% 2,310 57.1% 69 3.0%
Credit Hours Attempted
1-5 Credit Hours 394 10.8% 389 9.9% 432 10.7% 43 10.0%
6-8 Credit Hours 886 24.3% 949 24.2% 916 22.6% -33 -3.6%
9-11 Credit Hours 810 22.2% 903 23.0% 962 23.8% 59 6.1%
12+ Credit Hours 1,553 42.6% 1,684 42.9% 1,736 42.9% 52 3.0%
TOTAL HEADCOUNT 3,643 100.0% 3,925 100.0% 4,046 100.0% 121 3.0%
Day/Evening Status
Day 2,131 58.5% 2,322 59.2% 2,353 58.2% 31 1.3%
Evening 1,512 41.5% 1,603 40.8% 1,693 41.8% 90 5.3%
Gender
Female 2,095 57.5% 2,276 58.0% 2,322 57.4% 46 2.0%
Male 1,533 42.1% 1,635 41.7% 1,705 42.1% 70 4.1%
Unknown 15 0.4% 14 0.4% 19 0.5% 5 26.3%
Ethnicity
African American 493 13.5% 554 14.1% 577 14.3% 23 4.0%
Asian 127 3.5% 155 3.9% 162 4.0% 7 4.3%
Caucasian 1,660 45.6% 1,713 43.6% 1,662 41.1% -51 -3.1%
Hawaiian 12 0.3% 11 0.3% 17 0.4% 6 35.3%
Hispanic 944 25.9% 1,017 25.9% 1,156 28.6% 139 12.0%
Multi-Race 88 2.4% 130 3.3% 100 2.5% -30 -30.0%
Native American 10 0.3% 14 0.4% 16 0.4% 2 12.5%
Not Reported 309 8.5% 331 8.4% 356 8.8% 25 7.0%
TOTAL 3,643 100.0% 3,925 100.0% 4,046 100.0% 121 3.0%
Difference
2013/2014 2014/2015 2015/2016 2014/2015 - 2015/2016
Valencia College
Institutional Research 8.11Statistical History Fact Book
2015/2016
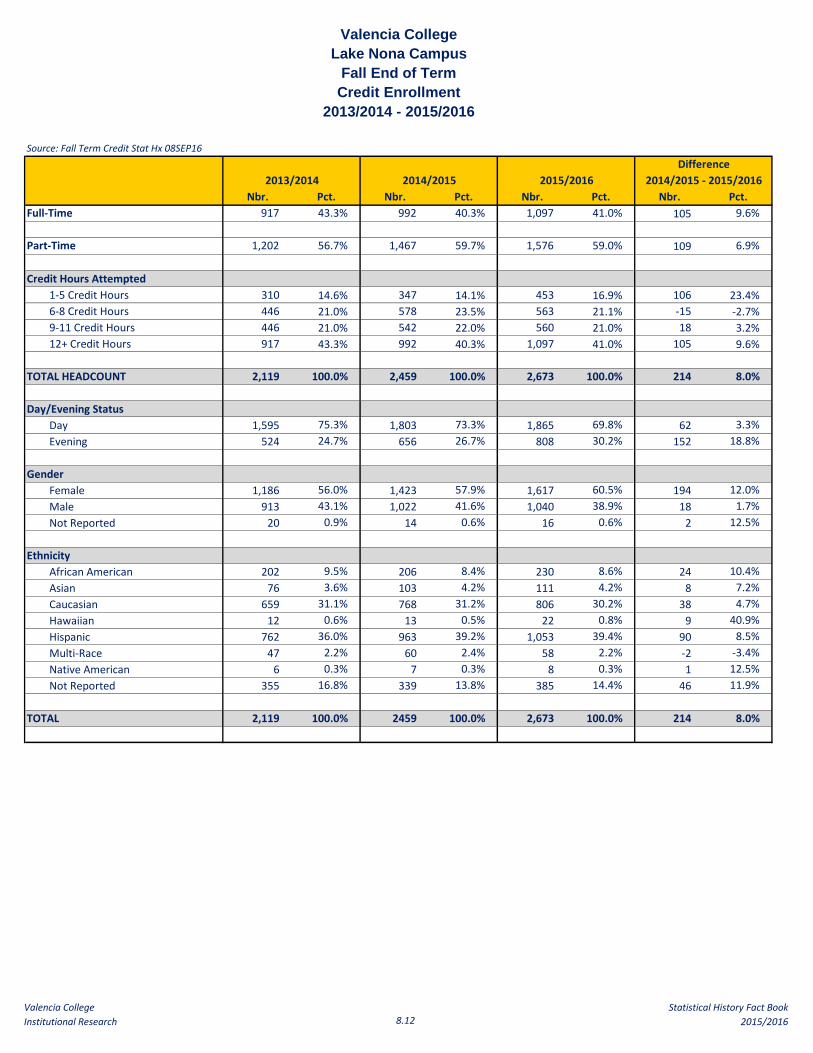
Valencia College
Lake Nona Campus
Fall End of Term
Credit Enrollment
2013/2014 - 2015/2016
Source: Fall Term Credit Stat Hx 08SEP16
Nbr. Pct. Nbr. Pct. Nbr. Pct. Nbr. Pct.
Full-Time 917 43.3% 992 40.3% 1,097 41.0% 105 9.6%
Part-Time 1,202 56.7% 1,467 59.7% 1,576 59.0% 109 6.9%
Credit Hours Attempted
1-5 Credit Hours 310 14.6% 347 14.1% 453 16.9% 106 23.4%
6-8 Credit Hours 446 21.0% 578 23.5% 563 21.1% -15 -2.7%
9-11 Credit Hours 446 21.0% 542 22.0% 560 21.0% 18 3.2%
12+ Credit Hours 917 43.3% 992 40.3% 1,097 41.0% 105 9.6%
TOTAL HEADCOUNT 2,119 100.0% 2,459 100.0% 2,673 100.0% 214 8.0%
Day/Evening Status
Day 1,595 75.3% 1,803 73.3% 1,865 69.8% 62 3.3%
Evening 524 24.7% 656 26.7% 808 30.2% 152 18.8%
Gender
Female 1,186 56.0% 1,423 57.9% 1,617 60.5% 194 12.0%
Male 913 43.1% 1,022 41.6% 1,040 38.9% 18 1.7%
Not Reported 20 0.9% 14 0.6% 16 0.6% 2 12.5%
Ethnicity
African American 202 9.5% 206 8.4% 230 8.6% 24 10.4%
Asian 76 3.6% 103 4.2% 111 4.2% 8 7.2%
Caucasian 659 31.1% 768 31.2% 806 30.2% 38 4.7%
Hawaiian 12 0.6% 13 0.5% 22 0.8% 9 40.9%
Hispanic 762 36.0% 963 39.2% 1,053 39.4% 90 8.5%
Multi-Race 47 2.2% 60 2.4% 58 2.2% -2 -3.4%
Native American 6 0.3% 7 0.3% 8 0.3% 1 12.5%
Not Reported 355 16.8% 339 13.8% 385 14.4% 46 11.9%
TOTAL 2,119 100.0% 2459 100.0% 2,673 100.0% 214 8.0%
2013/2014 2014/2015 2015/2016 2014/2015 - 2015/2016
Difference
Valencia College
Institutional Research 8.12Statistical History Fact Book
2015/2016

Valencia College
Collegewide
Spring End of Term
Credit Enrollment
2013/2014 - 2015/2016
Source: Spring Term Credit Stat Hx 08SEP16
Nbr. Pct. Nbr. Pct. Nbr. Pct. Nbr. Pct.
Full-Time 13,986 35.3% 13,893 34.4% 14,141 34.9% 248 1.8%
Part-Time 25,633 64.7% 26,457 65.6% 26,395 65.1% -62 -0.2%
Credit Hours Attempted
1-5 Credit Hours 6,477 16.3% 6,948 17.2% 7,012 17.3% 64 0.9%
6-8 Credit Hours 10,069 25.4% 10,159 25.2% 9,980 24.6% -179 -1.8%
9-11 Credit Hours 9,087 22.9% 9,350 23.2% 9,403 23.2% 53 0.6%
12+ Credit Hours 13,986 35.3% 13,893 34.4% 14,141 34.9% 248 1.8%
TOTAL HEADCOUNT 39,619 100.0% 40,350 100.0% 40,536 100.0% 186 0.5%
Day/Evening Status
Day 28,800 72.7% 28,829 71.4% 29,071 71.7% 242 0.8%
Evening 10,819 27.3% 11,521 28.6% 11,465 28.3% -56 -0.5%
Gender
Female 21,815 55.1% 22,201 55.0% 22,472 55.4% 271 1.2%
Male 17,594 44.4% 17,974 44.5% 17,879 44.1% -95 -0.5%
Unknown 210 0.5% 175 0.4% 185 0.5% 10 5.4%
Ethnicity
African American 6,835 17.3% 6,977 17.3% 6,761 16.7% -216 -3.2%
Asian 1,860 4.7% 1,906 4.7% 1,929 4.8% 23 1.2%
Caucasian 13,080 33.0% 12,600 31.2% 12,010 29.6% -590 -4.9%
Hawaiian 171 0.4% 191 0.5% 173 0.4% -18 -10.4%
Hispanic 12,786 32.3% 13,584 33.7% 14,159 34.9% 575 4.1%
Multi-Race 846 2.1% 948 2.3% 963 2.4% 15 1.6%
Native American 115 0.3% 129 0.3% 127 0.3% -2 -1.6%
Not Reported 3,926 9.9% 4,015 10.0% 4,414 10.9% 399 9.0%
Total 39,619 100.0% 40,350 100.0% 40,536 100.0% 186 0.5%
Difference
2013/2014 2014/2015 2015/2016 2014/2015 - 2015/2016
Valencia College
Institutional Research 8.13Statistical History Fact Book
2015/2016

Valencia College
West Campus
Spring End of Term
Credit Enrollment
2013/2014 - 2015/2016
Source: Spring Term Credit Stat Hx 08SEP16
Nbr. Pct. Nbr. Pct. Nbr. Pct. Nbr. Pct.
Full-Time 5,983 35.8% 5,965 34.9% 6,257 35.6% 292 4.7%
Part-Time 10,728 64.2% 11,146 65.1% 11,311 64.4% 165 1.5%
Credit Hours Attempted
1-5 Credit Hours 2,106 12.6% 2,304 13.5% 2,353 13.4% 49 2.1%
6-8 Credit Hours 4,273 25.6% 4,391 25.7% 4,349 24.8% -42 -1.0%
9-11 Credit Hours 4,349 26.0% 4,451 26.0% 4,609 26.2% 158 3.4%
12+ Credit Hours 5,983 35.8% 5,965 34.9% 6,257 35.6% 292 4.7%
TOTAL HEADCOUNT 16,711 100.0% 17,111 100.0% 17,568 100.0% 457 2.6%
Day/Evening Status
Day 12,229 73.2% 12,202 71.3% 12,460 70.9% 258 2.1%
Evening 4,482 26.8% 4,909 28.7% 5,108 29.1% 199 3.9%
Gender
Female 9,242 55.3% 9,583 56.0% 9,845 56.0% 262 2.7%
Male 7,375 44.1% 7,444 43.5% 7,645 43.5% 201 2.6%
Unknown 94 0.6% 84 0.5% 78 0.4% -6 -7.7%
Ethnicity
African American 3,911 23.4% 3,983 23.3% 3,801 21.6% -182 -4.8%
Asian 942 5.6% 954 5.6% 984 5.6% 30 3.0%
Caucasian 5,432 32.5% 5,294 30.9% 5,237 29.8% -57 -1.1%
Hawaiian 80 0.5% 88 0.5% 90 0.5% 2 2.2%
Hispanic 4,373 26.2% 4,760 27.8% 5,171 29.4% 411 7.9%
Multi-Race 331 2.0% 404 2.4% 421 2.4% 17 4.0%
Native American 58 0.3% 54 0.3% 68 0.4% 14 20.6%
Not Reported 1,584 9.5% 1,574 9.2% 1,796 10.2% 222 12.4%
Total 16,711 100.0% 17,111 100.0% 17,568 100.0% 457 2.6%
Difference
2013/2014 2014/2015 2015/2016 2014/2015 - 2015/2016
Valencia College
Institutional Research 8.14Statistical History Fact Book
2015/2016
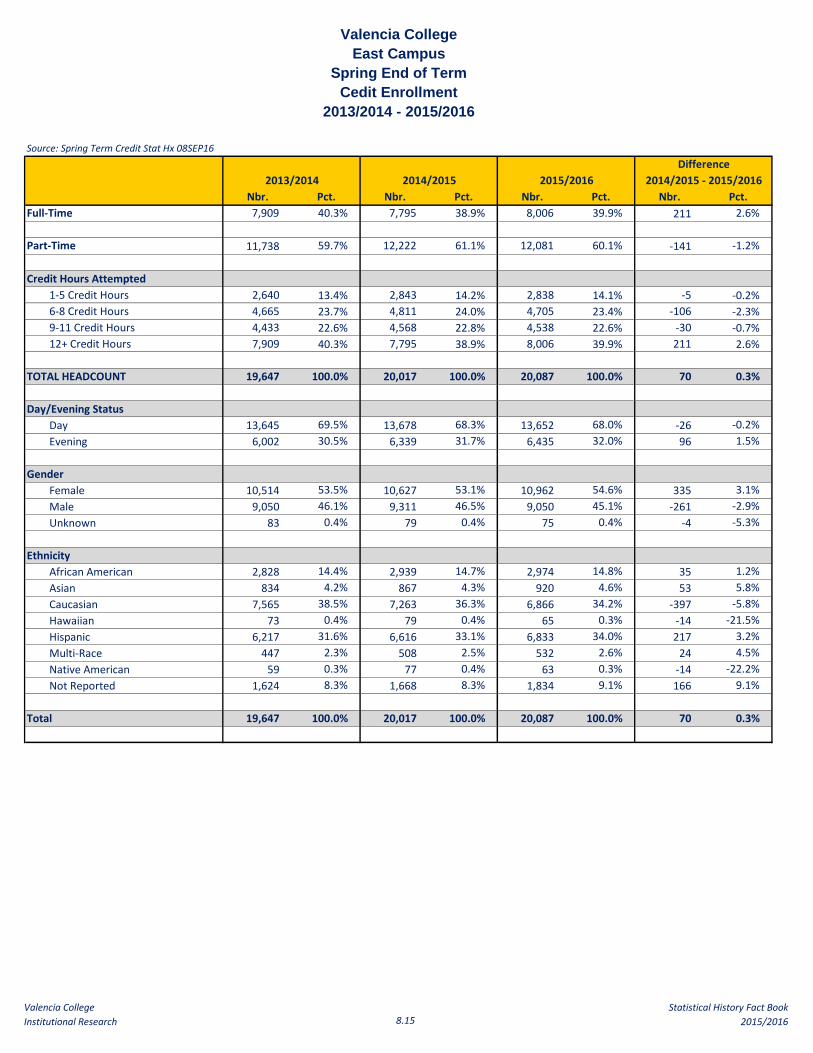
Valencia College
East Campus
Spring End of Term
Cedit Enrollment
2013/2014 - 2015/2016
Source: Spring Term Credit Stat Hx 08SEP16
Nbr. Pct. Nbr. Pct. Nbr. Pct. Nbr. Pct.
Full-Time 7,909 40.3% 7,795 38.9% 8,006 39.9% 211 2.6%
Part-Time 11,738 59.7% 12,222 61.1% 12,081 60.1% -141 -1.2%
Credit Hours Attempted
1-5 Credit Hours 2,640 13.4% 2,843 14.2% 2,838 14.1% -5 -0.2%
6-8 Credit Hours 4,665 23.7% 4,811 24.0% 4,705 23.4% -106 -2.3%
9-11 Credit Hours 4,433 22.6% 4,568 22.8% 4,538 22.6% -30 -0.7%
12+ Credit Hours 7,909 40.3% 7,795 38.9% 8,006 39.9% 211 2.6%
TOTAL HEADCOUNT 19,647 100.0% 20,017 100.0% 20,087 100.0% 70 0.3%
Day/Evening Status
Day 13,645 69.5% 13,678 68.3% 13,652 68.0% -26 -0.2%
Evening 6,002 30.5% 6,339 31.7% 6,435 32.0% 96 1.5%
Gender
Female 10,514 53.5% 10,627 53.1% 10,962 54.6% 335 3.1%
Male 9,050 46.1% 9,311 46.5% 9,050 45.1% -261 -2.9%
Unknown 83 0.4% 79 0.4% 75 0.4% -4 -5.3%
Ethnicity
African American 2,828 14.4% 2,939 14.7% 2,974 14.8% 35 1.2%
Asian 834 4.2% 867 4.3% 920 4.6% 53 5.8%
Caucasian 7,565 38.5% 7,263 36.3% 6,866 34.2% -397 -5.8%
Hawaiian 73 0.4% 79 0.4% 65 0.3% -14 -21.5%
Hispanic 6,217 31.6% 6,616 33.1% 6,833 34.0% 217 3.2%
Multi-Race 447 2.3% 508 2.5% 532 2.6% 24 4.5%
Native American 59 0.3% 77 0.4% 63 0.3% -14 -22.2%
Not Reported 1,624 8.3% 1,668 8.3% 1,834 9.1% 166 9.1%
Total 19,647 100.0% 20,017 100.0% 20,087 100.0% 70 0.3%
Difference
2013/2014 2014/2015 2015/2016 2014/2015 - 2015/2016
Valencia College
Institutional Research 8.15Statistical History Fact Book
2015/2016

Valencia College
Osceola Campus
Spring End of Term
Credit Enrollment
2013/2014 - 2015/2016
Source: Spring Term Credit Stat Hx 08SEP16
Nbr. Pct. Nbr. Pct. Nbr. Pct. Nbr. Pct.
Full-Time 4,258 41.0% 4,347 40.6% 4,528 40.9% 181 4.0%
Part-Time 6,134 59.0% 6,356 59.4% 6,533 59.1% 177 2.7%
Credit Hours Attempted
1-5 Credit Hours 1,048 10.1% 1,149 10.7% 1,190 10.8% 41 3.4%
6-8 Credit Hours 2,645 25.5% 2,605 24.3% 2,620 23.7% 15 0.6%
9-11 Credit Hours 2,441 23.5% 2,602 24.3% 2,723 24.6% 121 4.4%
12+ Credit Hours 4,258 41.0% 4,347 40.6% 4,528 40.9% 181 4.0%
TOTAL HEADCOUNT 10,392 100.0% 10,703 100.0% 11,061 100.0% 358 3.2%
Day/Evening Status
Day 7,220 69.5% 7,321 68.4% 7,776 70.3% 455 5.9%
Evening 3,172 30.5% 3,382 31.6% 3,285 29.7% -97 -3.0%
Gender
Female 6,110 58.8% 6,194 57.9% 6,347 57.4% 153 2.4%
Male 4,220 40.6% 4,478 41.8% 4,672 42.2% 194 4.2%
Unknown 62 0.6% 31 0.3% 42 0.4% 11 26.2%
Ethnicity
African American 1,297 12.5% 1,336 12.5% 1,347 12.2% 11 0.8%
Asian 430 4.1% 441 4.1% 438 4.0% -3 -0.7%
Caucasian 2,557 24.6% 2,435 22.8% 2,399 21.7% -36 -1.5%
Hawaiian 43 0.4% 55 0.5% 45 0.4% -10 -22.2%
Hispanic 4,530 43.6% 4,789 44.7% 5,060 45.7% 271 5.4%
Multi-Race 187 1.8% 211 2.0% 218 2.0% 7 3.2%
Native American 21 0.2% 29 0.3% 31 0.3% 2 6.5%
Not Reported 1,327 12.8% 1,407 13.1% 1,523 13.8% 116 7.6%
TOTAL 10,392 100.0% 10,703 100.0% 11,061 100.0% 358 3.2%
Difference
2013/2014 2014/2015 2015/2016 2014/2015 - 2015/2016
Valencia College
Institutional Research 8.16Statistical History Fact Book
2015/2016
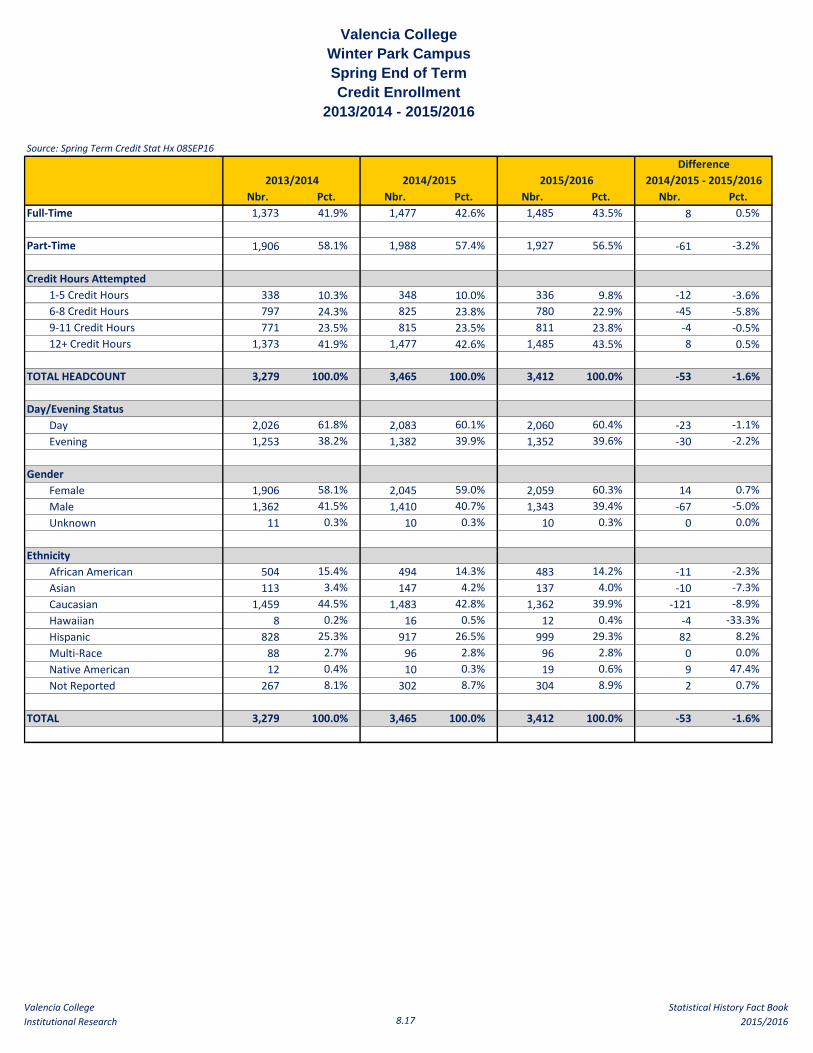
Valencia College
Winter Park Campus
Spring End of Term
Credit Enrollment
2013/2014 - 2015/2016
Source: Spring Term Credit Stat Hx 08SEP16
Nbr. Pct. Nbr. Pct. Nbr. Pct. Nbr. Pct.
Full-Time 1,373 41.9% 1,477 42.6% 1,485 43.5% 8 0.5%
Part-Time 1,906 58.1% 1,988 57.4% 1,927 56.5% -61 -3.2%
Credit Hours Attempted
1-5 Credit Hours 338 10.3% 348 10.0% 336 9.8% -12 -3.6%
6-8 Credit Hours 797 24.3% 825 23.8% 780 22.9% -45 -5.8%
9-11 Credit Hours 771 23.5% 815 23.5% 811 23.8% -4 -0.5%
12+ Credit Hours 1,373 41.9% 1,477 42.6% 1,485 43.5% 8 0.5%
TOTAL HEADCOUNT 3,279 100.0% 3,465 100.0% 3,412 100.0% -53 -1.6%
Day/Evening Status
Day 2,026 61.8% 2,083 60.1% 2,060 60.4% -23 -1.1%
Evening 1,253 38.2% 1,382 39.9% 1,352 39.6% -30 -2.2%
Gender
Female 1,906 58.1% 2,045 59.0% 2,059 60.3% 14 0.7%
Male 1,362 41.5% 1,410 40.7% 1,343 39.4% -67 -5.0%
Unknown 11 0.3% 10 0.3% 10 0.3% 0 0.0%
Ethnicity
African American 504 15.4% 494 14.3% 483 14.2% -11 -2.3%
Asian 113 3.4% 147 4.2% 137 4.0% -10 -7.3%
Caucasian 1,459 44.5% 1,483 42.8% 1,362 39.9% -121 -8.9%
Hawaiian 8 0.2% 16 0.5% 12 0.4% -4 -33.3%
Hispanic 828 25.3% 917 26.5% 999 29.3% 82 8.2%
Multi-Race 88 2.7% 96 2.8% 96 2.8% 0 0.0%
Native American 12 0.4% 10 0.3% 19 0.6% 9 47.4%
Not Reported 267 8.1% 302 8.7% 304 8.9% 2 0.7%
TOTAL 3,279 100.0% 3,465 100.0% 3,412 100.0% -53 -1.6%
Difference
2013/2014 2014/2015 2015/2016 2014/2015 - 2015/2016
Valencia College
Institutional Research 8.17Statistical History Fact Book
2015/2016

Valencia College
Lake Nona Campus
Spring End of Term
Credit Enrollment
2013/2014 - 2015/2016
Source: Spring Term Credit Stat Hx 08SEP16
Nbr. Pct. Nbr. Pct. Nbr. Pct. Nbr. Pct.
Full-Time 856 39.0% 862 39.5% 1,002 41.7% 140 14.0%
Part-Time 1,340 61.0% 1,321 60.5% 1,401 58.3% 80 5.7%
Credit Hours Attempted
1-5 Credit Hours 392 17.9% 358 16.4% 349 14.5% -9 -2.6%
6-8 Credit Hours 461 21.0% 476 21.8% 498 20.7% 22 4.4%
9-11 Credit Hours 487 22.2% 487 22.3% 554 23.1% 67 12.1%
12+ Credit Hours 856 39.0% 862 39.5% 1,002 41.7% 140 14.0%
TOTAL HEADCOUNT 2,196 100.0% 2,183 100.0% 2,403 100.0% 220 9.2%
Day/Evening
Day 1,596 72.7% 1,621 74.3% 1,818 75.7% 197 10.8%
Evening 600 27.3% 562 25.7% 585 24.3% 23 3.9%
Gender
Female 1,245 56.7% 1,264 57.9% 1,414 58.8% 150 10.6%
Male 932 42.4% 907 41.5% 965 40.2% 58 6.0%
Unknown 19 0.9% 12 0.5% 24 1.0% 12 50.0%
Ethnicity
African American 196 8.9% 167 7.7% 215 8.9% 48 22.3%
Asian 87 4.0% 108 4.9% 83 3.5% -25 -30.1%
Caucasian 748 34.1% 692 31.7% 700 29.1% 8 1.1%
Hawaiian 11 0.5% 17 0.8% 18 0.7% 1 5.6%
Hispanic 772 35.2% 805 36.9% 947 39.4% 142 15.0%
Multi-Race 55 2.5% 53 2.4% 48 2.0% -5 -10.4%
Native American 7 0.3% 7 0.3% 9 0.4% 2 22.2%
Not Reported 320 14.6% 334 15.3% 383 15.9% 49 12.8%
Total 2,196 100.0% 2,183 100.0% 2,403 100.0% 220 9.2%
Difference
2013/2014 2014/2015 2015/2016 2014/2015 - 2015/2016
Valencia College
Institutional Research 8.18Statistical History Fact Book
2015/2016

Valencia College Glossary of Terms Used in Institutional Research Reports
Valencia College 8. 19 Statistical History Fact Book Institutional Research 2015/2016
ACCOUNTABILITY REPORT – a process where data-based measures are used to provide information on institutional performance. Accountability Reports, published by the Florida Community Colleges and Technical Center Management and Information System (CCTCMIS), contain fall cohort benchmark measures calculated from data submitted by Florida State Colleges. These reports include prior year high school graduate enrollments, student retention and success, performance indicators for degree graduates who transfer to state universities by college prep and non-college prep, and vocational program placement.
AGE
Mean Age – the age obtained by computing the arithmetic average of all the Valencia students' ages.
Median Age – the 50th percentile, obtained by creating a list of the ages of all the students in numerical order. The total number of students is divided by 2. The resulting quantity (rounded up to the next integer value if necessary) will be called position X. Starting from either end of the list and counting up or down to X, the middle age is found, corresponding to position X. That is the MEDIAN. For example, if there were 7 students and the list of their ages looked like this: 17 17 18 18 18 19 19, the median would be 18 (the second of the three 18s, in the fourth, or middle, position).
ALTERNATIVE DELIVERY – all modes of instruction other than traditional course delivery and may include web-enhanced, hybrid, online, and computer-assisted. The intent of alternative delivery courses is to provide flexibility to students who are attempting to balance work, family and college, and still reach their career and academic goals.
Hybrid/Blended Course – a course that blends online and face-to-face delivery. A certain percentage of course instruction is delivered via electronic means and a certain percentage of instruction is conducted face-to-face. (Some hours are spent in the classroom with the rest being completed online.)
Online Course - a course where all of the content is delivered online using the college approved Course Management System. (All class meetings and coursework occur online. Proctored testing may be required.)
Web Enhanced/Facilitated – a course which may use web-based technology to enhance a face-to-face course. Uses a Course Management System (CMS) or web pages to post the syllabus and assignments. (All meetings are face-to-face.)
APPLICATION and ADMISSION – the process of completing and submitting an application to attend Valencia. Specific criteria must be met before an applicant is admitted to Valencia (see page 20 & 21 of Valencia Catalog).
Applied Student – one who completed Valencia’s application.
Admitted Student – a student whose application has been reviewed and accepted but may not have already registered for classes at Valencia.
Active Student – a student who has enrolled in credit courses at Valencia within the past 24 months.
Enrolled Student – a student who registered for one or more courses.
ARTICULATION – a State Board of Education rule that establishes provisions to facilitate the smooth transition of students through the various levels of Florida’s educational system.
AtD (Achieving the Dream: Community Colleges Count) – is a multiyear national initiative to help more community college students succeed. The initiative is particularly concerned about student groups that traditionally have faced significant barriers to success, including students of color and low-income students. Achieving the Dream is working to help more students earn certificates or degrees that open the door to better jobs, further education, and greater opportunity. Valencia’s participation in AtD ended in 2009 the knowledge gained and the criteria used during the AtD process is often used for Valencia’s internal reporting.

Valencia College Glossary of Terms Used in Institutional Research Reports
Valencia College 8. 20 Statistical History Fact Book Institutional Research 2015/2016
CAMPUS LOCATIONS and OFFERINGS (*Associate in Applied Science (AAS) and Associate in Science (AS) Degree programs are composed of general and specialized courses. General education courses are taught at all college locations. Due to the need for equipment, some specialized courses may need to be taken at a specific campus.)
District Office (DO) – located at 1768 Park Center Drive, Orlando, FL 32835. College Administration and Valencia Foundation are located at the DO.
East Campus – located at 701 North Econlockhatchee Trail, Orlando, Florida. This campus houses the Performing Arts Center/Black Box Theater and Alumni Association Office. In addition, the following programs are offered on East Campus: AA, AAS*, and AS* Degree Programs, Applied Technology Diploma, and Certificate Programs, and Honors Program. Students who apply and maintain their home records on this campus are considered East Campus enrollees.
Lake Nona Campus – 12500 Narcoossee Road, Bldg. 400, Orlando, Florida. This Campus houses the Collegiate Academy which includes credit courses in Math, Science, Communications and Social Sciences. This location also offers noncredit Foreign Language courses and is located near Orlando’s Medical City.
Osceola Campus – located at 1800 Denn John Lane, Kissimmee, Florida. The following programs are offered on Osceola Campus: AA, AAS*, and AS* Degree Programs, Applied Technology Diploma, Certificate Programs, Corporate and Continuing Education, and Honors Program.
School of Public Safety – located at 8600 Valencia College Lane, Orlando, Florida. Career Certificate Programs in Public Safety are offered at this location. Valencia’s Human Resources office is also located at this site.
West Campus – located at 1800 South Kirkman Road, Orlando, Florida. The following programs are offered on West Campus: AA, AAS*, and AS* Degree Programs, Applied Technology Diploma, Certificate Programs, and Honors Program. Beginning Fall 2011, Bachelor’s Degrees are offered in Electrical and Computer Engineering Technology (B.S.E.C.E.T Degree), and Radiologic and Imaging Sciences (A.S. to B.S. Degree). Students who apply and maintain their home records on this campus are considered West Campus enrollees.
Winter Park Campus – located 850 West Morse Boulevard, Winter Park, Florida. The following programs are offered on Winter Park Campus: Honors Program, Corporate and Continuing Education, AA Degree Programs, Certificate Programs, Teacher Recertification, Weekend College, and Career Assessment & Employability Skills.
CAREER PATHWAYS (formerly Tech Prep) - Students begin Career Pathways in high school focusing on higher academics and technical skills, then link their high school studies with at least two years at an Orange or Osceola county technical school or Valencia College. This can lead to a two-year certificate, associate’s degree, or a four-year college degree. After taking designated technical courses at their high schools, Career Pathways students participate in an assessment and are eligible to receive credit when they enroll at Valencia. By earning college credit while in high school, students make a smooth transition between high school and college by not duplicating coursework and save time and tuition/book money.
COURSE CLASSIFICATION
Advanced & Professional (A & P) – college credit courses and instructional programs designed to provide the first two years of course work for transfer to an upper-division institution.
Continuing Workforce Education (CWE) – noncredit courses designed for students who are already employed when they enroll at Valencia and whose primary objective is to enhance specific vocational abilities. These courses are not funded by the State. CWE courses do not earn college credit or postsecondary adult vocational credit.
Developmental Education (formerly College Preparatory) – courses intended to bridge the gap between secondary school and college for students with specifically identified deficiencies. The courses are credit earning but may not be applied toward a degree or certificate. These courses are designed to meet the academic needs of educationally disadvantaged students.
Educator Preparation Institute (EPI) – Educator Preparation Institute prepares students with a bachelor’s degree in a discipline other than education to become classroom teachers in Florida. EPI courses provide institutional credit, are not transferable to an upper-division institution, and do not count toward any degree.

Valencia College Glossary of Terms Used in Institutional Research Reports
Valencia College 8. 21 Statistical History Fact Book Institutional Research 2015/2016
Lifelong Learning – noncredit courses that are not in the workforce arena. These courses are not funded by the State, do not belong to a program, and have an ICS code of 13300 (CLAST preparatory courses, study skills, and senior citizen physical education courses are lifelong learning courses). These courses are designed to review and improve a student's competencies. Students do not earn college credit for these courses.
Lifelong Learning (College Credit LLL) – a student enrolled in a non-repeatable college credit course in which the student previously received a grade of A, B, or C. Grade forgiveness may not be used after the second enrollment. Enrollments are not funded by the State of Florida.
Post Secondary Adult Vocational (PSAV) – certificate career education, job preparatory courses and programs through which a student receives an adult vocational certificate upon completion of instruction. Students earn vocational credit but not college credit for completion of these courses. PSAV credit does not apply to college credit programs.
Post Secondary Vocational (PSV) – college credit courses that are part of an Associate in Science Degree (AS), Associate in Applied Science Degree (AAS), Vocational Credit Certificate (PSVC), applied Technology diploma (ATD), or an Advanced Technical Certificate (ATC). Select Postsecondary Vocational courses may be used to satisfy elective credit for an Associate of Arts Degree.
CERTIFICATE-SEEKING STUDENT – a student who fulfilled Valencia’s application and admission requirements and is pursuing programs to prepare him/her for immediate entry into a career in the workforce. Valencia offers an Advanced Technical Certificate (ATC), an Applied Technology Diploma (ATD), Career Certificates, and Technical Certificates.
Advanced Technical Certificate (ATC) – an extension of a specific AS degree program that consists of at least nine (9) but less than 45 credits of college-level course work. Students who have already received an AS degree and are seeking a specialized program of study to supplement their associate degree may seek an ATC. Students receive a certificate upon completion of the program.
Applied Technology Diploma (ATD) – a program prepares students for immediate entry in to a career in the workforce. ATD programs require prescribed technical courses and a minimum of 11 college credits. These credits are applicable towards a related AAS or AS degree if the student meets degree-seeking requirements. The EMT Applied Technology Diploma is the only ATD offered at Valencia and the courses can be applied toward the AS Degree in Emergency Medical Services Technology. ATD students receive a diploma upon completion of the diploma program.
Post Secondary Adult Vocational Certificate (PSAV) – programs that prepare students for careers directly in the workforce. The programs require prescribed technical credit courses and basic skills proficiency achieved through college-preparatory courses. The only Career Certificate program offered at Valencia is offered through the School of Public Safety.
Technical Vocational Certificate (PSVC) – programs that prepare students for immediate entry into a career in the workforce. Technical Certificate programs require prescribed technical courses, and do require general education courses, for a minimum of 12 college credits. These credits are applicable towards a related AAS or AS degree if the student meets degree-seeking requirements.
COHORT – a group followed through time, whose members share a significant experience or have one or more similar characteristics (e. g. ALL Valencia FTIC (first time in college) students, ages 20 through 29, who began Valencia during Fall 2009).
DAY or EVENING STUDENT
Day Student – a student enrolled in courses that meet during the day (prior to 5:00 p.m.). Counts are unduplicated during the day; however, students may also be counted as an evening student if they are also enrolled in night courses.
Evening Student – a student enrolled in courses that meet during evening hours (after 5:00 p.m.). Counts are unduplicated for the evenings; however, students may also be counted as day students if they are also enrolled in day courses.
Valencia College Glossary of Terms Used in Institutional Research Reports
Valencia College 8. 22 Statistical History Fact Book Institutional Research 2015/2016
DEGREE-SEEKING STUDENT – a student who fulfilled Valencia’s application and admission requirements and is pursuing an associate degree program (AA, AAS, or AS) or Bachelor’s degree at Valencia.
Associate in Applied Science (AAS) – a two-year technical degree program that indicates a student has trained in a particular field and is prepared for employment (degree designated for job entry).
Associate in Arts (AA) – a two-year degree program designed to provide the freshman and sophomore levels of education to students intending to transfer to an upper-division institution.
Associate in Science (AS) – a two-year technical degree program that contains 15-18 credit hours of transferable general education courses. This program is designed to prepare students for employment in a vocational technical career without subsequent upper-division training.
Bachelor’s Degree – Valencia’s bachelor's degree programs require about four years of study, but differ from standard baccalaureate programs. Here, students must first complete an associate degree before they can transfer into the bachelor's degree programs.
DEI (Developmental Education Initiative) – is a national effort to increase the number of students who complete their developmental education courses successfully and move on to college-level courses. Valencia’ participation in DEI will end in the summer of 2012; the knowledge gained and the criteria used during the DEI process is often used for Valencia’s internal reporting.
DIRECT CONNECT – an agreement with UCF (University of Central Florida) in which Valencia students receive guaranteed admission to a bachelor’s degree program, increased opportunity to complete a bachelor’s degree on a Valencia campus, and preferential admission to select bachelor degree programs.
DUAL ENROLLMENT – an acceleration mechanism by which high school students may simultaneously earn credit toward high school completion and a college degree. Dual enrollment students pay no tuition. Dual enrolled students may attend courses on a Valencia campus, on a high school campus, or online.
ENTRY LEVEL TESTING and PLACEMENT
CPT (Computerized Placement Test) – the primary entry testing used for placement in English, reading, and mathematics. Subtests include CPT Reading Skills (R), CPT Sentence Skills (W), CPT Arithmetic (M), and CPT Elementary Algebra (A). CPT College Level Math (I) is optional. Appropriate ACT or SAT scores may exempt a student from taking the CPT.
PERT (Postsecondary Education Readiness Test) – PERT assesses English, reading, and mathematics skills. Students are exempt from taking the PERT, unless needed as a prerequisite for a specific course, or they provide written documentation for one of Valencia’s approved exceptions.
ETHNICITY / RACE – a self-reported classification on Valencia’s application. Students are able to indicate their ethnicity (Hispanic/Latino OR Not Hispanic/Latino) and may choose from one of the following race categories: American Indian/Alaskan Native, Asian, Black or African American, Native Hawaiian or Other Pacific Islander, or White.
Depending on the specific report, Valencia College internally reports Ethnicity/Race data into either four or six categories. Four categories include African American, Caucasian, Hispanic, and Other. Six categories include African American, Asian/Pacific Islander, Caucasian, Hispanic, Native American, and Other. (Other category includes all who did not indicate an Ethnicity/Race category).
FETPIP (Florida Education and Training Placement Information Program) – this program obtains follow-up data by matching the social security numbers of former students with information housed in various state and federal agencies. The 1989 Florida Legislature established this program as the primary resource for all public education agencies for the collection of graduate and leaver follow-up information.

Valencia College Glossary of Terms Used in Institutional Research Reports
Valencia College 8. 23 Statistical History Fact Book Institutional Research 2015/2016
Placement – graduates of an AA degree program are considered placed if they are continuing their education in an upper-division institution or serving in the military. Graduates of AAS and AS degree programs are placed if they are employed in a related field, are continuing their education, or are serving in the military. Certificate completers are placed if they are employed in a related field or serving in the military.
FOE (Foundations of Excellence) – a one-year self-study, with guidance from the Policy Center on the First Year of College, to develop a formal Start Right or New Student Experience. Valencia participated in FOE during 2008-2009; the knowledge gained and the criteria used during the FOE process are often used for Valencia’s internal reporting.
FTE (Full-Time Equivalent)
Credit FTE – equals weekly course credit hours multiplied by course total enrollments divided by 30; one course credit hour is defined as 50 minutes of instruction per week. This is a method of funding defined by the State Department of Education.
Noncredit FTE – equals term total course contact hours multiplied by total course enrollments divided by 900; one contact hour is defined as 60 minutes of instruction. This is a method of funding defined by the State Department of Education.
FTIC (First Time in College) Student – a new Valencia student who has never attended any college prior to enrolling at Valencia.
FTAV (First Time at Valencia) Student – a new Valencia student who has attended another institution prior to enrolling at Valencia.
FULL-TIME/PART-TIME STUDENT
Full-Time Student – a student enrolled in 12 or more credit hours in Fall, Spring, or Summer terms.
Part-Time Student – a student enrolled in fewer than 12 credit hours in Fall, Spring, or Summer terms.
GATEWAY COURSES – high-enrolled courses that are taken by students early in their education at Valencia; six courses were targeted by the AtD (Achieving the Dream) Initiative. These courses included MAT0018C (Developmental Math I), MAT0028C (Developmental Math II), MAT1033 (Elementary Algebra), MAC1105 (College Algebra), ENC1101 (English Composition I), and POS2041 (U. S. Government I).
GPA (Grade Point Average) – obtained by dividing quality points earned (based on grades) by credits. GPAs range from 0.0 to 4.0. The following GPA types are calculated at Valencia: Institutional GPA (all course work at Valencia), Overall GPA (all course work, including transfer and college preparatory), Term GPA (all course work attempted and earned for a given term), and Transfer GPA (all course work from other institutions). For certain reports, the Institutional Research Office also groups GPAs by course, department, college credit, college prep, etc.
Quality Points – the value, ranging from 0 to 4, for grades from A to F for all courses completed, used in determining a grade point average (GPA).
GRADES
Success grades and rates – A, B, or C. (For some courses, a D constitutes a successful completion of the course; for Valencia data reporting, a D constitutes an unsuccessful completion of the course.)
Non Success grades and rates – D, F, I (Incomplete), W (Withdrawal), WP (Withdrawal, Passing), or WF (Withdrawal, Failing).
Withdrawal grades and rates – W (Withdrawal), WP (Withdrawal Passing), or WF (Withdrawal Failing).

Valencia College Glossary of Terms Used in Institutional Research Reports
Valencia College 8. 24 Statistical History Fact Book Institutional Research 2015/2016
o Prior to Fall 2010, Valencia issued grades of WP (Withdrawal Passing) and WF (Withdrawal Failing). A WP is not calculated in the student’s GPA; while a WF is calculated as an F with 0 quality points.
INTERNATIONAL STUDENT – a student who enters the United States on a nonimmigrant visa. Immigrants, refugees, and asylees ARE NOT international students. At Valencia, International students are referred to as SEVIS and non-SEVIS students depending on Department of Homeland Security reporting requirements.
SEVIS (Student and Exchange Visitor Information System) – is a web-accessible database used by the Department of Homeland Security to collect, track, and monitor information regarding exchange visitors, international students and scholars who enter the United States on F, M or J visa types. SEVIS is managed by the Student and Exchange Visitor Program (SEVP) within U. S. Immigration and Customs Enforcement.
LEVEL (Discipline) – a Banner term used to categorize courses and programs—credit, continuing workforce education, educator preparation institute, or post secondary adult vocational.
LinC (Learning in Community) – a program of linking two or more courses into one integrated course in which professors from different disciplines tie their courses together around a common theme.
MODES OF DELIVERY/MEDIUM
Face-to-Face/Onsite – a course where all content is delivered in a classroom setting on campus.
Hybrid/Blended– Course that blends online and face-to-face delivery. A certain percentage of course instruction is delivered via electronic means and a certain percentage of instruction is conducted face-to-face
Online – a course where all the content is delivered online using the college approved Course Management System. (All class meetings and coursework occur online. Proctored testing may be required.)
Web Enhanced/Facilitated – a course which may use web-based technology to enhance a face-to-face course. The course content uses a Course Management System (CMS) or web pages to post the syllabus and assignments. (All meetings are face-to-face.)
MSA (OR Orlando MSA) - Orlando Metropolitan Statistical Area includes Orange, Osceola, Seminole, and Lake Counties. Florida is divided into twenty MSAs. Metropolitan and micropolitan statistical areas (metro and micro areas) are geographic entities defined by the U. S. Office of Management and Budget (OMB) for use by Federal statistical agencies in collecting, tabulating, and publishing Federal statistics.
NEW STUDENT – According to Valencia’s FOE classification, a new student is one who has earned less than 15 college-credit hours at Valencia.
PERSONNEL CLASSIFICATION
Administrative/Executive/Management (EAM) - a personnel category defined by the Florida Accounting Manual which includes persons whose assignments are planning, organizing, and managing the institution or a subdivision within the institution. Officers holding such titles as President, Vice President, Provost, or Department Deans are reported here.
Faculty – a personnel category defined by the Florida College System that includes persons whose assignments are for the purpose of conducting instruction.
Noninstructional Professional – a personnel category defined by the Florida College System which includes staff members with assignments requiring professional training and are not reported under administrative or faculty. Such titles as Counselor, Coordinator, and Director are reported here.
Secretarial/Clerical – a personnel category defined by the Florida College System that includes persons whose assignments are associated with clerical activities or is specifically of a secretarial nature.

Valencia College Glossary of Terms Used in Institutional Research Reports
Valencia College 8. 25 Statistical History Fact Book Institutional Research 2015/2016
Service/Management – a personnel category defined by the Florida College System which includes persons whose assignments require the performance of duties which provide comfort, convenience, and hygiene to personnel and students or the upkeep and care of buildings, facilities, or grounds. Examples include custodians, groundskeepers, and security personnel.
Teaching/Laboratory Assistants – a personnel category defined by the Florida College System that include persons whose assignments require the development of teaching materials (syllabi and visual aids) and the supervision of laboratories.
Technical/Paraprofessional/Skilled Craft – a personnel category defined by the Florida College System that includes persons whose assignments require special manual or technical skills and a thorough knowledge of the processes involved in specific trades. Such positions as computer operator, graphic artist, electricians, carpenters, and typesetters are included here.
RESIDENT COUNTY – a self-reported county classification completed by students when submitting Valencia’s application. Students with Florida mailing address can choose from the drop-down menu of Florida counties; students with non-Florida mailing addresses should select “Out of State” under county.
For internal reporting purposes, Valencia generally provides Service District (Orange & Osceola counties), Seminole county, and Other data. (Other category includes Other In-state counties, Out of State, or Not Available data.)
SUPPLEMENTAL LEARNING – classes that are supported by small group study sessions lead by Supplemental Learning Leaders (former students). These study sessions are regularly scheduled, casual sessions, in which students in the class compare notes, discuss assignments, and develop organizational tools and study skills.
TERM - the academic period for which classes meet. Fall, Spring, and Summer Full terms are approximately 14 weeks each; through Flex Start scheduling, courses are also taught in five, six, eight, and ten week time periods.
Fall Term – August to December.
Spring Term – January to May.
Summer Term – May to August.
Flex Start – Flex Start courses shorten the number of weeks a student spends in class (from 14 to 10 weeks or less), but not the number of hours.
VOCATIONAL CREDIT – a type of credit assigned to courses or course equivalent learning that is part of an organized and specified vocational degree or certificate program.
YEAR
Academic Year – the sequence of three terms—Fall, Spring, and Summer.
Calendar Year – January through December.
Financial Aid Year – October 1 through September 30 (Federal Fiscal Year).
Fiscal Year – July 1 through June 30.
Foundation Year – April 1 through March 31.
Reporting Year – the sequence of three terms—Summer, Fall, and Spring. State of Florida reporting falls in this category.