statistical design and analysis ii - bebac.at · mean either) of cvs in the parametric model of...
TRANSCRIPT

Bioequivalence and Bioavailability, PreBioequivalence and Bioavailability, Pre --conference workshop conference workshop | Budapest, 11 May 2009| Budapest, 11 May 2009 1 • 59
6/7 | 6/7 | Statistical DesignStatistical Design and Analysis Iand Analysis I II
informainformalife scienceslife sciences
Statistical DesignStatistical Designand Analysis IIand Analysis II
Helmut SchützBEBAC
Consultancy Services forBioequivalence and Bioavailability Studies
1070 Vienna, [email protected]

Bioequivalence and Bioavailability, PreBioequivalence and Bioavailability, Pre --conference workshop conference workshop | Budapest, 11 May 2009| Budapest, 11 May 2009 2 • 59
6/7 | 6/7 | Statistical DesignStatistical Design and Analysis Iand Analysis I II
informainformalife scienceslife sciences
Sample Size EstimationSample Size Estimation�Minimum Sample Size
�12 – WHO, EU, CAN, NZ, AUS, Malaysia, Argentina, ASEAN States, South Africa (20 for MR)
�24 – Saudia Arabia (12 – 24 if statistically justifiable)
�24 – Brazil

Bioequivalence and Bioavailability, PreBioequivalence and Bioavailability, Pre --conference workshop conference workshop | Budapest, 11 May 2009| Budapest, 11 May 2009 3 • 59
6/7 | 6/7 | Statistical DesignStatistical Design and Analysis Iand Analysis I II
informainformalife scienceslife sciences
Sample Size EstimationSample Size Estimation�Rationale for Pilot Studies (FDA/CDER, BA/BE Studies – General Considerations, 2003)�Validation of analytical methodology
�Assessment of variability
�Optimization of sample collection time intervals
�A pilot study that documents BE can be appropri-ate, provided its design and execution are suitable and a sufficient number of subjects (e.g., 12) have completed the study.

Bioequivalence and Bioavailability, PreBioequivalence and Bioavailability, Pre --conference workshop conference workshop | Budapest, 11 May 2009| Budapest, 11 May 2009 4 • 59
6/7 | 6/7 | Statistical DesignStatistical Design and Analysis Iand Analysis I II
informainformalife scienceslife sciences
Sample Size EstimationSample Size Estimation�Maximum Sample Size
�New Zealand‘If the calculated number of subjects appears to be higherthan is ethically justifiable, it may be necessary to accept a statistical power which is less than desirable. Normally it isnot practical to use more than about 40 subjects in a bioavailability study.’
�All othersNot specified in Guidelines (judged by IEC/IRB or local Authorities);ICH E9 (Section 3.5) applies: ‘The number of subjects ina clinical trial should always be large enough to provide a reliable answer to the questions addressed.’
Bioequivalence and Bioavailability, PreBioequivalence and Bioavailability, Pre --conference workshop conference workshop | Budapest, 11 May 2009| Budapest, 11 May 2009 5 • 59
6/7 | 6/7 | Statistical DesignStatistical Design and Analysis Iand Analysis I II
informainformalife scienceslife sciences
Sample Size EstimationSample Size Estimation�EU NfG on the Investigation of BA/BE (2001)
�The number of subjects required is determined by� the error variance associated with the primary
characteristic to be studied as estimated from�a pilot experiment,�previous studies, or�published data,
� the significance level desired,� the expected deviation (∆) from the reference product
compatible with BE and,� the required power.

Bioequivalence and Bioavailability, PreBioequivalence and Bioavailability, Pre --conference workshop conference workshop | Budapest, 11 May 2009| Budapest, 11 May 2009 6 • 59
6/7 | 6/7 | Statistical DesignStatistical Design and Analysis Iand Analysis I II
informainformalife scienceslife sciences
Sample Size EstimationSample Size Estimation�NfG on the Investigation of BA/BE
�Problems/solutions
�… the error variance associated with the primary characteristic to be studied …
� Since BE must be shown both for AUC and Cmax, and,� if you plan your sample size only for the ‘primary charac-
teristic’ (e.g., AUC), in many cases you will fail for the secondary parameter (e.g., Cmax), which most likely shows higher variability – your study will be ‘underpowered’.
� Based on the assumption, that CV is identical for test and reference (what if only the reference formulation has high variability, e.g., some formulations of PPIs?).

Bioequivalence and Bioavailability, PreBioequivalence and Bioavailability, Pre --conference workshop conference workshop | Budapest, 11 May 2009| Budapest, 11 May 2009 7 • 59
6/7 | 6/7 | Statistical DesignStatistical Design and Analysis Iand Analysis I II
informainformalife scienceslife sciences
Sample Size EstimationSample Size Estimation�NfG on the Investigation of BA/BE
�Problems/solutions� … as estimated from
�a pilot experiment,�previous studies, or�published data,
� The correct order should read:1. previous studies → 2. pilot study → 3. published data
� Only in the first case you ‘know’ all constraints resultingin variability
� Pilot studies are often too small to get reliable estimatesof variability
� Advisable only if you have data from a couple of studies

Bioequivalence and Bioavailability, PreBioequivalence and Bioavailability, Pre --conference workshop conference workshop | Budapest, 11 May 2009| Budapest, 11 May 2009 8 • 59
6/7 | 6/7 | Statistical DesignStatistical Design and Analysis Iand Analysis I II
informainformalife scienceslife sciences
Sample Size EstimationSample Size Estimation�NfG on the Investigation of BA/BE
�Problems/solutions� … the significance level desired …
�Throughout the NfG the significance level(α, error type I: patient’s risk to be treated with a bioinequivalent drug) is fixed to 5% (correspondingto a 90% confidence interval)
�You may desire a higher significance level, but sucha procedure is not considered acceptable
� In special cases (e.g., dose proportionality testing),a correction for multiplicity may be necessary
� In some legislations (e.g., Brazil’s ANVISA), α must be tightened to 2.5% for NTIDs (95% confidence interval)

Bioequivalence and Bioavailability, PreBioequivalence and Bioavailability, Pre --conference workshop conference workshop | Budapest, 11 May 2009| Budapest, 11 May 2009 9 • 59
6/7 | 6/7 | Statistical DesignStatistical Design and Analysis Iand Analysis I II
informainformalife scienceslife sciences
Sample Size EstimationSample Size Estimation�NfG on the Investigation of BA/BE
�Problems/solutions� … the required power.
�Generally the power is set to at least 80 % (β, error type II: producers’s risk to get no approval for a bioequivalent drug; power = 1 – β).Remember: 1 out of 5 studies will fail just by chance!
� If you plan for power of less than 70 %, problems with the ethics committee are likely (ICH E9).
� If you plan for power of more than 90 % (especially with low variability drugs), problems with the regulator are possible (‘forced bioequivalence’).
�Add subjects (‘alternates’) according to the expected drop-out rate!

Bioequivalence and Bioavailability, PreBioequivalence and Bioavailability, Pre --conference workshop conference workshop | Budapest, 11 May 2009| Budapest, 11 May 2009 10 • 59
6/7 | 6/7 | Statistical DesignStatistical Design and Analysis Iand Analysis I II
informainformalife scienceslife sciences
Sample Size EstimationSample Size Estimation�NfG on the Investigation of BA/BE
�Problems/solutions� … the expected deviation (∆) from the reference …
�Reliable estimate only from a previous full-sized study� If you are using data from a pilot study, allow for a
safety margin� If no data are available, commonly a GMR (geometric
test/reference-ratio) of 0.95 (∆ = 5%) is used� If more than ∆ = 10% is expected, questions from the
ethics committee are likely�BE Draft (2008) batches must not differ more than 5%.
Bioequivalence and Bioavailability, PreBioequivalence and Bioavailability, Pre --conference workshop conference workshop | Budapest, 11 May 2009| Budapest, 11 May 2009 11 • 59
6/7 | 6/7 | Statistical DesignStatistical Design and Analysis Iand Analysis I II
informainformalife scienceslife sciences
Sample Size EstimationSample Size Estimation�Sample size planning (EMEA Draft BE Guideline, 2008)�The number of subjects to be included in the study
should be based on anappropriate
sample size calculation. Cookbook?

Bioequivalence and Bioavailability, PreBioequivalence and Bioavailability, Pre --conference workshop conference workshop | Budapest, 11 May 2009| Budapest, 11 May 2009 12 • 59
6/7 | 6/7 | Statistical DesignStatistical Design and Analysis Iand Analysis I II
informainformalife scienceslife sciences
Sample Size EstimationSample Size Estimation�Literature search for CV%
�Preferably other BE studies (the bigger, the better)
�PK interaction studies (Cave: mainly in steady state! Generally lower CV than after SD)
�Food studies�If CVintra is not given (quite often), a little algebra
helps. All you need is the 90% geometric confidence interval and the sample size.� Point estimate (PE) from the CI
lo hiPE CL CL= ⋅

Bioequivalence and Bioavailability, PreBioequivalence and Bioavailability, Pre --conference workshop conference workshop | Budapest, 11 May 2009| Budapest, 11 May 2009 13 • 59
6/7 | 6/7 | Statistical DesignStatistical Design and Analysis Iand Analysis I II
informainformalife scienceslife sciences
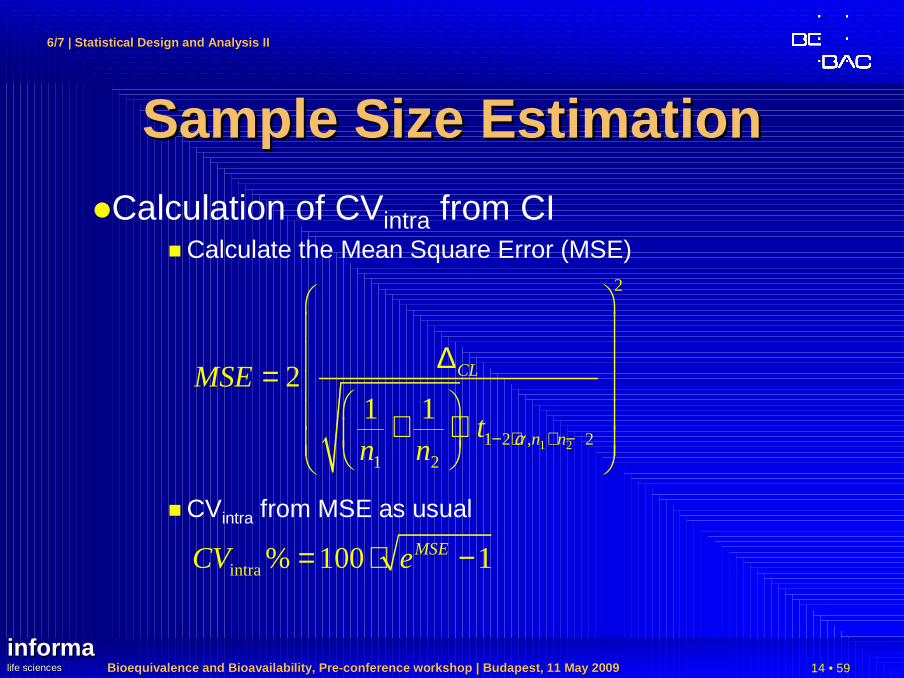
Sample Size EstimationSample Size Estimation�Calculation of CVintra from CI
� Estimate the number of subjects / sequence (example 2×2 cross-over)� If total sample size (N) is an even number, assume (!)
n1 = n2 = ½N� If N is an odd number, assume (!)
n1 = ½N + ½, n2 = ½N – ½ (not n1 = n2 = ½N!)� Difference between one CL and the PE in log-scale; use
the CL which is given with more significant digits
ln ln ln lnCL lo CL hiPE CL or CL PE∆ = − ∆ = −
Bioequivalence and Bioavailability, PreBioequivalence and Bioavailability, Pre --conference workshop conference workshop | Budapest, 11 May 2009| Budapest, 11 May 2009 14 • 59
6/7 | 6/7 | Statistical DesignStatistical Design and Analysis Iand Analysis I II
informainformalife scienceslife sciences
Sample Size EstimationSample Size Estimation�Calculation of CVintra from CI
� Calculate the Mean Square Error (MSE)
� CVintra from MSE as usual
1 2
2
1 2 , 21 2
21 1
CL
n n
MSE
tn n α− ⋅ + −
∆ = + ⋅
intra % 100 1MSECV e= ⋅ −
Bioequivalence and Bioavailability, PreBioequivalence and Bioavailability, Pre --conference workshop conference workshop | Budapest, 11 May 2009| Budapest, 11 May 2009 15 • 59
6/7 | 6/7 | Statistical DesignStatistical Design and Analysis Iand Analysis I II
informainformalife scienceslife sciences
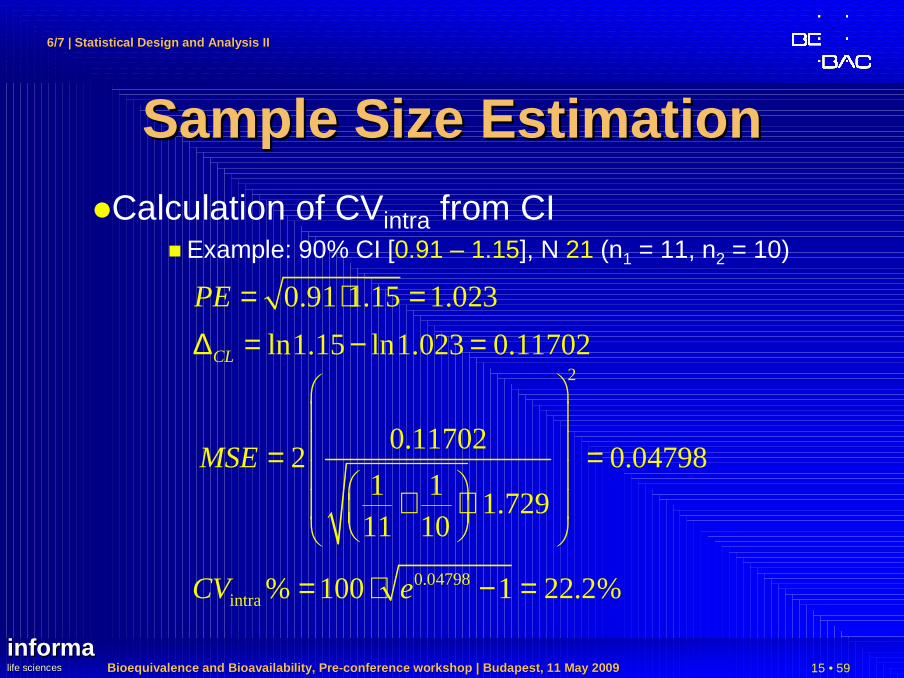
Sample Size EstimationSample Size Estimation�Calculation of CVintra from CI
� Example: 90% CI [0.91 – 1.15], N 21 (n1 = 11, n2 = 10)
0.91 1.15 1.023PE = ⋅ =ln1.15 ln1.023 0.11702CL∆ = − =
2
0.117022 0.04798
1 11.729
11 10
MSE
= = + ⋅
0.04798intra % 100 1 22.2%CV e= ⋅ − =

Bioequivalence and Bioavailability, PreBioequivalence and Bioavailability, Pre --conference workshop conference workshop | Budapest, 11 May 2009| Budapest, 11 May 2009 16 • 59
6/7 | 6/7 | Statistical DesignStatistical Design and Analysis Iand Analysis I II
informainformalife scienceslife sciences
Sample Size EstimationSample Size EstimationLiterature data…
Doxicycline (37 studies from Blume/Mutschler , Bioäquivalenz: Qualitätsbewertung wirkstoffgleicher Fertigarzneimittel, GOVI-Verlag, Frankfurt am Main/Eschborn, 1989-1996)
1015
2025
30
200 m g
100 m g
to ta l
0
2
4
6
8
10
12
freq
uenc
y
C V s
s tud ies

Bioequivalence and Bioavailability, PreBioequivalence and Bioavailability, Pre --conference workshop conference workshop | Budapest, 11 May 2009| Budapest, 11 May 2009 17 • 59
6/7 | 6/7 | Statistical DesignStatistical Design and Analysis Iand Analysis I II
informainformalife scienceslife sciences
Pooling of CV%Pooling of CV%�Intra-subject CV from different studies can be pooled�Do not use the arithmetic mean (or the geometric
mean either) of CVs
�In the parametric model of log-transformed data, additivity of variances (not of CVs!) apply
�Before pooling variances must be weighted acccording to the sample size
�Calculate the variance from CV2 2
intraln( 1)W CVσ = +
Bioequivalence and Bioavailability, PreBioequivalence and Bioavailability, Pre --conference workshop conference workshop | Budapest, 11 May 2009| Budapest, 11 May 2009 18 • 59
6/7 | 6/7 | Statistical DesignStatistical Design and Analysis Iand Analysis I II
informainformalife scienceslife sciences
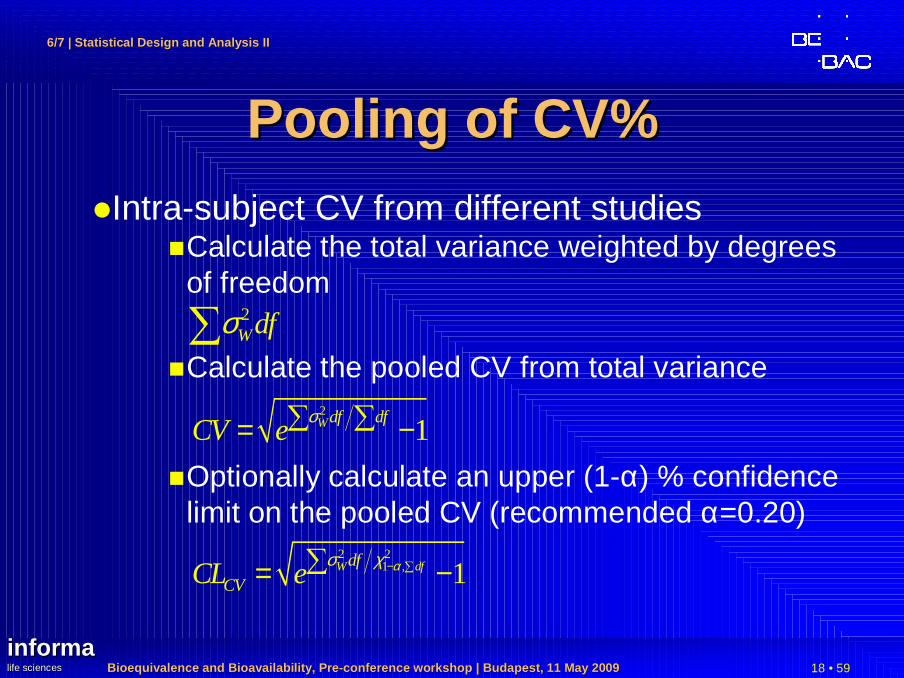
Pooling of CV%Pooling of CV%�Intra-subject CV from different studies
�Calculate the total variance weighted by degrees of freedom
�Calculate the pooled CV from total variance
�Optionally calculate an upper (1-α) % confidence limit on the pooled CV (recommended α=0.20)
2Wdfσ∑
2
1Wdf dfCV e
σ∑ ∑= −
2 21 , 1W dfdf
CVCL e ασ χ − ∑∑= −

Bioequivalence and Bioavailability, PreBioequivalence and Bioavailability, Pre --conference workshop conference workshop | Budapest, 11 May 2009| Budapest, 11 May 2009 19 • 59
6/7 | 6/7 | Statistical DesignStatistical Design and Analysis Iand Analysis I II
informainformalife scienceslife sciences
Pooling of CV%Pooling of CV%�Example 1: n1=n2;
CVStudy1 < CVStudy2
studies N df (total) α 1-α total CVpooled CVmean
2 24 20 0.2 0.8 1.2540 0.254 0.245χ²(1-α,df) 14.578 0.300 +17.8%
CVintra n seq. df (mj) σW σ²W σ²W × dfCVintra /
pooled >CLupper
0.200 12 2 10 0.198 0.0392 0.3922 78.6% no0.300 12 2 10 0.294 0.0862 0.8618 117.9% yes

Bioequivalence and Bioavailability, PreBioequivalence and Bioavailability, Pre --conference workshop conference workshop | Budapest, 11 May 2009| Budapest, 11 May 2009 20 • 59
6/7 | 6/7 | Statistical DesignStatistical Design and Analysis Iand Analysis I II
informainformalife scienceslife sciences
Pooling of CV%Pooling of CV%�Example 2: n1<n2;
CVStudy1 < CVStudy2
studies N df (total) α 1-α total CVpooled CVmean
2 36 32 0.2 0.8 2.2881 0.272 0.245χ²(1-α,df) 25.148 0.309 +13.4%
CVintra n seq. df (mj) σW σ²W σ²W × dfCVintra /
pooled >CLupper
0.200 12 2 10 0.198 0.0392 0.3922 73.5% no0.300 24 2 22 0.294 0.0862 1.8959 110.2% no

Bioequivalence and Bioavailability, PreBioequivalence and Bioavailability, Pre --conference workshop conference workshop | Budapest, 11 May 2009| Budapest, 11 May 2009 21 • 59
6/7 | 6/7 | Statistical DesignStatistical Design and Analysis Iand Analysis I II
informainformalife scienceslife sciences
Pooling of CV%Pooling of CV%�Example 3: n1>n2;
CVStudy1 < CVStudy2
studies N df (total) α 1-α total CVpooled CVmean
2 36 32 0.2 0.8 1.7246 0.235 0.245χ²(1-α,df) 25.148 0.266 +13.2%
CVintra n seq. df (mj) σW σ²W σ²W × dfCVintra /
pooled >CLupper
0.200 24 2 22 0.198 0.0392 0.8629 85.0% no0.300 12 2 10 0.294 0.0862 0.8618 127.5% yes

Bioequivalence and Bioavailability, PreBioequivalence and Bioavailability, Pre --conference workshop conference workshop | Budapest, 11 May 2009| Budapest, 11 May 2009 22 • 59
6/7 | 6/7 | Statistical DesignStatistical Design and Analysis Iand Analysis I II
informainformalife scienceslife sciences
Sample Size EstimationSample Size EstimationPower to show
BE with 12 – 36 subjects forCVintra = 20%
n 24 → 16:power 0.896→ 0.735
µT/µR 1.05 → 1.10:power 0.903→ 0.700
2×2 Cross-over
µT/µR
Pow
er20% CV
0.8 0.85 0.9 0.95 1 1.05 1.1 1.15 1.2 1.25
0
0.1
0.2
0.3
0.4
0.5
0.6
0.7
0.8
0.9
1
12
16
2436

Bioequivalence and Bioavailability, PreBioequivalence and Bioavailability, Pre --conference workshop conference workshop | Budapest, 11 May 2009| Budapest, 11 May 2009 23 • 59
6/7 | 6/7 | Statistical DesignStatistical Design and Analysis Iand Analysis I II
informainformalife scienceslife sciences
Sample Size: Sample Size: Sensitivity AnalysisSensitivity Analysis
�ICH E9�Section 3.5 Sample Size, paragraph 3
� The method by which the sample size is calculated should be given in the protocol […]. The basis of these estimates should also be given.
� It is important to investigate the sensitivity of the sample size estimate to a variety of deviations from these assumptions and this may be facilitated by providing a range of sample sizes appropriate for a reasonable range of deviations from assumptions.
� In confirmatory trials, assumptions should normally be based on published data or on the results of earlier trials.
Bioequivalence and Bioavailability, PreBioequivalence and Bioavailability, Pre --conference workshop conference workshop | Budapest, 11 May 2009| Budapest, 11 May 2009 24 • 59
6/7 | 6/7 | Statistical DesignStatistical Design and Analysis Iand Analysis I II
informainformalife scienceslife sciences
Sample Size: Sample Size: Pilot StudiesPilot Studies
�Pilot Studies�Small pilot studies (sample size <12)
� are useful in checking the sampling schedule and� the appropriateness of the analytical method, but� are not suitable for the purpose of sample size
planning.

Bioequivalence and Bioavailability, PreBioequivalence and Bioavailability, Pre --conference workshop conference workshop | Budapest, 11 May 2009| Budapest, 11 May 2009 25 • 59
6/7 | 6/7 | Statistical DesignStatistical Design and Analysis Iand Analysis I II
informainformalife scienceslife sciences
Sample Size: Sample Size: Pilot StudiesPilot Studies
�Pilot Studies (cont’d)�Moderate sized pilot studies (sample size ~12–24)
lead to more consistent results(both CVintra and PE).
� If you stated a procedure in your protocol, even BE may be claimed in the pilot study, and no further study will be necessary.
� You may also use an upper confidence limit of CVintra in sample size estimation.
� If you have some previous hints of high intra-subject variability (>30%), a pilot study size of at least 24 subjects is reasonable.A Sequential Design may also avoid an unnecessary large pivotal study.

Bioequivalence and Bioavailability, PreBioequivalence and Bioavailability, Pre --conference workshop conference workshop | Budapest, 11 May 2009| Budapest, 11 May 2009 26 • 59
6/7 | 6/7 | Statistical DesignStatistical Design and Analysis Iand Analysis I II
informainformalife scienceslife sciences
TwoTwo --Stage DesignStage Design�EMEA Draft BE Guideline(2008)
�Section 4.1.8� Initial group of subjects treated and data analysed.� If BE not been demonstrated an additional group
can be recruited and the results from both groups combined in a final analysis.
�Appropriate steps to preserve the overall type I error (patient’s risk).
�First stage data should be treated as an interim analysis.
‘Internal Pilot Study Design’

Bioequivalence and Bioavailability, PreBioequivalence and Bioavailability, Pre --conference workshop conference workshop | Budapest, 11 May 2009| Budapest, 11 May 2009 27 • 59
6/7 | 6/7 | Statistical DesignStatistical Design and Analysis Iand Analysis I II
informainformalife scienceslife sciences
TwoTwo --Stage DesignStage Design�EMEA Draft BE Guideline (2008)
�Section 4.1.8 (cont’d)�Both analyses conducted at adjusted significance
levels (with the confidence intervals accordingly using an adjusted coverage probability which willbe higher than 90%).
�Plan to use a two-stage approach must be pre-specified in the protocol along with the adjusted significance levels to be used for each of the analyses.

Bioequivalence and Bioavailability, PreBioequivalence and Bioavailability, Pre --conference workshop conference workshop | Budapest, 11 May 2009| Budapest, 11 May 2009 28 • 59
6/7 | 6/7 | Statistical DesignStatistical Design and Analysis Iand Analysis I II
informainformalife scienceslife sciences
TwoTwo --Stage DesignStage Design�Critical Remarks
�‘BE not been demonstrated’ in initial group:If test at α≤0.05, patient’s risk already ‘spent’!
�‘Adjusted significance levels’:Bonferroni not validated in BE setting; patient’s risk may be inflated (>0.05)!
Potvin D, Diliberti CE, Hauck WW, Parr AF, Schuirman n DJ, and RA SmithSequential design approaches for bioequivalence studies with crossover designsPharmaceut Statist (2007), DOI: 10.1002/pst.294http://www3.interscience.wiley.com/cgi-bin/abstract/115805765/ABSTRACT
likely to be implemented by
US-FDA and Canada’s HPB

Bioequivalence and Bioavailability, PreBioequivalence and Bioavailability, Pre --conference workshop conference workshop | Budapest, 11 May 2009| Budapest, 11 May 2009 29 • 59
6/7 | 6/7 | Statistical DesignStatistical Design and Analysis Iand Analysis I II
informainformalife scienceslife sciences
Sequential DesignSequential DesignMethod ‘C’ Evaluate power at Stage 1
using α-level of 0.050
If power ≥80%, evaluate BE at Stage 1 (α = 0.050) and stop
Pass or fail
If power <80%, evaluateBE at Stage 1 (α = 0.0294)
IF BE met, stop
Pass
If BE not met, calculate samplesize based on Stage 1 and α =0.0294, continue to Stage 2
Evaluate BE at Stage 2 usingdata from both Stages(α = 0.0294) and stop
Pass or fail
Evaluate power at Stage 1 using α-level of 0.050
If power ≥80%, evaluate BE at Stage 1 (α = 0.050) and stop
Pass or fail
If power <80%, evaluateBE at Stage 1 (α = 0.0294)
IF BE met, stop
Pass
If BE not met, calculate samplesize based on Stage 1 and α =0.0294, continue to Stage 2
Evaluate BE at Stage 2 usingdata from both Stages(α = 0.0294) and stop
Pass or fail

Bioequivalence and Bioavailability, PreBioequivalence and Bioavailability, Pre --conference workshop conference workshop | Budapest, 11 May 2009| Budapest, 11 May 2009 30 • 59
6/7 | 6/7 | Statistical DesignStatistical Design and Analysis Iand Analysis I II
informainformalife scienceslife sciences
OutliersOutliers�Problems
�Parametric methods (ANOVA, GLM) are very sensitive to outliers�A single outlier may underpower
a properly sized study!�Exclusion of outliers only possible if procedure stated
in the protocol, and reason is justified, e.g.,�Lacking compliance (subject did not take the
medication),�Vomiting (up to 2 × tmax for IR, at all times for MR),�Analytical problems (e.g., interferences in chromato-
graphy);�Not acceptable if only based on statistical grounds.

Bioequivalence and Bioavailability, PreBioequivalence and Bioavailability, Pre --conference workshop conference workshop | Budapest, 11 May 2009| Budapest, 11 May 2009 31 • 59
6/7 | 6/7 | Statistical DesignStatistical Design and Analysis Iand Analysis I II
informainformalife scienceslife sciences
OutliersOutliers�Types
I. Concordant outlierThe PK response for both test and reference deviates from the majority of the study sample.
� Poor metabolizers may lead to high concentrationsin 5–10% of subjects.
� Does not effect the BE-assessment, but should be discussed (polymorphism known?)
II. Discordant outlierThe PK response of either test or reference deviates form the majority of the study sample.

Bioequivalence and Bioavailability, PreBioequivalence and Bioavailability, Pre --conference workshop conference workshop | Budapest, 11 May 2009| Budapest, 11 May 2009 32 • 59
6/7 | 6/7 | Statistical DesignStatistical Design and Analysis Iand Analysis I II
informainformalife scienceslife sciences
OutliersOutliers
PK response (AUC)
0
1000
2000
3000
0 1000 2000 3000reference
test
sequence 1sequence 2identitytest/reference
PK response (AUC)
0
1000
2000
3000
0 1000 2000 3000reference
test
sequence 1sequence 2identitytest/reference
concordant outlier
PK response (AUC)
0
1000
2000
3000
0 1000 2000 3000reference
test
sequence 1sequence 2identitytest/reference
discordant outlier

Bioequivalence and Bioavailability, PreBioequivalence and Bioavailability, Pre --conference workshop conference workshop | Budapest, 11 May 2009| Budapest, 11 May 2009 33 • 59
6/7 | 6/7 | Statistical DesignStatistical Design and Analysis Iand Analysis I II
informainformalife scienceslife sciences
OutliersOutliers
intra-subject residuals
-3.0
-2.0
-1.0
0.0
1.0
2.0
3.0
7.0 7.25 7.5 7.75ln (predicted value)
stud
entiz
ed r
esid
ual
sequence 1sequence 2±2σLund’s p 0.05
intra-subject residuals
-3.0
-2.0
-1.0
0.0
1.0
2.0
3.0
5.25 5.5 5.75 6.0 6.25 6.5 6.75 7.0 7.25 7.5 7.75ln (predicted value)
stud
entiz
ed r
esid
ual
sequence 1sequence 2±2σLund’s p 0.05
intra-subject residuals
-9.0
-6.0
-3.0
0.0
3.0
6.0
9.0
5.25 5.5 5.75 6.0 6.25 6.5 6.75 7.0 7.25 7.5 7.75ln (predicted value)
stud
entiz
ed r
esid
ual
sequence 1sequence 2±2σLund’s p 0.05

Bioequivalence and Bioavailability, PreBioequivalence and Bioavailability, Pre --conference workshop conference workshop | Budapest, 11 May 2009| Budapest, 11 May 2009 34 • 59
6/7 | 6/7 | Statistical DesignStatistical Design and Analysis Iand Analysis I II
informainformalife scienceslife sciences
OutliersOutliers
intra-subject residuals
-3.0
-2.0
-1.0
0.0
1.0
2.0
3.0
-3.0 -2.0 -1.0 0.0 1.0 2.0 3.0normal score
stud
entiz
ed r
esid
ual
sequence 1sequence 2
intra-subject residuals
-3.0
-2.0
-1.0
0.0
1.0
2.0
3.0
-3.0 -2.0 -1.0 0.0 1.0 2.0 3.0normal score
stud
entiz
ed r
esid
ual
sequence 1sequence 2
intra-subject residuals
-9.0
-6.0
-3.0
0.0
3.0
6.0
9.0
-3.0 -2.0 -1.0 0.0 1.0 2.0 3.0normal score
stud
entiz
ed r
esid
ual
sequence 1sequence 2
Bioequivalence and Bioavailability, PreBioequivalence and Bioavailability, Pre --conference workshop conference workshop | Budapest, 11 May 2009| Budapest, 11 May 2009 35 • 59
6/7 | 6/7 | Statistical DesignStatistical Design and Analysis Iand Analysis I II
informainformalife scienceslife sciences
OutliersOutliers�Strategies / Solutions
�Be prepared to face the unexpected!
�Examples of drugs/formulations with documented product failures:�Drugs sensitive to low pH (gastric resistance!),�Monolithic MR products,�…
�Include available information (PK, literature, former studies) in the protocol.
�Develop a statistical contingency plan.
Bioequivalence and Bioavailability, PreBioequivalence and Bioavailability, Pre --conference workshop conference workshop | Budapest, 11 May 2009| Budapest, 11 May 2009 36 • 59
6/7 | 6/7 | Statistical DesignStatistical Design and Analysis Iand Analysis I II
informainformalife scienceslife sciences
OutliersOutliers�Solution I
�Since assumptions of the parametric statistical model are violated, you may apply a statistical method which does not rely on those!
�Drawback: Lacking regulatory acceptance of nonparametric methods in many countries…☺ WHO (Technical Report Series No. 937, Annex 9,
Section 6.8, May 2006)☺ Japan NIHS (Bioequivalence Studies for Generic
Products, Q&A Document, November 2006)� All other regulatory agencies

Bioequivalence and Bioavailability, PreBioequivalence and Bioavailability, Pre --conference workshop conference workshop | Budapest, 11 May 2009| Budapest, 11 May 2009 37 • 59
6/7 | 6/7 | Statistical DesignStatistical Design and Analysis Iand Analysis I II
informainformalife scienceslife sciences
Practically impossible!
OutliersOutliers�Solution II
�Stay with the parametric method, but � evaluate both the full data set and the reduced data set
(outliers excluded) and discuss influence on the outcome of the study.
�In accordance with EMEA’s Q&A #3:� Exceptional reasons may justify post-hoc data exclusion
[…]. In such a case, the applicant must demonstrate that the condition stated to cause the deviation is present in the outlier(s) only and absence of this condition has been investigated using the same criteria for all other subjects.
� Results of statistical analyses with and without the group of excluded subjects should be provided.

Bioequivalence and Bioavailability, PreBioequivalence and Bioavailability, Pre --conference workshop conference workshop | Budapest, 11 May 2009| Budapest, 11 May 2009 38 • 59
6/7 | 6/7 | Statistical DesignStatistical Design and Analysis Iand Analysis I II
informainformalife scienceslife sciences
ReRe--testing of subjectstesting of subjects�If you suspect a product failure of thereference formulation, you may considerre-testing�The outlying subject should be re-tested
�with both the test and reference.� Include ≥5 subjects, who showed ‘normal’
responses in the main study (i.e., size of re-tested group ≥6 or 20% of subjects, whichever is larger).

Bioequivalence and Bioavailability, PreBioequivalence and Bioavailability, Pre --conference workshop conference workshop | Budapest, 11 May 2009| Budapest, 11 May 2009 39 • 59
6/7 | 6/7 | Statistical DesignStatistical Design and Analysis Iand Analysis I II
informainformalife scienceslife sciences
ReRe--testing of subjectstesting of subjects�Evaluation
�Expect questions anyway!�Procedure sometimes suggested by the FDA:
� If the subject shows a ‘normal’ response in re-testing, the original value may be exluded from the main study.
�Substitution of original values with results from there-test study not allowed
�No pooling of data
�Not covered in any guideline�Suggested by EGA (and many others) in comments
to the drafted EU BE-guideline

Bioequivalence and Bioavailability, PreBioequivalence and Bioavailability, Pre --conference workshop conference workshop | Budapest, 11 May 2009| Budapest, 11 May 2009 40 • 59
6/7 | 6/7 | Statistical DesignStatistical Design and Analysis Iand Analysis I II
informainformalife scienceslife sciences
Nuisance: Nuisance: period effectperiod effect
AU
C (
ng x
hr
/ m
l)
Subject plots ordered by period within treatment se quence
1020
3040
5060
70
Period 1 Period 2 Period 1 Period 2
1
1
2
2
3
3
7
78
89
9
13
13
14
1415
15
19
19
20
20
21
214
4
5
5
6
6
1010
11
11
12 12
16
16
17
17
18
18
22
22
23
23
24
24
Sequence 1 Sequence 2
AU
C (
ng x
hr
/ m
l)
Subject plots ordered by period within treatment se quence
1020
3040
5060
7080
Period 1 Period 2 Period 1 Period 2
1
1
2
2
3
3
77
8
8
9
9
13 13
14 14
15
15
19
19
20
20
2121
4
4
55
6
6
10
10
11
1112
12
16
16
1717
1818
2222
23
23
24
24
Sequence 1 Sequence 2

Bioequivalence and Bioavailability, PreBioequivalence and Bioavailability, Pre --conference workshop conference workshop | Budapest, 11 May 2009| Budapest, 11 May 2009 41 • 59
6/7 | 6/7 | Statistical DesignStatistical Design and Analysis Iand Analysis I II
informainformalife scienceslife sciences
Nuisance: Nuisance: period effectperiod effect
AU
C (
ng x
hr
/ m
l)
Geometric mean and individual responses by period
1020
3040
5060
70
Period 1 Period 2
TestReference
AU
C (
ng x
hr
/ m
l)
Geometric mean and individual responses by period
1020
3040
5060
7080
Period 1 Period 2
TestReference

Bioequivalence and Bioavailability, PreBioequivalence and Bioavailability, Pre --conference workshop conference workshop | Budapest, 11 May 2009| Budapest, 11 May 2009 42 • 59
6/7 | 6/7 | Statistical DesignStatistical Design and Analysis Iand Analysis I II
informainformalife scienceslife sciences
Nuisance: Nuisance: period effectperiod effect
�Original data�AUC(p2/p1): 98.4%
�Period: p 0.7856 (95% CI: 87.4% –110.8%)
�Sequence: p 0.3239 (95% CI: 86.0% –154.8%)
�GMR: 96.5% (90% CI: 87.5% –106.5%)
�Modified data (p2 125% of original values)�AUC(p2/p1): 123.0%�Period: p 0.0015 (95% CI: 109.3% –138.5%)
�Sequence: p 0.3239 (95% CI: 86.0% –154.8%)
�GMR: 96.5% (90% CI: 87.5% –106.5%)

Bioequivalence and Bioavailability, PreBioequivalence and Bioavailability, Pre --conference workshop conference workshop | Budapest, 11 May 2009| Budapest, 11 May 2009 43 • 59
6/7 | 6/7 | Statistical DesignStatistical Design and Analysis Iand Analysis I II
informainformalife scienceslife sciences
Nuisance: Nuisance: period effectperiod effect
Rat
io:
Tes
t /
Ref
eren
ce A
UC
Treatment effect, Test versus Reference
0.6
0.8
11.
21.
41.
61.
8
(0.875)
(0.965)
(1.065)
(0.635)
(0.837)
(1.102)
(0.868)
(1.114)
(1.429)
AllData
Period 1Data only
Period 2Data only
Seq 1Seq 2
Rat
io:
Tes
t /
Ref
eren
ce A
UC
Treatment effect, Test versus Reference
0.5
11.
52
2.5
(0.875)
(0.965)
(1.065)
(0.635)
(0.837)
(1.102)
(0.869)
(1.114)
(1.429)
AllData
Period 1Data only
Period 2Data only
Seq 1Seq 2

Bioequivalence and Bioavailability, PreBioequivalence and Bioavailability, Pre --conference workshop conference workshop | Budapest, 11 May 2009| Budapest, 11 May 2009 44 • 59
6/7 | 6/7 | Statistical DesignStatistical Design and Analysis Iand Analysis I II
informainformalife scienceslife sciences
Nuisance: Nuisance: sequence effectsequence effect
�In a ‘standard’ 2×2 cross-over design�the sequence effect is confounded with
� the carry-over effect, and� the formulation-by-period interaction.
�Therefore, a statistically significant sequence effect could indicate that there is
� a true sequence effect,� a true carryover effect,� a true formulation by period interaction, or � a failure of randomization.

Bioequivalence and Bioavailability, PreBioequivalence and Bioavailability, Pre --conference workshop conference workshop | Budapest, 11 May 2009| Budapest, 11 May 2009 45 • 59
6/7 | 6/7 | Statistical DesignStatistical Design and Analysis Iand Analysis I II
informainformalife scienceslife sciences
Nuisance: Nuisance: sequence effectsequence effect
�‘Two-stage analysis’1) was – and regrettably still is – often applied.�Test for a significant sequence effect at α 0.10�If a significant sequence effect is found, evaluation
of the first period as a parallel design
�This procedure was shown to be statistically flawed.2)
1) JE GrizzleThe two-period change over design and ist use in clinical trialsBiometrics 21: 467-480 (1965)
2) P FreemanThe performance of the two-stage analysis of two-treatment, two-periodcross-over trialsStatistics in Medicine 8: 1421-1432 (1989)

Bioequivalence and Bioavailability, PreBioequivalence and Bioavailability, Pre --conference workshop conference workshop | Budapest, 11 May 2009| Budapest, 11 May 2009 46 • 59
6/7 | 6/7 | Statistical DesignStatistical Design and Analysis Iand Analysis I II
informainformalife scienceslife sciences
Nuisance: Nuisance: sequence effectsequence effect
�In a large metastudy (n=420) significant sequence effects were found at ≈ α, both for AUC and Cmax.*)
�2×2 studies (n=324)AUC: 34/324 (10.5%) Cmax: 37/324 (11.4%)
�6×3 studies (n=96)AUC: 4/96 ( 4.2%) Cmax: 4/96 ( 4.2%)
�For both metrics the distribution of p values followed closely Uniform [0,1]
*) D’Angelo G, Potvin D and J TurgeonCarry-over effects in bioequivalence studiesJ Biopharm Stat 11: 35-43 (2001)

Bioequivalence and Bioavailability, PreBioequivalence and Bioavailability, Pre --conference workshop conference workshop | Budapest, 11 May 2009| Budapest, 11 May 2009 47 • 59
6/7 | 6/7 | Statistical DesignStatistical Design and Analysis Iand Analysis I II
informainformalife scienceslife sciences
Nuisance: Nuisance: sequence effectsequence effect
� These results could be con-firmed (20 published studies, 143 studies from BEBAC’sdatabase; AUC):
� Significant sequence effects in 22/163 studies (13.5%)
� Significant sequence effects in properly planned studies should be considered a statis-tical artefact (significant results are obtained in α of studies)
AUC from cross-over studies:Uniform [0,1] quantiles
p-va
lues
for
car
ry-o
ver
effe
cts
0
0.2
0.4
0.6
0.8
1
0 0.2 0.4 0.6 0.8 1
line of identity
studies with significant p:22/163 (13.5%)

Bioequivalence and Bioavailability, PreBioequivalence and Bioavailability, Pre --conference workshop conference workshop | Budapest, 11 May 2009| Budapest, 11 May 2009 48 • 59
6/7 | 6/7 | Statistical DesignStatistical Design and Analysis Iand Analysis I II
informainformalife scienceslife sciences
Nuisance: Nuisance: sequence effectsequence effect
�Conclusions�No valid procedure exists to correct for a true
sequence/carry-over effect�A true sequence/carry-over is highly unlikely in a
BE study if� the study is performed in healthy subjects,� the drug is not an endogenous entity, and� an adequate washout period (no predose
concentrations) was maintained.
�Testing for a sequence effect is futile!

Bioequivalence and Bioavailability, PreBioequivalence and Bioavailability, Pre --conference workshop conference workshop | Budapest, 11 May 2009| Budapest, 11 May 2009 49 • 59
6/7 | 6/7 | Statistical DesignStatistical Design and Analysis Iand Analysis I II
informainformalife scienceslife sciences
Nuisance: Nuisance: sequence effectsequence effect
�Conclusions (cont’d)�EMEA Draft GL on BE (2008)
A test for carry-over should not be performed and no decisions regarding the analysis (e.g. analysis of the first period, only) should be made on the basis of such a test.The potential for carry-over can be directly addressed by examination of the pre-treatment plasma concentrations in period 2 (and beyond if applicable).

Bioequivalence and Bioavailability, PreBioequivalence and Bioavailability, Pre --conference workshop conference workshop | Budapest, 11 May 2009| Budapest, 11 May 2009 50 • 59
6/7 | 6/7 | Statistical DesignStatistical Design and Analysis Iand Analysis I II
informainformalife scienceslife sciences
Nuisance: Nuisance: sequence effectsequence effect
�Conclusions (cont’d)�EMEA Draft GL on BE (2008)
[…] tests for difference and the respective confidence intervals for the treatment effect, the period effect, and the sequence effect should be reported for descriptive assessment.�Tests for the treatment effect are meaningless in BE!�BE assessment is not influenced by the period effect.�Sequence effect again?!

Bioequivalence and Bioavailability, PreBioequivalence and Bioavailability, Pre --conference workshop conference workshop | Budapest, 11 May 2009| Budapest, 11 May 2009 51 • 59
6/7 | 6/7 | Statistical DesignStatistical Design and Analysis Iand Analysis I II
informainformalife scienceslife sciences
Nuisance: Nuisance: group effectgroup effect
�More than one group of subjects�‘If a crossover study is carried out in two or more
groups of subjects (e.g., if for logistical reasons only a limited number of subjects can be studied at one time), the statistical model should be modified to reflect the multigroup nature of the study. In particular, the model should reflect the fact that the periods for the first group are different from the periods for the second group.’
FDA, Center for Drug Evaluation and Research (CDER)Guidance for Industry: Statistical Approaches to Establishing Bioequivalence (2001)

Bioequivalence and Bioavailability, PreBioequivalence and Bioavailability, Pre --conference workshop conference workshop | Budapest, 11 May 2009| Budapest, 11 May 2009 52 • 59
6/7 | 6/7 | Statistical DesignStatistical Design and Analysis Iand Analysis I II
informainformalife scienceslife sciences
Nuisance: Nuisance: group effectgroup effect
�More than one group of subjects�Cases where ‘… the study is carried out in two or
more groups and those groups are studied at diffe-rent clinical sites, or at the same site but greatly separated in time (months apart, for example) […] should be discussed with the appropriate CDER review division.’
�EMEA BA/BE (2001), BE Draft (2008)�The study should be designed in such a way that the
formulation effect can be distinguished from other effects.

Bioequivalence and Bioavailability, PreBioequivalence and Bioavailability, Pre --conference workshop conference workshop | Budapest, 11 May 2009| Budapest, 11 May 2009 53 • 59
6/7 | 6/7 | Statistical DesignStatistical Design and Analysis Iand Analysis I II
informainformalife scienceslife sciences
Nuisance: Nuisance: group effectgroup effect
�Increasing number of referrals (deficiency letters) from�Canada
�Gulf States (Saudia Arabia, Emirates, Oman)
�Extended Statistical model (fixed effects in ANOVA)�Group�Group × Treatment Interaction
�If both terms are not significant (p>0.05), pooling of groups is justified.

Bioequivalence and Bioavailability, PreBioequivalence and Bioavailability, Pre --conference workshop conference workshop | Budapest, 11 May 2009| Budapest, 11 May 2009 54 • 59
6/7 | 6/7 | Statistical DesignStatistical Design and Analysis Iand Analysis I II
informainformalife scienceslife sciences
Nuisance: Nuisance: group effectgroup effect
�Recommendations�If possible, multiple groups should be avoided.�Keep the time interval between groups as short as
possible.�Do not split the study into equally sized groups.
� Perform at least one group in the maximum capacity of the clinical site(e.g., 24+8 instead of 16+16 for a total of 32).
� If a significant group and/or group × treatment interaction is found (preventing a pooled analysis),it may still be possible to demonstrate BE in the largest group only.

Bioequivalence and Bioavailability, PreBioequivalence and Bioavailability, Pre --conference workshop conference workshop | Budapest, 11 May 2009| Budapest, 11 May 2009 55 • 59
6/7 | 6/7 | Statistical DesignStatistical Design and Analysis Iand Analysis I II
informainformalife scienceslife sciences
Are we making progressAre we making progress ??�About 3 000 – 10 000 BE studies / year are conducted
worldwide; only ∼ 1 – 5% of them are published.�Although a standard for publishing data of BE studies
was already suggested in 1992,1)
� a review in 2002 found only 17 complete data sets on AUC and 12 on Cmax.2)
� Since no ‘real world’ data are available, proposed methods (e.g., reference-scaled ABE) rely entirely on simulations!
� Studies seen by regulators are ‘selection biased’.
1) Sauter R, Steinijans VW, Diletti E, Böhm E and H-U SchulzInt J Clin Pharm Ther Toxicol 30/Suppl.1, S7-S30 (1992)
2) Nakai K, Fujita M and M TomitaInt J Clin Pharmacol Ther 40, 431-438 (2002)

Bioequivalence and Bioavailability, PreBioequivalence and Bioavailability, Pre --conference workshop conference workshop | Budapest, 11 May 2009| Budapest, 11 May 2009 56 • 59
6/7 | 6/7 | Statistical DesignStatistical Design and Analysis Iand Analysis I II
informainformalife scienceslife sciences
Bell curve Bell curve (and beyond?)(and beyond?)
� Abraham de Moivre (1667-1754), Pierre-Simon Laplace (1749-1827)Central limit theorem 1733, 1812
� Carl F. Gauß (1777-1855)Normal distribution 1795
� William S. Gosset, aka Student (1876-1937)t-distribution 1908
� Frank Wilcoxon (1892-1965)Nonparametric tests 1945

Bioequivalence and Bioavailability, PreBioequivalence and Bioavailability, Pre --conference workshop conference workshop | Budapest, 11 May 2009| Budapest, 11 May 2009 57 • 59
6/7 | 6/7 | Statistical DesignStatistical Design and Analysis Iand Analysis I II
informainformalife scienceslife sciences
Thank You!Thank You!Statistical DesignStatistical Designand Analysis IIand Analysis II
Open Questions?Open Questions?(References in your handouts)(References in your handouts)
Helmut SchützBEBAC
Consultancy Services forBioequivalence and Bioavailability Studies
1070 Vienna, [email protected]

Bioequivalence and Bioavailability, PreBioequivalence and Bioavailability, Pre --conference workshop conference workshop | Budapest, 11 May 2009| Budapest, 11 May 2009 58 • 59
6/7 | 6/7 | Statistical DesignStatistical Design and Analysis Iand Analysis I II
informainformalife scienceslife sciences
ReferencesReferences�Collection of links to global documents
http://bebac.at/Guidelines.htm�ICH
� E3: Structure and Content of Clinical Study Reports (1995)
� E6: Good Clinical Practice (1996)� E8: General Considerations for Clinical Trials
(1997)� E9: Statistical Principles for Clinical Trials (1998)
�WHO� Guidelines for GCP for trials on pharmaceutical
products (WHO Technical Report Series No. 850, Annex 3, 1995)
� Handbook for GCP (2005)� WHO Expert Committee on Specifications for
Pharmaceutical Preparations, Fortieth Report (WHO Technical Report Series No. 937, Annex 9: Additional guidance for organizations perform-ing in vivo bioequivalence studies. 2006)
�US FDA� 21CFR320: BA and BE Requirements (Revision 2008)� Center for Drug Evaluation and Research (CDER)
CDER’s Manual of Policies and Procedures�Review of BE Study Protocols (2006)�Review of BE Studies with Clinical Endpoints in
ANDAs (2006)� Center for Drug Evaluation and Research (CDER)
�Statistical Approaches Establishing Bioequivalence (2001)
�Bioavailability and Bioequivalence Studies for Orally Administered Drug Products – General Considera-tions (Rev.1 2003)
�ANDA Checklist for Completeness and Acceptability (2006)
�Bioequivalence Recommendations for Specific Pro-ducts (2007)
�ANDA Checklist for Completeness and Accept-ability (2006)
�Submission of Summary BE Data for ANDAs (2009)

Bioequivalence and Bioavailability, PreBioequivalence and Bioavailability, Pre --conference workshop conference workshop | Budapest, 11 May 2009| Budapest, 11 May 2009 59 • 59
6/7 | 6/7 | Statistical DesignStatistical Design and Analysis Iand Analysis I II
informainformalife scienceslife sciences
ReferencesReferences�EudraLex – The Rules Governing Medicinal Products in the European Unionhttp://ec.europa.eu/enterprise/pharmaceuticals/eudralex/
�Directive 2001/20/EC: Implementation of GCP in the Conduct of Clinical Trials on Medicinal Products for Human Use (2001)
�EMEA GCP Inspector’s GroupProcedure for Conducting GCP Inspections requested by the EMEA
� Annex I: Investigator Site (2007)� Annex IV: Sponsor Site and/or Contract Research Organi-
sations (CRO) (2007)� Annex V: Bioanalytical part, Pharmacokinetic and Statisti-
cal analyses of Bioequivalence Trials (2008)�EMEA/CPMP/CHMP
� NfG on the Investigation of BA/BE (2001)� Points to Consider on Multiplicity Issues in Clinical Trials
(2002)� BA/BE for HVDs/HVDPs: Concept Paper (2006); removed
form EMEA’s website in Oct 2007. Available at http://bebac.at/downloads/14723106en.pdf
� Questions & Answers on the BA and BE Guideline (2006)� Draft Guideline on the Investigation of BE (2008)� Questions & Answers : Positions on specific questions
addressed to the EWP therapeutic subgroup on Pharma-cokinetics (2009)